Blog

  • Is There A Civilization War Going On?

    “Civilizations die from suicide, not by murder.” — Arnold J. Toynbee

    From the heart of Europe to North America, nativism, sometimes tinged by white nationalist extremism, is on the rise. In recent elections, parties identified, sometimes correctly, as alt-right have made serious gains in Germany, Austria and the Czech Republic, pushing even centrist parties in their direction. The election of Donald Trump can also be part of this movement.

    Why is this occurring? There are economic causes to be sure, but perhaps the best explanation is cultural, reflecting a sense, not totally incorrect, that western civilization is on the decline, a movement as much self-inflicted as put upon.

    French intellectuals first to see the trend

    In 1973 a cranky French intellectual, Jean Raspail, published a speculative novel, “The Camp of the Saints,” which depicted a Europe overrun by refugees from the developing world. In 2015 another cranky Frenchman, Michael Houellenbecq, wrote a bestseller, “Submission,” which predicted much the same thing, ending with the installation of an Islamist government in France.

    Both novels place the blame for the collapse of the Western liberal state not on the immigrants but on cultural, political and business leaders all too reluctant to stand up for their own civilization. This is reflected in such things as declining respect for free speech, the importance of citizenship, and even the weakening of the family, an institution now rejected as bad for the environment and even less enlightened than singlehood.

    Critically, the assault on traditional liberalism has come mostly not from the reactionary bestiary, but elements of the often-cossetted left. It is not rightist fascism that threatens most but its pre-condition, the systematic undermining of liberal society from within.

    Read the entire piece at The Orange County Register.

    Joel Kotkin is executive editor of NewGeography.com. He is the Roger Hobbs Distinguished Fellow in Urban Studies at Chapman University and executive director of the Houston-based Center for Opportunity Urbanism. His newest book is The Human City: Urbanism for the rest of us. He is also author of The New Class ConflictThe City: A Global History, and The Next Hundred Million: America in 2050. He lives in Orange County, CA.

    Photo: JÄNNICK Jérémy [CC BY 3.0], via Wikimedia Commons

  • Highest Cost Rental Markets: Even Worse for Buyers

    There is considerable concern about rising rents, especially in the most expensive US housing markets. Yet as tough as rising rents are, the high rent markets are also plagued by even higher house costs relative to the rest of the nation. As a result, progressing from renting to buying is all the more difficult in these areas.

    This is illustrated by American Community Survey data for the nation’s 53 major housing markets (metropolitan areas with more than 1,000,000 residents). The range in median contract rent between the major housing markets 3.1 times, with San Jose being the most expensive and Rochester the least. The range in median house values was more than double that, at 6.6 times, between highest cost San Jose and lowest cost Pittsburgh. Thus, house prices in the most expensive markets tend to be far higher in relation to rents than in the less expensive markets.

    The rising difference between house values and rents was noted last year in The House Prices are Too Damned High, which showed that from 1969 to 2015, the difference in the range between rentals and house values rose from 51 percentage points to 375 percentage points (Figure 1). It is no coincidence that 1969 was the last census data before far more strict land use regulations were implemented in some major housing markets.

    The House Value-to-Rent Ratio

    This is illustrated by the median house value-to-rent ratio, which is calculated by dividing the median house value by the median contract rent per year (monthly times 12). Overall in 2016, the median contract rent was $841 in the United States, while the median house value was $205,000. This calculates to a value-to-rent ratio of 20.3.

    Where Housing Aspiration is Most Challenging

    California, long home to house prices far above the rest of the nation dominates the list of housing markets in which it is hardest for buyers to move up to home ownership. The worst market is the San Francisco metropolitan area, where the median house value in 2016 was nearly 40 times the median annual rent (39.6) and nearly twice the national figure of 20.3. San Jose is the second worst market, with a value-to-rent ratio of 38.7. Los Angeles is third where the median house value is 36.9 times the median annual rent. There is a larger gap down to San Diego, ranked fourth worst, where there is a median value-to-rent ratio of 31.1. Sacramento is also in the least friendly five for renters aspiring to be buyers, with a value-to-rent ratio of 29.6. This may be a surprising finding and is discussed further below. California’s other major market, Riverside-San Bernardino does better, ranking 13th worst, with a value-to-rent ratio of 24.5.

    Even with New York’s notoriously high rents, it did not muscle out California in the worst five. New York’s s value-to-rent ratio was 29.5 The balance of the 10 markets in which moving from renting to buying is most difficult also includes #7 Boston (28.1), #8 Portland (27.9), #9 Providence (27.7) and #10 Seattle (27.2).

    Comparison with Demographia Housing Affordability Ratings

    The eleven housing markets with the highest value-to-rent ratios have ratings of “severely unaffordable” in the 13th Annual Demographia International Housing Affordability Survey. This is the least affordable rating (Figure 2) and indicates a median multiple of 5.1 or higher (median house price divided by median household income). The 12th highest value-to-rent ratio is in Salt Lake City, which is rated “seriously unaffordable,” the second most unaffordable category. Thirteenth ranked Riverside-San Bernardino was the only other severely unaffordable major U.S. housing market in the Demographia survey.

    Each of the severely unaffordable markets have land use restrictions that make it virtually impossible to build the low-cost suburban tract housing crucial to retaining housing affordability. In such markets, Buildzoon.coms’ economist Issi Romem has shown that house values have become detached from construction costs, largely the result of rising land prices (which are associated with stronger land use regulation, especially urban containment policy).

    The Surprising Case of Sacramento

    Sacramento’s high cost housing may come as a surprise. Sacramento has often “slipped under the radar” as a severely unaffordable market, yet was so from 2004 through 2008.Sacramento had reached a median multiple of 6.8 in 2005 before the housing bust and was less affordable than Vancouver, the third least affordable housing market out of nine nations rated in 2016 by Demographia. Sacramento again became severely unaffordable in last year’s Demographia survey reaching a median multiple of 5.1. But there is reason for concern in Sacramento, which has seen its median multiple rise from 2.9 to 5.1 in just four years. Any continuation of such this trend could result in a material deterioration of Sacramento’s value-to-rent ratio, made all the more likely by California’s overly restricted housing and land use regulations.

    The Value-to-Rent Ratio and Inequality

    Rising inequality is a widespread concern. Yet, as researchers have shown, much of the expanding inequality is centered in the value of owned housing, which has been associated with more restrictive land and housing regulation. In the United States, the price is being paid for by younger households, who are faced with greater student loan debts and a less lucrative economy. It is also paid for by ethnic minority households, whose more limited incomes are making the jump to home ownership even more difficult (See: Progressive Cities: Home of the Worst Housing Inequality).

    Median House Value to Median Contract Rent Ratios
    53 Major US Housing Markets (Metropolitan Areas)
    Worst Markets for Moving from Renting to Buying
    Rank Housing Market (Metropolitan Area) Value-to-Rent Ratio Median Contract Rent (Monthly) Median House Value Housing Affordabilty Rating
    1 San Francisco-Oakland, CA 39.56 $1,677 $796,100 Severely Unaffordable
    2 San Jose, CA 38.69 $1,964 $911,900 Severely Unaffordable
    3 Los Angeles, CA 36.92 $1,305 $578,200 Severely Unaffordable
    4 San Diego, CA 31.07 $1,415 $527,600 Severely Unaffordable
    5 Sacramento, CA 29.62 $1,022 $363,300 Severely Unaffordable
    6 New York, NY-NJ-PA 29.05 $1,223 $426,300 Severely Unaffordable
    7 Boston, MA-NH 28.14 $1,222 $412,700 Severely Unaffordable
    8 Portland, OR-WA 27.89 $1,031 $345,000 Severely Unaffordable
    9 Providence, RI-MA 27.77 $796 $265,300 Seriously Unaffordable
    10 Seattle, WA 27.23 $1,198 $391,500 Severely Unaffordable
    11 Denver, CO 24.79 $1,174 $349,200 Severely Unaffordable
    12 Salt Lake City, UT 24.60 $907 $267,800 Moderately Unaffordable
    13 Riverside-San Bernardino, CA 24.47 $1,086 $318,900 Severely Unaffordable
    14 Washington, DC-VA-MD-WV 23.74 $1,444 $411,400 Seriously Unaffordable
    15 Baltimore, MD 23.21 $1,055 $293,900 Moderately Unaffordable
    16 Milwaukee,WI 23.07 $737 $204,000 Seriously Unaffordable
    17 Hartford, CT 22.83 $903 $247,400 Moderately Unaffordable
    18 Raleigh, NC 22.56 $878 $237,700 Moderately Unaffordable
    19 Philadelphia, PA-NJ-DE-MD 22.27 $919 $245,600 Moderately Unaffordable
    20 Las Vegas, NV 22.06 $883 $233,700 Seriously Unaffordable
    21 Phoenix, AZ 21.97 $876 $231,000 Seriously Unaffordable
    22 Richmond, VA 21.81 $868 $227,200 Moderately Unaffordable
    23 Minneapolis-St. Paul, MN-WI 21.64 $926 $240,500 Moderately Unaffordable
    24 Virginia Beach-Norfolk, VA-NC 21.27 $940 $239,900 Moderately Unaffordable
    25 Austin, TX 21.20 $1,035 $263,300 Seriously Unaffordable
    26 Cincinnati, OH-KY-IN 21.08 $653 $165,200 Affordable
    27 Nashville, TN 21.00 $829 $208,900 Moderately Unaffordable
    28 Louisville, KY-IN 20.94 $645 $162,100 Moderately Unaffordable
    29 St. Louis,, MO-IL 20.64 $683 $169,200 Affordable
    30 Chicago, IL-IN-WI 20.60 $930 $229,900 Moderately Unaffordable
    31 Kansas City, MO-KS 20.38 $711 $173,900 Affordable
    32 Columbus, OH 20.15 $712 $172,200 Affordable
    33 Birmingham, AL 20.15 $637 $154,000 Moderately Unaffordable
    34 New Orleans. LA 19.89 $788 $188,100 Moderately Unaffordable
    35 Oklahoma City, OK 19.86 $647 $154,200 Affordable
    36 Tucson, AZ 19.82 $716 $170,300 Moderately Unaffordable
    37 Charlotte, NC-SC 19.77 $793 $188,100 Moderately Unaffordable
    38 Pittsburgh, PA 19.62 $631 $148,600 Affordable
    39 Miami, FL 19.36 $1,122 $260,600 Severely Unaffordable
    40 Grand Rapids, MI 19.20 $714 $164,500 Affordable
    41 Atlanta, GA 18.72 $880 $197,700 Moderately Unaffordable
    42 Buffalo, NY 18.63 $636 $142,200 Affordable
    43 Cleveland, OH 18.47 $659 $146,100 Affordable
    44 Indianapolis. IN 18.43 $694 $153,500 Affordable
    45 Detroit,  MI 18.37 $729 $160,700 Affordable
    46 Jacksonville, FL 18.33 $853 $187,600 Moderately Unaffordable
    47 Dallas-Fort Worth, TX 18.13 $869 $189,100 Moderately Unaffordable
    48 Orlando, FL 17.72 $948 $201,600 Seriously Unaffordable
    49 Memphis, TN-MS-AR 17.69 $671 $142,400 Moderately Unaffordable
    50 Houston, TX 17.36 $871 $181,400 Moderately Unaffordable
    51 San Antonio, TX 16.65 $802 $160,200 Moderately Unaffordable
    52 Tampa-St. Petersburg, FL 16.61 $879 $175,200 Seriously Unaffordable
    53 Rochester, NY 15.97 $725 $138,900 Affordable
    Sources: American Community Survey 2016, 13th Annual Demographia International Housing Affordability Survey.


    Wendell Cox is principal of Demographia, an international public policy and demographics firm. He is a Senior Fellow of the Center for Opportunity Urbanism (US), Senior Fellow for Housing Affordability and Municipal Policy for the Frontier Centre for Public Policy (Canada), and a member of the Board of Advisors of the Center for Demographics and Policy at Chapman University (California). He is co-author of the “Demographia International Housing Affordability Survey” and author of “Demographia World Urban Areas” and “War on the Dream: How Anti-Sprawl Policy Threatens the Quality of Life.” He was appointed to three terms on the Los Angeles County Transportation Commission, where he served with the leading city and county leadership as the only non-elected member. He served as a visiting professor at the Conservatoire National des Arts et Metiers, a national university in Paris.

    Photograph: Sacramento – One of 5 most difficult markets for moving from renting to buying.

  • Anaheim Transit: Suck It Up

    When I was a kid back in 1971 I lived in Anaheim, California where my mom was a waitress at a local amusement park. Exploring Orange County as an adult recently it all felt more or less the same as I remembered – only more so. The primary adjective has always been beige. The last vestiges of orange groves that still lingered in my youth are long gone, but the tidy neighborhoods of modest tract homes, strip malls, and motels are all still there behind the shiny new stuff.

    I was asked to write about Orange County as part of a land use and transportation conference so I went straight to the new ARTIC intermodal transit center. The boosters for ARTIC use words like “iconic,” “transformative,” “unique,” “prestigious,” and “catalytic” to describe the transit hub. There’s a lot of talk about the cooperation of numerous agencies and private firms that all collaborated to make the $185 million project happen. The structure is about getting people excited about Anaheim. The nuts and bolts of transportation itself are peripheral.

    Cut to the poor bastard out there somewhere on an anonymous street in Orange County waiting (and waiting, and waiting) for a bus to arrive so he can catch his transfer and get from Point A to Point B. The really transformative thing that would get him excited about transit would be more frequent service and a trip that took twenty minutes instead of an hour and a half. ARTIC does nothing for him. But that was never the point. ARTIC isn’t about transit.

    I was staying in nearby Garden Grove six miles away from ARTIC and I decided to test the process of moving around Orange County by public transit. An internet query described a trip of an hour and five minutes by bus. I sat at a bus stop and waited with my fellow travelers and chatted with them about their daily experience. The bus got them where they needed to go, but it wasn’t great. After thirty minutes the bus appeared. I calculated the wait for the transfer along the way and then the trip back again and realized the bus would suck up three hours of my day. And I was going to be cutting it close for an appointment that afternoon.

    Traveling by bike was going to take thirty seven minutes and it was all flat. I live in a transit rich neighborhood in San Francisco and I prefer my bike to transit most of the time. But as an out-of-town visitor I didn’t have a bike. I searched for bike rental facilities and there weren’t any near me. And there was the reality that most of the trip would be on the side of high speed eight lane arterials. It would have been doable, but not amazingly fun.

    Driving the six miles to ARTIC would take thirteen minutes so I walked back to my car. Here’s where I got a glimpse in to the prevailing culture of Orange County. I parked on a quiet residential side street and when I reached my car a note had been left on my wind shield. I was parked legally on a public street that had no restrictions. I wasn’t blocking anyone’s access and the street was mostly empty. The house in question had a two car garage and a driveway that could accommodate half a dozen vehicles. The parking problem wasn’t physical. It was emotional. Suburbanites don’t like their psychic space interfered with by interlopers. This goes a long way to explaining the transportation dynamics in the region.


    Google


    Google


    Google


    Google

    ARTIC is so big that it’s easier to get a feel for the place on Google rather than on the ground. The train platform is at one end, the bus stops are on either side, there’s a bike path along one edge of the property, and parking is everywhere. You’ll notice that the elegant structure itself has no real function. It’s purely decorative and designed to make a statement on the skyline. It could be replaced by a few porta-potties and a food truck and the transit stuff would be totally unaffected.


    Google

    Notice the transit hub is in the middle of absolutely nothing. The site is bound by the Santa Ana River on one side, a giant freeway on the other, and massive parking lots for Angel’s Stadium and Honda Center. I dare anyone to walk from one of these buildings to another. Even if I had managed to take a bus or train to ARTIC the destination wouldn’t have rewarded the effort.


    Google

    During the boom of the early 2000s plans were drawn up to transform the aging industrial properties in the area to higher value residential, commercial, and professional uses. The authorities in Anaheim built ARTIC as a shiny temple to lever development of the nascent urban center called the Platinum Triangle. Those plans crashed with the 2008 financial crisis and are only now ramping back up.

    The predominant design criteria for most of these new buildings involves suburban expectations. The interiors of the apartments as well as the private amenities within these complexes are quite nice and reflect the kinds of things affluent people have come to expect from single family homes in gated communities: greenery, swimming pools, convenient parking, privacy and security protocols. It’s all just been super sized at higher density. But when you’re outside of these buildings you stand between fortified shrubbery and ten lanes of traffic. People drive to the parking deck at the shopping mall or office park which is also hermetically sealed. It ain’t Paris.

    Ridership at ARTIC is considerably lower than anticipated for the simple reason that the physical environment is brutal for anyone who isn’t in a car – and that isn’t likely to change for a very long time. The density is coming. The urbanism isn’t. As I explored these new complexes I discovered that each of the lobbies and sales offices were accessed by the parking garage rather than the street. No one expects future residents to ever arrive on foot. This is Orange County… I talked to many of the low wage workers like the parking attendants. They all live in other more affordable cities at some distance. I asked them if they take transit. Not if they can possibly avoid it.

    Here’s how transit really works in Anaheim. Specific vehicle fleets take certain kinds of people to particular sorts of destinations. Both the populations and the destinations are cherry picked. The right kinds of people get to where they need to go quickly and efficiently. Everyone else… Suck it up.

    This piece first appeared on Granola Shotgun.

    John Sanphillippo lives in San Francisco and blogs about urbanism, adaptation, and resilience at granolashotgun.com. He’s a member of the Congress for New Urbanism, films videos for faircompanies.com, and is a regular contributor to Strongtowns.org. He earns his living by buying, renovating, and renting undervalued properties in places that have good long term prospects. He is a graduate of Rutgers University.

  • Why Small, Struggling Cities Don’t Need “Talent”

    I recently recorded a podcast with my colleague Steve Eide in which he argued against the idea that attracting high talented people into government is what was needed for smaller, post-industrial cities.

    I enjoy jousting with Steve on a variety of topics. He favors more aggressive state oversight of cities. As a rule I’m less sanguine about that. Because we come at the world from different perspectives, I’m often challenged by his provocative contrarian ideas.

    To wit, he took his “against talent” thesis and wrote it up for the American Conservative. Some of this is standard conservative takes on things like public sector unions, but there are a number of ideas sure to get people arguing:

    Any unbiased observer of our cities can see that mediocrity is the salient characteristic of the typical local American politician. Another important problem in small and mid-sized cities is that they are poor and in need of revitalization, especially in Rust Belt areas. A natural conclusion to draw from the coincidence of inept leadership and socioeconomic decay is that better leaders are needed. But in the poorest, most troubled cities, talented leadership is not much of an asset, and it can be a liability. Talent does real harm by raising false expectations of a revival—distracting from mundane yet essential operational matters, and forestalling state intervention at critical junctures.

    ….

    When public-spirited reformers call for better leadership for cities, they typically have in mind a collection of qualities that are more likely to be possessed by an outsider. They are not sounding the call for everyone to get behind this or that city councilmember, someone who got his start as a campaign worker to some local hack and has patiently waited his turn. Instead, they want someone with experience and/or education that most of the local crowd does not have, derived perhaps from service in the private sector or government at the federal or state level. This is likely to be someone who did not come up through the ranks and can thus apply a novel approach to longstanding challenges; who admires innovation; who can envision a solution to every problem, instead of a problem with every solution.

    ….

    But there’s no such thing as a right to revitalization. City reformers call for inspired leadership because they see it as a condition of revitalization, but what if that’s impossible? Our conception of urban renaissance is unduly influenced by the experience of a small handful of large cities. If you look past New York, San Francisco and Boston, and survey their dozens of small and mid-sized Rust Belt peers, it is very difficult to find an example of true revitalization. In a forthcoming research report, I survey 96 major poor cities in the Rust Belt and find that every single one has seen its poverty rate increase since 1970.

    ….

    Perhaps the biggest problem with the talented-outsider mayor is that he is apt to get ideas. He may be more educated than the local doofuses, but that does not mean he is fully enlightened. It’s a case where a little knowledge can become a dangerous thing. State and local politicians who are known as big thinkers will always be strong candidates for a “public official of the year” award from Governing magazine or singled out as one of “America’s 11 Most Interesting Mayors” by Politico. New York and DC-based reporters from national publications are naturally attracted to mayors who can speak the language of urbanism.

    But too much of urbanists’ advice for small and mid-sized cities consists of trying to impose lessons from successful top tier cities such as New York, Washington, San Francisco and Boston. Poor small and mid-sized cities should spend more time comparing themselves to other poor, small, and mid-sized cities. If you’ve lost half your population since 1950, you probably don’t have an affordable housing crisis; you’re not grappling with the challenges of density but rather a lack of density. If you have no wealth to redistribute in the first place, then Bill de Blasio can teach you little about the joys of redistribution.

    ….

    “Flexibility,” like “innovation,” may be a core value in Silicon Valley, but it’s frequently a bad thing in the world of municipal finance. Remember all the encomiums to “boring banking” in the wake of the 2008 financial crisis? Often enough, the same principle applies for how to run a city.

    Click through to read the whole thing.

    This piece originally appeared on Urbanophile.

    Aaron M. Renn is a senior fellow at the Manhattan Institute, a contributing editor of City Journal, and an economic development columnist for Governing magazine. He focuses on ways to help America’s cities thrive in an ever more complex, competitive, globalized, and diverse twenty-first century. During Renn’s 15-year career in management and technology consulting, he was a partner at Accenture and held several technology strategy roles and directed multimillion-dollar global technology implementations. He has contributed to The Guardian, Forbes.com, and numerous other publications. Renn holds a B.S. from Indiana University, where he coauthored an early social-networking platform in 1991.

    Photo: CT Senate Democrats, CC BY-NC-ND 2.0

  • Protecting Cities in Fire-Prone Regions

    If you live in a fire-prone area, which includes most of California, it is not a good idea to allow ivy and other plants to cover the sides of your building, as this winery and this church did near Santa Rosa. Both were lost to last week’s wildfires.

    Similarly, if you are a legislator in a fire-prone state, it is not a good idea to outlaw fire-resistant developments. As now-retired Forest Service researcher Jack Cohen relates in the above video, one requirement for making your home fire-safe is to have no large flammable structures within 100 feet of the home. That pretty much means people should build on one-acre or larger lots.

    But in California, the nation’s most fire-prone state, urban planners’ mania for density has led the legislature to effectively outlaw such low-density development. Santa Rosa’s Coffey Park neighborhood consisted of conventionally sized suburban homes on 50-by-100-foot lots–small for a modern suburb–resulting in many houses being only a few feet apart from one another. If one house caught fire during a dry spell, the intense radiant heat would be sure to set off the next home. As a result, the neighborhood is now a smoking ruin.

    As the Antiplanner noted a decade ago, California developers have built shelter-in-place neighborhoods that are so fire-resistant that it is safer for residents to stay in their homes than to evacuate. Wildfires have swept by these neighborhoods and not harmed a single home.

    Sadly, this technique has been criticized by even the California Department of Forestry, which argues that making homes fire-safe will just encourage people to live in fire-prone areas (meaning almost all of California). They suggested that people build their homes closer together to make them “easier to protect.” That didn’t work very well in Santa Rosa.

    If California had allowed urban areas to grow in the modern way, with density at the center and increasingly low densities at the edges, then a ring of low-density, shelter-in-place neighborhoods around Santa Rosa and other cities could have provided a fire break protecting the denser developments. But this is practically forbidden in California. So, we will get more disasters like the one in Santa Rosa and the 1991 Oakland Hills firestorm.

    This piece first appeared on The Antiplanner.

    Randal O’Toole is a senior fellow with the Cato Institute specializing in land use and transportation policy. He has written several books demonstrating the futility of government planning. Prior to working for Cato, he taught environmental economics at Yale, UC Berkeley, and Utah State University.

    Photo: Homes burned by a wildfire are seen, Oct. 11, 2017, in Santa Rosa, California via VOA News.

  • Infinite Suburbia

    The following is an excerpt from the introduction of Infinite Suburbia, a collection edited by Alan M. Berger and Joel Kotkin, with Celina Balderas Guzaman:

    “Global urbanization is heading toward infinite suburbia. Around the world, the vast majority of people are moving to cities not to inhabit their centers but to suburbanize their peripheries. Thus, when the United Nations projects the number of future “urban” residents, or when researchers quantify the amount of land that will soon be “urbanized,” these figures largely reflect the unprecedented suburban expansion of global cities. By 2030, an estimated nearly half a million square miles (1.2 million square kilometers) of land worldwide will become urbanized, especially in Asia, Africa, and Latin America. In the United States alone, an additional 85,000 square miles (220,000 square kilometers) of rural land will be urbanized between 2003 and 2030. Given that these figures represent the conversion of currently rural land at the urban fringe, these lands are slated to become future suburbias. Even so, many countries are already majority suburban. In the United States, 69 percent of the population lives in suburbs. As late as 2010, over 75 percent of American jobs lay outside the urban core. Many other developed countries are also majority-suburban. In the Global South, it is estimated 45 percent of the 1.4 billion people who become new urban residents will settle in peri-urban suburbs. The sheer magnitude of land conversion taking place, coupled with the fact that the majority of the world’s population already lives in suburbs, demands that new attention and creative energy be devoted to the imminent suburban expansion.”

    Infinite Suburbia will be available for sale this week through the Princeton Architectural Press website. You can find the link here.


  • The New State Role Models

    With Congress on what appears to be a permanent hold, the search for a workable political model now shifts increasingly to states and localities. Today America’s divergent geographies resemble separate planets, with policy agendas from immigration and climate change that vary wildly from place to place.

    The greatest divide lies between the deep blue states, notably California, and progressive America’s network of large urban centers and the generally less dense, more suburban-dominated red states. Their policy prescriptions may vary, but, if allowed to continue, the differing jurisdictions could end up serving as what Supreme Court Justice Louis Brandeis called “laboratories of democracy.”

    So, the critical question remains what policies work best. The answers may not be as simple as ideologues on the left and right might claim, but instead suggest, as President Bill Clinton once did, that our stunning diversity cannot easily follow a single political script.

    California and the blue state model

    Democrats may be at a historic low in terms of control of states and local jurisdictions, but they boast almost total domination in many of the richest, most influential and powerful locales. New York, California, Connecticut, Illinois and New Jersey are all tilting left with policies driven by powerful public employees, greens, urban real estate speculators as well as ethnic and gender activists.

    To be sure, kowtowing to these interests has landed these states among the worst fiscal situations in the nation. Yet some blue regions also have grown economically well above the national average since 2010, largely driven by asset inflation, particularly real estate and stocks, and technology. California’s robust growth, although now slowing, and its world-dominating tech sector has made it a creditable role model for similarly minded states.

    But what has been good in the aggregate has not worked so well for most Californians. Despite all the constant complaining about inequality and racial injustice, California, notes progressive economist James Galbraith, has also become among the most economically unequal parts of the country, topped only by Connecticut, New York and New Jersey. Particularly damaged have been the prospects for the young and minorities, particularly in terms of achieving homeownership.

    Read the entire piece at The Orange County Register.

    Joel Kotkin is executive editor of NewGeography.com. He is the Roger Hobbs Distinguished Fellow in Urban Studies at Chapman University and executive director of the Houston-based Center for Opportunity Urbanism. His newest book is The Human City: Urbanism for the rest of us. He is also author of The New Class ConflictThe City: A Global History, and The Next Hundred Million: America in 2050. He lives in Orange County, CA.

    Photo: Entheta (talk)Salt_Lake_Temple,_Utah_-_Sept_2004.jpg: Diliff (Salt_Lake_Temple,_Utah_-_Sept_2004.jpg) [CC BY 2.5, GFDL or CC-BY-SA-3.0], via Wikimedia Commons

  • Housing Unaffordability Policies: “Paying for Dirt”

    Issi Romem, buildzoom.com’s chief economist has made a valuable contribution to the growing literature on the severe unaffordability of housing in a number of US metropolitan areas. The disparities between the severely unaffordable metropolitan areas (read San Jose, San Francisco, Los Angeles, San Diego, Portland, Seattle, Portland, Denver, Miami, New York, Boston, Sacramento and Riverside-San Bernardino) and the many more affordable areas in America are described in “Paying For Dirt: Where Have Home Values Detached From Construction Costs“. Romem points out that: “In the expensive U.S. coastal metros, home prices have detached from construction costs and can be almost four times as high as the cost of rebuilding existing structures.”

    “Paying for dirt” refers to the ballooning land costs that now comprise an unprecedented part of house values, such as in the severely unaffordable metropolitan markets above. This has created an environment where affordability is impossible. In many of these metropolitan areas, a modest house commands an exorbitant price well beyond the financial capacity of most middle income households. Land has become so expensive that it doesn’t matter what is built on it, whether the average house or a tent, the price will be too high. The market distortions are so great that Romem is able to show that, for example, the average house value in Columbus, Ohio, a delightful metropolitan area, is less than the average land value per lot in Portland (Oregon).

    The research suggests that the variation in construction costs between US metropolitan areas pales by comparison to the differences in the land costs. In the most expensive housing market, San Jose, the average house value is seven times that of Buffalo, the least expensive. By contrast, the highest cost construction market (San Francisco) is only twice as expensive as the least (Las Vegas). The land cost differences are stark, exceeding a 40 times difference in San Jose compared to Buffalo or Indianapolis. In Indianapolis, new detached house construction in 2017 was 2.5 times that of much larger and more expensive San Diego.

    The Research

    Romem’s research is similar to that of Harvard’s Edward Glaeser and Wharton’s Joseph Gyourko (“The Economic Implications of Housing Supply”), who separated US metropolitan areas into those with “well-functioning” housing markets and those without. In the well-functioning housing markets homebuilders could construct houses for what the researchers called the “minimum profitable production cost. Their list of high cost markets that are not well-functioning nearly matches Romem’s list of metropolitan areas where land costs have risen most compared to construction costs. Romem provides estimates down to the ZIP Code level in major metropolitan areas, illustrating a substantial depth of analysis.

    Consistent with Glaeser and Gyourko, Romem finds that “absent restrictions on housing supply, competition among developers tends to maintain average metropolitan home prices tethered to the cost of construction.”

    The Problem of Excessive Land Use Regulations

    In the highly regulated metropolitan areas, promoters of the urban containment policies often hide behind the fiction of topographical or geographical barriers as having created the land scarcity. A particular favorite for this blather is the San Francisco Bay Area (which includes the San Francisco and San Jose metropolitan areas) that has driven house prices up so much. There is no question that topography and geography can create such a shortage, as this photograph of Maldives capital Male shows. But nothing in the Bay Area looks like Male (photograph above).

    But San Francisco and San Jose are nothing like Male. In fact, the San Francisco Bay Area has enough land for development that millions of new houses could be constructed. San Francisco’s urbanization is dense, with at least 15 more residents per square mile than the New York urban area (population centre). Its population, nearly one-third that of New York, lives in an even smaller one-fourth the land area. There would be no need for urban containment in the Bay Area if the topography genuinely limited development.

    Toward A More Unequal Society

    In a note, Romem says that “The stark differences in land value per home are driven largely by land use policy enacted in the expensive coastal metros since the 1970s, which has inhibited these cities’ growth. These metro areas have gradually slowed down their outward expansion, i.e. they have had success in stemming sprawl, but they have failed to compensate through densification. As a result, the economic vitality of these metros has been channeled away from population growth and into housing price growth.”

    “Stemming sprawl” while maintaining housing affordability through higher densities is a time-worn theory. The record seems to indicate that it is more likely Santa will come down the chimney than density will solve the problem. There are no virtually examples of housing markets (metropolitan areas) where increasing densities has restored affordability. This is not to suggest there is no value to increased density, but rather that it is an all too convenient diversion from solutions that have a chance of working.

    Appropriately, Romem puts this childish notion to rest that increasing densities “will reduce the land value component of homes simply by dividing a fixed land value over a greater number of units.”

    The bottom line is that the house price appreciation in the high cost metropolitan areas suppresses population by “selectively determining who can and cannot afford to live there” according to Romem. This policy outcome could not be more inconsistent with encouraging economic aspiration among middle-income households, who pay the price of the greater inequality imposed by public policy. Further, those effectively “zoned out” by these policies have greater financial challenges than their parents, who generally grew up in periods of greater economic growth and were not saddled with unprecedented student loan debt.

    The financial and exclusionary challenges weigh particularly hard on the large number of disadvantaged African-Americans and Hispanics, especially those living in the most progressive cities, where pious pronouncements about affordable housing initiatives are boilerplate, but rarely amount to anything remotely substantive. In fact, distorted land and housing markets in the expensive metropolitan areas represent a colossal government failure.

    Necessary Reforms

    To the contrary, housing affordability requires well-functioning housing markets. It requires home values that have not become detached from construction costs. A minimum condition is that land use regulations not stand in the way of building low cost housing tracts on the periphery of urban areas. This does not require building on the monstrous size lots of suburban Boston, where zoning and other land use restrictions have made housing far more expensive and exclusive than it needs to be. The key is to restore the competitive market for land, so that houses on comparatively small lots, such as one-quarter or one-fifth of an acre can be built at the historic land costs (including necessary infrastructure). Glaeser and Gyourko found this factor to account for about 20 percent of final purchase prices (as did I).

    Romem expresses a hope that things will improve. “The disparity between the appearance of homes and their price tags is more than a home buyer’s gripe: it is a telltale indication of restricted housing supply. Such restrictions – rules governing land use, installed by incumbent residents or their predecessors – are exclusionary by nature and amount to the gating of access to opportunity. Hopefully, this study has helped identify where gates must be opened.”

    Indeed.

    Wendell Cox is principal of Demographia, an international public policy and demographics firm. He is a Senior Fellow of the Center for Opportunity Urbanism (US), Senior Fellow for Housing Affordability and Municipal Policy for the Frontier Centre for Public Policy (Canada), and a member of the Board of Advisors of the Center for Demographics and Policy at Chapman University (California). He is co-author of the “Demographia International Housing Affordability Survey” and author of “Demographia World Urban Areas” and “War on the Dream: How Anti-Sprawl Policy Threatens the Quality of Life.” He was appointed to three terms on the Los Angeles County Transportation Commission, where he served with the leading city and county leadership as the only non-elected member. He served as a visiting professor at the Conservatoire National des Arts et Metiers, a national university in Paris.

    Photograph: Male (capital of the Maldives): Where there are genuine topographical constraints.
    https://upload.wikimedia.org/wikipedia/commons/6/67/Male_maldives.jpg

  • San Francisco’s Abundant Developable Land Supply

    The San Francisco Bay Area (home of the San Francisco and San Jose metropolitan areas), which has often been cited as a place where natural barriers have left little land for development. This is an impression easily obtained observing the fairly narrow strips of urbanization on both sides of San Francisco Bay, hemmed in by hills.

    However the Bay Area’s urbanization long ago leapt over the most important water bodies and then the Berkeley Hills to the east. Not only is the San Francisco Bay Area CSA high density, but it is also spatially small. In 2016, the San Francisco built-up urban area was only the 23rd largest in land area in the world. New York, the world’s largest built-up urban area in geographical expanse is more than four times as large.

    There is plenty of developable land in the San Francisco Bay Area. Data in a 1997 state analysis indicated that another 1,500 to 4,300 square miles (3,900 to 11,000 square kilometers) could be developed in the Bay Area CSA. The lower bound assumed no farmland conversion and stringent environmental regulation. The report also found that in recent years, residential development had become marginally denser, yet not incompatible with the detached housing remains the preference in California (Figure). The state has more than enough developable land for future housing needs.

    Demographia International Housing Affordability Survey with a median multiple of 9.6 (median house price divided by median household income) and the San Francisco metropolitan area is 7th worst, with a median multiple of 9.2. Before the evolution toward urban containment policies began, the median multiples in these metropolitan areas (and virtually all in the United States) were around 3.0 or less.

    The decades old Bay Area housing affordability crisis, and that of other urban containment metropolitan areas that are now seriously unaffordable (median multiples over 5.0) seeking to force higher densities, is more the result of policy than nature.

    Note on Method: Some of the CSA urban population is not in the continuous urbanization of San Francisco-San Jose built-up urban area, such as in the Santa Rosa, Stockton and Santa Cruz urban areas. This analysis is based on data from the California Department of Housing and Community Development and the U.S. Census Bureau. It is based on an estimate of additional development occurring from 1996 to 2010 and the land remaining after deduction of recently developed land. The population capacity assumes the “marginally higher” densities used by the California Department of Housing and Community Development, which it notes would not require substantial changes in the “current form of housing development” (1997).

  • Rising Rents Are Stressing Out Tenants And Heightening America’s Housing Crisis

    The home-buying struggles of Americans, particularly millennials, have been well documented. Yet a recent study by Hunt.com found that the often-proposed “solution” of renting is not much of a panacea. Rents as a percentage of income, according to Zillow, are now at a historic high of 29.1%, compared with the 25.8% rate that prevailed from 1985 to 2000.

    No surprise, then, that 58% of the 1,300 renters in the Hunt survey said they felt “stressed” about their rent, or that many respondents said they couldn’t save for future purchases like homes. Rather than the sunny freedom promised by those who promote a “rentership society,” most of those surveyed said that finding a convenient place with the amenities they required – for example, fitness rooms, places for pets and adequate space – was very difficult. Some renters have been forced to euthanize their pets, spend upwards of 50 days looking for a place or move farther from family and friends.

    All of this is taking place at a time when the national vacancy rate has fallen to 7.3% (in the second quarter of 2017), from 11.1% in the third quarter of 2009. That trend has continued even with apartment construction in many areas, notably core cities, because the new buildings tend to be too expensive for most renters.

    Fuel for a Housing Crisis

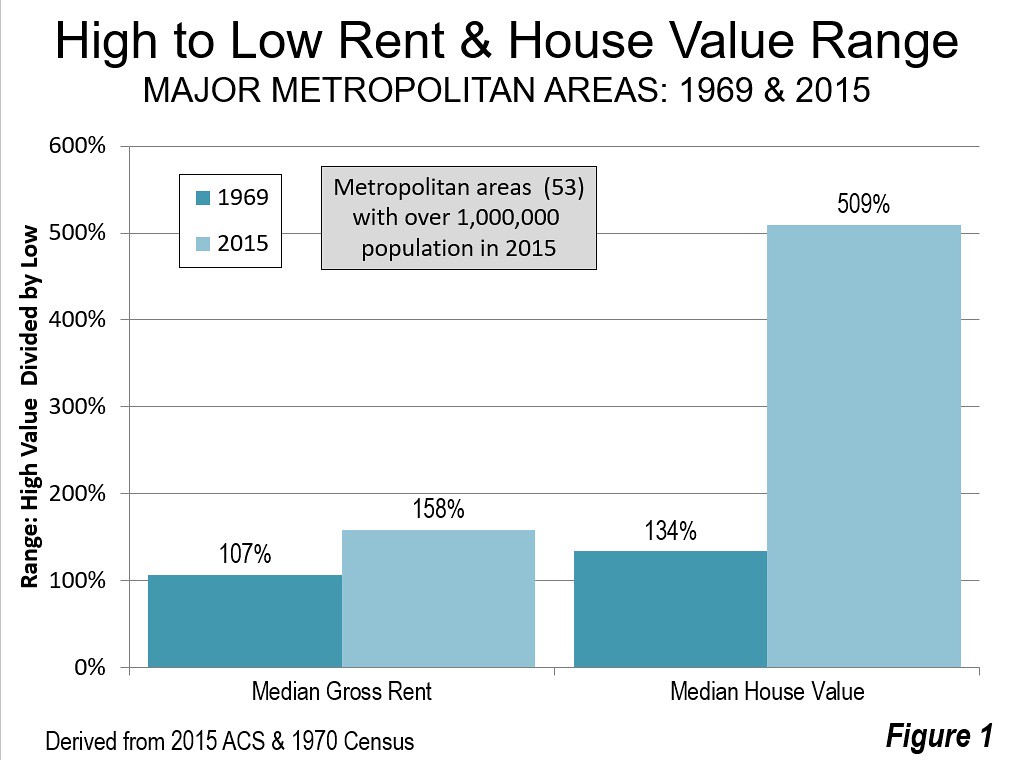
    There is a strong relationship between high rents and high house prices. Although rents have not risen as much as house prices generally, they tend to attract people who in the past might have become homeowners but instead have been crowded out by the high prices. This essentially brings into the rental market more affluent tenants who directly compete with those with lower incomes.

    The result in many places, such as Southern California, is overcrowding. Two-thirds of the places in the United States (municipalities and census-designated places) with more than 5,000 residences and with more than 10% of housing units being overcrowded are in California, according to the American Community Survey.

    The rent-related stress also points to a bigger crisis: the decline in the purchase of homes. One of the most prominent reasons for not buying a house directly relates to higher rents: It becomes all but impossible to save enough for a down payment. This also reflects changes in the labor market; service and blue-collar workers, whose incomes have been down in relation to rents, are the most burdened by rising rents. In San Francisco, even a teacher has been driven into the ranks of the homeless.

    The situation is worst in the most expensive markets. In New York City, incomes for millennials (ages 18–29) have dropped in real terms compared with the same age cohort in 2000, despite considerably higher education levels, while rents have increased 75%. New York, Los Angeles and San Francisco have three of the nation’s four lowest homeownership rates for young people and among the lowest birthrates.

    According to Zillow, for workers ages 22-34, rent costs claim up to 45% of income in the Los Angeles, San Francisco, New York and Miami metropolitan areas, compared with closer to 30% of income in metros like Dallas-Fort Worth and Houston. Home prices provide an even starker contrast. Dallas-Fort Worth, the nation’s fastest-growing housing market, as well as Houston, San Antonio and Charlotte have prices that are more like one-third those of the superstars.

    That helps explain why, according to the Hunt survey, the highest percentage of people who cannot save for future purchases (almost 60%) live on the pricey West Coast. The West Coast also had the largest percentage of people stressed about their rent, followed, not surprisingly, by the East Coast.

    High rents may also help explain recent shifts in migration to lower-rent areas. A recent survey by Apartmentalist.com found that the best prospects for renters becoming homeowners are in metropolitan areas like Pittsburgh, Provo, Madison, San Antonio, Columbus, Oklahoma City and Houston; the worst are, not surprisingly, in California, New York, Boston and Miami.

    Profound Implications

    What emerges from the Hunt study, and other research, is a renting population that may never achieve homeownership. This represents a sort of social evolution from the culture of self-assertion and independence that once so clearly characterized America after World War II and was so important to the unprecedented spread of middle-income affluence. Rather than striking out on their own, many millennials are simply failing to launch, with record numbers living with their parents or forced to shell out much of their income rent.

    The implications of high rent, and declining home ownership, could be profound over time. In survey after survey, a clear majority of millennials — roughly 80%, including the vast majority of renters — express interest in acquiring a home of their own. A Fannie Mae survey of people under 40 found that nearly 80% of renters thought that owning made more financial sense, a sentiment shared by an even larger number of owners. They cited such things as asset appreciation, control over the living environment and a hedge against rent increases.

    But it won’t just be renters impacted by rising rents. Jason Furman, who served as chairman of the Council of Economic Advisors under President Obama, calculated that a single-family home contributed two and a half times as much to the national GDP as an apartment unit.

    The decline in investment in residential properties has dropped to levels not seen since World War II. By some estimates, if we had that kind of housing investment again, we would return to 4% growth, as opposed to our all-too-familiar 2% and below.

    America’s housing crisis, long tied to ownership, is now extending into rising rents. But the stress that renters are feeling impacts all of us.

    This piece originally appeared on Forbes.com.

    Joel Kotkin is executive editor of NewGeography.com. He is the Roger Hobbs Distinguished Fellow in Urban Studies at Chapman University and executive director of the Houston-based Center for Opportunity Urbanism. His newest book is The Human City: Urbanism for the rest of us. He is also author of The New Class ConflictThe City: A Global History, and The Next Hundred Million: America in 2050. He lives in Orange County, CA.

    Wendell Cox is principal of Demographia, an international public policy and demographics firm. He is a Senior Fellow of the Center for Opportunity Urbanism (US), Senior Fellow for Housing Affordability and Municipal Policy for the Frontier Centre for Public Policy (Canada), and a member of the Board of Advisors of the Center for Demographics and Policy at Chapman University (California). He is co-author of the “Demographia International Housing Affordability Survey” and author of “Demographia World Urban Areas” and “War on the Dream: How Anti-Sprawl Policy Threatens the Quality of Life.” He was appointed to three terms on the Los Angeles County Transportation Commission, where he served with the leading city and county leadership as the only non-elected member. He served as a visiting professor at the Conservatoire National des Arts et Metiers, a national university in Paris.

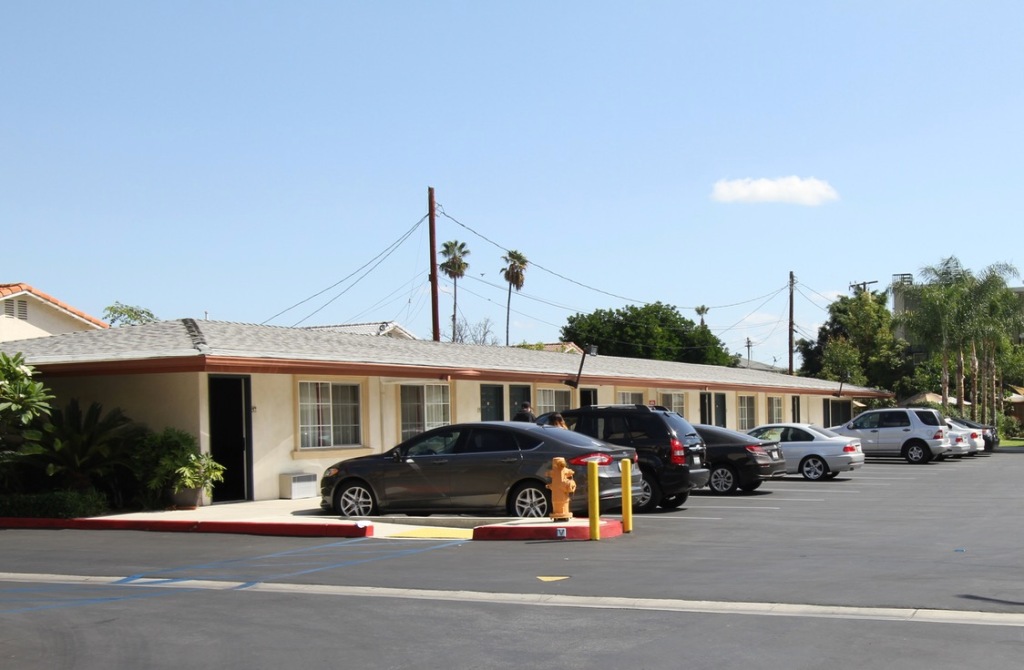
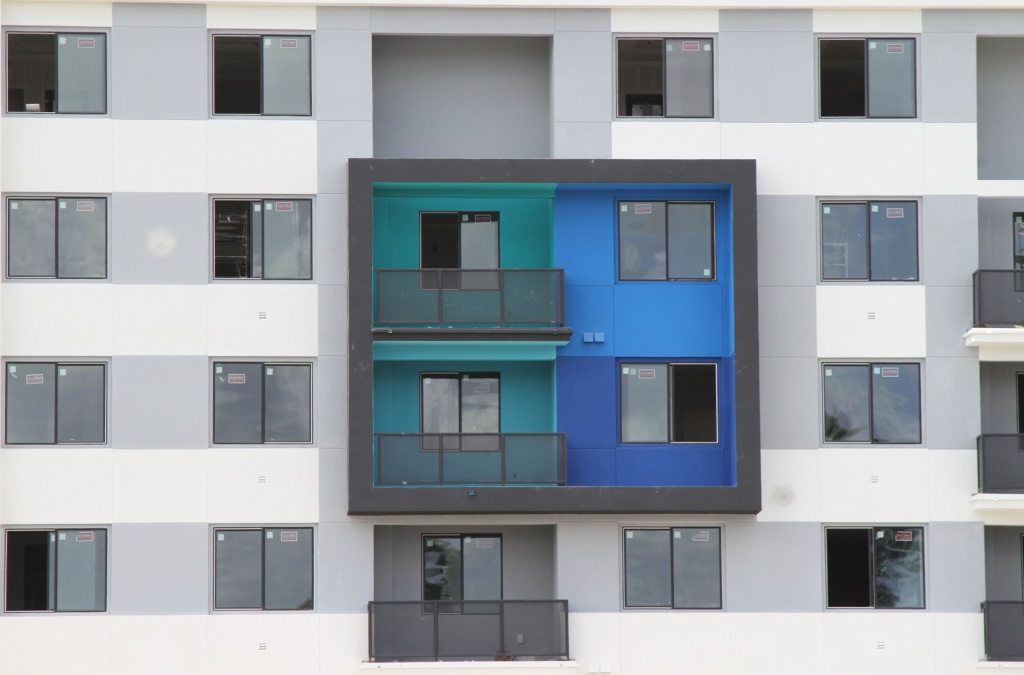
    Photo: Omar Bárcena, via Flickr, using CC License.
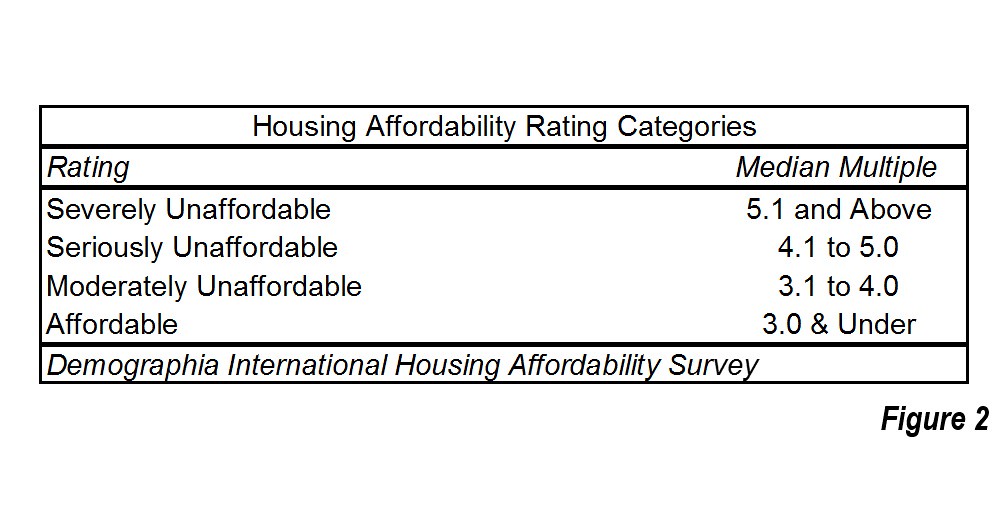
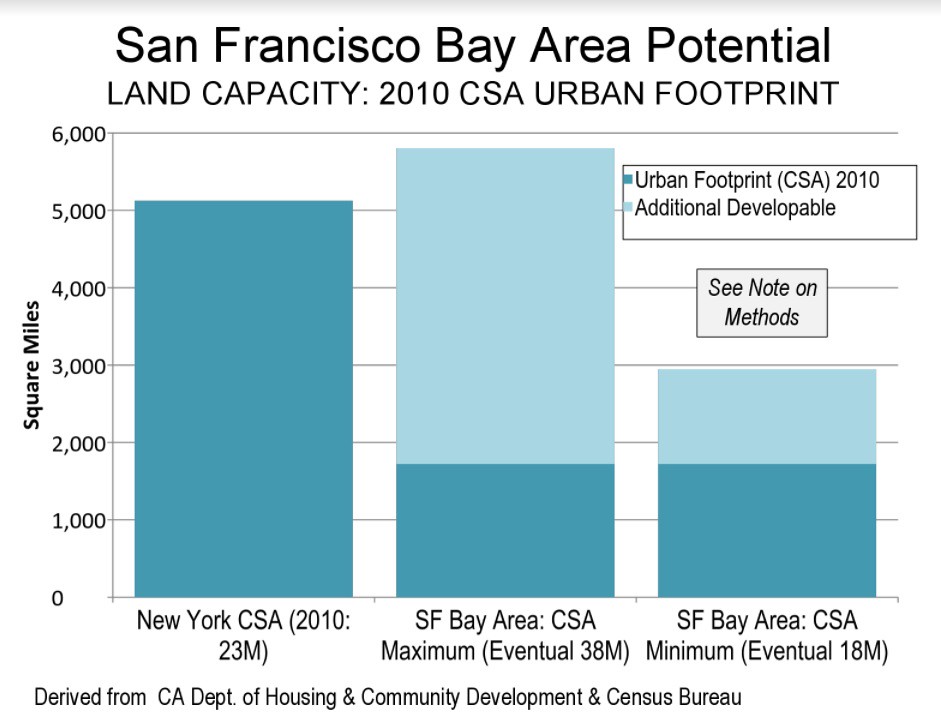