For years, demographers have been predicting that the population of Japan would begin to decline. The census of Japan, conducted every five years, however, still continues to show slight population growth, with 288,000 people having been added between 2005 and 2010. This growth was so small that the nation of Japan added fewer people than seven US metropolitan areas (Dallas-Fort Worth, Houston, Washington, Atlanta, Riverside-San Bernardino, Phoenix and Raleigh) and less than the Toronto metropolitan area over the same period of time.
A Less Populous Future: However, the 2010 census figure was higher than the estimates predicted. Still, longer-term projections indicate a substantial population decline. According to the 2010 census, Japan had approximately 128 million people. United Nations projections indicate that by 2050, Japan’s population will fall to 102 million. Although the extent of urbanization is expected to increase from 68 percent to 80 percent, the overall urban population is expected to decline. This is an astonishing development, in light of the fact that the world urban population is expected to increase by nearly 3 billion over the same period.
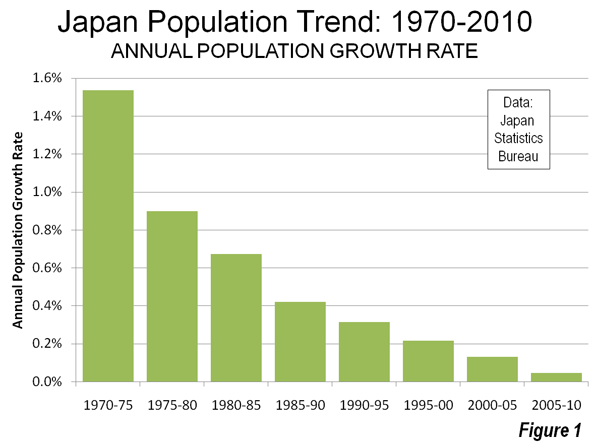
The Falling Growth Rate: The decline in Japan’s population growth rate has been precipitous. Between 1970 and 1975, Japan experienced an annual population growth rate of 1.53 percent. This was the fastest growth rate experienced by the nation since 1900, with the exception of the strong growth immediately after World War II, from 1945 to 1950. After 1975, however growth declined significantly, dropping to 0.89 percent annually between 1975 and 1980 and finally dropping to 0.05 percent annually between 2005 and 2010 (Figure 1).
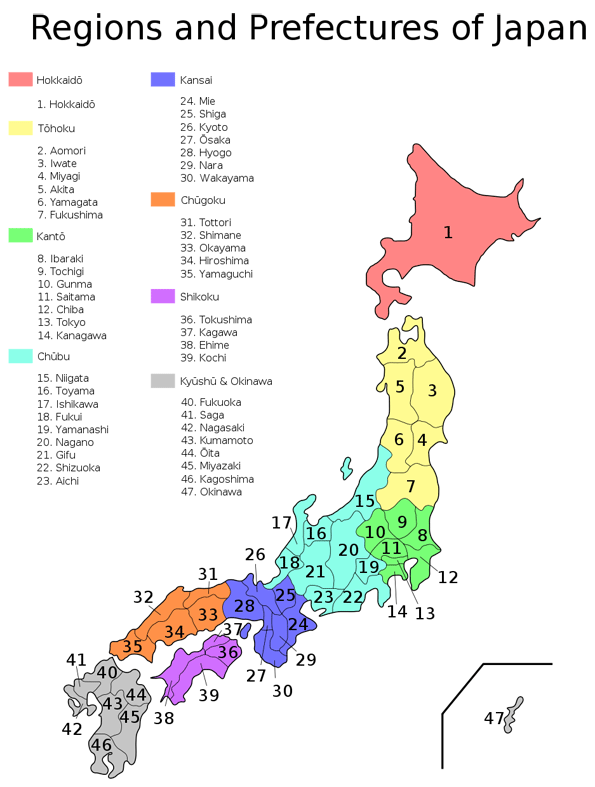
Tohoku: Population Loss, Earthquake and Tsunami: The largest population losses were in the Tohoku region of northeast Honshu, which is the largest and most highly populated island (more than 80 percent of the population). The population declined there by more than three percent.. However, one of Tohoku’s prefectures, Miyagi, has grown strongly, adding 29 percent to its population since 1970, more than any prefecture outside the Tokyo-Yokohama, Nagoya and Osaka-Kobe-Kyoto areas. All of this, of course, was before the great earthquake and tsunami of March 11, 2011 which severely damaged many communities in Tohoku and took an especially severe toll in Miyagi and its capital, Sendai.
All but two of Japan’s other regions experienced losses between 2000 and 2005, with growth only in Kanto (the broader Tokyo region, consisting of seven prefectures) and the island region (and prefecture) of Okinawa.
Only the prefecture of Aichi and four prefectures in the Tokyo – Yokohama area added more than 100,000 people. Nagoya is the capital of Aichi prefecture and forms the core of Japan’s third largest urban area. Small gains were also experienced in Osaka Prefecture (capital Osaka), at the core of the Osaka – Kobe – Kyoto urban area, the world’s 12th largest, with a population of 17 million. Shiga prefecture, halfway between Nagoya and Osaka grew slightly, as did Fukuoka prefecture, home of the Fukuoka and Kitakyushu urban areas.
Population losses were sustained in 38 of Japan’s 47 prefectures between 2005 and 2010 (Table). In contrast, during the much faster growing period of 1975 to 1980, 46 of Japan’s 47 prefectures gained (Figure 2). Indeed, the only prefecture losing population during that period was Tokyo (includes the 23 wards of the former city of Tokyo and the "tama" suburbs), which was the nation’s fastest-growing prefecture during the last census period.
| Japan Population Trends by Region and Prefecture, 1970-2010 | ||||||||
| 1970 | 2000 | 2005 | 2010 | Change | Change from 2005 | Share of Growth from 1970 | Change from 1970 | |
| JAPAN | 104,663 | 126,926 | 127,768 | 128,056 | 288 | 0.2% | 100.0% | 22.4% |
| REGION:Prefecture | ||||||||
| HOKKAIDO | 5,184 | 5,683 | 5,628 | 5,507 | -120 | -2.1% | 1.4% | 6.2% |
| Hokkaido | 5,184 | 5,683 | 5,628 | 5,507 | -120 | -2.1% | 1.4% | 6.2% |
| TOHOKU | 9,031 | 9,818 | 9,635 | 9,335 | -300 | -3.1% | 1.3% | 3.4% |
| Aomori | 1,428 | 1,476 | 1,437 | 1,373 | -63 | -4.4% | -0.2% | -3.8% |
| Iwate | 1,371 | 1,416 | 1,385 | 1,331 | -55 | -3.9% | -0.2% | -3.0% |
| Miyagi | 1,819 | 2,365 | 2,360 | 2,348 | -12 | -0.5% | 2.3% | 29.1% |
| Akita | 1,241 | 1,189 | 1,146 | 1,086 | -60 | -5.2% | -0.7% | -12.5% |
| Yamagata | 1,226 | 1,244 | 1,216 | 1,169 | -47 | -3.9% | -0.2% | -4.7% |
| Fukushima | 1,946 | 2,127 | 2,091 | 2,029 | -63 | -3.0% | 0.4% | 4.3% |
| KANTO | 29,496 | 40,434 | 41,495 | 42,607 | 1,113 | 2.7% | 56.0% | 44.5% |
| Ibaraki | 2,144 | 2,986 | 2,975 | 2,969 | -6 | -0.2% | 3.5% | 38.5% |
| Tochigi | 1,580 | 2,005 | 2,017 | 2,007 | -10 | -0.5% | 1.8% | 27.0% |
| Gumma | 1,659 | 2,025 | 2,024 | 2,008 | -16 | -0.8% | 1.5% | 21.0% |
| Saitama | 3,866 | 6,938 | 7,054 | 7,195 | 141 | 2.0% | 14.2% | 86.1% |
| Chiba | 3,367 | 5,926 | 6,056 | 6,217 | 161 | 2.7% | 12.2% | 84.6% |
| Tokyo | 11,408 | 12,064 | 12,577 | 13,162 | 585 | 4.7% | 7.5% | 15.4% |
| Kanagawa | 5,472 | 8,490 | 8,792 | 9,050 | 258 | 2.9% | 15.3% | 65.4% |
| CHUBU | 18,091 | 21,628 | 21,774 | 21,715 | -59 | -0.3% | 15.5% | 20.0% |
| Niigata | 2,361 | 2,476 | 2,431 | 2,375 | -57 | -2.3% | 0.1% | 0.6% |
| Toyama | 1,030 | 1,121 | 1,112 | 1,093 | -18 | -1.7% | 0.3% | 6.2% |
| Ishikawa | 1,002 | 1,181 | 1,174 | 1,170 | -4 | -0.3% | 0.7% | 16.8% |
| Fukui | 744 | 829 | 822 | 806 | -15 | -1.8% | 0.3% | 8.4% |
| Yamanashi | 762 | 888 | 885 | 863 | -22 | -2.5% | 0.4% | 13.2% |
| Nagano | 1,957 | 2,215 | 2,196 | 2,153 | -43 | -2.0% | 0.8% | 10.0% |
| Gifu | 1,759 | 2,108 | 2,107 | 2,081 | -26 | -1.2% | 1.4% | 18.3% |
| Shizuoka | 3,090 | 3,767 | 3,792 | 3,765 | -27 | -0.7% | 2.9% | 21.8% |
| Aichi | 5,386 | 7,043 | 7,255 | 7,408 | 154 | 2.1% | 8.6% | 37.6% |
| KANSAI | 18,944 | 22,713 | 22,760 | 22,755 | -5 | 0.0% | 16.3% | 20.1% |
| Mie | 1,543 | 1,857 | 1,867 | 1,855 | -12 | -0.7% | 1.3% | 20.2% |
| Shiga | 890 | 1,343 | 1,380 | 1,410 | 30 | 2.2% | 2.2% | 58.5% |
| Kyoto | 2,250 | 2,644 | 2,648 | 2,637 | -11 | -0.4% | 1.7% | 17.2% |
| Osaka | 7,620 | 8,805 | 8,817 | 8,863 | 46 | 0.5% | 5.3% | 16.3% |
| Hyogo | 4,668 | 5,551 | 5,591 | 5,589 | -1 | 0.0% | 3.9% | 19.7% |
| Nara | 930 | 1,443 | 1,421 | 1,400 | -21 | -1.5% | 2.0% | 50.5% |
| Wakayama | 1,043 | 1,070 | 1,036 | 1,001 | -35 | -3.4% | -0.2% | -4.0% |
| CHUGOKU | 6,997 | 7,732 | 7,676 | 7,562 | -114 | -1.5% | 2.4% | 8.1% |
| Tottori | 569 | 613 | 607 | 588 | -19 | -3.1% | 0.1% | 3.4% |
| Shimane | 774 | 762 | 742 | 716 | -26 | -3.5% | -0.2% | -7.4% |
| Okayama | 1,707 | 1,951 | 1,957 | 1,945 | -12 | -0.6% | 1.0% | 13.9% |
| Hiroshima | 2,436 | 2,879 | 2,877 | 2,861 | -16 | -0.6% | 1.8% | 17.4% |
| Yamaguchi | 1,511 | 1,528 | 1,493 | 1,451 | -41 | -2.8% | -0.3% | -3.9% |
| SHIKOKU | 3,904 | 4,154 | 4,086 | 3,977 | -109 | -2.7% | 0.3% | 1.9% |
| Tokushima | 791 | 824 | 810 | 786 | -24 | -3.0% | 0.0% | -0.6% |
| Kagawa | 908 | 1,023 | 1,012 | 996 | -17 | -1.6% | 0.4% | 9.7% |
| Ehime | 1,418 | 1,493 | 1,468 | 1,431 | -37 | -2.5% | 0.1% | 0.9% |
| Kochi | 787 | 814 | 796 | 765 | -32 | -4.0% | -0.1% | -2.8% |
| KYUSHU | 12,071 | 13,446 | 13,353 | 13,204 | -148 | -1.1% | 4.8% | 9.4% |
| Fukuoka | 4,027 | 5,016 | 5,050 | 5,073 | 23 | 0.5% | 4.5% | 26.0% |
| Saga | 838 | 877 | 866 | 850 | -17 | -1.9% | 0.1% | 1.4% |
| Nagasaki | 1,570 | 1,517 | 1,479 | 1,427 | -52 | -3.5% | -0.6% | -9.1% |
| Kumamoto | 1,700 | 1,859 | 1,842 | 1,817 | -25 | -1.3% | 0.5% | 6.9% |
| Oita | 1,156 | 1,221 | 1,210 | 1,196 | -13 | -1.1% | 0.2% | 3.5% |
| Miyazaki | 1,051 | 1,170 | 1,153 | 1,135 | -18 | -1.6% | 0.4% | 8.0% |
| Kagoshima | 1,729 | 1,786 | 1,753 | 1,706 | -47 | -2.7% | -0.1% | -1.3% |
| OKINAWA | 945 | 1,318 | 1,362 | 1,393 | 31 | 2.3% | 1.9% | 47.4% |
| Okinawa | 945 | 1,318 | 1,362 | 1,393 | 31 | 2.3% | 1.9% | 47.4% |
| In thousands | ||||||||
| Data from Japan Statistics Bureau | ||||||||
Moving to Tokyo: Since 1970, 56 percent of Japan’s growth has been in the Kanto region, which includes Tokyo. During the last five years, all of Japan’s growth took place in the core of the Tokyo – Yokohama region. This includes the suburban prefectures of Chiba, Kanagawa and Saitama, along with the prefecture of Tokyo. These four prefectures added 1.14 million people, nearly 4 times the population gain of the entire country. Tokyo is the national capital and forms the world’s largest urban area, with 37 million people.
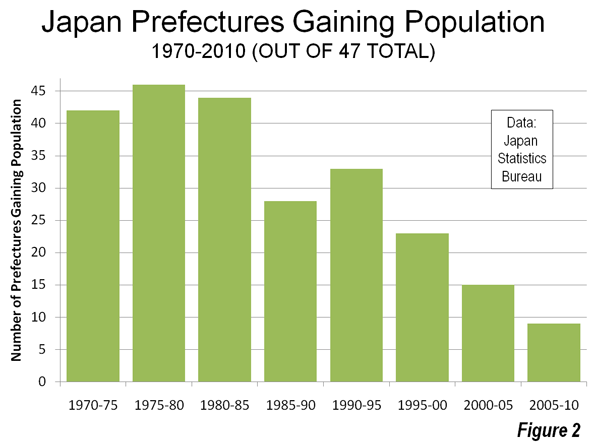
Different Urban Areas: Different Fates: The fortunes of the prefectures in Japan’s two largest urban areas could hardly be more different. The four prefectures of the Tokyo – Yokohama area had added approximately 3,000,000 people in each five-year period until 1975. Since that time, growth has been slower, but the area has added 1 million or more people each five years from 1975 to 2010. On the other hand, the Osaka – Kobe – Kyoto area (Osaka, Hyogo, Kyoto and Nara prefectures), which also experienced strong growth after World War II, adding between one and two million people in each five year period until 1975, has seen its growth come to a virtual standstill. Over the past five years, Osaka – Kobe – Kyoto added only 12,000 people (Figure 3). As a result, Osaka – Kobe – Kyoto is easily the slowest growing mega-city in the world, by far. Osaka – Kobe – Kyoto seems destined to fall substantially in world urban area rankings in the years to come. Tokyo – Yokohama, however, remains at least 14 million larger than any other urban area in the world, a margin that seems likely to be secure for decades to come.
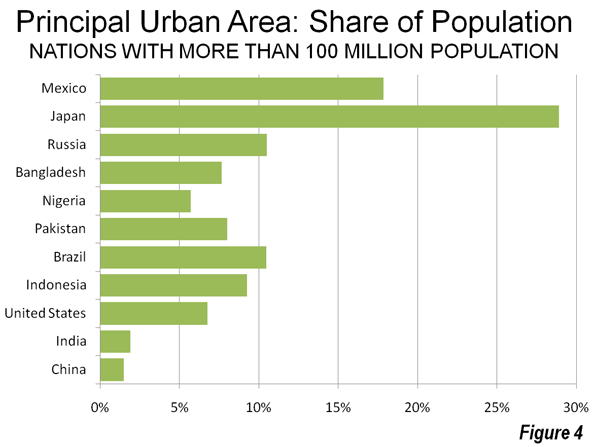
The Impetus for Decentralization: These numbers suggest there is ample reason to worry about the concentration of population and power in the Tokyo – Yokohama area, which now contains nearly 30 percent of the nation’s population. None of the world’s largest nations, outside of Korea (which ranks 25th in population), are so concentrated in one urban area. Among other nations with more than 100 million the greatest concentration is in Mexico, where Mexico City accounts for less than 20 percent of the population. The largest urban areas in Brazil (Sao Paulo) and Russia (Moscow) have little more than 10 percent of the population. The largest urban area in the United States, New York, accounts for less than seven percent of the population, while in China (Shanghai) and India (Delhi), the largest urban areas house less than two percent of the population (Figure 4). Paris, the beneficiary of centuries of centralization, has less than 20 percent of the population.
Moving Away from Tokyo? There had long been proposals to move the national capital, but were not implemented, at least in partly because of Japan’s two decade-long economic difficulties. However, after the great earthquake and tsunami, these calls have been revived. One proposal would establish a series of auxiliary capitals around the nation, rather than simply moving the capital from Tokyo. Proponents have indicated concern that a major earthquake and tsunami in the Tokyo – Yokohama area could be far more damaging than the recent disaster in Tohoku. A recent proposal by former Japanese Chief Cabinet Secretary Yasuhisa Shiozaki (formerly the second ranking official in the national government) called on Japan to move parliament (the Diet) to the Fukushima area, near the damaged nuclear power plant as a part of a decentralization strategy.
Despite these concerns, decentralization will be no easy matter. Moving the government would require a huge political shift, and that would just be the beginning. Shifting the commercial base and the population could well prove impossible.
Nonetheless, the results of the 2010 census provide strong support for decentralization, a message that has been telegraphed by the earthquake and tsunami of March 11.
Photo: Kyoto (by Jean Love)
Wendell Cox is a Visiting Professor, Conservatoire National des Arts et Metiers, Paris and the author of “War on the Dream: How Anti-Sprawl Policy Threatens the Quality of Life”
Comments
19 responses to “Japan’s 2010 Census: Moving to Tokyo”
Moncler Outlet outlet brands,nhan cuoi such as down jackets, except for some special offers, this year’s new down jacket prices and more in the thousand or so, compared with previous years up 100-300 dollars.Louis Vuitton Online Store is filled with a myriad of mesmerizing attire options to draw inspiration for this season.If you are ready to buy a home you can opt to have the newest Phoenix AZ homes for sale or Tucson real estate sent to Canada Goose Outlet you.The Louis Vuitton Official nhan nu Website decided to combine ethnic details with contemporary day chuyen architecture and even Punk elements
The proof is the Quang cao google buses and trains that converge on six large downtown areas in the United States, where 40 percent to 75 percent of commuters use transit. This is not because the people who work south of 59th Street in Manhattan, in Chicago’s Loop, or the downtown areas of Philadelphia, Washington, Boston or San Francisco have more effectively managed their guilt Quang cao tren google than the Austin commuter. It is rather because transit meets their needs. Commuters are rational. They take the mode of transport that best suits their needs. Transit’s market shares around the country (many of them miniscule) speak volumes about how well transit meets the needs of potential Quang cao google adwords customers.
Things are very open and intensely clear explanation of issues. was truly information. Your website is very beneficial. Appreciate your sharing. chatrandom
This is an astonishing development, in light of the fact that the world urban population is expected to increase by nearly 3 billion over the same period. mattress memory foam
This was a really outstanding post.in theory i’d like to compose like this too-taking time and real effort to make a solid article. personallawyer4u.com
Shiga prefecture, halfway between Nagoya and Osaka grew slightly, as did Fukuoka prefecture, home of the Fukuoka and Kitakyushu urban areas…. free cell phone spy software
cell phone listening
_Visit: tu van dau tu nuoc ngoai, cong bo thuc pham, thiet ke website ban hang, thanh lap cong ty, dang ky nhan hieu, cong bo luu hanh my pham…
The collapse of the housing market that triggered the Great Recession also has made Millennials sophisticated, knowledgeable consumers when making decisions about how and when to purchase a home. quang cao google Rather than thinking they should buy a home as soon as they get married or qualify for a mortgage, seventy percent of BHGRE’s respondents said the time to buy a house is when a person can “afford it and maintain their lifestyle
These findings suggest the current policies of the Federal Reserve and its Chairman, in thẻ bảo hành Ben Bernanke to keep interest rates low in order to stimulate this key part of the U.S. economy are right on target. If home builders and sellers can in thẻ nhựa tailor their offerings to these technologically sophisticated, family-oriented potential buyers, Millennials could well play an important role in reinvigorating the in thẻ vip nation’s housing market, further spurring the nation’s recovery from the Great Recession.
We know that getting a Vietnam visa is just a small task in preparing for your trip to Vietnam, but often consumes a lot of time and money. Because some people think that getting a Vietnam visa is very complicated, they decide to cancel their trip to Vietnam Vietnam visas We think that in these cases, people have not ben updated on Vietnam visa renewal achievements.
In Vietnam, visa-on-arrival started in 2003 and as of 2011 it is the predominant way tourists from Australia, North America and Europe come into Vietnam Visa to vietnam As Vietnam opens its economic and travelling door, the number of arrivals is on a sharp increase, every time it is counted. Following the rise in the number of international visitors, visa-on-arrival service has grown accordingly to meet the demand. Pioneering this trend vietnam visa online is the international renowned service. Please find below information to see if getting visa upon arrival at the airport good for you or not.
Vietnam visa on arrival is the cheapest way for you. With us, you only pay 20 USD or less, depending on the number of people in your group. And visa for vietnam you will receive authorization to receive visas at the airport. after getting the paper work, Vietnam visa application you will pay an additional fixed charge for each person is: 25 USD/person for single entry, 50 USD/person for multiple entries, and 100 USD/ person for 6 months multiple entries. And no more hidden charged.
For more information please email to vietnam visa on arrival Or hotline: +84.90.824.6047 Kevin Nguyen (Mr)
I’m impressed, I must say. Really rarely do I encounter a blog that’s both educative madeira plastica and entertaining, and let me tell you, you have hit the nail on the head. Your idea is hyundai hb20Soutstanding; the issue is sometallpexhing that not enough people are speaking intelligently about. I am very happy that I stumbled across this in my search for something relating to this.
El Centro de tai lieu Investigaciones Sociológicas (CIS) espanyol,
bao cao thuc tap
dependent del Ministerio de Presidencia, realitzà un estudi específic per a Catalunya, fet gens comú al CIS,
luan van ngan hang
i que no s’ha tornat a repetir. El CIS ha estat denunciat repetidament i públicament de respondre als
de an mon hoc
interessos dels partits en el govern espanyol, bàsicament pel que fa a les enquestes d’intenció de vot.
Space Needle, the casual observer might imagine that one of the nation’s most dense urban areas is spread out belowRugby shirts
Excellent site, keep up the good work my colleagues would love this. I read a lot of blogs on a daily basis and for the most part, people lack substance but, I just wanted to make a quick comment to say I’m glad I found your blog. Thanks
general contractor san diego ca
I made this tonight. It was fecking delicious! Just like Grandma used to make. Grandma was no fig faced, shaved truffle muncher. Graphic designers Brisbane
máy in đa năngWe talked to a lot of people – máy nghe nhạc sony the legends who work here, our customers and partners.tủ lạnh toshiba We were delighted by what they said – we are a top agency delivering top creative solutions with superb technical solutions. We were very flattered and we also had the inspiration for our new name – tủ lạnh panasonic Solutions.
Air line travel will get you where you are going in the least amount of time, in the best physical shape possible and ready to set out on your planned activities. emirates airlines
I was waiting for this type article and I have gained some useful information from this site. Thanks for sharing this information. Manual Directory Submission
Buy backlinks
high pagerank backlinks
Hi my friend! I wish to say that this post is amazing, nice written and include approximately all important infos. I would like to see more posts like this buy quality backlink
pr5 backlink
high Pagerank Backlinks