Tokyo is the ultimate in urbanization, being nearly one-half larger than any other urban area in the world. Further, Tokyo has retained its position as the largest urban area in the world for longer than any period since London’s approximately 100 year run from the early 1800s to the early 1900s. During the 1920s, New York became the largest, but was displaced by Tokyo in 1955.
Tokyo became the world’s largest urban area by adding more than 20 million people between 1955 and 2000, adding more people than lived in any other urban area in the world during that period. Even with its now slow growth, Tokyo seems likely to remain number one for two decades or more. However, if the breakneck growth of urban areas like Jakarta, Delhi and Manila continues, Tokyo could relinquish its position by 2030, especially if Tokyo begins losing population, joining Japan in that country’s accelerating rate of population decline as is projected (below).
The Tokyo region is much more than Tokyo proper (the "ku-area"). It includes Yokohama, which with 3.7 million people is larger than any suburb in the world except for Howrah in the Calcutta area. Kawasaki, between Tokyo and Yokohama has a population of 1.4 million, while Saitama, to the north has 1.2 million. Chiba, on the way to Narita International Airport, is home to nearly 1,000,000. There are multiple possible definitions of the Tokyo region. This article defines the Tokyo metropolitan area as Chiba, Kanagawa, Saitama and Tokyo prefectures (Note 1).
Suburban Areas: Tokyo also has the largest suburban population of any metropolitan region in the world. Approximately 26.7 million, or 75 percent of the Tokyo region’s 35.4 million population lives in suburban areas. This is the largest expanse of suburbanization in the world. The suburban population increase since 1950 exceeds that of New York, Los Angeles, and Paris combined (Note 2).
The Core
Tokyo is unique in having abolished its core municipality. In 1943, the former city of Tokyo was combined with the prefecture of Tokyo. This area was also labeled the Tokyo "metropolis." (Note 3) The prefecture of Tokyo contained a number of additional municipalities, which were not impacted by the merger, while the former area of the city of Tokyo was directly administered by the prefecture. In the intervening decades, the former city has been reorganized into 23 wards (ku), which have obtained considerable self-government authority, emerging as the near equivalent of cities themselves.
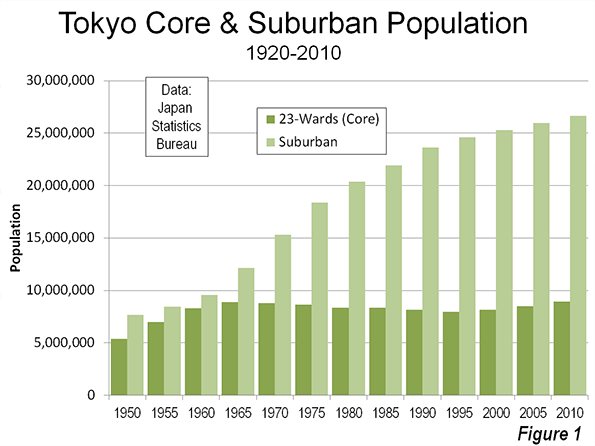
This "ku" area can be considered the historical core municipality. The 23 ku reached a peak population in 1965 of 8.893 million in 1965. In the next 30 years, the 23 ku sustained a population loss of more than 900,000, while the suburban areas were adding more than 20 million. The ku area exceeded its previous peak in the 2010 census, reaching 8.946 million, approximately 50,000 more than in 1965.
Growth Trends:
Census data indicates that in 1940, the core accounted for 53 percent of the region’s population. This dropped to 41 percent in 1950, with the largest share of war-time population losses in the ku area. The core gained back to 47 percent of the population in 1960. After that, nearly all growth was in the suburbs. Between 1950 and 2000, 87 percent of the population gain was in the suburbs. In the last decade, the suburbs share of growth dropped to 63 percent (Figure 1 and Table)
| Tokyo Metropolitan Region | |||||||
| Population by Sector: 1920-2010 | |||||||
| Year | Tokyo Region | Former City of Tokyo | Balance of Tokyo Prefecture | Tokyo Prefecture | Kanagawa Prefecture | Saitama Prefecture | Chiba Prefecture |
| 1920 | 7,678,000 | 2,173,000 | 1,526,000 | 3,699,000 | 1,323,000 | 1,320,000 | 1,336,000 |
| 1930 | 9,958,000 | 1,995,000 | 3,414,000 | 5,409,000 | 1,620,000 | 1,459,000 | 1,470,000 |
| 1940 | 12,740,000 | 6,779,000 | 576,000 | 7,355,000 | 2,189,000 | 1,608,000 | 1,588,000 |
| 1950 | 13,051,000 | 5,385,000 | 893,000 | 6,278,000 | 2,488,000 | 2,146,000 | 2,139,000 |
| 1955 | 15,424,000 | 6,969,000 | 1,068,000 | 8,037,000 | 2,919,000 | 2,263,000 | 2,205,000 |
| 1960 | 17,864,000 | 8,310,000 | 1,374,000 | 9,684,000 | 3,443,000 | 2,431,000 | 2,306,000 |
| 1965 | 21,017,000 | 8,893,000 | 1,976,000 | 10,869,000 | 4,431,000 | 3,015,000 | 2,702,000 |
| 1970 | 24,113,000 | 8,787,000 | 2,621,000 | 11,408,000 | 5,472,000 | 3,866,000 | 3,367,000 |
| 1975 | 27,042,000 | 8,647,000 | 3,027,000 | 11,674,000 | 6,398,000 | 4,821,000 | 4,149,000 |
| 1980 | 28,697,000 | 8,349,000 | 3,269,000 | 11,618,000 | 6,924,000 | 5,420,000 | 4,735,000 |
| 1985 | 30,273,000 | 8,354,000 | 3,475,000 | 11,829,000 | 7,432,000 | 5,864,000 | 5,148,000 |
| 1990 | 31,796,000 | 8,164,000 | 3,692,000 | 11,856,000 | 7,980,000 | 6,405,000 | 5,555,000 |
| 1995 | 32,577,000 | 7,968,000 | 3,806,000 | 11,774,000 | 8,246,000 | 6,759,000 | 5,798,000 |
| 2000 | 33,413,000 | 8,130,408 | 3,928,592 | 12,059,000 | 8,490,000 | 6,938,000 | 5,926,000 |
| 2005 | 34,472,000 | 8,490,000 | 4,081,000 | 12,571,000 | 8,791,000 | 7,054,000 | 6,056,000 |
| 2010 | 35,618,000 | 8,946,000 | 4,213,000 | 13,159,000 | 9,048,000 | 7,195,000 | 6,216,000 |
| Data from Census of Japan | |||||||
Generally, however the last decade has been far better for the core than in any period since 1960. Over each of the last two five year census periods, the percentage growth in the core has been greater than that of the suburbs, which, examining data from Europe, United States, Canada, and elsewhere is quite unusual.
Density Comparisons
Tokyo is often portrayed as one of the world’s highest density urban areas. It is not. At a density of 11,300 per square mile (4,300 per square kilometer), Tokyo is less dense than London (13,700 & 5,300), one-sixth the density of Hong Kong (67,000 & 25,900) and one-tenth the density of Dhaka (115,000 & 44,400). There are two reasons for this:
- Tokyo does not have intensely dense central areas. The ku area has a density of 37,300 per square kilometer (14,400 per square kilometer). This is well below the densities of Manhattan (69,000 & 27,000) and the ville de Paris (51,000 & 21,000). Only one of the ku (Toshima) exceeds the density of Paris.
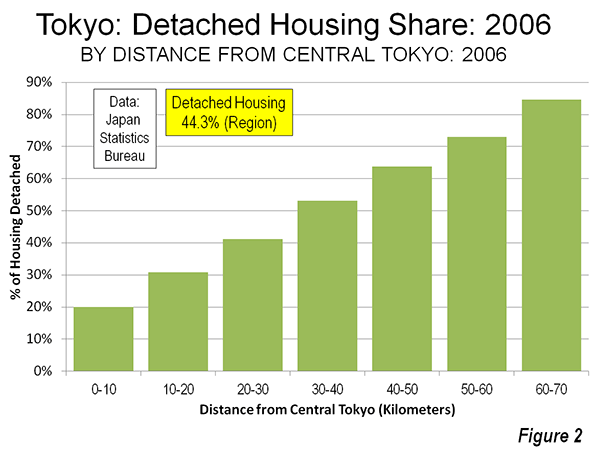
- Further, according to the Japan House and Land Survey of 2008, Tokyo has a large stock of detached houses, by definition lower density. Nearly 45 percent of the Tokyo region’s housing is detached. One-third of the dwellings within 30 kilometers (18 miles) of the core are detached. This figure rises to more than 60 percent outside 30 kilometers from the core and 85 percent between 60 and 70 kilometers (37-43 kilometers) from the core (Figure 2).
Transport
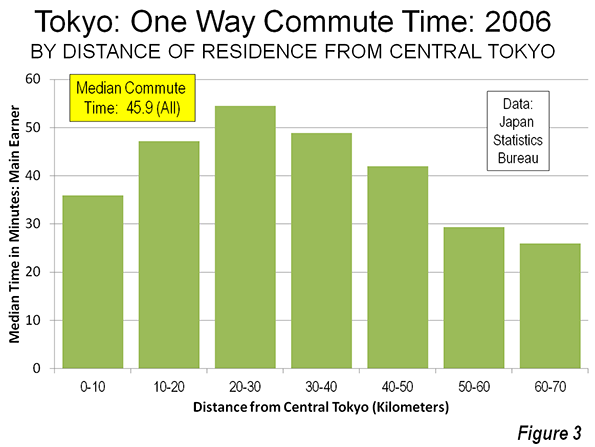
Tokyo is a transit oriented metropolis, with by far the highest transit usage in the world. In 2007, 65 percent of trips within a 50 mile radius were by mass transit. Overall transit usage is (passenger miles or kilometers) in the Tokyo region is approximately double that of all combined usage in the United States and nearly 10 times that of Paris, according to the Millennium Cities Data base. At the same time, one-way work trip travel times are reported to be the highest in the high income world, at a median of 45.9 minutes (Note 4) for main earners. Work trip travel times from residences are the shortest from the most remote residential locations (60-70 kilometers from the core) at a median of 26 minutes and at 29 minutes from residences between 50 and 60 kilometers from the core. Median travel times are 36 minutes one way within 10 kilometers of the core (Figure 3). The longest commutes are from residences located between 10 and 50 kilometers from the core (6 to 31 miles), which peak at 54.5 minutes each way between 20 and 30 kilometers (12 and 18 kilometers) from the core.
Toward a City State?
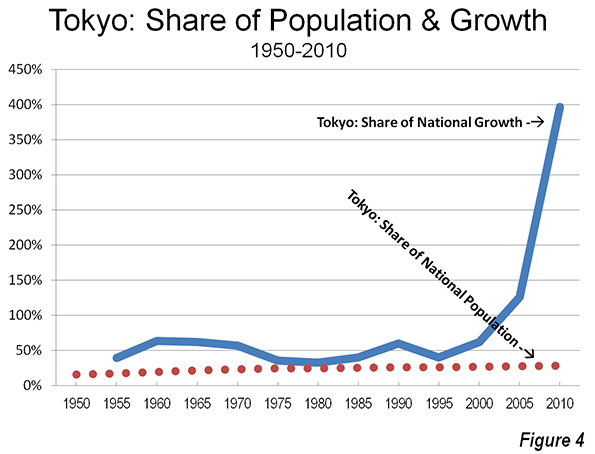
Japan has been centralizing for decades, principally as rural citizens have moved to the largest metropolitan areas. Since 1950, Tokyo has routinely attracted much more than its proportionate share of population growth. In the last two census periods, all Japan’s growth has been in the Tokyo metropolitan area as national population growth has stagnated. Between 2000 and 2005, the Tokyo region added 1.1 million new residents, while the rest of the nation lost 200,000 residents. The imbalance became even starker between 2005 and 2010, as Tokyo added 1.1 million new residents, while the rest of the nation lost 900,000. (Figure 4)
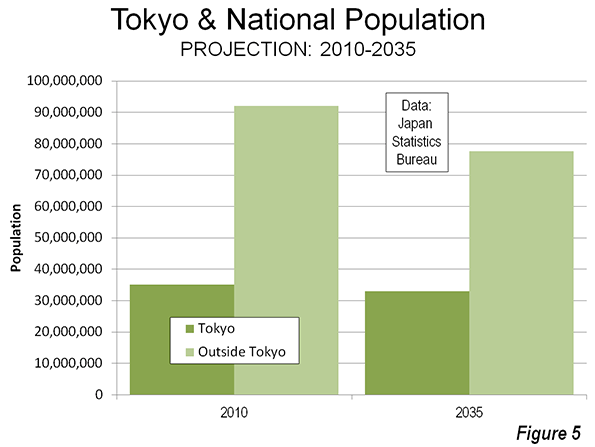
Eventually, Japan’s imploding population will finally impact Tokyo. Population projections indicate that between 2010 and 2035, Tokyo will start losing population. But Tokyo’s loss, at 2.1 million, would be a small fraction of the 16.5 million loss projected for the rest of the nation (Figure 5). If that occurs, Tokyo will account for 30 percent of Japan’s population, compared to 16 percent in 1950. With Japan’s rock-bottom fertility rate, a declining Tokyo will dominate an even larger share of the country’s declining population and economy in the coming decades.
Wendell Cox is a Visiting Professor, Conservatoire National des Arts et Metiers, Paris and the author of “War on the Dream: How Anti-Sprawl Policy Threatens the Quality of Life.”
Photo: Yamanote Loop Train, Tokyo Station (by author)
Note 1: The government defines a Tokyo major metropolitan area, using smaller area data. However, insufficient data is readily available for this article.
Note 2: These three urban areas have the largest suburban populations in the high income world outside Tokyo and Osaka-Kobe Kyoto.
Note 3: The term "Tokyo metropolis," has misled any number of analysts to believe that it means the Tokyo metropolitan area. In fact, it means only the prefecture of Tokyo, which is only one of the from one of the from four to eight prefectures (part or all) that can be considered a part of the metropolitan area, depending on the definition. Thus any comparison of the "Tokyo metropolis" with anything else in metropolitan in the world is best dismissed out of hand.
Note 4: Based on an analysis of the detailed data, it is estimated that the one-way average work trip travel time is more than 48 minutes.
Comments
21 responses to “The Evolving Urban Form: Tokyo”
Tokyo really is an amazing city with a unique story to tell. It is quite amazing how they have grown so quickly in such a condensed space while maintaining a stable economy. What is even more amazing is how the culture has progressed just as quickly with the cities growth. For example, when I spent a few months there I was intrigued by the youth’s obsession with streetwear fashion and culture. Tokyo has risen to become a fashion meca very quickly.
Not see so good to see someone so bad, This website has very good content. Thank you for the great article I did enjoyed reading it, I will be sure to bookmark your blog and definitely will come back from again. – cara memperbesar alat vital
Positive site, where did u come up with the information on this posting?I have read a few of the articles on your website now, and I really like your style. Thanks a million and please keep up the effective work. This is a good post. You’re in point of fact a just right webmaster. The website loading speed is amazing. – alat pemadam kebakaran
Looking ahead, we can expect this trend to continue, particularly as the current bulge of millennial 350-030 exam graduates mature and start to look for affordable places to live and work. 350-030 Regions that maintain strong job growth, and 350-030 keep 350-030 their housing costs down, are likely to keep gaining on those 350-030 brain dumps metropolitan areas celebrated for being the winners of the race 350-030 350-030for educated people.
http://www.actual-braindumps.com/350-030.htm 350-030
The lock is typically engaged via a small switch on the edge of the door that is only accessible when the door is open. After examine a few of the blog posts on your web site now, and I really like your manner of blogging. Excellent post. I was checking continuously this blog and I’m impressed!
Very informative, sensational work. Thanks a lot. Thanks for the great insights, this is really valuable. baju korea murah Pretty interesting , will be looking forward to your future updates. Cheers.
The post is written in very a good manner and it entails many useful information for me. I am happy to find your distinguished way of writing the post and backlinks. Now you make it easy for me to understand and implement the concept. Thanks you for the potential article.
You’ve written nice post, I am gonna bookmark this page, thanks for info. this website
Second, backlinks and the rapid evolution and adoption of new technologies has enhanced the development of resources, notably oil and gas previously considered impractical to tap. At the same time, the internet and advanced communications have reduced many of the traditional barriers — economic, cultural and social — that have cut off rural regions from the rest of country and the world.
Can not see so good to see someone so poor, this site is good content. Thank you for your great article, I also like to read, bookmarked your blog, will certainly come back again, I will. send cash
Do not see so good to see someone so bad, this site has good content. Thank you for your great article, I also like to read, bookmark your blog and will definitely come back again, I will. metafores
Still, while our PR expert admits that “the state of the industry is changing away from the kinds of movies [Hanks has] been associated with acompanhantes
It’s very informative and you are obviously very knowledgeable in this area. You have opened my eyes to varying views on this topic with interesting and solid content.http://rebelmouse.com
If testing web content, it’s worth testing not just in the native browser but also in Chrome and bbom and bbom
Addis Abeba is the capital of Ethiopia and calls itself the “diplomatic capital” of Africa, by virtue of the acompanhantes de são paulo
This info is very good for me.This site is awesome. My spouse and i constantly come across a new challenge & diverse in this article. – Melia Propolis
I’m not going to lie, I’m really impressed. After examine a few of the blog posts on your web site now, and I really like your manner of blogging. I bookmarked it to my bookmark web site record and can be checking again soon. Pls check out my website as well and let me know what you think. – cream walet asli
I read lot of history books about Tokyo and no doubt this place of full of God gifted items. You also show the graph with us that is the good essay point and i hope it will attract more people.
Very efficiently written information. It will be beneficial to anybody who utilizes it, including me.
acompanhantes em sp
The post is written in very a good manner and it entails many useful information for me. I am happy to find your distinguished way of writing the post.
garotas de programa sao paulo
Tokyo is going toward progress that and it’s the good thing. We can see the progress of this country from graph that they wigs canada are continuously increasing their revenue by apply the marketing strategies.