Author: Aaron M. Renn

  • Urbanists Need to Face the Full Implications of Peak Car

    As traffic levels decline nationally in defiance of the usual state DOT forecasts projecting major increases, a number of commentators have claimed that we’ve reached “peak car” – the point at which the seemingly inexorable rise in vehicle miles traveled in America finally comes to an end.   But while this has been celebrated, with some justification in the urbanist world as vitiating plans for more roads, the implications for public policy haven’t been fully faced up to.

    Indeed, the “peak car” is antithetical to the reigning urbanist paradigm of highways known as “induced demand.”  Induced demand is Say’s Law for roads: supply of lanes creates its own demand by drivers to fill them. Hence building more roads to reduce congestion is pointless. But if we’ve really reached peak car, maybe we really can build our way out of congestion after all.

    Traffic levels have stabilized or even fallen in recent years. According to analysis by economist Doug Short featured in Streetsblog, aggregate auto travel peaked on a per capita basis in 2005 and has fallen since. Per capita traffic levels are now back to 1994 levels, a two decade rollback in traffic increases.


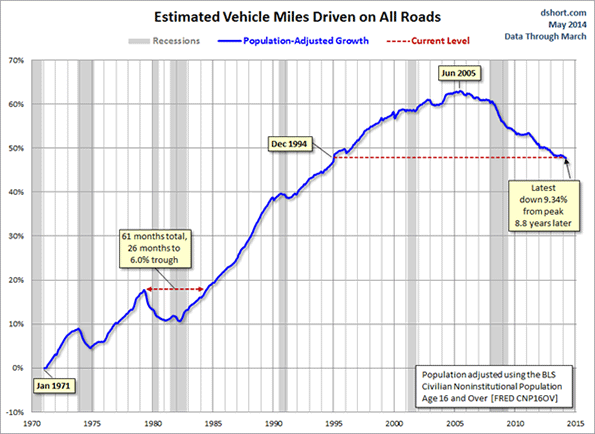
    Population adjusted traffic growth. Image via Doug Short
    Even looking at total, not per capita travel shows a marked reversal.  The State Smart Transportation Initiative, a pro-environmental research center, put together a graph showing how high the US DOT’s traffic projections have turned out to be:

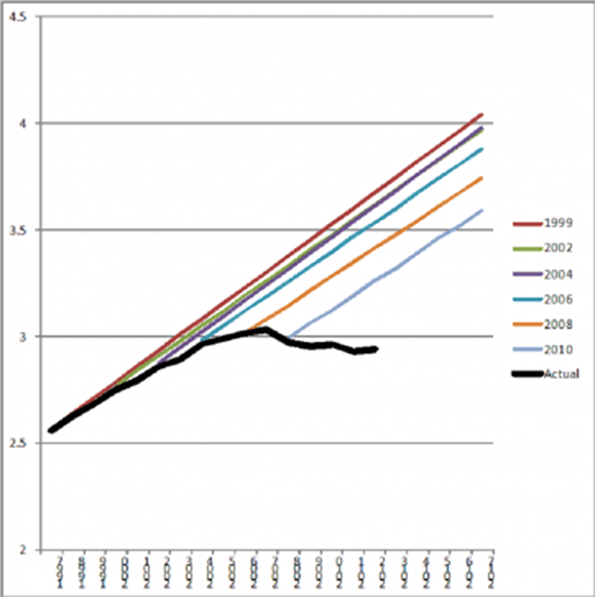
    VMT forecasts vs. actual. Source: SSTI

    This data is complemented by a slew of recent stories about the poor financial performance of toll roads, resulting in part from traffic falling far below projections.  For example, the concessionaire operating the Indiana Toll Road recently went bankrupt. Streetsblog reported that while projections forecasted traffic level increase of 22% in the first seven years, traffic actually fell 11% in the first eight.

    Recent traffic declines are a reversal of a long running trend of Vehicle Miles Traveled (VMT) increases at above growth in population. Some of this is no doubt due to the poor macro-economy. But there are reasons to believe we may be in a new era of traffic growth or lack thereof.  Many of the trends that drove high growth have largely been played out: household size declines, suburbanization, the entry of women into the workforce, one car per driver, etc. That’s not to say these will necessarily reverse. But we’ve reached the point of diminishing returns in terms of how many more women, for example, will join the labor force given that there’s already 57% female participation and their labor force participation rate is projected to decline in the future.

    This is potentially very good fiscal news, especially given tight budgets. Clearly many of the freeway expansion projects on the books that have been driven by speculative demand should be revisited.  For example, the state of Wisconsin has massive investments planned in Milwaukee area freeway system even though the metro area is very slow growth in population.  Are these really necessary?  Projects in more rapidly growing boomtown regions in places like Dallas, Houston or Charlotte may well continue to make sense. From top to bottom, engineers need to recalibrate their forecasting models to better correspond to reality. And to revisit highway plans accordingly.

    So the idea that we need to build fewer roads than we thought is sound. But less attention has been paid to the flip side implications of this.  To repeat, the induced demand theory says that there is a more or less infinite supply of traffic, thus any new roadway capacity will be used up shortly, leaving congestion as bad as the status quo ante.  Despite peak car, articles touting induced demand as a reason not to build roads continue unabated, including recent ones in Wired (“What’s Up With That: Building Bigger Roads Actually Makes Traffic Worse”) and Vox (“The ‘fundamental rule’ of traffic: building new roads just makes people drive more”).  In a world of peak car, where traffic levels are flat to declining on a per capita basis, induced demand no longer holds court, certainly not to the level claimed by those who believe it’s pointless to build roads.

    In fact, what peak car means is that while speculative projects may be dubious, there many be good reasons now to build projects designed to alleviate already exiting congestion.  Places like Los Angeles remain chronically congested, which has great economic and social consequences, not the least of which is the value of untold hours lost sitting in traffic.  While individual projects there might indeed be boondoggles, maybe it’s worth building some of the planned freeway expansions there in light of peak car. In short, in some cases peak car strengthens the argument for building or expanding roads.

    On the other hands, many of the regional development plans designed to promote compact central city development and transit may be predicated on an analysis that assumes large future traffic increases in a “business as usual” scenario.  Not just highways but all aspects of regional planning are dependent on traffic forecasts.  That’s not to say that such plans are necessarily wrong, but clearly revised traffic reality needs to be reflected in all plans, not just highway building ones.

    It’s not clear how this will all play out, but urbanists and policy makers of all stripes need to think about the full implications of peak car. At a minimum, the traditional “you can’t build your way out of congestion” rhetoric should be  supplanted, at least in most areas, by a more nuanced approach that neither overestimates demand, nor ignores the problems caused by rapid growth in some regions and pockets of congestion in others.

    Aaron M. Renn is an independent writer on urban affairs and the founder of Telestrian, a data analysis and mapping tool. He writes at The Urbanophile.

  • Back to Vlasic

    Earlier this year a trend called “normcore” got a lot of press. Normcore is a fashion idea based on wearing boring, undistinguished clothing such as that from the Gap. Jerry Seinfeld is a normcore fashion icon.

    While normcore was at least in part a joke, I think it illustrates why trend chasing by uncool cities will never make them cool. So you live in some place which isn’t on everyone’s list of the coolest cities. You read all about what’s happening in places like Brooklyn with micro-roasters, micro-breweries, cupcake shops, and artisanal pickles, and you’re like wow, my city has all that now, too. We’ve arrived.

    No you haven’t. Do you think for a minute that the cool kids are going to let you just catch up and join the club? It doesn’t work that way. By the time you get to where they were, they’ve moved on to something else. You’ll never catch up doing it that way.

    The idea of normcore, though probably just ephemera, shows how quickly the script could be flipped on you. Just as you finally master pretentious esoterica, the cool kids suddenly revert back to ordinary.

    I wouldn’t be totally surprised to see something like that happen, actually. While I shouldn’t underestimate the ability of creative people to continue playing leapfrog to new levels of local, bespoke, exclusive, etc., at some point that trend will be played out. Then were do you go? Back to the comfort of ordinary.

    Just when your Rust Belt burg finally has seven different artisanal pickle purveyors, don’t be surprised when the New York Times does an article talking about how the latest trend in Brooklyn is Vlasic kosher dill spears. (In an era in which Millennials are under huge financial pressure, this, like the sharing economy, would also be conveniently a matter of self-interest). Heck, maybe they already have and I just missed it.

    Again, it’s like the way that these industrial towns abandoned their local culture to pursue cool city culture, only to have those cool cities re-appropriate working class culture – Pabst, workwear brands, etc – for themselves. Now these Rust Belt cities are re-importing their own culture back as supplicants. Remember, back in the 90s, the cool cities list used to frequently include the number of Starbucks locations as an indicator. Things change fast.

    I like being able to get a good cup of coffee in these industrial towns now. I think it’s great for cities to have nicer stuff. But don’t ever make the mistake of thinking that by itself will change your relative standing in the marketplace.

    Aaron M. Renn is an independent writer on urban affairs and the founder of Telestrian, a data analysis and mapping tool. He writes at The Urbanophile, where this piece originally appeared

  • Building the Responsive City

    The Responsive City: Engaging Communities Through Data Smart Governance
    by Stephen Goldsmith and Susan Crawford

    Technology, and especially the use of data and analytics, has been transforming the way cities manage service delivery. Former Indianapolis mayor New York City deputy mayor Steve Goldsmith, and his colleague at Harvard Susan Crawford, recently wrote a book called “The Responsive City” looking at this technology revolution. I recently read the book and posted some thoughts in a review posted at City Journal. Here’s an excerpt:

    The book chronicles more than just technology’s potential; it also highlights what some local governments have already achieved with innovative approaches. After several fires resulted in the deaths of five people, New York City built a system to identify buildings at high fire risk, using predictive models and integrating data from multiple sources. City inspectors are now aggressively targeting those buildings for upgrades. To fight its rat problem, Chicago is using data analytics to predict where rats will gather, instead of waiting for resident complaints. Boston has developed a civic customer-relationship management system, with mobile-device apps, to link residents more easily with city services. Mimicking the way that Yelp collects restaurant reviews, Washington, D.C. uses a website to solicit ratings of city services. Cities around the country are adopting open-data portals.

    Goldsmith and Crawford are candid about the challenges facing their responsive-city vision. Progressive-era reforms designed to eliminate corruption also curtailed government employees’ discretion, leaving them with narrowly defined roles and limited ability to respond effectively to real-world problems. Rigid job descriptions, such as “temporary full-time permanent intermittent police officer,” are common in cities like New York, which has more than 2,000 such classifications. Procurement rules require that detailed specifications be prepared in advance, unlike in the private sector, where technology and other solutions are often developed iteratively. Government’s rigid contracting processes make it tough to respond to findings during development.

    You can click over to City Journal to read the entire thing

    I also sat down with Steve Goldsmith recently to talk about the book, and some of the challenges and pitfalls of this technology-drive approach. If the audio embed doesn’t display for you, click over to listen on Soundcloud.


    This piece originally appeared at The Urbanophile.

  • Southern Indiana is More Than Just a Great View of Louisville

    As part of a small project I’m doing in Southern Indiana, I spent two days touring around Clark and Floyd Counties to see what was up. As a guy who grew up in the area, it was great to get to see a lot of the positive things that have been occurring there. While perhaps places like New Albany and Jeffersonville might be considered small cities, the Southern Indiana portion of the Louisville metro area has about 280,000 people and is integrated into the larger regional economy. So it is participating in the economic and urban growth that’s also happening on the Kentucky side of the river.

    The commercial development, particularly restaurants, in New Albany was impressive. Several Louisville establishments have set up shop there, joining locally-based businesses that offer a wide range of high quality goods. I’m talking about places like New Albanian, Quills Coffee, Toast, The Exchange, Bread and Breakfast, and more. There have also been a lot of infrastructure upgrades since I last lived there. For example, a recent streetscape project on New Albany’s Main Street was underway while I was visiting.

    Toast in New Albany. (Aaron Renn)Toast in New Albany is one of the city’s many retail offerings. (Aaron Renn)

    Talking with some of the employees of the various businesses, some of whom moved from out of town to the area, it was clear that many of them made a deliberate choice to pick downtown New Albany, seeing it as a place with huge upside potential—they didn’t just land there by accident.

    There are some similar developments in downtown Jeffersonville, where the impact of the full opening of the Big Four Bridge as a pedestrian and bike crossing has been huge. I’ve walked across it several times now and am always amazed by the crowds. With extremely limited commercial development on the Louisville side of the river, Jeffersonville is raking in a ton of businesses, with an ice cream stand, several quality bar and grill places, and even a cigar bar tapping in. I expect this is only the start of a significant uptick in activity there.

    The Big Four Bridge has been good for business in Jeffersonville. (Aaron Renn)The Big Four Bridge has been good for business in Jeffersonville. (Aaron Renn)

    Clarksville remains the commercial center of the region and appears to be staying strong. It’s also got a huge redevelopment opportunity on its hands with the Colgate property and other prime real estate directly across the river from downtown Louisville. Not only is this the best skyline view of the city available, it already has pedestrian access across the Second Street Bridge to Louisville, albeit on a very narrow sidewalk.

    Most people never see it since you don’t pass it on any major highways—yet—but the Port of Indiana industrial park near Utica is humming with activity. Likewise, I saw a ton of building in the River Ridge industrial park that spans Jeffersonville and Charlestown. That huge amount of space on a major highway is primed to explode when the East End Bridge opens, though tolls remain a huge question mark.

    Overall, I was happy to see the kind of redevelopment that had long been talked about when I was a kid finally happening—though I must confess I miss the “LRS 102” lights on the Big Four. I’m expecting things to only continue to get better as these developments mature and grow.

    This piece was first published by Broken Sidewalk.

    Aaron M. Renn is an independent writer on urban affairs and the founder of Telestrian, a data analysis and mapping tool. He writes at about urban affairs at The Urbanophile.

  • The Decline of the Midwest, the Rise of the South

    The New York Times ran an article recently that’s nominally about football, but really gives insight into the decline of the Midwest and the rise of the South. Called “As Big Ten Declines, Homegrown Talent Flees,” this piece ties in perfectly with my recent essay on the differing social states of the Midwest and South. The NYT’s money quote says it all:


    The SEC sold excellence. The Big Ten sold tradition.

    Ironically, it is the formerly stigmatized “backwoods” South that has embraced excellence while the former industrial champion of the Midwest has spurned it. I don’t think that Midwesterners understand how much things have changed in the South. I hear the same stereotypical view of the South that might have had a lot of truth decades ago but have changes substantially. For example, those who think it is both a good thing and bad have quipped that Indiana is like an extension of the South into the Midwest. I don’t think so.

    For example, Charlotte built a light rail system. Dallas has poured a billion dollars into a downtown arts district. Atlanta has a multi-billion infill strategy around its former Belt Line railroad. Nashville eliminated downtown parking minimums and implemented a form based code. South Carolina has its German style apprenticeship program. North Carolina built Research Triangle Park – in 1959. Southern cities like Atlanta have proudly claimed and built success around their black heritage. And Charlotte’s Chamber of Commerce CEO said, “To understand Charlotte, you have to understand our ambition. We have a serious chip on our shoulder. We don’t want to be No. 2 to anybody.” Outside of Chicago, does anybody in the Midwest talk like that?

    Sure, there are bits and pieces here and there in the Midwest that speak to excellence. But they are the anomalies in a region that has retrogressed. Whereas in the South they’ve massively elevated their game in the last 40 years and are working hard to keep getting better. Sure, low costs and taxes play a role in their success. Climate and the universality of air conditioning as well. But they aren’t content to rest on just that. They want to get better. Meanwhile the Midwest is regressing towards what the South used to be such as, for example, by turning paved roads back to gravel because they can’t afford the maintenance.

    The NYT piece brings up an interesting factor driving the rise of the SEC vs. the Big Ten, namely the shift in underlying population ratios over time: “An instructive comparison is Michigan and Georgia. In 1960, Michigan had twice Georgia’s population; in 1990, it was nearly one and a half times as big; today, their populations are roughly equivalent.”

    The decline in Midwest population and economic heft brings with it a price that has to be paid. It’s showing up in the football world today. But it’s sure to hit the academic prowess of the Midwest’s major state schools as well. How long can these places maintain their relative rankings of excellence without the financial firepower to play in the big leagues? There’s more inertia on the academic side, but don’t think it won’t eventually happen here as well. The same is true in many other aspects of civic life. Even mighty Chicago has nearly bankrupted itself in its efforts to keep up with other global cities.

    The Big Ten obviously saw the writing on the wall and decided to expand outside the region. I dislike this for reasons of, naturally, tradition. But it’s a rational response to a declining marketplace. Similarly, the Cleveland Orchestra established a Miami residency in the pursuit of cash to keep its artistic excellence intact. Might some of these institutions at some point become Midwest in name only? Time will tell.

    Not everyone agrees with the idea that the SEC vs. Big 10 comparison is a relavent proxy, basically saying that it’s ludicrous to say that football proves anything. I don’t think that it does. But I will make three points:

    1. The differing fortunes of the two conference is yet another in an extremely long series of data points and episodes that demonstrate a shift in demographic, economic, and cultural vitality to the South.
    2. Sports is one of the many areas in which Midwestern states have clung to traditional approaches, even though those approaches haven’t been producing results.
    3. Demographic and economic changes have consequences. It’s not realistic to expect that the Midwest’s excellent institutions will necessarily be able to retain excellence when supported by hollowed out economies.

    I’d like to throw up a couple of charts to illustrate the longer term trends at work. The first is a comparison of per capita personal income as a percent of the US average for Illinois vs. Georgia since 1950:


    il-vs-ga

    Here’s the same chart of Ohio vs. North Carolina:


    oh-vs-nc

    If I put up the population or job numbers, the same charts would show the South mutilating the Midwest. (Indiana, Georgia, and North Carolina were all about the same population in 1980, but the latter two have skyrocketed ahead since then for example). What’s more, the South’s major metros score better on diversity and attracting immigrants than the Midwest’s major metros as a general rule.

    These charts show the convergence in incomes over time. The decline in relative income of the Midwest is possibly in part to increases elsewhere, not internal dynamics. But think about what the Midwest looked like in 1950, 60, or 70 vs the South, then think about it today and it’s night and day. The Midwest may still be endowed with better educational and cultural institutions than the South, but we can see where the trends are going. Keep in mind that those things are lagging indicators. Chicago didn’t get classy until after it got rich, for example.

    Now we see that Southern income performance hasn’t been great since the mid to late 90s. This is a problem for them. As is their dependence on growth itself in their communities. I won’t claim that the South is trouble free or will necessarily thrive over the long haul. But they seem to have a clearer sense of identity, where they want to go, and what their deficiencies are than most Midwestern places.

    Richard Longworth seems to buy the decline theory but has a different explanation of the source, namely that Chicago has sucked the life out of other Midwestern states:

    In the global economy, sheer size is a great big magnet, drawing in the resources and people from the surrounding region. We see this in the exploding cities of China, India and South America. We see it in Europe, where London booms while the rest of England slowly rots.

    And we see it in the Midwest where, as the urbanologist Richard Florida has written, Chicago has simply sucked the life – the finance, the business services, the investment, especially the best young people – out of the rest of the Midwest.

    To any young person in Nashville or Charlotte, the home town offers plenty of opportunities for work and a good life. To any young person stuck in post-industrial Cleveland or Detroit, it’s only logical to decamp to Chicago, rather than to stay home and try to build something in the wreckage of a vanished economy.

    This seems to be a common view (see another example), even in the places that would be on the victim side of the equation. But I’ve never seen strong data that suggests this is actually the case. Are college grads and young people getting sucked out of the rest of the Midwest into Chicago?

    Thanks to the Census Bureau, we now have a view, albeit limited, into this. The American Community Survey releases county to county migration patterns off of their five year surveys sliced by attribute. There seems to be some statistical noise in these, and for various reasons I can’t track state to metro migrations, but thanks to my Telestrian tool, I was able to aggregate this to at least get metro to metro migration. So here is a map of migration of adults with college degrees for the Chicago metro area from the 2007-2011 ACS:


    degree-migration
    Net migration of adults 25+ with a bachelors degree or higher with the Chicago metropolitan area. Source: 2007-2011 ACS county to county migration data with aggregation and mapping by Telestrian

    This looks like a mixed bag to me, not a hoover operation. What about the “young and restless”? Here’s a similar map of people aged 18-34:


    ya-migration
    Net migration of 18-34yos with the Chicago metropolitan area. Source: 2006-2010 ACS county to county migration data with aggregation and mapping by Telestrian

    This is an absolute blowout, with a massive amount of red on the map showing areas to which Chicago is actually losing young adults. Honestly, this only makes sense given the well known headline negative domestic migration numbers for Chicago.

    I do find it interesting that there’s a strong draw from Michigan. Clearly Michigan has taken a decade plus long beating. There’s been strong net out-migration from Michigan to many other Midwestern cities during that time frame, and its the same in Cleveland, which also took an economic beating in the last decade. This is just an impression so I don’t want to overstate, but it seems to me that a disproportionate number of the stories about brain drain to Chicago give examples from Michigan. Longworth uses the examples of Detroit and Cleveland. These would appear to be the places where the argument has been truly legitimate, but that doesn’t mean you can extrapolate generally from there.

    What’s more, even if a young person with a college degree does move to Chicago from somewhere else, will they stay there long term? They may circulate out back to where they came from or somewhere else after absorbing skills and experience. It’s the same with New York, DC, SF, etc. I’ve said these places should be viewed as human capital refineries, much like universities. That’s not a bad thing at all. In fact, it’s a big plus for everybody all around. Chicago is doing fine there. But it’s a more complex talent dynamic than is generally presented, a presentation that does not seem to be backed up by the data in any case.

    Aaron M. Renn is an independent writer on urban affairs and the founder of Telestrian, a data analysis and mapping tool. He writes at The Urbanophile, where this piece originally appeared.

    Photo courtesy of BigStockPhoto.com.

  • The New Donut

    Former Indianapolis Mayor Bill Hudnut used to like to say that “you can’t be a suburb of nowhere.” This is the oft-repeated notion has been a rallying cry for investments to revitalize downtowns in America for three decades or so now. The idea being that you can’t have a smoking hole in your region where your downtown is supposed to be. This created a mental based on a donut. You can’t let downtown become an empty hole. For reason that will become apparent soon, I call this model “the old donut”.

    Filling in the hole became every city’s mission. Pretty much any city or metro region of any size has pumped literally billions of dollars into its downtown in an attempt to revitalize them. This took many forms ranging from stadiums to convention centers to hotels to parking garages to streetcars to museums and more. It’s popular today to subsidize mixed use development with a heavy residential component.

    These efforts have paid off to a certain degree. Most big city downtowns have done very well as entertainment and visitor districts, eds and meds centers, etc. More recently we’ve seen an influx of residents, even in places where the overall city or even region has struggled or declined. Cleveland added about 4,000 net new downtown residents in the 2000s. St. Louis added 3,000. With most cities in some stage of an apartment building spree consisting of a few thousand units, these numbers should only improve.

    Key weaknesses remain in private sector employment (declining in most places) and retail (not enough high income residents yet). And other than the tier one types of cities like Chicago, few places seem to have reached a sustainable market rate development level yet – pretty much everything is getting public assistance. Yet its pretty evident that most larger downtowns have made huge strides and are experiencing overall reasonable health.

    In short, the donut hole has been filled in. Where does that leave us? I’d argue with a paradigm I call “the new donut”:


    In this model, the old donut is inverted. What used to be the ring of health – the outer areas of the city and the inner suburban regions – are now struggling. Whereas the downtown is in pretty good shape, and the newer suburban areas are booming. (You might add in a fourth outer ring with troubles – these were the exurbs where very low-end housing proliferated because development standards were very low).

    You see this in the population figures. Wendell Cox cranked the numbers and found that major metro areas gained 206,000 residents in the two mile radius from the center, but lost 272,000 residents from the 2-5 mile ring. Growth picked up strongly beyond that arc. This is the new donut area, though the start and end of it vary by metro and some have thicker rings of challenge than others.

    We’ve got three decades of experience in downtown revitalization, but much less in dealing with this newer challenge zone. I’ve said that suburban revitalization may prove to be the big 21st century “urban” challenge. This is where it is happening in many cases. These areas have an inferior housing stock (often small post-war worker cottages or ranches), sometimes poor basic infrastructure, and are sometimes independent municipalities that, like Ferguson, MO, are often overlooked unless something really bad happens. Unlike the major downtown, they are often “out of sight, out of mind” for most regional movers and shakers.

    What’s more, while downtown provides a concentrated location for massive public investment, this more spread out area is too big to fix by throwing money at it. And how many stadiums and convention centers does a region need in any event?

    This is where we need to be doing a lot of thinking about how to bring these places back, look at what’s being done, etc. And also, given the inequality in the country, to try to think about ideas that don’t involve gentrification. One project that appears to be in this kind of zone, for example, is Atlanta’s Beltline project, though there’s a gentrifying aspect to this one. Regions that figure this one out will be at a big advantage going forward.

    Aaron M. Renn is an independent writer on urban affairs and the founder of Telestrian, a data analysis and mapping tool. He writes at The Urbanophile, where this piece originally appeared.

  • Diverging Fortunes in Portland

    A recent New York Times Magazine had a story on Portland that featured Yours Truly. I recapitulated a few observations I’ve had over the years, including that it’s truly remarkable how a small city like Portland has captured so many people’s imagination, and also that “people move to Portland to move to Portland.”

    A Portland writer named Steve Duin appears to have had an aneurysm over the piece and, among other things, criticized my statement about why people move to Portland, saying:

    She quotes Aaron Renn, an urban-affairs analyst, who insists that while Los Angeles attracts starlets and New York the financiers, “People move to Portland to move to Portland,” as if the city is a space between Pacific Avenue and Park Place on the Monopoly board, not a vibrant, creative, accessible and accommodating urban scene.

    Which only proves that he completely missed the point. All I’m saying is what he’s saying in different words, namely that people move to Portland for its lifestyle and amenities. This is exactly what every Portland booster claims, namely that what they’ve created is attractional. I’m simply pointing out the obvious: people move to Portland primarily for lifestyle and leisure, not career or economic reasons. People move to Portland because they want to live there.

    Portland’s economy has actually picked up of late. Its unemployment fell below the national average in 2013 after having been above it for 14 straight years. But I want to highlight a disconnect between a couple measures of economic performance.

    I’ve written many times that Portland has done very well in terms of per capita GDP. In fact, from 2001 to 2013 (the maximum range of data available from the feds), Portland was #1 out of all 52 large metros in the US in its percentage increase in real per capita GDP.

    On the other hand, looking at how much of that economic value ends up in people’s pockets tells a different story. From 2001 to 2012 (I don’t think 2013 has been released yet), Portland only ranked 40th out of 52 in its percentage increase on this metric. Portland declined from a per capita income of 104.9% of the US average in 2001 to 98.6% in 2012.

    I threw this divergence into a quick chart:


    portland-gdp-vs-persinc

    It would be interesting to dig into these numbers. I did a quick back of the envelop calculation of total GDP growth by industry. Only a few industry totals are available, but the biggest gainer was Manufacturing, up 300%. Education, Health, and Social Assistance were #2, followed by Professional and Business Services. Natural Resources, Retail. Information, and FIRE were at the bottom.

    Speaking of San Jose, I see an even more remarkable divergence there. It was #2 in per capita GDP growth over the 2001-2013 time frame. Looking at the overall Bay Area total real GDP, it increased by 30.1% from 2001 to 2013. Keep in mind I’m using the inflation adjusted figured here, so there’s no inflation in that metric. But at the same time the Bay Area lost 2.4% of its jobs.

    The Bay Area grew its economy by almost a third while shedding over 75,000 jobs. Pretty remarkable.

    Aaron M. Renn is an independent writer on urban affairs and the founder of Telestrian, a data analysis and mapping tool. He writes at The Urbanophile, where this piece originally appeared.

    Portland Oregon” by Jamidwyer – Own work. Licensed under Public domain via Wikimedia Commons

  • Metro Area Gross Domestic Product

    The Bureau of Economic Analysis is out with the preliminary numbers for 2013 metro area GDP (see the press release). Here is a spreadsheet with per capita GDP data for all large metros.

    We’ve now got enough data that it’s worthwhile to start tracking the trend vs. a 2010 base instead of 2000. With that, here are the top ten large metros by real per capita GDP:

    Rank Metro Area 2013
    1 San Jose-Sunnyvale-Santa Clara, CA 100,115
    2 San Francisco-Oakland-Hayward, CA 78,844
    3 Seattle-Tacoma-Bellevue, WA 74,701
    4 Boston-Cambridge-Newton, MA-NH 74,643
    5 Washington-Arlington-Alexandria, DC-VA-MD-WV 73,461
    6 Houston-The Woodlands-Sugar Land, TX 72,258
    7 New York-Newark-Jersey City, NY-NJ-PA 69,074
    8 Portland-Vancouver-Hillsboro, OR-WA 68,810
    9 Hartford-West Hartford-East Hartford, CT 66,870
    10 Salt Lake City, UT 62,008

    San Jose cracks the $100,000 barrier, though that’s in part to the Bay Area being split into two metros, and the base year for constant dollar calculations getting switched from 2005 to 2009. But still impressive.

    This list is similar to what we’ve seen before. But how are things changing? Let’s look at the top ten large metros for percent change in their real per capita GDP from 2010 to 2013:

    Rank Metro Area 2010 2013 Pct Change
    1 Houston-The Woodlands-Sugar Land, TX 63,816 72,258 13.23%
    2 San Jose-Sunnyvale-Santa Clara, CA 89,806 100,115 11.48%
    3 Portland-Vancouver-Hillsboro, OR-WA 63,025 68,810 9.18%
    4 Columbus, OH 50,370 54,493 8.19%
    5 Grand Rapids-Wyoming, MI 41,248 44,482 7.84%
    6 Charlotte-Concord-Gastonia, NC-SC 51,819 55,802 7.69%
    7 Oklahoma City, OK 45,993 49,441 7.50%
    8 Salt Lake City, UT 57,790 62,008 7.30%
    9 Nashville-Davidson–Murfreesboro–Franklin, TN 50,464 54,112 7.23%
    10 Detroit-Warren-Dearborn, MI 46,314 49,653 7.21%

    A full map of this metric is below.

    percent-change-per-capita-gdp-2010-2013
    Percent change in real per capita GDP, 2010-2013.

    Houston’s #1 showing is very impressive. This is a per capita value remember, so they aren’t on top just by virtue of adding lots of people. And they are in the top ten for 2013 per capita, so it’s not like they started on a low base or something.

    Portland and San Jose continues their strong showing in this metric (more on these metros to come next week). Two metros in Michigan made the top ten, though some of that I’d speculate must come from the auto industry recovery, meaning it’s cyclical in nature.

    I’ll throw in the total real GDP figures as well, but obviously these heavily align to population. Here are the ten biggest metro GDPs in 2013 (amounts in millions of dollars):

    Row Geography 2013
    1 New York-Newark-Jersey City, NY-NJ-PA 1,377,989
    2 Los Angeles-Long Beach-Anaheim, CA 775,967
    3 Chicago-Naperville-Elgin, IL-IN-WI 550,793
    4 Houston-The Woodlands-Sugar Land, TX 456,177
    5 Washington-Arlington-Alexandria, DC-VA-MD-WV 437,085
    6 Dallas-Fort Worth-Arlington, TX 413,627
    7 Philadelphia-Camden-Wilmington, PA-NJ-DE-MD 358,091
    8 San Francisco-Oakland-Hayward, CA 356,081
    9 Boston-Cambridge-Newton, MA-NH 349,652
    10 Atlanta-Sandy Springs-Roswell, GA 288,175

    And the top ten in total real GDP growth percentage, 2010-2013.

    Rank Metro Area 2010 2013 Pct Change
    1 Houston-The Woodlands-Sugar Land, TX 379,595 456,177 20.17%
    2 San Jose-Sunnyvale-Santa Clara, CA 165,435 192,184 16.17%
    3 Austin-Round Rock, TX 86,546 98,126 13.38%
    4 Portland-Vancouver-Hillsboro, OR-WA 140,717 159,266 13.18%
    5 Charlotte-Concord-Gastonia, NC-SC 115,229 130,318 13.09%
    6 Oklahoma City, OK 57,856 65,246 12.77%
    7 Nashville-Davidson–Murfreesboro–Franklin, TN 84,572 95,124 12.48%
    8 Dallas-Fort Worth-Arlington, TX 368,015 413,627 12.39%
    9 Salt Lake City, UT 63,090 70,719 12.09%
    10 San Antonio-New Braunfels, TX 80,101 89,463 11.69%

    Richard Florida posted some thoughts on this data over at City Lab. I’m less bothered than he is by Washington, DC’s poor performance, however. Much like Detroit’s cyclical upswing, I think short term turbulence in DC from the sequester and fiscal challenges was to be expected.

    Aaron M. Renn is an independent writer on urban affairs and the founder of Telestrian, a data analysis and mapping tool. He writes at The Urbanophile.

  • A Look at College Degree Migration

    Net migration of people to or from metro areas is reported annually by the Census Bureau and widely discussed.  Less well known is that their American Community Survey (ACS) provides migration figures broken down by characteristics such as race, age, income, and educational attainment. This lets us drill into finer grained details about who is moving where.

    Here is a map of net migration of people with a bachelor’s degree or higher, based on data from the 2007-2011 ACS, with blue indicating net migration gains and red net migration losses:


    Net domestic migration of adults age 25+ with a bachelor’s degree or higher by metropolitan area. Source: 2007-2011 ACS with rollups and mapping via Telestrian

    Unsurprisingly, this data correlates with overall net migration. For example, at first glance it might seem odd that a metro area like New York would be a net loser of people with college degrees. It lost a net of nearly 29,000 of them, highest net outflow in the country. But the New York metro as a whole lost almost two million people to domestic migration during the 2000s.  Given that, it would be surprising indeed if the region didn’t lose people with degrees. It’s similar for runners-up in the loss department Los Angeles (-11,000) and Chicago (-9,500).

    The list of leaders is unsurprisingly headed by Austin, Texas (+9,500), Dallas (+9,200) and Phoenix (+9,200) and other population boomtowns. But there are some areas that punch above their weight versus overall migration, such as #5 Portland (+7000) and #9 Washington, DC (+5000). These cities are known as talent magnets and this data points in that direction. Their net in-migration is disproportionately highly educated.

    I have rounded the numbers above because this data is based on samples with a margin of area. Keep in mind when reviewing the tables below with detailed statistics not to read into this a false degree of precision.

    Regions like New York, Los Angeles, and Chicago can take heart from the fact that they are still among the top destinations of in-migrants with college degrees.

    Rank

    Metro Area

    In-Migrants

    1

    New York-Newark-Jersey City, NY-NJ-PA

    79,156

    2

    Washington-Arlington-Alexandria, DC-VA-MD-WV

    74,048

    3

    Los Angeles-Long Beach-Anaheim, CA

    66,209

    4

    San Francisco-Oakland-Hayward, CA

    49,980

    5

    Chicago-Naperville-Elgin, IL-IN-WI

    49,016

    6

    Dallas-Fort Worth-Arlington, TX

    47,198

    7

    Atlanta-Sandy Springs-Roswell, GA

    44,892

    8

    Boston-Cambridge-Newton, MA-NH

    42,006

    9

    Houston-The Woodlands-Sugar Land, TX

    37,408

    10

    Phoenix-Mesa-Scottsdale, AZ

    36,349

    Domestic In-Migration, Adults 25+ with a bachelor’s degree or higher. Source: 2007-2011 ACS with rollups and analysis via Telestrian

    Unfortunately for them, even higher numbers of people left.

    Rank

    Metro Area

    Out-Migrants

    1

    New York-Newark-Jersey City, NY-NJ-PA

     108,118

    2

    Los Angeles-Long Beach-Anaheim, CA

     77,190

    3

    Washington-Arlington-Alexandria, DC-VA-MD-WV

     69,179

    4

    Chicago-Naperville-Elgin, IL-IN-WI

     58,680

    5

    San Francisco-Oakland-Hayward, CA

     47,201

    6

    Boston-Cambridge-Newton, MA-NH

     45,407

    7

    Atlanta-Sandy Springs-Roswell, GA

     40,363

    8

    Philadelphia-Camden-Wilmington, PA-NJ-DE-MD

     38,640

    9

    Dallas-Fort Worth-Arlington, TX

     37,958

    10

    Miami-Fort Lauderdale-West Palm Beach, FL

     34,191

    Domestic Out-Migration, Adults 25+ with a bachelor’s degree or higher. Source: 2007-2011 ACS with rollups and analysis via Telestrian

    This in part reflects the status of America’s tier one cities as talent refineries. People move there after school when young, but then leave after they get older and have been upskilled by their experiences – and when their life priorities change.  We should expect cities like New York to have a lot of churn.

    A place like New York can also take solace in the fact that its migration loss of the college degreed was better than for those with lesser educational attainment.  Metro New York has 37% college degree attainment, but college grads only accounted for 28% of net migration losses. This is good news from the standpoint of retaining highly educated people, but raises the question of why New York is not so attractive to those without degrees.

    While each metro area has its own nuanced story to tell in migration, on the whole this report shows that the migration of the educated overall appears to be following that of the population as a whole. This means increasing numbers of people with college degrees moving to lower-cost Sunbelt boomtowns and other metros with rapidly expanding populations.

    Here is a complete ranking of net migration for adults with college degrees for all metro areas greater than one million people.

    Rank

    Metro Area

    Net Migrants

    1

    Austin-Round Rock, TX

     9,384

    2

    Dallas-Fort Worth-Arlington, TX

     9,240

    3

    Phoenix-Mesa-Scottsdale, AZ

     9,208

    4

    Houston-The Woodlands-Sugar Land, TX

     8,015

    5

    Portland-Vancouver-Hillsboro, OR-WA

     6,933

    6

    Denver-Aurora-Lakewood, CO

     6,132

    7

    Seattle-Tacoma-Bellevue, WA

     5,935

    8

    Riverside-San Bernardino-Ontario, CA

     5,308

    9

    Washington-Arlington-Alexandria, DC-VA-MD-WV

     4,869

    10

    Raleigh, NC

     4,674

    11

    Tampa-St. Petersburg-Clearwater, FL

     4,665

    12

    San Antonio-New Braunfels, TX

     4,542

    13

    Atlanta-Sandy Springs-Roswell, GA

     4,529

    14

    Charlotte-Concord-Gastonia, NC-SC

     4,096

    15

    San Francisco-Oakland-Hayward, CA

     2,779

    16

    Jacksonville, FL

     2,113

    17

    Kansas City, MO-KS

     2,072

    18

    Nashville-Davidson–Murfreesboro–Franklin, TN

     2,069

    19

    Sacramento–Roseville–Arden-Arcade, CA

     1,816

    20

    Louisville/Jefferson County, KY-IN

     1,647

    21

    Oklahoma City, OK

     1,189

    22

    Baltimore-Columbia-Towson, MD

     1,157

    23

    New Orleans-Metairie, LA

     985

    24

    Richmond, VA

     931

    25

    Birmingham-Hoover, AL

     905

    26

    Salt Lake City, UT

     844

    27

    Las Vegas-Henderson-Paradise, NV

     745

    28

    Pittsburgh, PA

     179

    29

    Cincinnati, OH-KY-IN

     32

    30

    Indianapolis-Carmel-Anderson, IN

     2

    31

    Minneapolis-St. Paul-Bloomington, MN-WI

     (46)

    32

    Columbus, OH

     (343)

    33

    San Diego-Carlsbad, CA

     (476)

    34

    Virginia Beach-Norfolk-Newport News, VA-NC

     (610)

    35

    Milwaukee-Waukesha-West Allis, WI

     (723)

    36

    Hartford-West Hartford-East Hartford, CT

     (749)

    37

    Memphis, TN-MS-AR

     (928)

    38

    Buffalo-Cheektowaga-Niagara Falls, NY

     (1,139)

    39

    St. Louis, MO-IL

     (1,199)

    40

    Miami-Fort Lauderdale-West Palm Beach, FL

     (1,225)

    41

    Rochester, NY

     (1,295)

    42

    Providence-Warwick, RI-MA

     (1,366)

    43

    Cleveland-Elyria, OH

     (1,563)

    44

    San Jose-Sunnyvale-Santa Clara, CA

     (1,825)

    45

    Orlando-Kissimmee-Sanford, FL

     (2,603)

    46

    Boston-Cambridge-Newton, MA-NH

     (3,401)

    47

    Philadelphia-Camden-Wilmington, PA-NJ-DE-MD

     (4,127)

    48

    Detroit-Warren-Dearborn, MI

     (9,472)

    49

    Chicago-Naperville-Elgin, IL-IN-WI

     (9,664)

    50

    Los Angeles-Long Beach-Anaheim, CA

     (10,981)

    51

    New York-Newark-Jersey City, NY-NJ-PA

     (28,962)


    Aaron M. Renn is an independent writer on urban affairs and the founder of Telestrian, a data analysis and mapping tool. He writes at The Urbanophile.

  • Germany Also Having Big Problems Building Infrastructure

    Der Spiegel had an interesting article recently called “Angry Germans: Big Projects Face Growing Resistance.” The article (linked version is English) talks about how it is increasingly difficult to get infrastructure projects built in Germany.

    Wherever ambitious construction ventures loom on the horizon in Germany — from the cities to the countryside, from the coastlines in the north to the Black Forest in the south — opponents are taking to the streets…. As the public’s enthusiasm for constant innovation has lessened, so has the appeal of these sorts of projects, and, as a result, they now inevitably come accompanied by picketers. Germany’s graying society, it seems, is so cozy and settled that it resists anything threatening to upset the status quo. In the process, it has lost sight of the bigger picture.

    There are a lot of key points in this article that immediately raised parallels to the United States, where infrastructure projects are also under increasing siege. In fact, some of this reminded me of elements of the Tea Party movement. The protestors are uninterested in compromise. They are devoted, full time activists who are unrelentingly opposed to the projects in question:

    [Hartmut] Binner’s form of protest has a radical undercurrent: Well-informed, confrontational and devoid of respect for authority, he is typical of the new grassroots activism spreading across Germany.
    ….
    Binner’s entire life revolves around the campaign. He monitors the routes of departing and landing planes. He plays his self-designed noise simulator on market squares. He kicks off his court appearances by singing the Bavarian national anthem. “If you want to be heard as a member of the public, you need to push the envelope,” he shrugs.

    These days, he sees grassroots protests, activism and political responsibility from a different perspective. “The typical protesters are gray-haired, know-it-alls and very networked,” [Freiburg Mayor Dieter Salomon] says. “But they’re not remotely interested in consensus-building, political processes and pluralism.”

    Grassroots groups have become so livid, intransigent and single-minded that even the most respected politician in the country, Angela Merkel, is feeling their sting. In early May, hundreds of furious residents had gathered in central Ingolstadt to protest against the construction of a power line from Bad Lauchstädt in Sachsen-Anhalt to Meitingen in Bavaria.

    This certainly reminds me of the no-compromises view of the Tea Party. Also, a number of early American Tea Party activists were unemployed, and thus able to basically be full time activists. Even the singing of national anthem has echoes of the Tea Party and their tricorn hats. I don’t want to claim there’s a philosophical or other link between the Tea Partiers and Germany, however.

    Not everything lines up with the Tea Party, however. In Germany it seems to be disproportionately retirees who are the most engaged and militant:

    Germany’s graying society, it seems, is so cozy and settled that it resists anything threatening to upset the status quo. In the process, it has lost sight of the bigger picture.

    Many of the protestors are pensioners with no vested interest in Germany’s future. “It’s striking that the leader of the protests against the Munich runway is a 75-year-old and not someone in the middle of his working life,” [Munich Airport CEO Michael Kerkloh] points out.

    Salomon’s nemesis is Gerlinde Schrempp, a determined and argumentative 67-year-old retired teacher with attitude to spare. She’s the leader of the Freiburg Lebenswert movement, which translates roughly to “make Freiburg worth living in. The movement just got elected on to the district council and is first and foremost opposed to any new building in the city.

    There’s a stereotype out there of the average Republican voter as an old white guy. But the average Tea Party activist I’ve seen tends to be working age. I look at this one a bit differently. We need to see these types of controversies against the substrate of an aging population. Aging populations are not noted for dynamism, and older people’s self-interest is better served by starving investment for the future in order to save money and avoid uncomfortable change in the present. As a country whose population is projected to decline into the future thanks to this demographic inversion, we are seeing in Germany what’s likely a preview of coming attractions elsewhere around the world.

    Indeed, I’m reminded of what one analyst friend of mine in Indiana has said about the property tax caps there. He sees the push to cap property taxes as driven by an aging population in a stagnant state. Old people generally aren’t earning a lot of taxable income nor are they buying huge amounts of stuff, so they are disproportionately less affected by income and sales tax hikes, whereas they often own homes and are hit hard by property taxes. Thus property tax caps serve as another income transfer mechanism from young to old, holding revenue constant. They are in part an artifact of an aging society. Disinvestment in infrastructure can be seen in the same light.

    But there’s another part of this that shines a light on yet another group of opponents, namely the intelligentsia.

    The term “Wutbürger” (“enraged citizen”) was coined during the Stuttgart 21 fiasco to describe people like Hartmut Binner, and much has been written about them since. They often aren’t the “common man.” According to the Göttingen Institute for Democracy Studies, they tend to be highly educated people with steady incomes and white collar jobs. And while protests movements of the past were often steered by sociologists, today their leaders are more likely to stem from the technical professions, the researchers found.

    When we look at opposition to infrastructure in the United States, at least certain types of infrastructure, we see a similar profile of people (though not necessarily technical) behind it. It’s the leftist intelligentsia that oppose the Keystone Pipeline, suburban highway projects, fracking, and many other types of things, often with a militant unwillingness to compromise similar to the Tea Party.

    As with Germany, this opposition is enabled by environmental reviews and public participation laws that, while they serve important public purposes, make it easy to delay projects for years through repeated objections and scorched earth litigation. Traditionally environmental lawsuits were associated with the left, but conservatives have started saying, why not us too? Hence litigation against San Francisco’s regional plan. The Hollywood densification plan was recently overturned by lawsuits, and lawsuits have plagued California’s proposed high speed rail line as well.

    Whatever the project, it’s sure that somebody on the left and/or the right hates it, and thus will do everything in their power to kill it, which probably means years of delays and untold millions in increased costs.

    Also as with the United States, German governments have shot themselves in the foot with a series of financial debacles:

    Political and bureaucratic bodies are partly to blame for their own diminished authority. Every major venture seems to entail spiraling costs. Berlin’s new airport was supposed to cost €1.7 billion, a price tag that has shot up to well over €5 billion. Meanwhile, the €187 million earmarked for the Elbphilharmonie concert hall under construction in Hamburg is expected to exceed €865 million by the time the project is completed. Albig is well aware how bad this looks. “People see us as financially incompetent,” he says.

    Until politicians can convince the public they have a handle on this, the taxpayer will remain rightly skeptical of many major megaprojects. This is doubly true since it’s very clear, as has been documented by folks like Oxford professor Bent Flyvbjerg, that in many of these cases the politicians were simply lying all along about the real costs.

    I’m not sure what all the takeaways are, but there are clearly many forces operating on a global basis to inhibit the development of infrastructure in the West.

    Aaron M. Renn is an independent writer on urban affairs and the founder of Telestrian, a data analysis and mapping tool. He writes at The Urbanophile, where this piece originally appeared.

    MittlererSchlossgartenKundgebung 2010-10-01” by MussklprozzOwn work. Licensed under CC BY-SA 3.0 via Wikimedia Commons.