New York City is infamous for congestion and long commutes. At 34.6 minutes, it has the longest average commute time in the United State. The region is also America’s top user of public transportation, with 30.7% of all metro area commutes made by transit. Nearly 40% of all transit commuters in the United States are in the metro New York. As transit commutes generally take longer than driving, one might be tempted to link these facts. But commute times also seem to correlate with city size, and bedevil big cities with limited public transit too.
New York’s commutes improved a bit over the 2000s, however. The average commute time declined in every borough, in the city as a whole, and in the region. Overall US commute times fell as well, but less than New York’s:
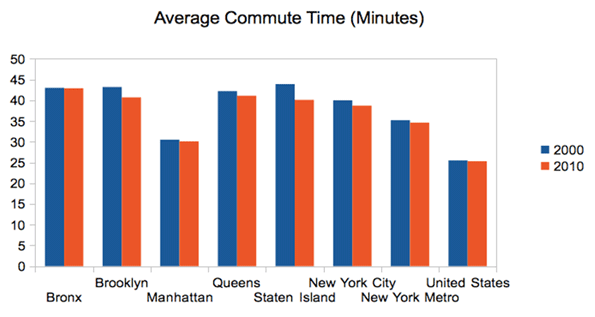
Source: Census 2000, American Community Survey 2010 1-yr
In addition to showing the decline, this chart also highlights disparity in commute times between the subareas of New York. Manhattanites have far shorter commutes than those who live in the outer boroughs. In fact, the outer boroughs actually have longer commutes than far-flung outer suburban areas. The areas just outside the urban core of New York are some of the most disadvantaged for regional commuting
The commute time decline is particularly noticeable when looking at ultra-long commutes, those that are 90 minutes are longer:
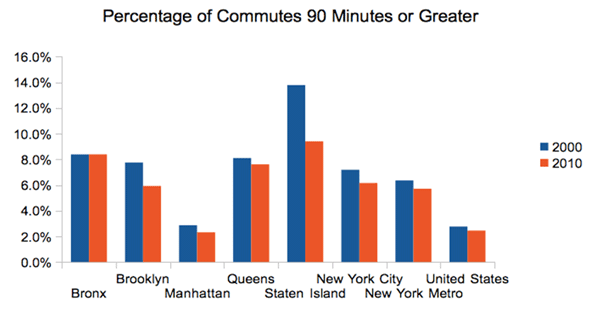
Source: Census 2000, American Community Survey 2010 1-yr
Here again we see both a decline in long commutes and a higher concentration in the outer boroughs.
New York also managed to finish out the decade with no increase in traffic congestion. According to the Texas Transportation Institute, the region ended the decade with the same Travel Time Index it had when it started, 1.28:
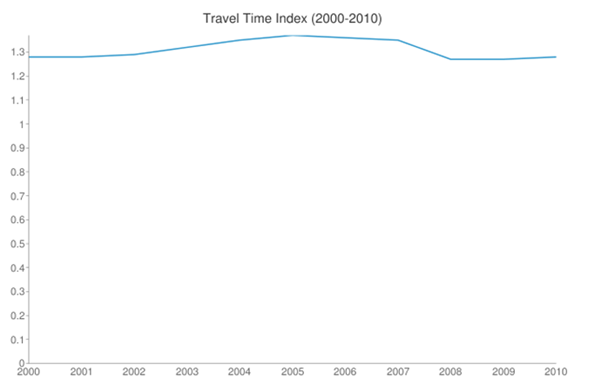
Source: Texas Transportation Institute, Urban Mobility Report 2011
What has caused this? Firstly, given that the data is collected in surveys with a margin of error, one shouldn’t read too much into any given year’s value. However, the decline was fairly consistently reflected in the later decade surveys and doesn’t appear to be an anomaly of just 2010.
Assuming some legitimate improvement, one obvious potential explanation is the economy. Metro New York did lose 99,000 jobs in the 2000s. This was only a decline of 1.2% however, which actually bettered the US as a whole. But given the extreme congestion in the region, it clearly could have played a role. Also not to be dismissed are toll increases in the regions, and even potentially changes resulting from 9/11.
Given the focus of the Bloomberg administration on non-auto forms of transportation, it is also worth looking at changes there. Public transit usage grew strongly in New York over the decade, with regional trips increasing by 23%.
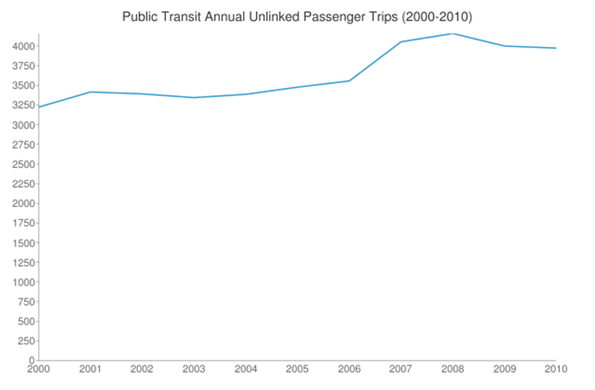
Source: Texas Transportation Institute Urban Mobility Report 2011
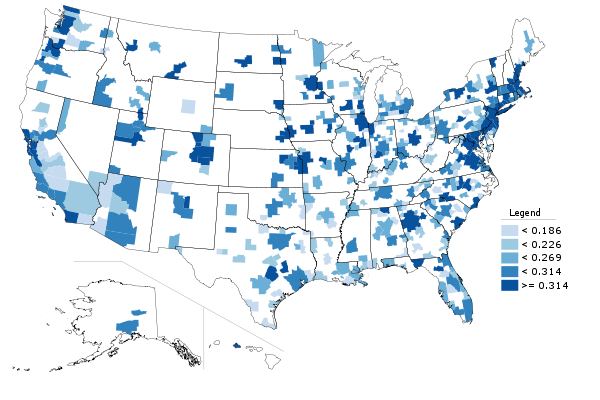
This increase is also reflected an increase in public transportation commuting mode share over the past decade.
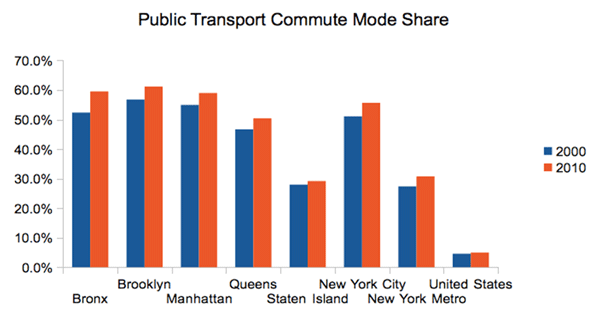
Source: Census 2000, American Community Survey 2010 1-yr
So should increased public transit ridership get the credit for commute time reductions? To some extent perhaps. But remember that New York has both the nation’s longest commutes and highest public transit ridership. Also keep in mind that public transit commutes are longer than driving commutes. The average commute time in metro New York for those driving alone is 30 minutes. For those riding public transportation it is 51.2 minutes. But transit riders affect drivers too. Public transit saves drivers in the New York area nearly $8 billion per year in congestion costs. So while public transit can’t be necessarily given the credit for commute time improvements, it’s certainly possible it contributed to them .
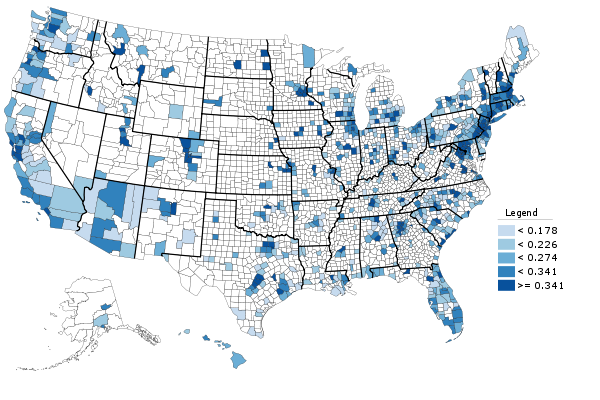
The same is not true, however, for other alternative transport modes. Here is the change in bicycle commuting over the decade:
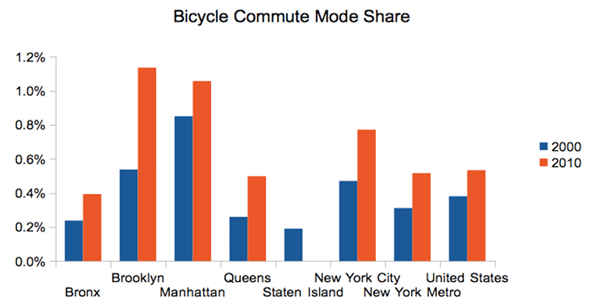
Source: Census 2000, American Community Survey 2010 1-yr
Bicycling gets a lot of press in New York, and while the increases look impressive on a chart like the one above, the reality is that this is a trend that enjoys only a bit more than half a percentage point gain in mode share. Bicycling may be on an upswing, and may be of great help recreationally and for non-commute trips, but it is not yet a major force in commuting.
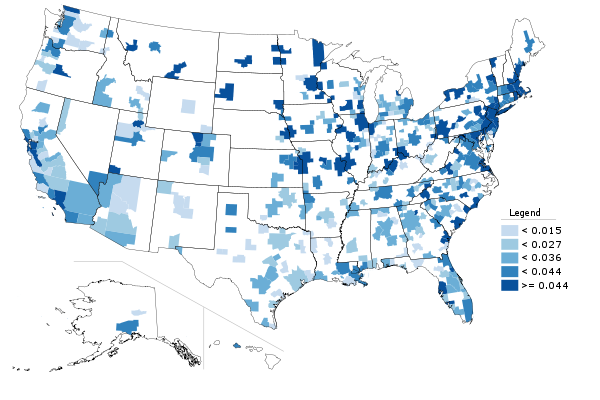
Walking is actually far more prevalent than bicycling for commuting in New York. But the mode share for walking actually declined over the decade:
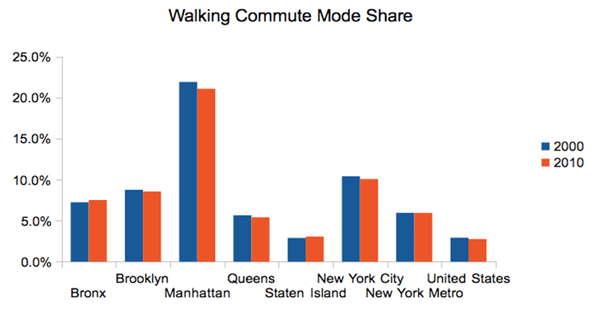
Source: Census 2000, American Community Survey 2010 1-yr
While walking is generally seen as a good thing in urbanist circles, some people can end up walking to work simply because they have no other alternatives. People who obtain access to a car, or who are able to use transit to get a job outside of their neighborhood, may in fact be improving their economic prospects. Some people who previously walked may be riding transit or biking to work today. Also, some walkers may have switched to driving. Interestingly, the number of households without a vehicle declined in metro New York, though some boroughs saw increases. The changes are very small, however.
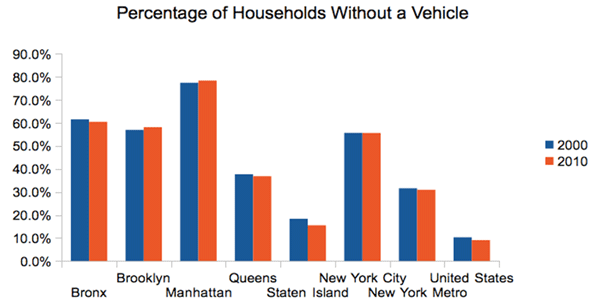
Source: Census 2000, American Community Survey 2010 1-yr
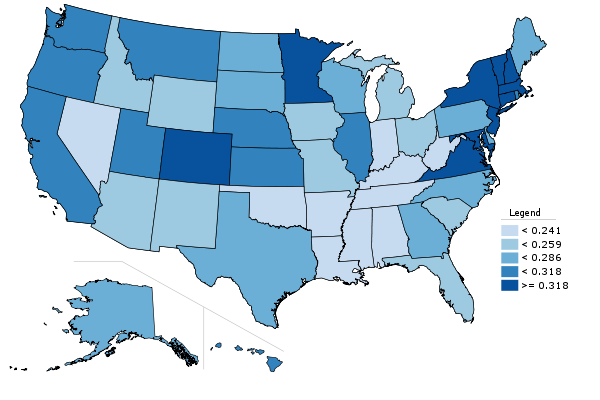
Lastly, as you might expect with transit going up, the percentage of commuters driving alone declined nearly across the board in New York, though it increased nationally:
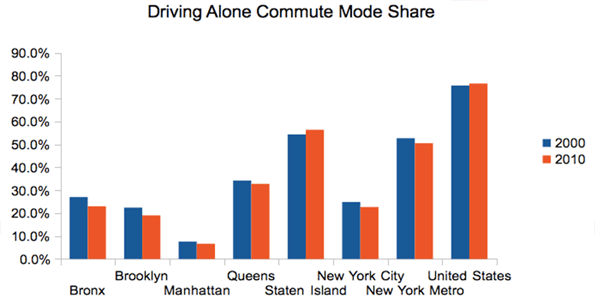
Source: Census 2000, American Community Survey 2010 1-yr
In short, New York retains America’s longest commutes and highest public transport usage. But in the last decade there have been increases in public transport commuting and declines in people driving alone, while overall commute times have improved, fewer people with ultra-long commutes, and road congestion has stayed flat. The 2000s were perhaps an unusual decade in America and New York. And the changes are fairly small so far. The future will tell whether this is the start of a long term trend or merely a short term reversal.
Aaron M. Renn is an independent writer on urban affairs based in the Midwest. His writings appear at The Urbanophile. Telestrian was used to analyze data and to create maps for this piece.