Author: Alan Pisarski

  • Millennials Yesterday and Today

    Every generation seems to be lionized by the press with the observation that the values of the new group are not that of their parents, thank goodness. They don’t have the serious hunger for possessions, the terrible acquisitiveness for material things that define their parents’ generation. Rather, as seen by the reporter, they have loftier views of society, generally the views of the reporter or the views that the reporter wishes to have us believe they hold. One recalls how the baby boomers were “not like us”. They were going to live on the land somewhere in the high sierras making sandals and candles. Some years later when it was revealed that the Pentagon was paying two thousand dollars for special toilet seats, the question among boomers was in what colors were they available.

    Today much has been made of the sharply varying characteristics of the Millennial generation. During the recession and its prolonged twilight recovery we had to keep asking: “is it really a structural change we are seeing or just cyclical?” We have found in most cases when some see harbingers of dramatic changes in societal values it is often just economic realities at work. Wait for the data is a great admonition in such cases.

    A recent Current Population Report from the Census Bureau sheds considerable light on the topic. The powerful tool employed compares young adults in 1975 to those in 2016 roughly 40 years apart. The overarching observation is that the younger working age generation today appears to place more emphasis on two of the four markers of adulthood – education and a job – before the other recognized attributes of adulthood such as living separate from parents and family formation. Economic security appears to be the dominant driver of behavior. Given that they were exposed to a weaker economy than their forebears– wealth lost, jobs lost, college debt, home values and investments declining – it seems a very realistic strategy.

    Some of the contrasts with the past are stark:

    • Of the four markers of adulthood 45% of the young adults in 1975 had those attributes; by 2016 it had fallen to 24%. In 2005 those markers were the predominant living arrangement in 35 states; by 2015 only a decade later, post-recession, the number of states with most of young living independently dropped to just 6.

    • More young adults today, 18 to 34, are living with parents than with a spouse.

    • More than half of younger millennials, 18-24, live in their parent’s home.

    • Fewer than two-thirds of older millennials, 25-34, live independently.

    • One in four of the 25-34 group are neither in school nor working.

    Many of these attributes seem to be cases of full societal participation delayed, rather than dismissed. The report finds marriage levels are about the same by age 40 between the current and the past 1975 generation. The difference is, if you will, delayed adolescence. About 80% of young persons were married by the age of 30 in 1975 the same percentage today isn’t reached until age 45.

    What is dramatically revealed in the document are the sharp divergences between the trends among men and women in the period. Young women are seeing significant economic gains today in contrast to 1975 while men have experienced limited progress, or even decline. Some of the contrasting experiences are summarized in the table below:

    Characteristics of Young Adults Aged 25-34

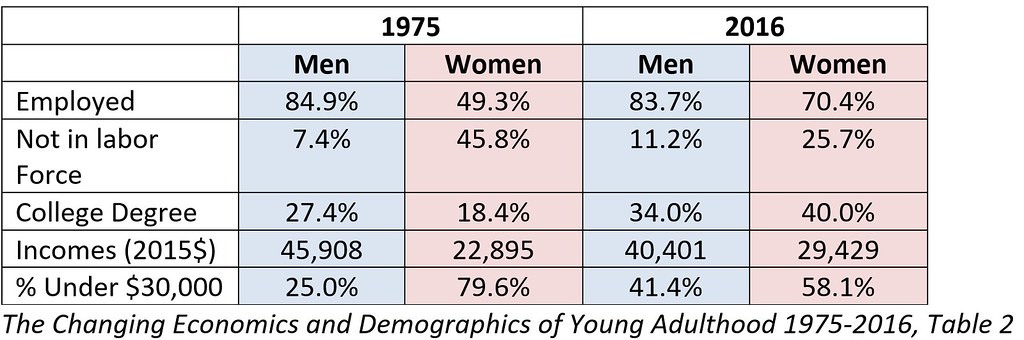
    There are really three stories here: the rising circumstances of women; the very limited improvements, if any, among men; and the dramatic contrasts between the groups over time.

    • Women out of the labor force have declined from 46% to 26%. Men out of the labor force have grown from 7% to 11%.

    • Women have risen from about 50% participation in the labor force to almost 75%, with 40% with college degrees today vs 18% in 1975, and with incomes shifting out of the lowest income categories and overall incomes rising significantly.

    • Among young men, aged 25 to 34, in 1975, 25% had incomes below $30,000 per year, in 2016 dollars, rising to 41% below $30,000 in 2016. The percentage of men with college degrees has risen somewhat from 27% to 34%, but most significantly, incomes on a constant dollar basis have declined about 10%. Note also that women in the age group now have a greater share with college degrees than men; 40% vs 34%.

    • Importantly, a substantial share of women has left the lowest income group while a similarly significant share of men has joined it.

    • With all these gains, women’s incomes are still below men’s, substantially because women have moved from lower into middle income categories but not yet joined the higher income levels.

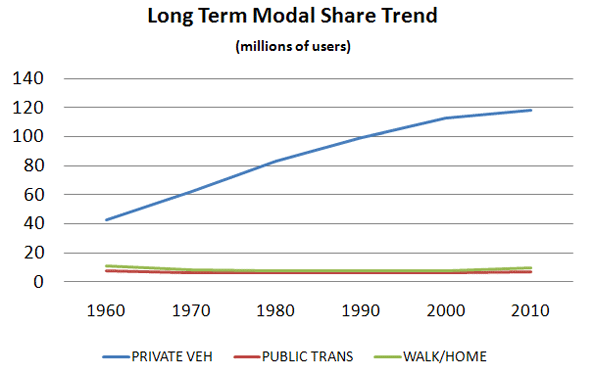
    Are these changes economically based or values driven? The massive economic pressures on young males would have immense explanatory power. Their delayed ownership of vehicles, the postponement of separate living seems a rational response to their circumstances. Maybe rather than criticizing them, they should be appreciated today for exercising good judgment.

    At the same time, the value changes recognized in the Census study seem to say that the measure of adulthood today emphasizes having completed one’s education and having obtained some degree of job security. These appear to come first, driven perhaps by the harsh realities of the last decade’s job environment which explains the delays in two factors historically linked to adulthood: living separately from parents; and marriage. These are now pushed into secondary, later stages in the life cycle.

    Going forward the societal implications of these new patterns may be more significant than reporters ever estimated. Delayed job experience and exposure to the work environment may affect the job prospects of many and generate societal losses in skilled workers crucial to national productivity. As mates and parents their delayed relationships will be different than their parents’ world with impacts we can only guess at in terms of their relationships to each other, their children, and the greater society.

    Alan E. Pisarski is the author of the long running Commuting in America series. A consultant in travel behavior issues and public policy, he frequently testifies before the Houses of the Congress and advises States on their investment and policy requirements.

    Photo: ITU Pictures, via Flickr, using CC License.

  • A Commentary on the Notion of Extreme Commutes

    A recent piece by Joe Cortright in the City Observatory touched on the often discussed issue of extreme commutes, a favored topic among reporters complaining about sprawl and traffic congestion. The notion of extreme commutes is obviously a fun topic. But it is one that is ripe for analysis based on  travel time data that has been available through the Census since 1980 .

    Reporters like to focus on the longest commutes, generally anything more than an hour.  In early census data many of the travel time tabulations presented an upper limit category of “45 minutes or more”.   The 1980 census showed an average travel time of 21.7 minutes, rising to 22.4 minutes in 1990, a rather trivial increase of about 40 seconds in a decade in which we added 22 million commuters driving alone.  Not surprisingly such consumption of our road capacity couldn’t continue and in 2000 average travel times rose by more than three minutes despite an increase on the order of only 13 million solo drivers.  

    In my early work in Commuting in America I realized that averages are dangerous things, especially when the subject is speeds and travel times, so I began tracking the percentage of commuters who got to work in under 20 minutes and more than 60 minutes.  Twenty minutes is used because if you got to work in under 20 minutes you had absolutely nothing to complain about; and if you were over an hour then maybe some sympathy was in order.  As the data got better and the travel times got worse the Census Bureau introduced the notion of a 90 minute or greater commute which they labeled an “extreme commute”. 

    What’s behind it all? Is it as catastrophic as the average reporter will try to make it?  (They always manage to find someone who gets up at 4 am and travels three hours on a bus from Pennsylvania to Manhattan).  Examining the current trends reintroduced the substantial concern that all analysts must recognize – you have to keep asking: “is this a new trend I am seeing or just another part of the long, slow recovery from an extreme economic event?”  The passage of time suggests the latter, often to the disappointment of those who saw a new dawn of the behaviors they tend to endorse. The figure below shows that between 2000 and 2012 travel times were effectively constant at 25.5 minutes. After that, as employment began to improve travel times inched forward to 26 minutes in the 2014 ACS data. 

    Looking at the longer term patterns, back in 1990 just about half of the workers in America got to work in under 20 minutes.  That dropped to 45% in 2000 and now is trending further down to about 43% in 2014.   Much of the Midwest is still in that range, and if you add in the dramatic increases in those who work at home then we are still in the 50% range in much of America. 

    In comparaison the over 60 minutes category  is remarkably small. In 1990 we were at about 6% and at 8% in 2000. It has been rising slowly and at the present rate of change we still won’t reach 9% in this decade.  Having said that, we must recognize that we are now talking about over 11 million workers in the 60 minute plus category.

    Looking in greater detail at the disaggregate patterns we see that the trend in 60 to 89 minutes continued to rise, while the over 90 minute element dropped off.  What happened is that both categories rose through 2008 or so and then with the recession dropped off and now have gone through a slow resumption of expansion in the new decade.  

    Some of the trends that define travel

    One would expect that when jobs are scarce, as during the recent recession and long limited recovery, the average distance people would be willing to travel to find work would increase.   Not finding a  job in a preferred 30 minute travel time labor market shed around one’s home makes expansion to 45 minutes or an hour more feasible after being unemployed for months.  I am sure much of that happened, but the broad statistics tell a varying story.  The share of commuters over 90 minutes dropped; two important factors were in play that overwhelmed the statistics:

    #1 there’s nothing like 10% unemployment to improve congestion. When the number of workers declined road speeds improved, or at least didn’t continue to get worse.  So a previous 90+ minute trip might have improved to 85 minutes.   When your travel mate lost his job your solo commute got to be shorter.

    #2  The more important factor was that the kinds of jobs lost in the recession were exactly those that tended to be long distance.  A large share of the job losses were in construction and factory work.  Home construction, of course, mostly occurs at the edges of the region where workers often arrive by carpool.  And large factories today are often located in rural areas for logistical purposes – with workers traveling immense distances – for example  the car plants and refineries of the south. Note also that there were parallel very severe declines in carpooling in the period.  This was at least one of the many factors in that decline.  As the economy slowly improved we have seen the return to greater travel times as construction, manufacturing and other activities return and roads congest again. 

    The significant long term factors we need to recognize in our assessments of future prospects are these:

    The key driver of future commuting will be the need to find replacements for the retiring baby-boomers, particularly skilled workers.  In general that suggests large metro areas where the access to a variety of workers will be greatest. The larger areas have the best answer to the question “how many people with the skills I need can I reach in a half hour’s travel commuter shed from this location?” 

    One of the fundamental patterns of American commuting today is massive flows between counties.   In 1960 a bit more than nine million workers left their residence county to work, today it is over 37 million and the share of work travel is over 27% almost double the 60’s percentage.

    Planners have a dream of better “balance” in jobs and workers in communities that will promote walking/biking to work.  Some of that will happen as both suburban and central city Job/Worker ratios approach 1.0  from opposite directions. But  the realities of work travel are sharply different.  First of all about two-thirds of workers live in a household with other workers – whose job will they live near?  Workers, particularly the young, change jobs often. Will they move, incurring costs and further disruption in their lives every time they change jobs?  Not likely! 

    My own county of Fairfax County, Virginia illustrates the national pattern.  In 1980 it was a standard bedroom suburb with roughly 400,000 workers and 300,000 jobs for those workers, a J/W ratio of .73, the very definition of a suburb .  Flash forward to 2010 and the J/W ratio was at balance, .99, so that if all the workers who could, stayed in the county to work only 8,000 would have to leave to reach available jobs. But, in fact the county exported 280,000 workers and imported 272,000 with an overall flow of over 550,000 crossing its borders every day rather than 8,000. That’s what commuting is really all about.  Today, Fairfax County fits the definition of a central city with more jobs than workers yet still  the border crossings have reached over 570,000 every day.  The key point is that having a numeric balance in jobs and workers has little value, it is the match in the skills needed by employers and the skills possessed by resident workers that is crucial.

    Some closing thoughts

    These changes in a long term trend of people traveling significant distances to work with an interruption brought on by national employment trends.  The current penchant of rail transit proposals to reach farther and farther into the hinterlands to support the central city does not address the dynamic of ever more dispersed employment.  Transit has its highest share in trips over 60 minute and are a very significant part of intercounty and interstate travel.  The fact that they are a great deal slower than alternatives adds to the shares over 60 minutes. Many of our “metro” systems are closer to being commuter rail lines than city subways, BART, for example, the new Silver line in DC, for another, are excellent example.  Think if the entire subway investment in the Washington area had occurred inside the District borders, or at least inside the Beltway, there would have been a very real difference in being inside or not. 

    We can expect to see longer distance travel as more specialized skills are demanded by employers.  I recall in the eighties in China where the workers at the number one bicycle factory lived in apartments across the road and walked across the street every day to work.  Even where the government owned the factories, the housing, and the people that still didn’t work. When we are hiring systems engineers or any other highly skilled workforce element it will be even more impossible.     

    The dominant flow today is circumferential from suburb to suburb from far lower density housing to smaller work places than the number one plant in Shanghai. We don’t live outside the factory gate anymore. About 5% of those who move are seeking a better commute.  Most moving focuses on a better place with the amenities the household’s prefer and their commute is often the residual. As hard as we might try, minimizing the commute will not define people’s housing or job patterns in the future. Did I hear someone say autonomous vehicles.

    Alan E. Pisarski is the author of the long running Commuting in America series. A consultant in travel behavior issues and public policy, he frequently testifies before the Houses of the Congress and advises States on their investment and policy requirements.

    Photo by Nathan Harper, Bottleleaf

  • Brand Loyalty Dominates Trip to Work

    Many public sector mavens watch like the Dow Jones average the shares of workers using various modes of transportation on work trips to see how their favorite mode is doing.  One shouldn’t be surprised when a certain hyperbole creeps into the interpretation of the trends.   But in reality not a whole lot is changing, despite many assertions of ballooning growth from some sectors. 

     We should start in 1960 with the first census to cover the Journey to Work.  Back then about two-thirds of workers used a car or truck. More interestingly 13% were on transit, 10% walked and 7% worked at home (think farmers).   As Figure 1 indicates, effectively all of the growth in the last 50 years has occurred in the private vehicle mode.  The melding here of walking and working at home misleads a bit because walking has continually declined while, due to the internet, working at home – once the farm decline reached bottom – has been the “mode” with the greatest and most consistent share of growth in the period.


    Source: 1960-2000 decennial Census; 2010 ACS

    Meanwhile the transit and walk modes have declined in share since the last half century but seem more recently to have bottomed out and reached some base level. 1

    Table 1 shows the relatively stable pattern for the last 20 years in broad terms. 

    1990 decennial

    2000 decennial

    2010

    ACS

    WORKERS

    100%

    100%

    100%

    DRIVE ALONE

    73%

    76%

    77%

    CARPOOL

    13%

    11%

    10%

    TRANSIT

    5%

    5%

    5%

    TAXI 

    0%

    0%

    0%

    BICYCLE

    0%

    0%

    0%

    WALKED

    4%

    3%

    3%

    OTHER

    1%

    1%

    1%

    WORKED AT HOME

    3%

    3%

    4%


    For Figure 1 and Table 1, the 2000 and earlier data are from the decennial censuses. The 2010 data are from a new source, the American Community Survey, which seeks to replicate the census structure.   These data are therefore not strictly comparable.  It has been observed that the ACS has tended to understate carpooling and overstate transit despite best efforts to assure comparability.

    Given the breadth of coverage of the census, it has immense value but a better handle on the mode share question can be found in the National Household Travel Survey (NHTS) of the Federal Highway Administration.  It replicates the census question asking about the usual mode of commuting, but it asks it as part of a collection of a complete diary of a day’s travel for each member of the household. It gets the what did you do yesterday response as well for the same person.   That means we can compare the person’s responses to the two separate queries and learn a great deal about the relationships between the responses. 

    This comparison between census and NHTS products helps state and metro planners know how their surveys might map to the census and helps test the utility of the census products. Just as importantly, it provides a comparison between what people say they do and what they actually do and it tells more about what alternatives travelers shift to when they don’t do “the usual”.   

    When the NHTS asks the question in the “actually-did-yesterday” format things change, in some cases appreciably.

    ‘Usual’

    On  Travel  Day Commuted   by:

    Commute

     Mode:

    Drove Alone

    Carpool

    Transit

    Walk

    Bike

    Other

    Drove Alone

    93.5

    5.6

    0.1

    0.5

    0.1

    0.4

    Carpool

    42.9

    54.8

    0.5

    1

    0

    0.8

    Transit

    13.2

    9.2

    68.3

    6.6

    0.8

    1.9

    Walk

    6.1

    9.3

    3.4

    80.2

    0.2

    0.7

    Bike

    13.8

    3.3

    6

    2.6

    73

    1.4

    Other

    64.1

    19

    4.2

    4.3

    0.3

    8

    Source: NHTS 2009

    Quick Findings

    If we study the yellow boxes we see the “loyalty” relationship between what people say they do and what they actually do.   There are some interesting stories here.

    Drove alone:  According to the NHTS, 93.5% of the people who said they usually drive alone to work actually did.  When they didn’t they almost exclusively shifted to carpooling, with only about 1% shifting out of the auto mode.  This is basically identical to the responses in the 2001 NHTS.2

    Transit:  Only about 68.3% of usual transit users actually used it on a specific day.  The big shift is to the auto-based modes, solo driving or pooling, accounting for more than three quarters of the shift, with the remainder largely shifting to walking.  This is almost the identical loyalty share observed in 2001, but with greater shifts to the auto instead of walking.

    Walking:  Surprisingly about 80% of those who say they usually walk actually do.  Again, when these commuters don’t walk, about three/quarters of the shift is to the private vehicle, with the remainder largely shifting to transit. Also very similar in loyalty to 2001 measures, but showing some increase in transit shifts.  

    Bicycle:   biking exhibits a little less “loyalty” than walking and a little more than transit.   Biking showed a decrease in loyalty from the 77% observed in 2001, perhaps reflecting that the increases in biking we have seen among less inveterate bikers.  The shift to the auto-based modes is less pronounced than the other cases with about a 63% share of the shift.  Transit and walking each obtain appreciable shares of the remainder.   Use of the auto modes as an alternative increased substantially from 2001. 

    Carpooling:  Carpooling is the great surprise.  While transit exhibited the lowest level of loyalty of all modes in 2001 it was surpassed by carpooling in 2009.  Carpooling showed a dramatic decrease in loyalty from 75% in 2001 to 55%, in 2009.  The dominant shift is to driving alone with only about 2% shifting to non-auto modes.  So the auto-based share remains about the same as in 2001. 

    What to Make of All This

    In today’s world we have seen substantial increases in variability in trips to work  – variability  in time of departure, arrival, choice of route to work, even a choice as to whether or not one travels to work at all  with telecommuting becoming more significant every day.  We should not be surprised that there is variability in choice of mode of travel.  Some part of this may simply be that some workers see transit, biking, or walking as the socially preferred modes and will state so when asked – kind of the “good citizen” response – they know what they are supposed to want – “but yesterday was different!”    

    Clearly, auto users tend to remain auto users, with a 98-99% loyalty whether in a carpool or driving solo.  Shifting either way often means things like: the car is in the shop, my wife needs the car, or carpool buddy is on leave, lost a job, or busy doing something else.  This does tell us that carpooling is becoming less formal and more of an occasional and more flexible activity, abetted by cell phones and apps.  One could speculate that these workers often do not have a serious option to the auto.   

    Transit users’ swing is substantial, with significant implications.  Actual users come in at 3.7% of travel rather than the 5% shown for the “usually use” response.  About 3.5% are the usual transit riders who are actually using transit. In terms of survey response reliability we are dancing on the thin edge of trustworthy responses in terms of observation density.    But even with that caveat it would seem appropriate for transit providers to recognize that a significant portion of their riders are “in for the day” because their usual circumstance changed.  Also worth noting is that given that auto users are about 20 times the number of transit riders, an insignificant shift from auto to transit – unnoticeable on the roads – could swamp transit use.   If all the car users had their car in the repair shop once a month it could double transit use in most regions.

    Walkers and bikers, who are those most likely to be affected by weather, both do better than transit in terms of brand loyalty.  This may all be a product of trip length. It has been observed in the past that walkers have an average trip length that is typically so short (circa 15 minutes or about a mile)  that transit (given typical wait times of close to 15 minutes) is not a realistic option so on bad weather days the car may be the substitute. Bike trip lengths to work may be significantly longer than walking so that transit can become a viable option, depending on wait times and routing.    

    Alan E. Pisarski is the author of the long running Commuting in America series. A consultant in travel behavior issues and public policy, he frequently testifies before the Houses of the Congress and advises States on their investment and policy requirements.

    Photo by Nathan Harper, Bottleleaf

    —————–

    Wendell Cox covered this topic in greater detail in a recent New Geography posting Oct 17 2011

    Commuting in America III pg 63

  • Livability and All That

    Livability is one of those once innocuous words, like sustainability, that now receive almost unquestioned acceptance in the bureaucracy, academia and the media. After all, words like sustainability and livability have no acceptable negative form. Who could be in favor of anything unlivable, insensitive, unhealthy or unsustainable?

    Back in the late seventies, when I served as Special Assistant for Information Policy in the Office of the Secretary, our shibboleth was “balanced”. Can anyone be in favor of unbalanced transportation? It didn’t matter that the word had no meaning and we couldn’t explain it to others, it still became standard in the rhetoric of secretarial officers. In an unkind moment a reporter asked the present DOT Secretary Ray LaHood what he meant by livable, given that the department had just added it to its criteria for giving away money. He replied vaguely it was something about being able to walk to work and the park and a restaurant, to a doctor and a few more things.

    Well it turns out I was living the livable life style when I was growing up in Queens, New York in the fifties and didn’t know it. Here all along I just thought we were poor.

    Aside from seeking to have the same modal shares of America in 1910, or Tajikistan today, this idea fails on both theoretical and practical grounds. Theoretically, whatever merit the idea might have, livability means very different things in a tenement in Brooklyn, or a place in Billings, Des Moines, or Peoria. I can recall being sent to the store for milk or lettuce by my Mom after school. If I didn’t get there in time the four heads of iceberg lettuce (I was 16 before I found out that there were other kinds) were gone. The milk was “milk”. Today in a supermarket the milk section is bigger than the grocery store I went to as a kid. There’s skim, 1%, 2%, whole, lactaid, acidophilus in quarts, half-gallons, and gallons and 86 kinds of lettuce. The typical market today has above 50,000 items. That means that the market shed for such stores is far broader than it was back in the day.

    We were three generations of the family in the same household and we all had the same doctor who lived two blocks away. Today I don’t have a doctor – I have half a dozen – none of them selected on the basis of distance. When one selects doctors, best, not closest, matters. Hospitals are growing in size but declining in the number of facilities per thousand population. All of this is simply representative of the immense trend towards specialization in our society – an increasing division of labor in all activities and an accompanying division of tastes and preferences in an increasingly affluent society. If you want a loaf of wonder bread there’s a 7-11 down the street; if its ciabatta with sun-dried tomatoes there’s this really great place I know a few miles off of exit 29 on the freeway.

    In today’s job market don’t we expect that people will be willing to go farther to find the job they want or can get? If the average travel time is about 25 minutes and a half-hour commute is acceptable, how long is one unemployed before the acceptable becomes 45 minutes or an hour? In this period of housing constraint in which people are even more locked into their homes by underwater mortgages, the commute will grow as people get desperate.

    In my town of College Point, Queens when the factory whistle blew a few thousand walked in the gate and out again when the whistle blew in the evening. People don’t live outside the factory gate anymore and haven’t for awhile. Again, specialization and division of labor are the main factor. Job groupings are far smaller today, and the rate of job turnover means more people won’t/can’t move every time they change jobs. Moreover, about 70% of workers live in a household with other workers – whose job will they live next to?

    More importantly, the great competitive strength of America lies in access to skilled workers. Employers will be reaching out farther and farther to find the specializations and skills they require. We should expect work trip lengths to grow not become walking trips. It won’t be inner city oriented either. The metropolis of today is of immense size because many employers need a market of hundreds of thousands of potential workers to reach the ones they need. The Atlanta region with 26 counties is not a great economic engine because it is 26 charming adjacent hamlets, but rather because the market reach of employers, suppliers, customers and job seekers spreads over several million residents.

    In this environment it takes massive transportation capability to assure that market shed. The questions are how many potential employees can I reach in half an hour; how many suppliers, how many customers? In the future more of us will be free to live where we want and work where we want. Most will not be willing to trade living floor space for a close-by sidewalk café. Americans will drive to where they want to walk.

    There remains, of course, lots of room now within the existing land use distribution to make it easier for those who wish to live closer to shops, jobs or entertainment. People also are free to go to the nearest store or nearest doctor. The fact that so few do so reflects the oft-forgotten fact that people have their own notions of what is most important. Trying to coerce them to live the way government – particularly the upper bureaucracy – thinks they should live holds many perils. The American people have no obligation to live in ways that make it convenient for government to serve them. Government isn’t smart enough to know how people should live or to order their lives in more “convenient” arrangements.

    On the practical side:

    It’s on the practical side that the concepts of livability really fail. The central failure inheres in what the Europeans call subsidiarity, proposes that any necessary activity of an authority should be conducted by that level of governance closest to the problem that can effectively address it. Having livability rise to become central principle of federal transportation investment planning is an egregious failure in our historical system of decentralized government. If sidewalks and bike paths are federal then everything is federal.

    The mayors of our cities love it. Why not? It is the closest they have come to being able to lay claim to direct federal funding, getting those pesky states and suburban communities where the majority of Americans live out of the way. They see it as finally being their turn at the money from Washington. In these times, when every government level is broke, livability and sustainability can prove a potential lifeline, and a bonanza as well to developers – often themselves subsidized – who focus on the inner city.

    The livability criterion is ultimately centralist: fed-centric. It is not up to local people if they want to densify or not, but real power will rest with a really “smart” guy behind a desk in Washington. Proposals for federal “performance measurement” degenerate into a charade that produces pre-ordained results. Now I can fund my friends, who are as right-thinking as I am!

    The problem here is a total disconnect between what people in a diverse democracy want, and what the central bureaucracy, and their academic allies, wish to impose. The livability agenda may be popular in the press and among pundits, but for most communities and people it’s neither popular nor remotely democratic.

    Alan E. Pisarski is the author of the long running Commuting in America series. A consultant in travel behavior issues and public policy, he frequently testifies before the Houses of the Congress and advises States on their investment and policy requirements.

    Photo by Mastery of Maps

  • ULI Moving Cooler Report: Greenhouse Gases, Exaggerations and Misdirections

    Yesterday a group of environmental advocacy groups, foundations and other organizations released a report, Moving Cooler, amid much fanfare, seeking to have us believe that it is a serious study of GHG reduction options in the transportation sector. It is immensely disappointing. The world could use a dispassionate, objective and broad-based assessment of petroleum reduction options as well as their positive and negative consequences. This is not it.

    As one reads one can’t help but feel that you are being hit with a sales pitch, or a legal brief from advocacy groups and those who would benefit financially from the derived policy options. The main point, amidst all the array of statistics, confirms the dogma of the already convinced that the only solution to greenhouse gases is major re-structuring of society.

    These notions, critically, were already on the front burner of these same groups long before the climate change issue came to prominence. “Progressive” foundations, new urbanists, planners and urban landowners long have advocated the re-assembly of urban living into high density transit-oriented bikeable/walkable communities. Even though their numbers as reported in the text don’t bear it out, the rhetoric is all focused towards that end and the pricing out of existence the automobile and all the evils it represents: suburban living and long trips.

    This is a report meant to be waved rather than read as the Congress goes about its fulminations in the coming months. It understates the prospect of gaining the full potential of greater energy efficiency from the vehicle fleet – the only way to justify the wholesale reorganization of society. In fact, if the vehicle/fuel assumptions had been as comparably optimistic as the land use assumptions, with a robust and honest assessment of fuel and vehicle technological development opportunities, one wonders whether this report would be worth doing at all.

    We have been here before. In the struggle to improve air quality, it turned out that the solution was not so much changing people’s behavior as it was technological – largely the improvement of fuel and vehicle technology. In the 1970s we were told we could not have cleaner air and automobiles; yet in fact that’s exactly what happened, without having to heed a sermon about our need to repent and change our suburban, car-driving ways. Some people just have a penchant for telling others how to live.

    Maybe the saddest part of it all, the authors appear not to take global warming or energy security very seriously at all. Rather these public concerns are just a convenient hook, the cause du jour, on which to hang their favorite solutions. If global warming matters – and it does; if energy security matters – and it does; then early action is clearly called for, particularly given the cumulative nature of GHG gases. But somehow the things easily done and carrying with them little in the way of disruption or public costs – carpooling, telecommuting, dispersed work – are largely written off. Such immediate, low-cost actions as highway operations strategies including better traffic signalization, improved traveler information and accident response systems receive little emphasis.

    Overall, the treatment of costs and benefits will leave readers gasping:

    • Travel times don’t get counted – so shifting from a 15 minute car trip to an hour on transit or walking has no penalty.
    • Transit subsidies don’t get counted – so doubling subsidies to increase ridership has only benefits.
    • Every possible pricing strategy is invoked – congestion pricing, cordon pricing, on-street parking fees, extreme fuel prices – in order to get people out of cars, and then the loss of their cars is counted as a benefit.

    At the same time the benefits and the costs involved are so corrupted to be meaningless. It will take weeks for analysts to tease out what really was done in the way of assumptions to create winners and losers. And there is no effort to tally all the costs exacted on the average household, or the typical business or even governments for that matter. The costs would add up to a permanent recession.

    I am sure the millions affected by these policies, particularly the middle and working class people who can now just barely afford a car, who would be priced out of the system by these policies, will say thank you for this “benefit”.

    As we work our way through the recession, workers will be willing to travel farther and farther to find the right job – or any job. With continuing increased specialization in our society larger and larger market sheds for jobs and for workers, quality transportation will be critical to our national productivity. This is the work that transportation does and it is totally dismissed by this report. It can not be addressed adequately by rail or transit even with a complete radical reorganization of work and society.

    In order to further bolster their ineffective case the proponents use a tool called “bundles” in which packages of actions are assembled for their “synergistic” qualities and either given a boost or cut based on the assertion that some things work well together. How this was done is not explained. So land use plans, which will take 30 years to come to fruition, are coupled with carbon pricing policies in a sort of horse and rabbit stew, that help make density solutions seem effective.

    Those who see the solution of so many of our present ills by cramming people into ever higher densities miss the point. Residential density is one of the most fundamental choices households make. Changing residential densities to make transit work better is the smallest tail wagging the biggest dog I can think of. It puts planning dogma ahead of the most basic human needs and rights.

    It is clear that most people, excepting a small but often very loud minority, opt for lower density living when income permits. As the society changes and choice patterns evolve, the marketplace must be ready to respond with development that is both responsive to household choices and to the demands of environmental needs. Any public policies that inhibit a market trend toward higher densities must be addressed. But the market place must be the final arbiter in a free society. People do not live “efficiently” in order to optimize some imposed societal goal, certainly not commuting.

    The serious work that needs to be done in this area still awaits an independent and credible group to undertake this work. It can’t come soon enough.

    For almost 40 years Alan E. Pisarski has been involved in the national transportation policy scene, from vantage points at the original Tri-State Transportation Commission in New York, the Metropolitan Washington COG, the Office of the Secretary, U.S. DOT, or in a personal consulting capacity. In his work he has measured the transportation activities of our nation from the metropolitan, state, national and international levels. In the U.S. DOT he organized the major travel surveys of the nation and designed and managed the U.S. transportation statistical system under the Assistant Secretary for Policy, establishing programs that are still the basis of much of the U.S. transportation statistical system today.

  • Telecommute Opportunities

    As gas prices play in the range of four dollars, lots of people are looking for ways to save fuel as part of their work commute or regular household travel. There are some no-brainers like parking the SUV and using the fuel efficient vehicles in the household fleet.

    But a clear winner here is simply not taking that work trip at all – a four-day 40-hour week is a 20 percent fuel saving; a nine-day 80-hour biweekly period is a 10 percent saving. The state of Utah is the first state to go on a mandatory four-day week schedule for state employees with the additional advantage of most offices actually being shut down on Fridays.

    The telecommute option is also win-win. The commuter saves fuel and vehicle wear and there is zero impact on the road system or transportation system nor any deleterious effects on the society. The big question mark becomes the nature of the employment and the view of the employer toward such activities.

    In 2001 the NHTS (National Household Travel Survey) of the Federal Highway Administration (FHWA) pursued this question in some depth asking respondents about their ability to work from home. Obviously there are lots of people who can’t take advantage of such an opportunity — think emergency room nurses — but many others, particularly in technology-related fields, can. The NHTS shows that almost all groups have some workers whose occupation or industry makes it feasible.

    There are two discrete elements in telecommuting population. There are those who work at home (WAH) and have no other work location. Then there are those who occasionally work from home although they have a regular work place to go to – the real telecommuters. We also need to include among the telecommuters a sub-group – those who have a work-center near home that they can go to instead of the regular work place.

    The NHTS identified about 8.7 million workers who worked only at home, about six percent of workers, considerably more than the census showed in 2000, (and interestingly another 5.4 million with no specific work place). The American Community Survey (ACS), on the other hand, showed only 4.3 million in 2001 rising to just about 5.4 million in 2006; increasing in share from 3.4 to 3.9 percent. Under all surveys, there is a clear growth trend in working at home. In fact, it has been the only “mode” to increase over the last 25 years other than driving alone.

    Overall telecommuting would exceed transit totals nationally if New York is excluded. The decennial census and the NHTS show that the great majority of those who work at home are located in suburbs and rural areas (note that those who live in rural areas and work at home are often called farmers.)

    Who are they?
    Telecommuters tend to be male, older and more affluent. The women who work at home tend to be younger, less well-educated, and less affluent. The men tend to be in business or financial management, or other professional activities whereas women are more likely to be involved in administrative support, service occupations (think daycare) and part-time work.

    The NHTS survey data indicated that the occasional work-at-homers look a lot like those who work at home all the time. They are preponderantly male, with an average age of 42, and heavily oriented to the higher income groups with the majority over the $75,000 income bracket. They are overwhelmingly drawn, more than 60 percent, from professional and technical management occupations.

    Who cares?
    If telecommuters were loaded onto the national system each day, they would constitute a very large additional burden in terms of system demands and fuel use. Most importantly many are long distance travelers – their average distance to work is 17.5 miles, about 50 percent more than the average work trip length. Most people who work at home occasionally tend to be private vehicle users with a limited number using transit modes or even walking.

    Some options and impediments
    We do not yet know too much about what has happened over the past year’s strong spike in energy price. Clearly, some governments and private players are taking some action. Many state and local agencies have policies supporting telecommuting on a voluntary basis.

    In the private sector, Microsoft, operating in a very congested area of Seattle’s suburbs, now offers bonuses to employees for carpooling of up to $1000 and to foot the entire bill for using vans. They also have developed tele-centers in downtown Seattle for the many reverse commuters who work for them to spend time near their downtown/University residences to avoid peak travel out to the suburbs.

    What remains astonishing is how little government action has been taken an effective and worthwhile response to the energy situation. One good step would be a public information program focused on prospective employers and their willingness to accept such programmatic changes. Within companies, training managers to better handle the complexities of interacting with employees at a distance would be a big plus. Telecom companies could help with better tools and services and ideas; after all, it is a natural market for their services.

    The increasing cost of travel is altering the arithmetic by which commuters weigh their travel choices. Telecommuting represents one important option that needs to be taken very seriously indeed.

  • Commuting Suicide — the District of Columbia wants to be a residential suburb

    The Washington Post’s recent article about how the District government is making plans to make the city “less-welcoming to suburban cars” is one more example of suicidal behavior that the city is known for.

    Unfortunately, other cities are thinking similarly. In the plan, “City officials say that the moves are part of a policy of putting the needs of its residents and businesses before those of suburban commuters and that they are trying to create a walkable, bikeable, transit-oriented metropolis.” Apparently Washington has decided to become a bedroom suburb. Newsflash: even those don’t exist anymore – much less in the center of a metropolitan region of over five million.

    It is hard to believe that the District could consciously make the city less welcoming to vehicles than it already is – with potholes on every block and roads like I-295 right out of the 1930s with design features for the tin lizzie, or New York Avenue that says “Welcome to your Nation’s Capitol” with neglect apparent on every block. Maybe because they cannot fix those things they decided to turn it into a virtue at least among some segments of the society.

    You would think the District would have noticed that more of their own citizens get to work by car than by transit and about 45 percent of those riding transit are on the roads they want to make worse. This is just an extension of the District’s perennial search for revenue with a tortured way to get to a commuter tax that has been around for decades.

    All it would take is a few minutes on the back of an envelope to recognize how important commuters are to the city. First answer would be a simple thought experiment – would the city be better off with no suburban commuters or with what they have now? Someone in the District government could do a small calculation of the amount of office building space, with the attendant real estate taxes they generate, the restaurants, shops and services, the parking garages and the revenue they earn, the taxes they pay, and the District workers they support, to recognize that the benefits to the City per thousand commuters far exceeds the costs. Without the suburbs even its beloved Metro wouldn’t exist.

    More importantly, it shows that the District once again has failed to recognize its responsibility as the nation’s capitol. Those responsibilities are really not that terribly different from other center cities. This is part of a looming public policy conflict of national proportions. As cities adopt the new mantra of “metro mobility” – which is code for an attack on autos and an assumption that transit needs can be met by walking, biking and mass transit – they only address trips under five miles. This completely neglects the responsibility that every city and metropolitan region in the country has, much less the nation’s capitol, to meet the needs of interstate commerce – whether through access to ports or to major rail or highway routes.

    This is not optional. An area cannot opt out of that obligation. If all areas of the Baltimore-Washington metropolitan area operated that way, rather than a great region comprised of dozens of counties it would be a series of hamlets adjacent to each other with the obvious decline in market power and productivity that entails.

    The great challenge to the nation in the next few years will be providing access to those workers needed to replace the aging baby boom generation. We will need to expand the commuter market-sheds around our cities not contract them. Congressman Moran got it right, providing a sense of scale when he told reporter Eric M. Weiss, “U.S. Rep. James P. Moran Jr. (D-Va.) said … the city should be careful not to chase people away. Like the District, Old Town Alexandria would be a nicer place without all the cars, he said. But there is an economic component to be considered, he said, and people in cars represent customers for restaurants and shops.”

    He also said be careful what you wish for… For a city that lost 180,000 people over the last 30 years the District should listen to wiser heads.