Author: Bill Watkins

  • The California Economy: When Vigor and Frailty Collide

    Part one of a two-part report

    California is a place of extremes. It has beaches, mountains, valleys and deserts. It has glaciers and, just a few miles away, hot, dry deserts. Some years it doesn’t rain. Some years it rains all winter. Those extremes are part of what makes California the attractive place that it is, and, west of the high mountains, California is mostly an extremely comfortable place to live.

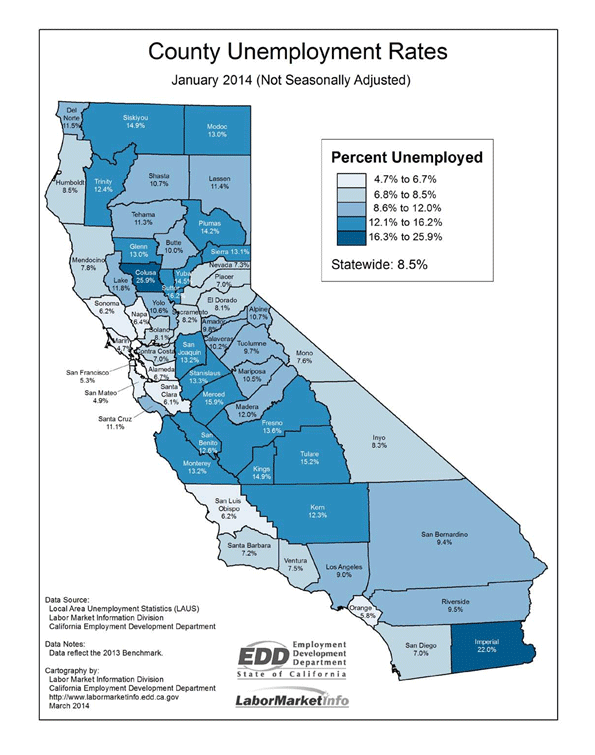
    Today, we have some new extremes. Some of our coastal communities are as wealthy as any in the world. At the other extreme, we have some of America’s poorest communities. San Bernardino, for example, has America’s second-highest poverty rate for cities with population over 200,000.

    From the beginning, we’ve had the fabulously wealthy. For the first 140 years after gold was found, California was a place where people could find, or, more correctly, build, success. The new part is the poverty. It used to be that the poor were mostly newcomers, people who hadn’t yet had time to show that they had what it takes. Today, our poverty is dominated by families who have been here a long time. While San Bernardino certainly has some newcomers, it is mostly a city of native Californians.

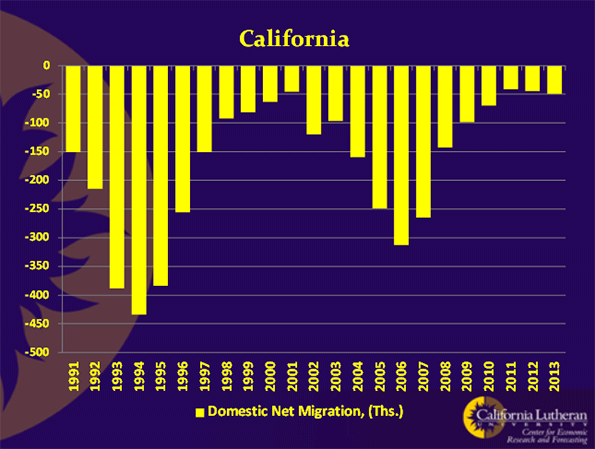
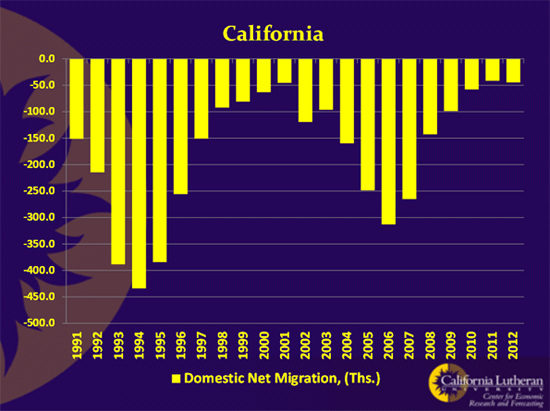
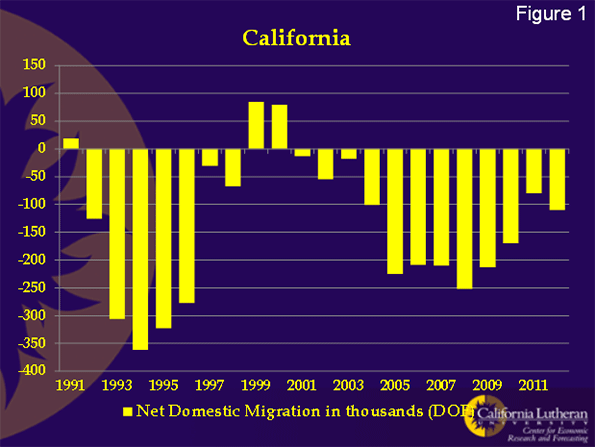
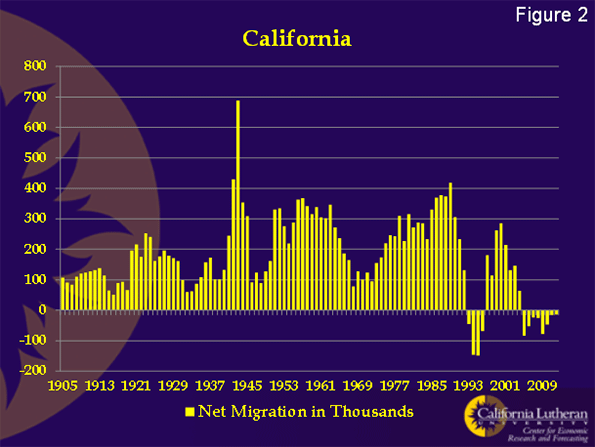
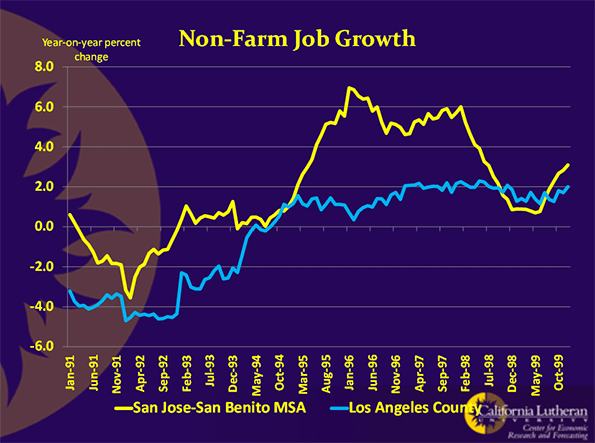
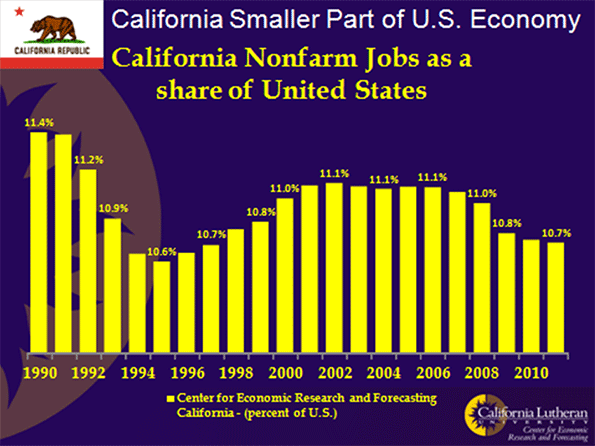
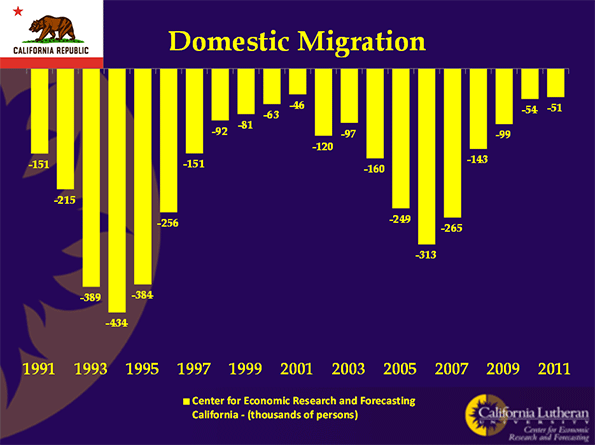
    The change became visible in the early 1990s. Many analysts will tell you that the change was caused by the collapse of the Soviet Union and the resulting peace dividend, which led to a dramatic downsizing of America’s defense sector, once a major component of California’s economy.

    I believe the way to think about this is that the downsizing of the defense sector exposed the weaknesses in California’s economy, as opposed to causing them. Sure, the downsizing had an economic impact. California lost hundreds of thousands of jobs. But the defense sector eventually bounced back and again became a source of good jobs. The problem is that it bounced back someplace else. It didn’t come back in California. In fact, it continues to decline in California.

    The decline in California’s economic opportunities began way before the 1990s. As the 1960s progressed, Californians, or at the least the ones making decisions, changed their priorities. California’s spending for infrastructure had once consumed between 15 and 20 percent of the State’s budget. It precipitously fell to five percent or below.

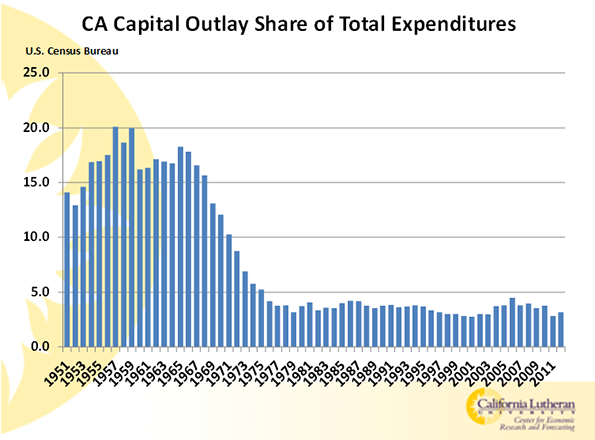
    In the ’50s and early ’60s, governors Goodwin Knight and Pat Brown presided over a fabulous investment boom in universities, highways, water projects and the like. None of their successors has even attempted anything on that scale. The profound prosperity that accompanied and followed California’s investment boom hid the impacts of subsequent policy changes for decades.

    The decline in public capital spending wasn’t the cause of our changed priorities. It was the change in priorities that caused the change in spending. It is as if we decided that we were wealthy enough, and that future spending would be on social and environmental programs. If we weren’t looking for economic growth, why invest?

    At California Lutheran University’s Center for Economic Research and Forecasting, we’ve created a vigor index. It’s composed of net in-migration, job creation, and new housing permits, each equally weighted. It is quite sensitive to changes in economic opportunity. For example, in 2000, North Dakota had the nation’s lowest score, 0.9, and Nevada led the nation with a score of 24.1. By 2013, North Dakota led the country with a score of 20.0, while Nevada had seen its index value fall to only 6.4.

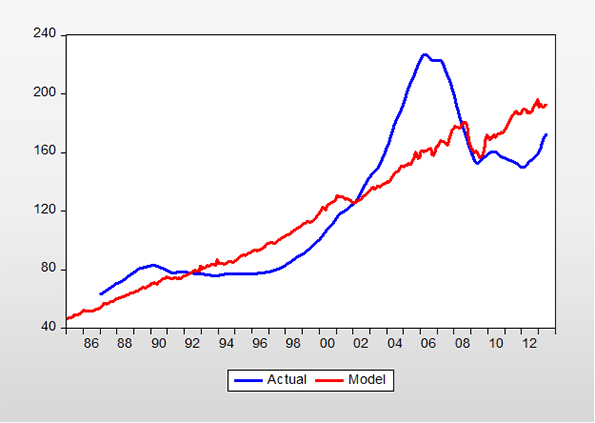
    In the following chart, we show California’s index (red bars) compared to that of Texas, Oregon, and Tennessee, from 1980 through 2013.

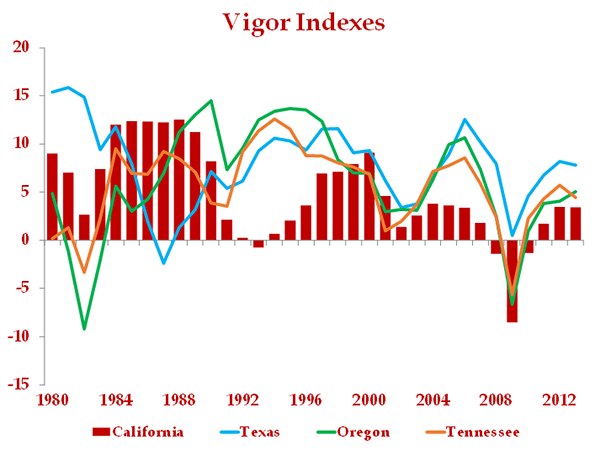
    California is apparently different than the comparison states. The Tennessee, Oregon, and Texas indexes have behaved more similarly to each other than to California since the late 1980s. Texas’ index behaved uniquely in the early 1980s, because of its dependency on oil and the long-term decline in oil prices that occurred during the 1980s.

    California appears to be different than the other states throughout the period, but the nature of the difference has changed. Prior to the late 1980s, California tended to outperform the others. For example, its score didn’t decline nearly as much as the others during the early 1980s recession. Given California’s resource endowment, we think this is natural.

    Since 1990, though, California’s vigor index has generally remained below those of Texas, Tennessee, and Oregon. Indeed, since 1990, California’s score has rarely exceeded the score of any of the comparison states, and it has never led them all.

    The index also shows that California’s investment in infrastructure during the 1950s and 1960s helped drive economic opportunity for two decades. It took two decades without any investment before we saw the consequences of the decision to not invest.

    Recently, California has seen budget surpluses and faster job growth than the average American state. The forces for the status quo now claim that this confirms the wisdom of their policies. They are wrong.

    California’s budget surpluses are a product of a temporary tax, and an incredible bull market in equities. Our dependence on a highly progressive income tax means that California’s fiscal condition swings on the fortunes of a small group of wealthy individuals.

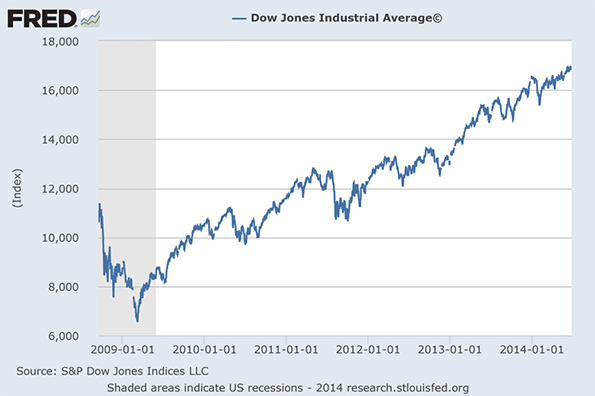
    Equity markets have been amazing over the past few years. The Dow has increased by over 10,000 since it bottomed out on March 9, 2009, and it appears to be divorced from economic activity. It increases on good news and bad, propelled by an unprecedented monetary expansion. Right now, California’s largest taxpayers are reaping huge profits in the stock markets, and California is reaping huge windfalls in its tax revenues.

    Someday, the market gains will cease, or worse reverse. Someday, too, the temporary tax will expire. California’s surpluses will wash away like sand on a beach. The state will face a new crisis, a result of a progressive tax structure where revenues swing on paper profits and losses, not on economic activity.
    As for our job gains being better than the average state’s, California should not be average.

    Employment should be far higher than it is. Even the weak job growth we’ve seen is largely a legacy of a previous age. California has the world’s best venture capital infrastructure, partly because of the investment previous generations of Californians made in the university system. It is also, in part, a result of chance.

    An amazing period of innovation was initiated in Coastal California by a few incredibly talented individuals, who were funded by a few far-sighted capitalists. It was one of those rare coincidences that happen from time to time and change the world. The eventual result was the Silicon Valley and economic powerhouses such as Intel, HP, Apple, Yahoo, Google, Facebook, Twitter, and many more.

    Another result was the creation of a private, capitalist, vibrant infrastructure. It takes time and vast sums of money before a new idea generates profits. Product design is just the first step. An organization needs to be created to produce and sell the product. Factories need to be designed. Marketing plans need to be put in place.

    No inventor or entrepreneur can be expected to have all of the necessary skills or money to turn an idea into a profitable firm. So, an infrastructure appeared. The Silicon Valley’s world-leading venture capital markets and the support structure to enable the fabulous innovation and economic value created there was not the result of any government program or initiative. It was the spontaneous result of lots of people driven to innovate and profit from those innovations. It was capitalism at its very best.

    California’s Silicon Valley became the place for talented young people to turn great ideas into reality. It was also the place to go if you had money and wished to invest in vibrant, risky new technologies, or if you knew how to design factories, how to market products, how to build organizations, or how to finance rapid growth. The infrastructure that arose is supporting California today. This amazing capitalist engine of jobs, innovation and wealth is the source of most of California’s economic vigor. But it is a legacy that will eventually slip away, unless California changes its priorities.

    This is the first part of a two-part report. Bill Watkins is a professor at California Lutheran University and runs the Center for Economic Research and Forecasting, which can be found at clucerf.org.

    Flickr photo by mlhradio. A California extreme: Mountains on The Trona-Wildrose Road, at the edge of the Panamint Valley. One of the most remote deserts in North America, in one of the most remote corners of California; the salt flats of Panamint Valley to the west, and Death Valley to the east.

  • East of Egan: Success in California is Not Evenly Distributed

    The New York Times ran a Timothy Egan editorial on California on March 6.  The essay entitled Jerry Brown’s Revenge was reverential towards our venerable Governor.  It did, however, fall short of declaring Brown a miracle worker, as the Rolling Stone did last August.  These and other articles are part of an adoring press’s celebratory spasm occasioned by the facts that California has a budget surplus and has had a run of strong job growth.

    Egan at least pauses in his panegyrical prose to mention that all is not perfect in California:

    Without doubt, California has serious structural problems, well beyond the byzantine hydraulic system that allows the state to flourish. For all the job growth, the unemployment rate is one of the highest in the nation. It has unsustainable pension obligations, a bloated public-employee sector led by the prison guard union. And it is so expensive to live here that clashes over the class divide are threatening to get nasty.

    That’s not the worst of it.  Before going there, though, let’s consider Brown’s most celebrated achievement, a budget surplus. 

    California has a budget surplus because of a temporary income tax on its highest earning citizens and because of large capital gains reaped during an amazing year for stocks.  The S&P 500 was up almost 30 percent last year, an event unlikely to be repeated.  California’s tax revenues are excessively dependent on a relatively few wealthy tax payers.  This makes revenues extremely volatile.  When these tax payers do well, Sacramento is flush with cash.  When the high end tax payers don’t do well, Sacramento has very serious problems.

    By increasing California’s reliance on a few wealthy tax payers, Brown’s tax increase made California’s revenues more volatile.  The ongoing bull stock market would have generated higher tax revenues for California without the tax increase.  It generated even more with the tax increase.  When a bear market comes, the state will again face deficits.  This is one reason that Standard and Poors ranks California’s credit as second worst in the country, only above Illinois.

    So far, to his credit and in stark contrast to what we saw in the dot-com boom under Gray Davis, Jerry Brown has, with the exception of his pet project, the high-speed train, effectively resisted the legislature’s knee-jerk impulse to increase long-term spending commitments.  What he has not done is perhaps more important: addressing California’s other financial issues, the ones that are contributing to California’s dismal credit rating.

    California has had several quarters of stronger-than-the-nation job growth, but is still 113,500 jobs below the level in 2007; in contrast Texas is 844,300 jobs above that number.  

    Nor can it be sure that growth will continue. Unfortunately, the day after Egan’s celebratory essay, California’s Economic Development Department announced that the state had lost 31,600 jobs in January.  That’s an initial estimate, and it will be changed, but it’s hard to tell which direction.  The data released with that estimate appear to be a bit of a mess and are internally inconsistent.  We’ve asked for some clarification.

    Regardless of the most recent data point, California’s job performance has been better than expected, and we should all be thankful for that.  However, comparison with the United States average is not the only metric.  Comparison with California’s potential is the correct metric, and there California is underperforming in a big way.  Given all of its advantages, California should be leading the nation in job creation and opportunity.

    California has been averaging about 27,000 new jobs a month over the most recent 12 months for which we have data.  It should be averaging at least 40,000.  This would be slightly more than Texas’ average of 33,900,.  But, it still represents only 3.2 percent job growth, well below Texas’ 3.7 percent job growth rate.

    The state is sitting over estimated oil reserves that are about four times as large as the Bakken Shield, a major contributor to North Dakota’s boom.  Any serious effort to tap that resource would generate huge numbers of jobs.  Many of those jobs would be high wage positions for less educated workers who were hurt the most by the recession.

    California has many advantages over North Dakota, or Texas for that matter, besides oil.  These are well known and include location between Pacific Rim producers and the world’s largest consumer market, ports, workforce, and climate.  Even without oil, we should be doing better.  Policy though, particularly environmental policy, is restraining the state’s job creation.

    Egan makes a big deal of migration.  Here is his first paragraph (emphasis is his):

    Let’s review. Just a few years ago California was a punching bag for conservative scolds — a failed state, profligate with its spending and promiscuous with its ambition. Ungovernable. And everybody’s leaving.

    Later, he returned to the topic:

    Third, the great exodus never happened. Since the dawn of the recession, the state has added about 1.5 million people — almost three Wyomings. And yes, 67,702 people moved from California to Texas in 2012. But 43,005 people moved from Texas to California. (Population growth is not necessarily a good thing, especially in this overstuffed state, but that’s another topic).

    This is really curious.  A whopping 57 percent more people moved from California to Texas than moved from Texas to California, which was the case for decades.  This is an argument that people aren’t leaving California?  California’s population is up 1.5 million?  California’s population growth is mostly a result of California’s fertile young people.  Census data show that California’s domestic migration has been negative for over 20 consecutive years.   It may not be The Great Exodus, but it’s a reversal of about a 150 year of migratory trend.

    Then there is poverty and unemployment.  Poverty, unemployment and lack of opportunity are why California’s domestic migration data is negative.  Lack of opportunity may be hard to measure, but we have lots of data on unemployment and poverty.   Some examples:

    • San Bernardino has the second highest poverty rate of any major U.S. metropolitan areas.  Only Detroit is worse.
    • California, with about 12 percent of the U.S. population, has 34 percent of U.S. welfare recipients.
    • Two California counties, the geographically separated Colusa and Imperial, have unemployment rates over 20 percent.
    • Thirty-one of California’s 58 counties have unemployment rates in double digits.

    The geographic distribution of California’s poverty is one reason many people fail to understand California.  Most of California’s poverty is concentrated in regions where the political class —or wayfaring editorialists — seldom venture.  It’s mostly inland, not where most of California’s elite live or travel.  If you stay on the 101 corridor, or hug scenic Route 1, it’s easy to avoid.  You can find it, but you have to have eyes that are open to it, and it helps if you get off the beaten path. 

    Egan wrote his piece in Santa Barbara, where life can be as good as it gets, particularly for the affluent and boomers who bought their homes decades ago.  But, the city of Guadalupe in Santa Barbara County could give him a taste of how the other half lives. Just take a look sometime: it’s about as hardscrabble a town as the Texas town in the movie “The Last Picture Show”.

    California’s poverty is harder to ignore along the 99, but is even more evident in roads like 33 which winds along the eastern side of the coastal range.  Go there, and you will find it hard to believe that you are still in the United States, much less California.  There you will find grinding, hopeless poverty more reminiscent of the Third World than the center of the economic jobs.

    A high speed train won’t help these people.  Neither will Silicon Valley tech jobs, even if they don’t shrink in the inevitable social media shakeout.  Neither will Sacramento, apparently.  Until we start doing something for the state’s huge and struggling working and middle class, and that means creating opportunity for them, we should refrain from congratulating ourselves and each other for our good work.

    Bill Watkins is a professor at California Lutheran University and runs the Center for Economic Research and Forecasting, which can be found at clucerf.org. A slightly different version of this story appeared in CLU Center for Economic Research and Forecasting’s September, 2013 California Economic Forecast.

  • Jerry Brown and California’s “Attractive” Poverty

    Jerry Brown is supposed to be a different kind of politician: well informed, smart, slick, and skilled.  While he has had some missteps, he’s always bounced back.  His savvy smarts have allowed him to have a fantastically successful career while generally avoiding the egregious dishonesty that characterizes so many political practitioners.

    So, I was shocked to read that he said that California’s poverty is a result of the State’s booming economy.  Here’s part of the Sacramento Bee report:

    Gov. Jerry Brown, whose pronouncements of California’s economic recovery have been criticized by Republicans who point out the state’s high poverty rate, said in a radio interview Wednesday that poverty and the large number of people looking for work are "really the flip side of California’s incredible attractiveness and prosperity."

    The Democratic governor’s remarks aired the same day the U.S. Census Bureau reported that 23.8 percent of Californians live in poverty under an alternative calculation that includes the cost of living. Asked on National Public Radio’s "All Things Considered" about two negative indicators — the state’s nation-high poverty rate and the large number of Californians who are unemployed or marginally employed and looking for work — Brown said, "Well, that’s true, because California is a magnet.

    "People come here from all over in the world, close by from Mexico and Central America and farther out from Asia and the Middle East. So, California beckons, and people come. And then, of course, a lot of people who arrive are not that skilled, and they take lower paying jobs. And that reflects itself in the economic distribution."

    This is so incredibly wrong that I’m worried that Brown has lost his head and ability to reason.   If he really believes what he said, he’s living in the past and he’s so ill informed as to be delusional.  If he doesn’t believe what he said, I’m worried that his political skills have slipped.  To my knowledge, he’s never said anything so clearly at odds with the truth in his career.

    Here are the facts:

    • California’s poverty is not where the jobs are, which is what we’d expect if what Brown said was true.  Most of California’s jobs are being created in the Bay Area, a region of fabulous wealth. By contrast, California’s poverty is mostly inland. San Bernardino, for example, has the second highest poverty rate for American cities over 200,000 population, and no, it’s not because it’s a magnet. Most of California’s Great Central Valley is a jobs desert, but the region is characterized by persistent grinding poverty and unemployment.  No one in recent years is moving to Kings County to look for a job.
    • States with opportunity have low poverty rates.  North Dakota may have America’s most booming economy.  According to the Census Bureau, North Dakota’s Supplemental Poverty Measure is 9.2 percent.  That is, after adjustments for cost of living, 9.2 percent of North Dakotans live in poverty.  The rate in Texas – a state with a very diverse population, and higher percentages of Latinos and African-Americans – is 16.4 percent.  California leads the nation with 23.8 percent of Californians living in poverty.
    • According to the U.S. Census, domestic migration (migration between California and other states) has been negative for 20 consecutive years. That is, for 20 years more people have left California for other states than have come to California from other states. Wake up, Jerry, this is no longer your Dad’s state – or that of his successor, Ronald Reagan. This is a big change from when Brown was elected governor the first time.  At that time, California was a magnet.  It had a vibrant economy, one with opportunity.  California was a place where you could have a career, afford a home, raise a family.  It was where the American Dream was realized.
    • How about the magnetic attraction for immigrants from all over the world? According to the Census Bureau, international migration to California is way down.  The number of California international immigrants has been declining for a decade at least.  Indeed, in recent years there have been about half as many international immigrants to California than we saw in the 1990s.  Over the past decade, the number of foreign born increased more in Houston than the Bay Area and Los Angeles put together. Opportunity, not  “attractiveness”, drives people to move.
    • The result of negative domestic migration and falling international migration is the total migration to California has been negative in each of the past eight years.  More people have left California than have come to California for eight consecutive years. 
    • California’s migration trends combined with falling birth rates has resulted in the lowest sustained population growth rates that California has seen.

    The data are clear: Brown’s assertions have no basis in fact.  California – with the exception only recently of the Bay Area – is not a magnet. California is not "incredibly attractive and prosperous."  People are not coming from all over the world. California may beckon, but more are leaving, and those here are having fewer children. California’s seductive charms go only so far.

    I don’t know if I’d prefer that Brown was delusional or lying. On the one hand, policy made from a delusional analysis of the world is sure to be bad policy. Brown, for example, may convince himself that Twitter, Google, and Facebook are the future of the California economy, without recognizing how few people, particularly from the working class or historically disadvantaged minorities, they employ. On the other hand, Brown is very skilled in the political arts. If someone as skilled as he has to resort to such outright misdirection, we may be in worse shape than I think.

    Bill Watkins is a professor at California Lutheran University. and runs the Center for Economic Research and Forecasting, which can be found at clucerf.org.

    Jerry Brown photo by Bigstock.

  • Housing: Bubble Trouble or Staying the Course?

    There is a lot of speculation that residential real estate markets are in a bubble. Certainly there is cause for concern: The rates of gains in prices over the past year are unsustainable, and a bit disturbing. We are seeing multiple offers on a huge percentage of homes that are sold, and buyers are racing to make offers.

    Sustained strong real estate markets are usually driven by household formation, or an increase in the percentage of the population that owns a home. Neither is happening.

    Household formation drives a real estate market by increasing demand for modest homes and pushing existing homeowners up the ladder. It isn’t happening now because our young people, at the age when we would expect them to start households, can’t do so. The economy has crushed them. They are unemployed or underemployed, burdened with college debt, and living with their parents. They will not be a source of strength for the real estate markets until job growth is far higher than it is now. End of story.

    Home ownership rates aren’t increasing either, thank goodness. Policy can only push home ownership so far, and then things go bad, really bad. A too-high home ownership rate was a significant contributor to our recent recession, and to its extraordinarily slow recovery. In spite of headlines, the continuing decline in home ownership is good economic news.

    The home ownership percentage peaked at about 69 percent just prior to the recession. Since then, it’s fallen to about 65 percent. Based on history, we think about 64 percent is a sustainable rate. Given the ongoing changes in how homes are financed, the sustainable rate may fall below 64 percent. In any event, growth in the home ownership rate is not and will not soon be a source of demand for homes.

    Then there are the stories. We hear lots of stories about behavior that sound like stories we heard in previous bubbles.

    Still, we don’t think we’re in a bubble. We’d prefer a more orderly market — that’s for sure. We also don’t expect to see continued price increases at last year’s pace.
    The demand driving real estate markets comes from investors. This is something that had to happen. When the home ownership rate is too high, home ownership needs to be moved from unqualified residents to investors.

    It took investors a while to see this, and government at every level did its very best to slow or stop the process. Eventually, though, investors couldn’t continue to ignore the situation, and economic incentives overwhelmed government efforts to stop the process. Investors were flush with cash, and they had few alternative investments. Interest rates were at record lows, and home prices were low, often below construction costs.

    So the investors stepped in, all at once, and in a big way. We’ve seen reports of some investment firms bidding on 200 homes a day in Florida.

    You have to ask: How long can this go on? The answer is in the economic models used by investors. Their models look at interest rates, expected rents, capital gains, and price. Interest rates have ticked up, and markets are concerned about tapering of QE3. Still, we don’t see any reason for a sustained significant upward move in interest rates. We also don’t see any sign of a softening in rents, and thus the expect capital gains.

    So, purchase price is the key to how long we’ll see strong investor of demand. That is, given interest rates and expected rents and capital gains, there is a price below which Investors will purchase houses and above which they will not purchase houses. Call this the critical price. For simplicity, we’re assuming — unrealistically — that all markets are the same. In reality, there is a critical price for every neighborhood or even every home.

    The situation is clearly self-limiting. The investors all use very similar models. Once they hit the critical price, they will all exit the market. Since they are all using very similar models, they will all abandon markets at about the same time.

    Then what happens? I think we’ll have a new floor at the critical price. If the price falls, the investors will jump back in. Since we don’t see any other strong source of demand, it’s hard to see why the price would continue to increase above the critical price. So prices are likely to again be stable.

    While investors do not always behave in rational ways — in particular they exhibit herd behavior — we are inclined to believe that they will not bid the price up significantly above a price supported by fundamentals: rents, interest rates, incomes, and the like. So, we built a simple model to see where we are.

    Below is a chart that shows actual market prices based on the Case-Shiller survey, represented by the blue line, and our estimate of a price based on fundamentals, by the red line. According to this model, there is some room for continued gains:

    That is not to say that prices couldn’t fall. Our model is based on current economic conditions, and it is not forward looking in any way. If the fundamentals change, our model’s estimate of value will change. Specifically, if interest rates increase or if income falls (because we go into another recession) we would expect to see prices decline. If job creation suddenly accelerates, we’d expect to see prices increase.

    So, while we don’t think that real estate markets are in a bubble, the current rate of price increase will probably not continue for long, either. The very good news is that, absent some unexpected negative economic shock, we don’t see any reason for another price decrease within the forecast horizon.

    Bill Watkins is a professor at California Lutheran University and runs the Center for Economic Research and Forecasting, which can be found at clucerf.org. A slightly different version of this story appeared in CLU Center for Economic Research and Forecasting’s September, 2013 California Economic Forecast.

    Flickr Photo by thinkpanama

  • Viewing McJobs From the Flip Side

    The headline read, “We Have Become a Nation of Hamburger Flippers: Dan Alpert Breaks Down the Jobs Report.” Seems that Alpert, the managing partner of New York investment bank Westwood Capital, LLC, was unhappy that most of the jobs created in July were for low-wage workers.

    Albert wasn’t alone. Plenty of people have been complaining that most of the recently-created jobs have been for low-wage workers. These people have apparently forgotten who it was that lost jobs in the Great Recession: It was low-wage workers. College educated people were hardly impacted at all, especially those that headed households and had several years of work experience.

    The recession hit less educated, and therefore low-wage, workers far more than it hit high-human-capital workers, and the discrepancy persists, even as analysts complain about hamburger-flipping jobs.

    The July unemployment rate for college graduates was only 3.8 percent, down from 3.9 percent the previous month. By contrast, the unemployment rate for people with less than a high school diploma was 11 percent in July, up from 10.7 percent in June, even though more than 270,000 of these workers left the workforce.

    The July unemployment rate for high school graduates without any years of college was unchanged from June at 7.6 percent, while unemployment for those with some college fell from 6.4 percent in June to 6.0 percent in July.

    So, even though we are hearing some complaints about the composition of new jobs, college educated people and people with some college were apparently better off at the end of July than they were at the beginning of the month. The less educated were not better off. Indeed, it looks as if many were worse off.

    The disparity is worse if you look at labor force participation rates. The rate for people with less than a high school education is only 45 percent. Over half don’t even try to find work.
    The labor force participation rate climbs as education increases. It’s 59 percent for high school graduates, 67.3 percent for people with some college, and 75.5 percent for college graduates.
    We need more hamburger-flipper jobs.

    With an unemployment rate of only 3.8 percent for college graduates, it seems that it would be difficult to fill many more of these jobs. Given the relative unemployment rates, it’s unavoidable that hamburger-flipper jobs will continue to dominate new job numbers.

    I calculated how many jobs it would take to create a three percent unemployment rate for everybody. We’d need 870,000 jobs for people with less than a high school education, 1,689,000 high-school-graduate jobs, 1,116,000 for people with some college, and only 417,000 college-graduate jobs.
    That’s assuming no change in labor force participation rates. The numbers gets a lot larger if you want to improve labor force participation rates.

    Suppose the target was a three percent unemployment rate, and labor force participation for everyone was at the 75.5 percent rate that it is for college graduates. In that scenario, we’d need to create 7,783,000 jobs for people without a high school diploma, 15,421,000 jobs for people with a high school diploma, 8,165,000 jobs for people with some college, and still only 417,000 jobs for college graduates.

    A lot has been made of the increasing income inequality in America. Part of it is due to higher wages for higher education. Another major reason is that the percentage of those who are working is smaller among lower-educated people, and bigger among those with more education. We could go a long ways toward reducing American’s inequality by putting more of our least advantaged people to work.
    I’d say we need a lot more hamburger flipping jobs, and I’m not about to complain because we are creating lots of them.

    Flickr photo by Jeremy Brooks

    Bill Watkins is a professor at California Lutheran University and runs the Center for Economic Research and Forecasting, which can be found at clucerf.org. A slightly different version of this article ran in the Orange County Register.

  • California is in for a World of Hurt

    California’s political class, led by Governor Brown, has been patting itself on the back for solving California’s problems. This celebration is ludicrous.  What they’ve done amounts to a mere slowing down in a long-term political, fiscal, and demographic decline. 

    Demographic trends themselves are creating a crisis brought about by a population that is simultaneously losing its children and getting older, and to a frightening extent poorer. From 2000 to 2010, the percentage of Los Angeles’ population under 15 years old fell by 15.6 percent. This was the greatest decline of any U.S. major metropolitan area, and about double the U.S. average of 7.4 percent.

    California’s poverty statistics are just as depressing.  The state now is home to one-third of all US welfare recipients. According to a Census Bureau report, The Research SUPPLEMENTAL POVERTY REPORT: 2011 California has the nation’s highest poverty rate of any state. By its Supplemental Poverty Measure, 23.5 percent of California’s population is poor, while only 15.8 percent of the nation’s population is poor.  No other state is above 20 percent.

    Because of its aging and increasingly poor population, its dearth of young people and migratory trends, demand for government services in California will be increasing as the number of people available to pay for those services will be decreasing.  Financing concurrent expenses will be hard enough.  Paying for today’s excesses may prove impossible.

    Let’s go through the evidence:

    Figure 1 shows California’s Department of Finance’s (DOF) estimate of domestic migration, migration between California and other states.  According to the DOF, California’s domestic migration has been negative in 18 of the past 20 years.  This is less dismal than the U.S. Census’ estimate that California’s domestic migration has been negative for 20 consecutive years.  This is the longest sustained period of negative domestic migration in California’s history.  We’ve seen this before, in the rust belt.  It leads to decay, poverty, increased crime, and unlivable cities.

    Domestic migration is important because it should be seen as an early warning signal of eventual decline.  Migrants are the proverbial “canaries in the coal mine”.  When domestic migration is negative, people are voting with their feet.  They are saying that California doesn’t provide enough opportunity to stay, particularly given its high cost of living.  Given how comfortable it is to live in California, I think they make that decision reluctantly.

    Over most of California’s recent history, international migration has been strong enough that total migration remained positive.  That’s no longer true.

    Figure 2 shows California’s total net migration for the past 107 years.  Prior to 1993, California had never seen a year where total migration was negative.  Now, we’ve have negative migration for eight consecutive years.

    More critically, the rate of foreign migration in the state’s cities is falling behind many competitor cities. For example, over the last decade, New York had almost six times the increase in foreign born than Los Angeles. Houston, which has barely one third the population of LA-Orange County, increased its foreign born nearly four times as fast. Overall, LA-Orange had the lowest percentage increase of any major US metro. Given that the Southland has been the state’s immigration magnet for a generation, this is not good news.

    Weak, negative migration is likely to continue.  We used to characterize domestic migration as pull migration; rapidly growing economies attract migrants looking for opportunity. International migration, especially from other countries in this hemisphere, was thought to be push migration; conditions were so bad in the country of origin that migrants would come to California even in a recession.

    Apparently, that’s no longer true.  Mexico, for example, has an unemployment rate of about half of California’s today.  When you add the increased cost imposed by coyotes on illegal immigrants (a price increase from about $3,000 a few years ago to about $6,000 today plus the requirement to carry drugs), it’s no mystery why California’s growers are having a hard time finding an adequate workforce.

    Negative migration is important because migrants have been a critical part of California’s growth and creativity.  Not only is California losing the services of the migrants who choose, say, Texas instead of California, California is suffering a drain of some of its talent pool, particularly among those about to have children.

    For a long time, many people thought that California’s Hispanic population would cause its population growth rate to increase.  That turns out to not be true.

    Figure 3 shows California’s birthrate.  Our births per thousand population is the lowest it’s been since the worst part of the depression.  What’s scary though, is the rate of decline.  Births have fallen below 15 per thousand and seem destined to hit 10 per thousand.  This is a national trend and a key reason to create national policies that encourage increased international immigration.

    If a population is growing, it’s possible to have increasing births (new people) even when the birth rate is declining. Unfortunately, California isn’t there.

    Figure 4 shows the total number of births in California.  It’s fallen to 500,000 per year from 600,000 per year about 20 years ago.  If California’s birth rate falls to 10 percent, we can expect the number of births to decline to about 350,000.  At that point, the math starts to get to be a problem.  Is a decline to 10 per thousand possible?  You bet.

    According to the CIA, as of 2012, 29 out of 221 countries (13 percent) had birth rates below 10 per thousand.  Those 29 countries included Japan, Germany, Switzerland, South Korea, and Singapore.

    Unfortunately, California — as opposed to states such as Texas — could reach a 10 per thousand birth rate within 10 years if existing birth rate trends continue.  Even more disturbing, there is no reason to believe that 10 per thousand is a lower bound.  Germany, for example, has a birth rate of 8.33, while Hong Kong and Singapore have rates of only 7.54 and 7.72 respectively.

    For California’s population to continue to grow, births have to outnumber the losses to migration and deaths.  We’ve already discussed migration.  What about deaths?

    Figure 5 shows annual California deaths from 1971 through 2012.  While recently flat, the trend is up, and an aging population implies more increases. For our calculations, we’ll assume California deaths at 250,000 per year.  This is a conservative assumption. As the Baby Boomers age, California deaths will increase.

    When California’s birth rate falls to 10 per thousand, we can expect 350,000 births.  Deaths will be about 250,000. Apparently, as long as outmigration doesn’t exceed 100,000 California’s population won’t decline overall.

    The good news is that outmigration in excess of 100,000 has only happened once.  California’s net outmigration exceeded 100,000 for two consecutive years in the 1990s, when California was undergoing a dramatic economic realignment brought about by the end of the Cold War. 

    The bad news is that we’ve come very close to losing 100,000 twice in the past eight years, particularly during the housing boom. Many people believe that low home prices are restraining domestic outmigration, because people are waiting for equity to return before making the move. Higher home prices and increased tax rates could drive big increases in the numbers of people leaving California.

    Unless there is some dramatic change, it is almost inevitable that California will suffer a declining population within a generation. The way to avoid this calamity is create an economic environment that encourages job growth and economic activity. 

    At the same time, it appears prudent to begin planning now for an aging and possibly smaller population.  Increased government revenues through more robust and varied economic activity would help here, but more probably needs to be done. California needs to reform its business climate, reduce its debt and unfunded liabilities, and do so quickly.

    Bill Watkins is a professor at California Lutheran University and runs the Center for Economic Research and Forecasting, which can be found at clucerf.org.

  • The California-China-CO2 Connection

    Michael Peevey, President of the California Public Utilities Commission, is sincere and concerned about CO2 emissions. At a recent presentation at California State University Channel Islands, he spoke about California’s efforts to limit emissions. He mentioned green jobs, but, to his credit, he did not repeat the debunked claim that restricting CO2 emissions will be a net job creator. He also acknowledged that it doesn’t much matter what California does, if China doesn’t change its behavior. It turns out that if California were to reduce its carbon emissions to zero, in about a year and a half global CO2 would be higher anyway, just because of the growth in China’s emissions.

    Peevey talked about California’s increasingly ambitious plans for carbon reduction in the future. The goals include returning to 1990-level CO2 emmisions by 2020, and then an 80 percent reduction by 2050, regardless of population changes.

    This is going to be expensive. And the price of some of the potential technology — such as capturing atmospheric CO2 and pumping it underground — will include a lot more than the direct cost. The ultimate costs will, unfortunately, include increased global CO2 emissions.

    Some readers will remember the first time Larry Summers, the former US Treasury Secretary (under Bill Clinton) put his public career at risk because of his bluntness. In 1991, while Chief Economist at the World Bank, Summers gained international notoriety by saying in a memo, “I’ve always thought that under-populated countries in Africa are vastly under polluted.”

    That was the first of many times that lots of people demanded his head. He’s since claimed that it was sarcasm, but I don’t believe it. I believe he meant that environmental quality is a luxury good; that poor people need things like food and shelter, and they don’t much care if they trash the environment in the process. So, if pollution were localized, the poor would gain jobs and the wealthy would have an improved environment. Presumably, each would be happier.

    Of course, that sounds terrible to most people. But that’s precisely what we are doing here in California, only we’re doing it worse.

    California, by making production so very expensive, is chasing producers to places with low pollution controls. It’s worse than the situation Summers describes, because carbon dioxide emissions do not remain local. They spread throughout the atmosphere. Perversely, California is causing a global increase in CO2 emissions by its regulations limiting CO2 emissions in California.

    The problem is the result of acting on the concept of Think Globally and Act Locally (TGAL). TGAL works when pollution is local. But when air pollution is free to float around the world, you have to have a different strategy, and get the most reduction for your investment.

    And you don’t get the most for your investment in California. In terms of carbon efficiency — the ability to generate output while emitting less CO2 — California is one of the world’s most efficient economies. Each new reduction in CO2 becomes increasingly expensive. That is, reducing emissions is subject to increasing marginal costs. Reducing carbon emission in California is really expensive because we’re so carbon efficient already. Reaching the 2050 goal will be incredibly expensive. Worse, it won’t do any good.

    It’s not as if California can really afford it. Last month, I participated in the South Coast Association of Governments (SCAG) Third Annual Economic Summit. This great event provided lots of information about the economic challenges facing Southern California. For example, we learned that Los Angeles County’s economy will probably not reach its pre-recession level of jobs until at least 2018 and perhaps not until 2020.

    That’s a sobering thought.

    California State Sen. Roderick Wright, D-Los Angeles, a powerful speaker, documented California’s industrial decline, and made an emotional appeal for polices that produce jobs. The audience gave Wright a rousing ovation, something quite rare at economic conferences. The problem is that the audience was comprised of economic development people. Too bad no one else was listening. It was poorly attended by policy makers. There were only a handful of elected officials.

    California’s economy is struggling, even if many in the political class refuse to acknowledge the fact. Because of that, our investments need to be wise. The correct strategy for California is global. We need to go looking for the low hanging fruit.

    The low hanging fruit is mostly in developing countries like China, India and Brazil. We’ve tried to get them to cut their emissions at Kyoto and the like, but they refused, pointing out that they are much poorer than the West, and that we were able to develop with lower-cost polluting industries. They have a point.

    We should help them cut their carbon emissions. Reducing a ton of CO2 emissions is far cheaper in China than in California. So, let’s reduce it there.

    There are political problems with this proposal. California’s carbon regulations were sold to the people on the absurd claim that the regulations would be profitable: better than low cost, better than a free lunch.

    The bigger problem would be convincing California voters to tax themselves to clean up Chinese factories. That seems to me to be an information dissemination problem. If Californians knew the true cost of the existing program, and how little reduction in global CO2 concentrations it brings, they might logically be willing to look at other approaches. If they knew how much more effective a dollar spent on Chinese emissions was than a dollar spent on California emissions, they might seriously consider the proposal. The proposal could always be sweetened by requiring that all the work be done by California companies.

    It would be good for Californians. It would be a big step towards restoring California’s economic vigor. It would make a serious dent in global CO2 concentration. It would be less costly than our current plan.

    Let’s do it.

    Bill Watkins is a professor at California Lutheran University. and runs the Center for Economic Research and Forecasting, which can be found at clucerf.org.

    Flickr photo by doc tobin: Smog on the Great Wall.

  • CERF’s Economic Policy Plan

    Here at California Lutheran University’s Center for Economic Research and Forecasting, we think that each presidential candidate does have an economic plan. But it is a bit difficult to discern the policy under all the campaign noise. Then there is the problem of the truth. When out of office, each party claims to be the protector of the public purse. Each accuses the other of running deficits, and both are right about this. Except for a brief respite at the end of the 1990s, deficit spending has been the norm since the 1974 oil crisis. Of course, the current administration has embraced deficit spending with unprecedented enthusiasm.

    We think the Democrats’ plan is to increase spending and increase taxes, particularly on “The Rich,” anyone making more money than you. We think the Republicans’ plan is to cut taxes for everyone and cut spending that goes to anyone but you.

    These plans won’t work.

    To our Democratic friends, we say: You can’t tax and spend your way to prosperity. Governments may be different than people, but they still cannot avoid a budget constraint. The tax and spend policy eventually leads to Spain or Greece. Besides, the government is taking that money from someone. We haven’t seen anything to suggest that, at current spending levels, the government can more productively employ the money than the person they are taking it from.

    To our Republican friends, we say: You can’t cut the budget enough to fix it, and cutting taxes won’t fix either the economy or the budget. The deficit is about 10 percent of gross domestic product. That’s about the sum of defense and social security spending. We know you are not ready to get rid of every soldier and kick Granny out onto the street.

    Unfortunately, there is not enough fat and waste to argue that efficiency is the solution. The deficit is just too big. Besides, democracies are extremely poor at cutting government spending; witness Europe. We also saw what happened in Wisconsin when the state budget was cut a trivial amount when compared to ten percent of gross product.

    The problem is that hard government costs, non-transfers, are just too small to allow the cuts of the size that would be required to eliminate the budget. Transfer payments would have to be cut, but each transfer payment comes with a constituency. Those constituencies will doom spending cuts.

    Since your plans won’t work, we’ve come up with our own:

    Spending: Total government spending (federal, state, and local) in the United States represents about 37 percent of gross domestic product. It is actually a bit higher than what we saw in World War II. We believe that at this level, government spending is hurting growth. So, government, measured as this percentage, needs to become smaller.

    We can’t cut government spending significantly. We can stop its growth. We propose capping real per-capita spending at current levels. This would allow budget growth due to inflation and population growth. No one loses anything. So, while larger-government proponents would object to the plan, the lack of losers would minimize resistance.

    Once spending was capped, we recommend some compositional changes that would improve economic outcomes. Because this would create losers, there would be resistance. However, for every dollar reallocated, there is also a winner. The political outcome is uncertain.

    Our recommended changes would reallocate government funds away from uses that retard or distort economic growth. This would help minimize future budget challenges, and it would increase economic growth. Still, these changes are not as important as capping spending.

    Our first change would be to eliminate all subsidies in the budget. These include subsidies for businesses, farms, and consumers. Government’s place is to provide the environment for economic growth, not pick the winners or losers. There is abundant evidence that government is not better at market decisions than are market participants. Let the markets work.

    This is not to say that we would eliminate the safety net. Modern economies need a safety net, one that provides a socially approved standard of living while maintaining incentives for productive work. We would let recipients decide how best to allocate their funds.

    We would also raise the retirement age. Official retirement ages have failed to keep up with advances in life expectancy and health. The result is that we are losing, in some cases, forcing out, incredible amounts of human capital. Given the economy and the demographics, we need that human capital working for us.

    Finally, we would concede defeat on the War on Drugs. No doubt, drugs impose a heavy price on users, their families, and society. The impacts are tragic. However, the War On Drugs has failed to eliminate drug use. It’s not even clear if the war has reduced drug use. Drugs are not only readily available, it’s easier for a high school student to obtain drugs than alcohol.

    The costs of prohibition, even if partially effective, are high. The costs include higher crime rates, gangs, prisons, direct police costs, and the costs of police being diverted from more productive uses. If we were to take all the resources currently spent on the War on Drugs and use those funds to provide education, counseling, and treatment the economic costs of drug use would go down.

    Taxes: Our recommended changes to the tax code would increase revenues and improve economic outcomes. So called “spending in the tax code” reduces government revenues and creates effectively distortionary subsidies. We need to get rid of this, for all the same reasons that we need to get rid of subsidies in the budget. We would eliminate all tax deductions, including individuals’ mortgage deductions and employers’ healthcare deductions.

    We would keep existing individual income-tax rates, neither lowering marginal tax rates nor increasing marginal tax rates. However, we would eliminate the differential tax rates that capital gains and dividends enjoy. That is, we would tax dividends and capital gains as ordinary income.

    Taxing dividends and capital gains would allow us to eliminate corporate taxes, removing the double taxation of capital, putting capital and income taxes on an equal footing. By taxing capital and labor at the same rate, we would eliminate distortions and improve economic outcomes.

    Economic Policy: If real per-capita spending is fixed, the only way to reduce government’s share of the economy is to have real per-capita economic growth. While real per-capita economic growth has been the norm since the industrial revolution, achieving it has been a problem in the past few years. Policy has been part of the problem. Fixing the policy will result in an immediate robust recovery.

    Most people would not suspect that immigration policy is the first policy we would change. Specifically, we would initiate a massive increase in legal immigrations. The benefits would be far-reaching and immediate. An increase in population would drive up housing prices. This would restore Americans’ balance sheets by offsetting the losses from the bust. It would immediately increase activity in the construction sector and in all sectors that benefit from increased home construction.

    There would be other benefits. Legal immigrants are educated risk takers with a lot to gain. Far from taking jobs from Americans, they create new businesses at higher rates than the domestically born. The talents, creativity, and drive they would bring would hit all sectors like a power drink.

    By itself, changing immigration policy would change our economy’s trajectory in a dramatic way, but there is more that could be done. Removing all trade barriers is an obvious option, but decreasing regulation offers the most gains after changing immigration policy.

    Bad regulation is a bipartisan activity. Sarbanes-Oxley and Dodd-Frank are two of the worst regulations to come along. They need to be repealed.

    Sarbanes-Oxley, passed under George Bush, fixed a problem that did not exist. It was passed in response to the Enron scandal, even though everyone involved went to jail under pre-existing law. It imposes a huge and unnecessary burden to small business in particular.

    Dodd-Frank was passed in response to the 2008 financial crises, but it does nothing to prevent another crises. In fact, it imposes huge costs to financial institutions, even as it enshrines the concept of too-big-to-fail into law, guaranteeing another crisis. It needs to be repealed, and too-big-to-fail needs to be addressed directly.

    Finally, we would require a cost-benefit analysis of all existing and proposed legislation. Those provisions that failed the analysis would be rejected or repealed.

    That’s CERF’s proposed economic policy. It would result in an immediately robust economy. It would change lives, especially the lives of young people just entering the workforce. We put it out in the hopes that it advances our national economic debate.

    Bill Watkins is a professor at California Lutheran University and runs the Center for Economic Research and Forecasting, which can be found at clucerf.org.

    Flickr photo by s_falkow

  • How California Lost its Mojo

    The preferred story for California’s economy runs like this:

    In the beginning there was prosperity.  It started with gold.  Then, agriculture thrived in California’s climate.  Movies and entertainment came along in the early 20th Century.  In the 1930s there was migration from the Dust Bowl.  California became an industrial powerhouse in World War II.  Defense, aerospace, the world’s best higher education system, theme parks, entertainment, and tech combined to drive California’s post-war expansion.

    Then, in the evening of November 9th, 1989, the Berlin Wall came down.  On December 25, 1991, the Soviet Union was dissolved.  The Cold War was over.  America responded by cutting defense spending and called the savings the Peace Dividend.

    California paid that peace dividend.  A huge portion of California’s military industrial complex was destroyed.  The aerospace industry was downsized, never to come back.  Hundreds of thousands of well-paying manufacturing and engineering jobs were lost.

    The ever-resilient California bounced back though.  Tech, driven by an entrepreneurial culture and fed by California’s great universities drove California’s economy to new heights.

    Then, there was the dot.com bust.  A mild national recession was much more painful for a California dependent on its tech sector.  Eventually California recovered.  California’s tech sector and climate, aided by a housing boom, restored California’s prosperity.

    The housing boom was followed by a housing bust.  Again, California paid a high price, and unemployment skyrocketed to 30 percent above the national average.

    Today, California is recovering.  Its tech sector is once again bringing prosperity to the state.  Furthermore, California’s green legislation is providing the motivation for a brave new future of economic growth and environmental virtue.

    The story is true through the Peace Dividend.  California did pay a high price for the collapse of the Soviet Union.  California’s defense sector did begin a decline, and it never recovered.  But, defense recovered in other places, as the country expanded defense spending by 21 percent in the 2000s.  The United States has constantly been engaged in wars and conflicts for over a decade.  On a real-per-person basis, the United States is spending as much on defense as it has at any time since 1960. 

    But when it comes to the present, the narrative falls down.  Defense has rebounded, but not in California.  California’s defense sector is small and declining, not because of a permanently smaller U.S. defense sector, but because of something about California.

    California’s tech sector did boom after the collapse of California’s defense sector, but that doesn’t mean that California recovered.  In fact, much of California never recovered.  It’s the aggregation problem. 

    The 1990s’ recovery was largely a Bay Area recovery.  Los Angeles hardly saw any uptick in employment.  Here is a chart comparing Los Angeles County’s jobs growth rate with the San Jose Metropolitan Statistical Area (MSA): 

    San Jose probably had California’s fastest growing job market in the 1990s.  Los Angeles was not the states slowest.  Still, the differences are striking.

    A few years ago, a couple of my graduate students looked at California data from 1990 through 1999.  They divided California into two regions, the Bay Area and everywhere else.  The Bay Area was defined as Sonoma, Marin, Napa, Solano, Contra Costa, Alameda, Santa Clara, Santa Cruz, San Mateo, and San Francisco counties.  Using seven indicators of economic growth, they performed relatively simple statistical tests to see if the two geographies experienced similar economies.  The indicators were employment, wages, home prices, bank deposits, population growth, construction permits, and household income.

    By every measure except population growth, the Bay Area outperformed the rest of the state.  The exception was probably due to commuters to the Bay Area, given that region’s exceptionally high housing prices. 

    Some economists will tell you that California saw faster-than-national job growth from the mid 1990s until the great recession.  This is another aggregation problem.  The claim is technically true, but only in the sense that California had a higher proportion of the nation’s jobs in 2007 than it did in 1995.  If you look at annual data, you will see that California’s share of the nation’s jobs only grew from 1995 through 2002.  Since then, California’s share of United States jobs resumed its decline:

    In reality, California never recovered from the dot.com bust.  California, perhaps the best place on the planet to live, couldn’t keep up in a housing boom.  Something was wrong.

    California had lost its mojo. 

    Opportunity is now greater outside California than inside California.  For almost 150 years, California was as widely known for its opportunity as it was for its sunshine.  The combination was like a drug.  George Stoneman, an army officer destined to become California’s 15th governor, spoke for millions when he said "I will embrace the first opportunity to get to California and it is altogether probable that when once there I shall never again leave it." 

    They did come to California, and they made an amazing place.  Opportunity-driven migrants are different than other people.  They take big risks to leave everything they know for an uncertain future in a new place.  They are confident, bold, and brash.   California became just as confident, bold, and brash.  The Anglo-American novelist Taylor Caldwell spoke the truth when she said "If they can’t do it in California, it can’t be done anywhere."

    That was then.  Today, California can’t even rebuild an old Hotel.

    The Miramar Hotel is a partially-demolished eyesore beside the 101 Freeway in Montecito, just south of Santa Barbara.  The Hotel’s initial structure was built in 1889.  Over the years, it was expanded to a 29 structure luxury hotel and resort.  In September 2000 it was closed for renovations which were expected to take 18 months.  That was when the fighting started.  Community groups, neighbors, and governments all had their own idea of what the Miramar should be.  Two owners later, and after millions of dollars, the future to the Miramar is still uncertain.

    The Miramar Hotel is a case study of what is wrong with post-industrial California, precisely because it should have been easy, and because it is not unique.  Everything is hard to do in California.  The state that once moved rivers of water hundreds of miles across deserts and over or through mountain ranges can’t rebuild a hotel.

    The situation will get worse.  California has become the place people are leaving.  The following chart shows that for 20 years more people have left California for other states than came to California from other states:

    California’s population is still increasing because of births and international immigration. 

    Two decades of negative domestic migration has taken its toll.  Millions of risk-taking, confident, bold, and brash people have left California.  They took California’s mojo with them.

    That seems pretty clear when you look at some statistics:  California’s unemployment is way above the national average.  With only about 12 percent of the nation’s population, California has over 30 percent of the nation’s welfare recipients.  San Bernardino has the nation’s second highest poverty rate among cities over 200,000.

    Sometimes though, aggregated data can hide California’s weakness, and some, representing the always-present constituency for the status quo, use these data to deny that California’s future is any less golden. 

    Most recently, those representing the constituency for the status quo have used California’s aggregated jobs data to argue that all is well in California.  They argue that California’s tech sector is leading California to a new golden future.

    Year-over-year data confirm that, through August 2012, California gained jobs at a faster pace than the United States.  Once again, though, that growth is largely confined to one industry and one geography.  California’s tech sector is recovering, and amidst a generally weak recovery, it appears strong enough to generate pretty impressive aggregated results.  If we disaggregate California’s data, we will find that there is not just one California.  There is a rich and mostly coastal California, with a few smaller inland counties on the San Francisco-Lake Tahoe corridor.  Another California is very poor and mostly inland.

    Here’s a list of California’s poorest counties by poverty rate:

    County

    Poverty Rate

    Child Poverty Rate

    Rank

    Del Norte

    23.5

    30.6

    3

    Fresno

    26.8

    38.2

    1

    Imperial

    22.3

    31.8

    6

    Kern

    21.4

    30.3

    10

    Kings

    22.5

    29.7

    5

    Madera

    21.7

    31.7

    8

    Merced

    23.1

    31.4

    4

    Modoc

    21.9

    32.5

    7

    Siskiyou

    21.5

    30.7

    9

    Tulare

    33.6

    33.6

    2

    Here’s a list of California richest counties by poverty rate:

    County

    Poverty Rate

    Child Poverty Rate

    Rank

    Calaveras

    11.1

    18.3

    10

    Contra Costa

    9.3

    12.7

    4

    El Dorado

    9.4

    11.6

    5

    Marin

    9.2

    10.9

    3

    Mono

    10.8

    15

    8

    Napa

    10.7

    14.7

    7

    Placer

    9.1

    10.7

    2

    San Mateo

    7

    8.5

    1

    Santa Clara

    10.6

    13.3

    6

    Ventura

    11

    15.3

    9

    There are some big differences here.  The percentage of Fresno’s children living in poverty is four and half times the percentage of San Mateo children living in poverty.  In fact, the data for California’s poorest counties looks like third-world data.

    When disaggregated, the job-growth data shows the same story.  Through 2012’s second quarter, jobs in the San Jose MSA were up 3.6 percent on a year-over-year basis.  In Los Angeles, jobs were up only 1.1 percent, while in Sacramento they were up only 0.6 percent.  For comparison, U.S. jobs were up about 1.3 percent for the same time period.

    You can perform this analysis for all types of data.  When the data are disaggregated, the story is always the same.  It’s telling us that California needs to get its mojo back, and the current tech boom is likely not to be enough for its recovery.

    Bill Watkins is a professor at California Lutheran University and runs the Center for Economic Research and Forecasting, which can be found at clucerf.org.

    Unemployment photo by BigStockPhoto.com.

  • Here’s Why People Don’t Think We’re in a Recovery

    The most recent jobs report was again below consensus.  With fewer than 100,000 new jobs, unemployment fell only because people continue to leave the labor force in huge numbers.  People are discouraged, and many don’t believe we are in a recovery.  Why would they think that we aren’t in a recovery?  After all, GDP is above its pre-recession high, and we hear all the time about how many jobs have been created over the past couple of years.

    People think we’re still in a recession because fewer of them have jobs than prior to the recession.  Below is a chart showing total non-farm U.S. jobs since 2000.  Today, we have millions fewer working than we did in 2007:

    People think that we are in a recession because they are poorer than they were prior to the recession.  As the following chart shows, Americans’ wealth is down a lot.  The average American’s wealth is down $39,000 or about 16 percent from its pre-recession high in 2005 dollars.  That is on average every man, woman, and child is $39,000 poorer than they were at the beginning of the recession.  An average family of four is $156,000 poorer than it was just a few years ago.

    Not only are Americans poorer than they were at the beginning of the recession, their income is down too.  Real (inflation adjusted) GDP may be climbing, but all of those gains are a result of increased population.  Real-per-capita GDP (the source of income) is still down more than $1,000 in 2005 dollars.

    Americans are poorer than they were, and their income is lower, and they are out of work or they know someone who is out of work.  Of course they don’t believe we are in a recovery.  The real question is that why, when things are this bad, does the chattering class spend its time debating trivial topics, such as which of the presidential candidates mistreats dogs the most?

    I think the answer is that the chattering class isn’t out of work, and they don’t know anyone who is out of work.  Maybe they know a banker who lost her job, but being a banker, she was probably evil.  So, no worries.

    This recession has hit sectors like construction and manufacturing disproportionally hard, and people who work in these sectors are not well represented in the chattering class.  Small businesses have also been badly hurt, and they too are poorly represented in the chattering class. 

    Other sectors have been hurt far less.  Education, healthcare, government, and professional services have each faced challenges, but these sectors’ job losses have been small compared to the most hard-hit sectors.

    One result of the different patterns of job losses across sectors is that we’ve seen an increase in income inequality.  Even worse, the increased inequality may be accompanied by declining upward mobility.  Income inequality without upward mobility is prescription for social trouble and slower economic growth.  Calls for income redistribution are only the beginning.

    Huge numbers of young people have failed to find jobs.  Many are living with their parents at ages far beyond what was normal just a few years ago.  Unemployed and disillusioned young people are another prescription for social trouble.

    What are our leaders doing?  Not much.  Congress is gridlocked and the President is campaigning.  The republicans call for tax cuts and spending cuts.  The democrats call for increased spending and tax increases.  Neither plan will work.

    The FED is trying to help.  It has instituted QE3, promising to purchase $40 billion in mortgage backed securities every month until economic conditions improve, whatever that means.  This will not do anything.  The FED has run out of bullets.  Policy now is all about convincing themselves and everyone else that they are doing something.

    Our deficit is huge.  It’s so large that if we were to cut all defense spending and cut all social security spending, we would just about eliminate the deficit.  But at what a cost!  We’d get rid of every soldier, gun, ship, and airplane.  We’d cut Granny off from her monthly check.

    We’re not going to do that.  We’re not going to cut the budget enough to get rid of the deficit.  So, give it up.  Budget battles on this scale are disastrous for democracies.  Best not to do it.

    Government spending is a problem.  That’s for sure, but you can’t fix it by cutting the spending.  That sounds wrong, I know, but the dynamics of democracy won’t let it work.

    Tax policy won’t do it either.  You can’t tax yourself to prosperity, and cutting taxes won’t help without a whole slew of complementary policies.  Increased spending won’t help.  The problem is that government is already too big relative to the economy. 

    Government at all levels is now about 37 percent of the economy.  This is higher than it was during World War Two.  It needs to become smaller as a percentage of the economy, but not by cutting.

    What we have to do is cap government spending on a real-per-capita basis.  We just keep spending what we’re spending per person, even after adjustment for inflation.  That way, there are no losers.  It should be relatively easy to gain support for a simple cap.

    Then, you grow your economy.  How to do that is another big topic.  But, we know the outlines:  Increase immigration.  Evaluate regulations for efficiency and economic impact.  Restructure the tax code to maintain productive incentives.  Restructure the safety net to improve incentives.  Restore incentives to education.  Remove barriers to trade.

    That is a big task, but it is a lot easier than cutting the budget as much as would be required.  It’s also a lot easier than suffering through a decade of anemic growth.  The benefits would be big too.  We’d be setting the stage for persistent prosperity.

    Bill Watkins is a professor at California Lutheran University and runs the Center for Economic Research and Forecasting, which can be found at clucerf.org.

    Unemployment photo by BigStockPhoto.com.