Author: Fanis Grammenos

  • Advancing the Texan City-Building Model

    Reading the recent report “The Texas Way of Urbanism” promptly reminded me of my status – twice a migrant; from small town to big city (Athens) and from big city to another country. These moves were propelled by a singular motivation: seeking opportunity to better my lot. I knew next to nothing about the cities I moved to: their shape and history, their culture, their social divisions and even language were absent from my viewfinder. All that mattered was the chance for a new start. And that’s how Texan metropolises emerge from the report’s pages – gates to opportunity. I carry this typical migrant perspective as a fact-checker to all discussions about cities – magnet-cities.

    It also rekindled an irritation about how warped the conversation about cities often is; as if a group of dilettantes in a pageant give cities points and declare winners. Points are given for: “urban/suburban”, “dense/spacious”, “compact or not”, “grid or not”, “beauty/ugliness” and so on. These arbitrary, spurious abstractions do not register with the migrant – the city’s wealth generator. A professor moves to a post away from home, a multinational corporation executive to another continent, and an oil rig specialist to a small-town with black gold – they are all wealth generators; they move to pursue a goal and, in the process, they build cities unwittingly. They shape them by their actions.

    In admitting that Houston “[….]is not beautiful upon first blush, nor does it offer the charm of pedestrian fancy that denser cities boast”, the report affirms that Texan cities have the right approach: first mind how to generate wealth, then empower citizens to achieve the good life. What follows is a city like no other in history, one that reflects its time, culture and values. It is not Paris, or London, or Tokyo, it is Houston or Austin. The model works. And just as all its predecessors, the new city is never static, not a stage set, it’s a movie in slow motion – it evolves.

    Evolution means adaptation to new pressures. It does not have a destination, a preordained ultimate goal, or shape. In that light, it is a reactive process, constantly responding to emergent conditions.

       The pressure for movement space and its distribution in cities like Barcelona is intense

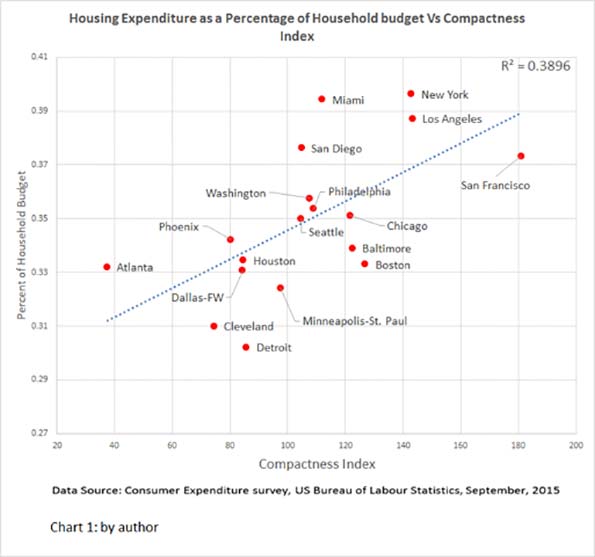
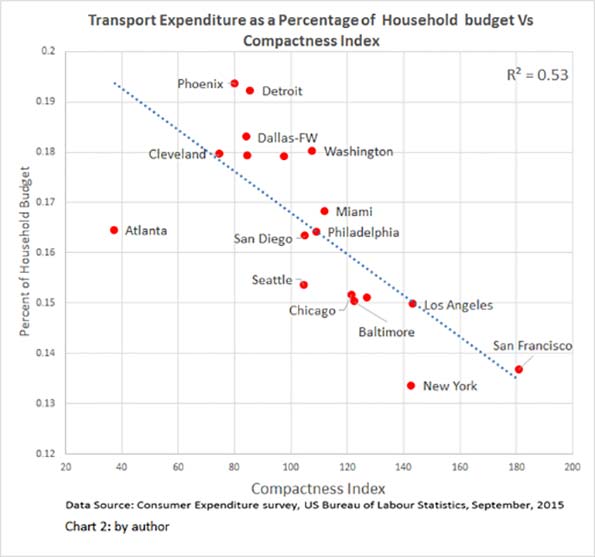
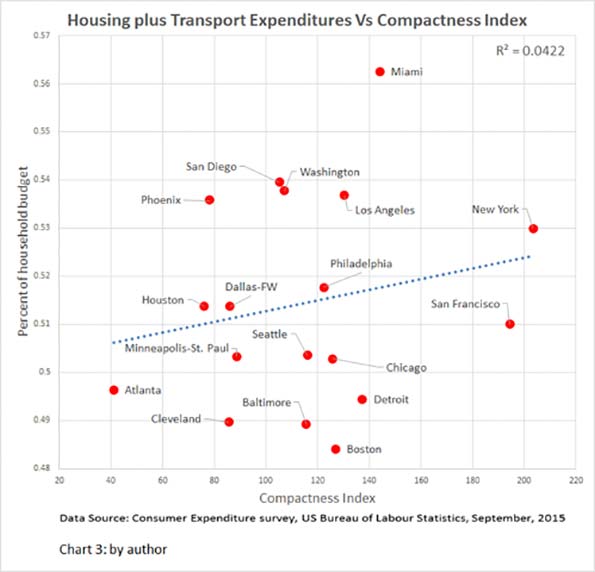
    From that perspective, the model that builds Texan metropolises is neither final or complete. It inevitably misses unanticipated, emergent factors that today play a role in a functioning city. It has, for sometime, incorporated responses to the pressures of a motorized economy by building infrastructure sufficient to move people and goods to their destinations and it does that better than other U.S. cities. But as the combined effects of automobility are tallied up, a new pressure point has built up. It demands an adaptation to the nature and function of non-motorized mobility and its realm – the foot realm. The pressure is not about more “beauty” or “charm” or a nostalgia for old times, it is about space: redressing the imbalance between space assigned for speeds exceeding 20 miles and space for those below. These two spaces are incompatible. A response to this pressure would add functionality to the Texan model of city making.

       Redistribution of space with controls

    Adaptations to rectify this imbalance need not be invented; they already exist mostly in older cities but also in Texan urban areas. However, they have been mostly sporadic and unsystematic. Nevertheless, all these case-by-case changes nurtured an appreciation for the vast improvement in the quality of the daily city experience, the heightened sociability and the intensified economic activity. In turn, this new appreciation generated greater demand for spaces and places endowed with these qualities.

    Two systematic, universal versions of a layout model – call them “hybrid” grids – have appeared; one in Barcelona, Spain and the second in Calgary, Canada. One for fixing built-up areas and the other for greenfield development.

    That the city of Barcelona would propose a model for transformation might have been expected. It has an expansive, regular grid that is under perilous pressure: extremely dense, congested, mired in emissions and all its surface space taken for motorized movement and parking. The only option was to reallocate the available space. And that reassignment is now underway.

    A team of Barcelona planners have started the implementation of the “superilles” (superblock) model to the classic Barcelona square grid, (see drawing). The principles underpinning the concept are simple and intuitive:

         •  No through motor traffic means that streets at the walking scale (400×400 m) serve as capillaries only; they occupy the lowest rank in the network hierarchy, where circulation essentially stops. They serve the residents of a “quadrant” (or “quartier”) only, are unmistakeably local and, thanks to lighter traffic, can be made narrower, freeing up space for other functions.

         •  Full accessibility for active transport within the quadrant: people circulation is switched “on” while motorized transport is “off” by means of looping cars back to its perimeter. This preferential filtering manages the permeability of the quadrant to its residents advantage. Additional switches, such as card-activated bollards and the scheduling for entry, parking and deliveries, would add accuracy and flexibility of the “on-off” switching and refine the filtering.

         •  Surface space gained from the circulatory function is then assigned to nature and to recreational/social activities thereby strengthening cohesion within each quadrant.

    These typical modular layouts are then applied to the entire grid of the city with appropriate modifications for circumstantial conditions.

    Houston and Austin are two among many U.S. cities that sport square grids just like Barcelona’s. Houston in particular has inherited exceptional 80-foot right-of-ways that offer considerable design flexibility for rearrangement.

    The adaptation that will address the imbalance between vehicular and non-vehicular space in a city is here awaiting adoption. Texan cities can advance their already effective city-building models to a higher state of completion and of responsiveness to current pressures.

    Fanis Grammenos heads Urban Pattern Associates (UPA), a planning consultancy. UPA researches and promotes sustainable planning practices including the implementation of the Fused Grid, a new urban network model. He is a regular columnist for the Canadian Home Builder magazine, and author of Remaking the City Street Grid: A model for urban and suburban development. Reach him at fanis.grammenos at gmail.com.

    Top image: Augustus Koch (1840-?). [Public domain], via Wikimedia Commons

  • Compactness and Canadians

    The May, 2016 New Geography feature, Are Compact Cities More Affordable? questioned whether the Vancouver region supplies evidence that Housing-Plus-Transportation (H+T) creates affordable living climates. Todd Litman responded with a critique; here’s a partial response to Todd Litman’s comments, which are rich in assertions and advice but poor on science. Our full response can be viewed in the attached pdf. The central issue of whether there is evidence that the Vancouver Region as a whole offers the advantage of H+T affordability to its residents is bypassed. Hence, there is no research news.

    Litman’s criticism centers on issues that undermine his thesis or on speculative data that would prove a point, if available, for example, bias in our data. Almost certainly, the data is “managed,” incomplete, erroneous and biased — but at the source: the Metro Vancouver report that advocates H+T affordability. A missed observation? The absence of figures on compactness makes it impossible to draw the sought-after correlation between affordability and density, the indispensable evidence for H+T. Yet the critique ventures to do exactly that.

    Attempts to “prove” an association rest entirely on incidental observations of certain sub-regional districts based on personal “knowledge” of them without including density numbers, and by dismissing some as outliers or “special cases,” an unproductive attempt at science.

    A track to demonstrate how alternative data could show that homeowners are not as well off as they seem leads to the unusual idea of limiting the sample to an improbable and undefinable set. Curiously, the source data is arbitrarily curtailed in a similar manner. Another missed observation?

    Litman has previously cited as evidence the subject correlation for US metro-regions produced by scholars, a clear, scientific result. The sub-regional level correlation remains an open research task; incidental observations cannot fill that gap. New research windows open in our full response, which can be viewed in the attached pdf

  • Are Compact Cities More Affordable?

    Housing affordability has been a tenacious and intractable urban problem for as long as stats have been kept. Several cities recently declared it a crisis. But what kind of problem is it? Opinions vary widely. An economic problem, or a social one? A land resource issue? Or, as traded wisdom would have it, the result of reliance on the wrong urban form? Proposed solutions vary accordingly. Now, new evidence rules out one potential source of unaffordable housing: clearly, it is not an urban form problem. The widely-believed theory that a city’s lack of affordable housing can be fixed with increased compactness — when combined with public transit — is apparently wrong.

    In a recent article we questioned a publicized correlation between a compactness index level (i.e., urban form) and housing affordability. The argument supporting compactness is that it enables the use of public transit and active mobility modes, which reduce transport expenses sufficiently to eclipse the higher cost of housing prevalent in compact districts. We challenged that assumption, and found that data from eighteen US regional metro regions showed no such effect. Even if it were at all present, it would not be sufficiently pronounced to be an effective solution. Those conclusions were based on a regional look at the problem.

    While the aggregate regional data undermined the urban form theory of affordability, what do sub-regional level data show? At this finer level, could the housing-plus-transportation burden work to the advantage of households? To answer this question, we used data from 18 districts of the Metro Vancouver (BC) region. In this case, the official data exclude certain types of households — a critical limitation. But, given that such disaggregated data are rare, an effort at deciphering their meaning is warranted.

    The two subject groups were Working Homeowners and Working Renters. First, we looked at whether or not the working homeowners could find accommodation that suited their income without stretching themselves thin.

    Chart #1 shows the progression of housing costs in each sub-regional district, and the corresponding household median income. The in-step slopes of the two data sets suggest that working home-owning households have housing costs in tune with their earnings. This implication is further confirmed by the strong correlation (R2= 0.8598) between their income and their housing expenses.

    Housing costs that are proportional with income are a positive sign, but can these homeowners actually make their mortgage payments without financial stress? The data says yes, they can. This group’s average ratio of housing payments to income is 26%. It never exceeds 30%, the accepted threshold of financial strain.

    Instructively, from an urban form perspective, the highest ratios occur in the central, compact district; a confirmatory finding. Equally expected are that the lowest cost-to-income ratios occur in districts furthest from the center; these districts are either suburban or exurban.

    But are any of these home-owning households disadvantaged by excessive transportation costs due to their location? The data show a normal, average transportation expense of 14% of income and a range from about 8% to 20%. The ratios do increase with distance, but bear no significant correlation with income (R2= 0.0178).

    When choosing the place of residence, do homeowners consider housing costs, but disregard transportation costs? If so, could this lead to an affordability problem as measured by the combined costs? Apparently not. Chart #3 graphs (blue line) this group’s cost burden for combined housing and transportation (H+T) expenses, which never exceed the recognized affordability threshold: 45% of income.

    Conclusion? Metro Vancouver’s 305,000 households of working homeowners with mortgages aren’t experiencing financial strain due to their housing costs, no matter what their preferred housing form, location or transportation arrangements. The urban and suburban locations of the city structure fully satisfy their housing and transport needs. Neither compactness nor its absence has a negative impact on their finances.

    The data paints an entirely different picture for the 224,000 working households that rent their accommodations. Their average H+T burden (Chart #3; orange line) is 51% of their median income, and it ranges from the 45% threshold of affordability to an extreme of 65%.

    This picture, however, is not the result of high housing costs; rents register in the affordable range in all locations but two. The average working renter’s housing cost is 26%, which mimics that of a homeowner, and the range is below the stress level of 30%, with only two outliers (out of 18 districts) at 35% and 45% of income. For renters, as is the case for homeowners, the highest housing costs occur in the more compact districts. The outliers are found in elite social cluster districts — highly desirable neighborhoods — entirely unrelated to urban form.

    Given that rent costs are within the affordable range in all but two locations, we may infer that the Metro Region provides a sufficient range of housing costs for this group in its current urban/suburban structure.

    These findings are reinforced by the proportionality of incomes and housing expenses for both homeowners and renters. The incomes of renter households range from 45% to 63% of homeowners by location, and their rent costs are from 45% to 65%, an almost identical range.

    It would seem, then, that the excessive H+T burden renters face can be attributed partially to the transportation costs of this group. However, contrary to expectations, of the six districts that have rapid rail service (sky-train; black markers on Chart #3), not one manages to have a total burden below the affordability threshold. That even goes for the two suburban districts that offer the lowest rents.

    Chart #4 clearly shows the division between the earnings of owners and renters, and the affordability threshold that separates them. The belief that a compact urban form provides a path to solving housing affordability problems appears untenable.

    Overall, the data shows that for working homeowners there are no locations in the Metro Vancouver Region, whether urban, suburban or exurban, that push housing costs or the combined costs of housing and transportation above the affordability threshold. Urban form is not affecting budgets in these households.

    For working renters, rents are affordable in 16 of the 18 districts, whether urban, suburban or exurban. However, when transportation costs are added to their housing costs, the new sum puts them in financial stress, even in districts served by rapid rail transit.

    This sub-regional, limited analysis confirms the findings of our earlier regional look: compactness and access to transit do not produce the affordability benefits that have been claimed. The compact urban form does not equal more affordable living, particularly for the less affluent.

    Fanis Grammenos heads Urban Pattern Associates (UPA), a planning consultancy. UPA researches and promotes sustainable planning practices including the implementation of the Fused Grid, a new urban network model. He is a regular columnist for the Canadian Home Builder magazine, and author of Remaking the City Street Grid: A model for urban and suburban development. Reach him at fanis.grammenos at gmail.com.

    Flickr photo by Nick Kenrick: The Neighbourhood of East Van

  • What Price Urban Density?

    We regularly hear the argument that living in a compact city is more affordable than living in one that is more spread out. But what does the data actually show about the cost of housing in compact cities, and the cost of transport in these dense places? The relationship between those two expenses and the compactness of a city could tell us much about which kinds of places are most affordable, since those two costs together dominate household budgets.

    Advocates of denser urban environments have developed an index to measure the effects of a range of aspects of city living, such as vehicle miles traveled, traffic safety, congestion, the cost of housing, the cost of transportation, and health outcomes, among many other issues. The index takes into account several metrics, such as density, street accessibility and the mix of land uses.

    The index was conceived with the intent to study presumed negatives of city growth, and to make such growth “smarter.” Since the impulse to create it was advocacy-driven, it may lack objectivity. Notwithstanding this potential bias, and lacking alternative data, we used it as the default measure for our analyses, and consider our work a chance to test the validity and reliability of the index.

    First, we looked at housing costs. Casual and investigative observers seem to agree that housing costs do rise with city compactness. A recent report on the effects of compactness determined that housing costs increased by 1.1% for every 10-point increase in the compactness index. Other researchers have come to similar conclusions, using only population density as an indicator.

    Chart 1, which plots data from the 2015 Consumer Expenditure Survey, confirms this general agreement on the correlation between compactness and housing costs. But questions arise from the sharp differences between pairs of cities.

    For example, Boston and Atlanta residents use the same percentage of their budgets — 33% — for housing. Yet Boston’s compactness index is at least 90 points higher: 37.4 for Atlanta, vs 126.9 for Boston. According to Smart Growth theory, that difference should bring housing expenditures for Bostonians to 43%, about the same level that is experienced by New Yorkers.

    In another comparison, Boston and Miami differ little in compactness: 126.9 vs 112. Yet these two cities differ substantially in the percentage of household budget residents devote to housing costs – 33% vs 39%.

    Clearly, in both these examples and in the chart above, compactness is but one of many factors and, perhaps, not the dominant one in the relationship between a city’s housing costs and its compactness. Others need to be identified, quantified and incorporated. The trend, however, is indisputable: Greater compactness increases housing costs.

    Do transportation costs follow the same trend?

    According to theory, cities that are more compact offer more transport options, particularly public transit systems, some of which, like subways, outperform all other modes for time — especially work commute time — and provide travel options that are more affordable. Walking and biking may also be alternate means of mobility that help hold down household transport expenditures in compact cities. The association between density and high non-auto share of trips has already been demonstrated.

    Consumer Expenditure Survey data from 2015, when plotted, confirms this assumption. Chart 2 shows a decreasing proportion of the household budget being used for transportation as a city’s compactness index increases.

    However, as with housing costs, a close look at the differences between paired cities raises questions. Atlanta and Philadelphia share the same percentage of household budget expenditure on transport, 16%. Yet they differ by 70 points on the compactness index, 37.4 vs 109.05. Meanwhile, Washington and Seattle register an almost identical compactness index — 107.6 vs 104.6 — but the latter, contradicting theory, has transportation costs that are 3 percentage points lower, even though it lacks a subway. Both these cases demonstrate that the current model for measuring the impact of compactness needs fundamental refinements to improve its predictive value.

    So far, the data show two countervailing trends: Housing costs rise with compactness, while transportation costs fall. This finding leaves the question of whether more compact cities are more affordable to live in, at least with respect to these two expenditures that consume about half of a household’s budget.

    Using the same data from the CES for the 18 cities, we plotted the results of combining the two expenditures, as a percentage of the household budget.

    Chart 3 shows an inverse, albeit weak, association of compactness with combined household expenditures of housing and transportation. It clearly does not indicate that more compact cities are more affordable for the average household. Upon a closer look the chart reveals some instructive surprises.

    First, Atlanta appears among a group of five most affordable cities, even though it has by far the lowest compactness index (40.9) of all eighteen cities in the CES survey. According to traded wisdom, its transport costs, being almost entirely based on automobile travel, should overwhelm its housing expenditures.

    Contradicting theory, Atlanta posts next to lowest average housing cost ($16,316/year), and also one but lowest transportation costs ($8,086/year). When considering that average income in Atlanta is on a par with that in Los Angeles ($69,821 vs $69,118), and that its compactness index is 80 points lower than LA’s, its comparative affordability challenges current thinking about compactness and its effects.

    Second, four cities hover around the same point of the index (#110), yet they cover almost the entire gamut of budget percentage expenditure (49% to 54%) for combined housing-plus-transport costs. The same is true for five cities aligning around the #130 of the index.

    It’s apparent that current theory falls short of adequately explaining field data. A city planner would find little comfort in knowing that a fourfold range of compactness can be equated with the same level of affordability, or that the same level of compactness can be associated with a wide range of combined transportation and housing expenditures. If anything, these results suggest that, because average housing expenses are double those of transportation, a yet-to-be-determined density ceiling might be an effective means of increasing a city’s affordability.

    The CES data is only a snapshot in time that may reflect transient conditions, such as gasoline prices, local inflated real estate markets, congestion levels that affect gas consumption, effectiveness and reach of public transit and so on. Variability in these factors will always affect the average transport and housing expenditures. A predictive model should be robust enough to handle such fluctuations, if it is to have practical value.

    Yes, greater compactness is associated with higher housing costs and lower transportation costs. But, contrary to unsubstantiated assertions, when these are combined, the result is less — not more — overall affordability.

    Fanis Grammenos heads Urban Pattern Associates (UPA), a planning consultancy. UPA researches and promotes sustainable planning practices including the implementation of the Fused Grid, a new urban network model. He is a regular columnist for the Canadian Home Builder magazine, and author of Remaking the City Street Grid: A model for urban and suburban development. Reach him at fanis.grammenos at gmail.com.

    Flickr photo by Tim Bartel of a San Francisco neighborhood

  • Kid-Friendly Neighborhoods: Takin’ It To The Streets

    Planners and parents have been concerned about two widely reported, and most likely related, trends: the increasing percentage of overweight children, and the growing number of hours that kids spend looking at a screen, be it a television or a laptop. These two activities take up most of the free time kids have after school. Add on the tendency for kids to be driven or bussed to school, and the result is what has been called a “nature deficit” — a disconnect to natural surroundings. Over the long run, the outcome could be a generation of physically unfit and socially maladjusted young adults. The warning statistics are all around us. Is there a way out of this unhealthy cycle? One answer may rest with our planning decisions. Can neighbourhoods be laid out so as to avoid these unwelcome results?

    Evidence from research pronounces an unequivocal ‘yes’. Many pieces shape the puzzle that forms the complete answer. The first element of a community friendly to outdoor childhood activity is its ability to draw people — adults as well as kids — out of their houses and prompt them to socialize with neighbours. Since 1980, several studies have shown that the great inhibitor to socializing on a street is traffic. The heavier the traffic, the less the socializing. When there’s not much socializing, adults and kids make fewer the friends, and the motivation to get out of the house goes down. A 2008 study on this showed that people who lived on cul-de-sacs had four times as many friends and two times the number of acquaintances as residents on through streets with heavy traffic did. It seems intuitive, and research confirms it.

    A second clue can be found by looking at the kinds of streets young kids play on most often. You may have guessed that research shows it’s the cul-de-sac. Kids on cul-de-sacs spent 50 percent more time playing actively than kids on other streets. Importantly, the benefits to kids who play on the street continue. Other studies have shown that play and exercise in the early years build an affinity for activity that can last a lifetime, and that, through friendships, these kids also develop the spirit of a beehive at work.

    The third puzzle piece needed to create a kid-friendly place is the presence of magnets in the surroundings. These are factors that pull kids out of their homes and send them walking to school, the corner store and other destinations. And one study found that of all the elements that would attract kids of all ages, the strongest common force was the presence of open space.

    How parents feel about letting kids play on the street, walk to school, or ride their bicycles plays into the result, too. Justified or not, parental fear and unease limits the range of activities that kids engage in, and builds unhealthy habits.

    This knowledge from the field provides a sketch of the essential elements of a kid-friendly neighbourhood and, beyond that, a child-friendly district. Which elements are most essential?

    There shouldn’t be any through streets in an area about the size of about ten city blocks. That feature gives kids plenty of room to move around in a low-traffic, low-speed environment. Parents socialize and kids play; parental insecurity fades. The easiest way to create this is by using connected cul-de-sacs and crescents.

    Every kid-friendly neighbourhood area should have at least one open space, whatever its size. That grants a safe haven for play — a magnet. Its land value will be recovered through higher values for the homes around it. Real estate research shows that homes near cul-de-sacs and open spaces command higher prices. And where there are bike and foot paths separated from the road, with few road crossings, parents are more likely to let their kids walk or bike ride.

    Can all this be achieved with a layout? Yes, by selectively fusing well known elements of available community plans. A number of examples of this fusion exist, and plenty of advice is accessible; check out, for example, Taking the Guesswork Out of Designing for Walkability.

    These techniques are not just for planning new neighbourhoods. Existing places can also be transformed to create child-friendly environments. Initiatives in many cities have changed neighbourhoods with positive results.

    How can you know when a neighbourhood has succeeded at incorporating these creative elements? One of the sure tell signs is chalk hopscotch marks left on the pavement! It signals that the kids have taken possession of a street, and are having fun. Every new family that moves into the neighbourhood will be heir to its physical and social benefits.

    Fanis Grammenos is the founder of Urban Pattern Associates (UPA), and was a Senior Researcher at Canada Mortgage and Housing Corporation for over 20 years, focused on housing affordability, building adaptability, municipal regulations and sustainable planning. Research on street network patterns produced the innovative Fused Grid. He holds a degree in Architecture from the U of Waterloo. For additional references on the studies mentioned here, please e-mail the author at fanis.grammenos@gmail.com.

    Flickr Photo by Joe Duty, Little Kid Down the Road chalking the sidewalk.

  • Does the Post Office Deliver in Today’s Urban Culture?

    The postal service has been ravaged by enormous deficits and massive layoffs. It will inevitably see the closing of thousands of buildings. Planners have taken notice. Countless journalists have lamented the loss of post-office buildings, praised their often remarkable architecture and called for pressure to save them. These buildings are catalysts of “community”, the authors have suggested, citing the chance encounters of townspeople. Something is profoundly wrong, we are told, when community incubators are eradicated.

    Certainly, the loss of these buildings signals the decline of an economic sector and inevitable job losses. Is it possible, though, that the focus on post office buildings overlooks contemporary urbanism? Could it signal inattention to the evolution of “community,” and an obsession with the 19th century?

    The Evolving PO: The post office building pictured at the opening of this article began its life in a traditional Canadian village of the 1860s. The 1800s was an era of the small entrepreneur and family business; fewer than 20% of families relied on a paycheque, compared to 80% today. The timber-merchant owner of this enterprise lived in a sprawling, classical style house that boasted status and refinement. By contrast, his 650 square foot store was a humble wood building. Even though its sign advertized dry goods groceries, it provided much more — it was a virtual mini-department store — including a postal service. It also supplied credit for up to a year, because farmers paid all their bills in the fall, after harvest. A similar pragmatic and profitable strategy of blending services now prevails in the K-mart, Wall-Mart and Target superstores.

    The idea is simple: a single service means only one source of revenue for the owner and single purpose trips for his customers. Neither is efficient, particularly in a small, walkable town. The store’s role as a community catalyst in comparison to the local tavern or church remains a matter of speculation.

    This 1891 example (below), is a stylish, elaborate 2000 square feet building in a town of 3,000 people, during the era of government-run postal service. Nearly four times larger than the first, it retails no other goods. Railway expansion, a bustling regional economy and a total reliance on postal delivery for communication, boosted business in Canada to annual revenues of $4,600 by the time this building surpassed its predecessor; a venerable sum when average daily wages were $1.50. The vast difference in building quality, size, civic importance and services, can be easily explained by the brisk business, the revenue size and, importantly, government ownership. Status and state symbolism could be financed with pride.

    Not for long. By the late 1960s only half of the 33 ornamented buildings in Ontario were still standing and none were owned by the government. The loss and shift in ownership had little to do with planning. A new urban culture of instant, and distant, paperless exchange had emerged that forced the transition to the next “building”.

    The Village Option: Today, it is not uncommon to see locations where the postal service counter occupies a miniscule portion of a small drugstore on the ground floor of a 20-storey apartment building. It resides on a principal artery, but without street facade, not even a sign announcing it. As in the village example, the service is only one of many the building houses: habitation, car park and a chain drugstore that offers the gamut of goods including convenience foods and drinks. Management’s “building” choice has reinvented the village option, where the PO is not housed in a separate building.

    In his turn, the retailer, opting to rent space for a postal service, knew the benefit of luring customers by mixing services on the same premises. The new urban condition, by now in full swing, puts the postal service in an appropriate symbiotic niche, reflecting its cultural status and economic value. The uncertain “community” incubator role that it might have played in the 1800s cannot be discerned in its current form.

    The postal service trajectory is not unique. The 20th century saw the decline of the church, the pub, live theatres and classic movie theatres.

    Of all the buildings that are presumed to play a catalytic community role, none rivals the church. Historically, innumerable towns sprang up through faith groups. Church buildings were their focus and intellectual well-spring. Nonetheless, the 20th century treated the church no differently than it did the pub and the post office.

    By 2005, of the 60% of US citizens who said they were religious, less than 20% attended church regularly. Attendance among US Roman Catholics fell from 75% to 45% in the last 60 years. In the UK, annual church attendance stands at 12%, in Sweden at 5%, and in Denmark at 3%. These are striking figures for an institution that has been a cornerstone of “community”. The outcome of this abstention is inevitable: churches are demolished or converted.

    Should the Pub Get a Sub? Pubs in Britain were closing at the rate of 27 a week in 2007 and 2008, continuing a downward trend that affected their small town numbers disproportionately. The media lamented the loss of a celebrated social tradition and, with it, exquisite examples of architecture and interior design.

    This loss of building-and-function raises the question of preservation, which leads to the question of subsidization. Should the pub get a sub to support its important value as social cement? Should other such buildings and their functions be subsidized? Some planners think so, in sharp contrast to the historic Protestant ethic of self-reliance.

    In a 2002 Urban Land article we read: “… In any case, the main street in a new urbanist community should not necessarily be considered a profit center; instead, it plays the role of the principal amenity.” And further on, “…However, had the [main street] shops been located there [where traffic is heavy], the regional traffic may have overwhelmed the small main street and undermined its role as a social condenser of the community.”

    This view permeates the pro-preservation articles on post offices and pubs. It implies that social incubator functions may well deserve a subsidy, and may function better when protected from heavy traffic. In contrast to this view is the vast array of traditional village and towns of exemplar urbanism, where a thriving Main Street is also a main thoroughfare through the town.

    A New Era: The loss of post office, church and pub buildings does not stem from some wrongheaded, antisocial planning philosophy that needs to be debunked, denigrated and disposed of. It is simply symptomatic of cultural, technological and economic shifts that go way beyond the realm of urban planning. To stop the loss of post offices, for example, it would be imperative to rescind the use of e-mail, fax and phone, an absurd proposition. For the salvation of the church, it might mean a new wave of proselytizing that would result in commitment to attendance, also a bizarre projection.

    Subsidies, protestations and benevolent planning decrees are hardly the answer for either existing or new communities. The urbanist’s “community” dilemma dissolves when the transition to a new era is recognized and embraced. Rather than compulsively hold on to “community’s” past loci, let’s stir the imagination toward its emergent places.

    Fanis Grammenos is the founder of Urban Pattern Associates (UPA), and was a Senior Researcher at Canada Mortgage and Housing Corporation for over 20 years, focused on housing affordability, building adaptability, municipal regulations and sustainable planning. Research on street network patterns produced the innovative Fused Grid. He holds a degree in Architecture from the U of Waterloo.

    Photos by the author.