This is a new report brief from the Center for Population Dynamics at Cleveland State University, download the pdf version here. The report was authored by Richey Piiparinen, Jim Russell, and Charlie Post.
In 1963, nearly 75% of America’s top 50 companies owned and extracted natural resources1. By 2013, only 20% of top firms were natural resource-based. Today, knowledge-focused industries such as IBM comprise over 50% of America’s top 50 firms. Translation: talent is the new oil.
But not every region has reservoirs of human capital. Historically, knowledge economies have gathered in select top-tier metros, termed “Islands of Innovation”2. Think Boston and San Francisco. There are numerous reasons for this, including access to select research institutions, as well as the productivity effects that arise when a cluster economy is formed3.
For scholars such as economist Enrico Moretti, this “Great Divergence”4 between “the best” and “the rest” will continue. “More than traditional industries,” writes Moretti in his book The New Geography of Jobs, “the knowledge economy has an inherent tendency toward geographical agglomeration.”
But is this trend inevitable? Will the divergence remain? One line of thought is that the cost of living in top-tier metros will inevitably lead to “capital equalization”5—loosely defined as the “convergence” between regions in job and income growth. Capital equalization was a key factor in the decline of the Rust Belt. Here, manufacturing jobs became automated or moved down South or overseas to cut labor costs. One could argue that capital equalization will re-map the geographies of the knowledge economy in a similar manner.
“The prediction of this view is the convergence of American communities,” writes Moretti. “Low-cost areas will attract more and more of the new, high-paying jobs. Cities that have been lagging behind-the Clevelands, the Topekas, and the Mobiles-will grow much faster. Bogged down by their high costs, San Francisco, New York, Seattle, and similar cities will decline.” That said, Moretti does not believe convergence is taking shape. “[T]he data don’t support this view,” Moretti continues. “In fact, the opposite has been happening.”
But there is data that do support this view, and it begins to sketch a newer geography of jobs that is enabling an increasing concentration of highly-skilled workers in America’s second-tier cities. AOL Co- Founder Steve Case has dubbed this convergence back into Middle America “the Rise of the Rest”6.
Where are America’s Highest-Skilled Jobs Clustering?
The most common measure of human capital is educational attainment, or the percent of a population with a college degree. Not all human capital is equal. Generally speaking, the higher the degree conferred, the more productive the worker, and this is reflected in pay. For example, the national median income by education level is as follows: $27,350 for a high school graduate, $50,050 for a person with a 4-year degree, and $65,565 for a person with an advanced degree7. The fact that those with a graduate or professional degree are paid highest is indicative of their productive capacity in the knowledge economy.
Specifically, a region’s highest-educated workers are likely to be job creators, not just job consumers. This primarily comes about two ways: (1) through direct job creation, such as a research doctor starting a biotech spin-off firm; and (2) through indirect job creation, particularly relating to the “downstream” effect a high- paying job has on the local service economy. Put simply, more income, more spending, equals more jobs.
What metros are experiencing the fastest growth in its concentrationof workers with advanced or professional degrees? To answer this, the analysis used data from the Current Population Survey (CPS) to compare the educational attainment rates of the nation’s largest laborforcesfrom 2005 to 2013. Of particular concern was the percentage of people in a regional labor force with an advanced or professional degree, and whether or not top-tier metros gained higher- skilled workers at a faster rate than second-tier metros. Here, the rate was calculated as the percent point change between a region’s 2013 educational attainment rate and its 2005 educational attainment rate for workers with an advanced degree.
Table 1 shows the results. In line with the Great Divergence, Washington, D.C. and San Francisco are experiencing the 1st and 4th fastest rates of change in the employment of high- skilled workers, respectively. However, three of the top five fastest-growth metros are second tier: Providence, Indianapolis, and Cleveland— each with over a 5% percent point change. While these metros cannot match the top-tier metros in the number of advanced degree jobs gained— e.g., Cleveland gained nearly 44,000 grad-level jobs compared to 157,000 for San Francisco— the data nonetheless speak to a number of second-tier metros converging, or “moving up”, into the knowledge economy hierarchy.
| Table 1 | Percentage of Workers with Advanced Degree, 2005 | Percentage of Workers with Advanced Degree, 2013 | Percent Point Change |
| Source: CPS 2005, 2013 | |||
| Washington, DC | 21.58% | 27.48% | 5.90% |
| Providence | 10.71% | 16.30% | 5.59% |
| Indianapolis | 11.63% | 17.08% | 5.45% |
| San Francisco | 17.49% | 22.88% | 5.39% |
| Cleveland | 11.68% | 17.00% | 5.32% |
| Kansas City | 10.88% | 15.49% | 4.61% |
| Jacksonville | 7.54% | 12.07% | 4.52% |
| San Antonio | 8.52% | 12.32% | 3.80% |
| Denver | 12.75% | 16.54% | 3.78% |
| Sacramento, CA | 9.07% | 12.78% | 3.72% |
| Detroit | 12.66% | 16.26% | 3.60% |
| Minneapolis | 12.30% | 15.55% | 3.25% |
| Riverside, CA | 5.08% | 8.09% | 3.01% |
| Pittsburgh, PA | 13.66% | 16.57% | 2.91% |
| Chicago | 14.70% | 17.55% | 2.84% |
| Philadelphia | 13.52% | 16.22% | 2.70% |
| Charlotte | 7.62% | 10.14% | 2.52% |
| Orlando | 9.28% | 11.73% | 2.45% |
| Boston | 21.03% | 23.41% | 2.37% |
| Seattle | 15.34% | 17.71% | 2.36% |
| Phoenix | 10.19% | 12.50% | 2.31% |
| Milwaukee | 12.32% | 13.87% | 1.55% |
| Las Vegas | 7.08% | 8.56% | 1.48% |
| Portland | 13.52% | 14.98% | 1.46% |
| New York | 17.14% | 18.56% | 1.42% |
| Columbus, OH | 12.95% | 14.35% | 1.40% |
| St. Louis | 11.91% | 13.20% | 1.29% |
| Dallas | 10.89% | 12.16% | 1.28% |
| Baltimore | 17.12% | 18.28% | 1.17% |
| Virginia Beach | 9.62% | 10.57% | 0.96% |
| Houston | 9.65% | 10.60% | 0.95% |
| Miami | 10.83% | 11.68% | 0.85% |
| San Diego | 14.27% | 15.03% | 0.75% |
| Los Angeles | 11.65% | 12.38% | 0.73% |
| San Jose | 23.33% | 23.52% | 0.20% |
| Nashville | 12.02% | 11.70% | -0.32% |
| Atlanta | 14.08% | 13.36% | -0.72% |
| Cincinnati | 10.23% | 9.22% | -1.01% |
| Tampa | 11.30% | 10.05% | -1.25% |
| Austin | 17.92% | 16.35% | -1.57% |
To further illustrate this point, rankings were calculated to show the metros with the highest concentration of advanced-degreed workers in the labor force for 2005 and 2013. Change rankings were then calculated to determine just how far converging metros like Cleveland and Indianapolis were rising in the knowledge economy hierarchy. Figure 1 displays the results. Notice the top of the rankings are comprised of traditional top-tier metros. Also, the change in these metro rankings from 2005 showed no variance (ranging from -1 to +1), indicating little “wiggle room” in the top echelon from 2005 to 2013. The exception, here, was Austin, which dropped 9 spots to 13th. Moreover, two metros—Indianapolis and Cleveland—moved up from the middle of the pack to rank 9th and 10th, respectively. Providence also made a large leap: from 29th in 2005 to 14th in 2013. These figures indicate there is a notable economic restructuring occurring in Indianapolis, Cleveland, and Providence that is perhaps forming a next generation of innovation nodes.
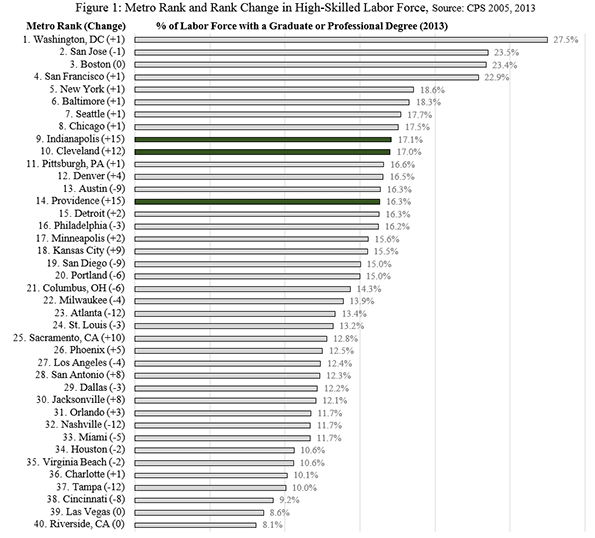
Now, in the case of Cleveland, do the results mean the gritty Rust Belt metro is experiencing robust job growth? Not exactly. From 2005 to 2013, 78% of the nearly 54,782 jobs added for college graduates in Greater Cleveland were for those with advanced degrees—meaning job growth for people with only a bachelor’s degree was sluggish at best. What’s more, job losses for Greater Clevelanders without college degrees was substantial: a decline over 83,000 jobs from 2005 to 2013. In other words, while the region’s highest-skilled workforce is converging into the ranks of the national elite, the effect has yet to be found “downstream” in direct or indirect job creation.
This is not unexpected. Specifically, economic restructuring, particularly for manufacturing-based regions, is a process, and a working theory for the Center for Population Dynamics is that a concentration of advanced-degree workers is an important leading indicator to more widespread growth8. As this line of inquiry evolves, an eventual step is to set up a policy framework so that the region’s growing concentration of high-skilled workers can be strategically catalyzed to lead to broader economic opportunities, rather than missed opportunities. The Center for Population Dynamics is currently constructing a working policy paper that will help drive this effort.
This is a new report brief from the Center for Population Dynamics at Cleveland State University, download the pdf version here. The report was authored by Richey Piiparinen, Jim Russell, and Charlie Post.
2 Hilpert, Ulrich. Archipelago Europe: islands of innovation: synthesis report. FAST, Commission of the European Communities, 1992.
3 Porter, Michael E. "Location, competition, and economic development: Local clusters in a global economy." Economic development quarterly 14.1 (2000): 15-34.
4 Moretti, Enrico. The new geography of jobs. Houghton Mifflin Harcourt, 2012.
7 Source: American Community Survey 1-Year Estimates, 2013
8 See: http://engagedscholarship.csuohio.edu/urban_facpub/1177/
Ranking America’s Top Young Labor Forces: A Rust Belt Rising?
This is a new report brief from the Center for Population Dynamics at Cleveland State University, download the pdf version here. The report was authored by Richey Piiparinen, Charlie Post, and Jim Russell
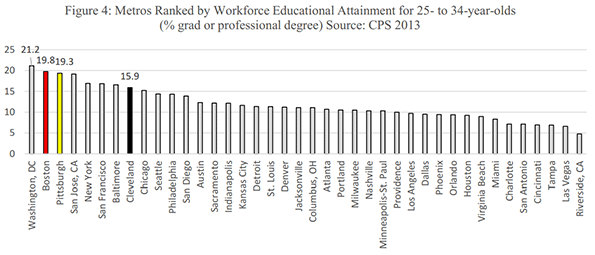
Greater Cleveland ranks 8th nationally in the percentage of 25- to 34-year-olds in the labor force with a graduate or professional degree, ahead of such “brain hubs” as Chicago, Seattle, and Austin. The analysis speculates as to whether or not this is a leading indicator to broader economic growth. Comparisons are made with Boston and Pittsburgh—two metros further along in the economic restructuring process.
Ranking America’s Young Adult Labor Forces
A region’s economic prospects are tied to its levels of human capital. The most common proxy for human capital is the educational attainment rate, or the percent of a population that has completed a bachelor’s degree or higher. Figure 1 shows the nation’s largest 40 metros ranked by the percent of residents 18 and over who have completed at least a bachelor’s degree. The Rust Belt metros of Pittsburgh and Cleveland rank 23rd and 31st, respectively.
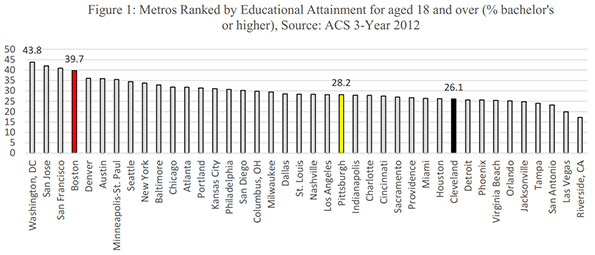
But there are issues with measuring educational attainment this way. Metros such as Cleveland and Pittsburgh have larger aging populations due to their settlement histories, and this significantly affects regional educational attainment rates. Why does this matter? Notes Pittsburgh economist Chris Briem1: “I argue all the time that such a metric says little about how well we are doing in recent decades at either educating the population, or on how we are doing at both attracting and retaining folks with higher education.”
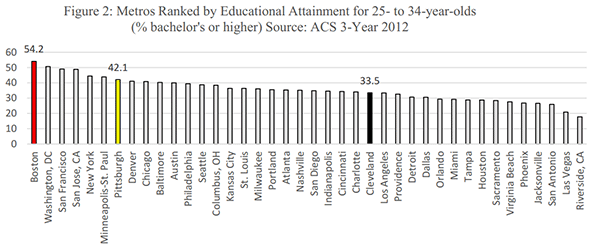
A better way to analyze human capital is through age cohort. Measuring the educational attainment of a region’s 25- to 34-year-olds is a leading indicator when it comes to understanding where a region’s economy is headed. Figure 2 shows the educational attainment rates for the 25- to 34-year-old age cohort. Greater Pittsburgh ranks 7th, moving up 16 spots. Greater Cleveland moves up 6 spots to rank 25th.
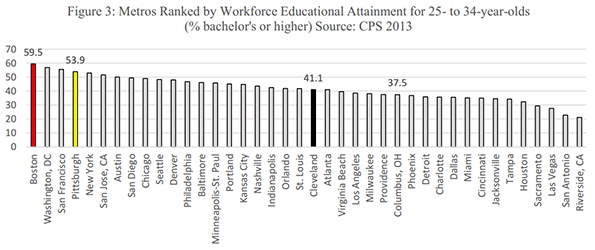
An additional method of examining a region’s skill level is to look at the educational attainment within the labor force, as opposed to population. The rationale for doing so is simple. Regions with proportionally large student populations, like Columbus, Ohio, can have exaggerated talent pools, at least in terms of economic productivity. That is, a college student may live in a region to consume knowledge but not necessarily be employed to produce output.
To calculate educational attainment in the labor force, data were analyzed for the 25- to 34-year-old cohort from 2013 Current Population Survey2. Figure 3 details the results of this analysis. Pittsburgh ranks 4th, whereas Greater Cleveland moves up to rank 21st. Conversely, Columbus, Ohio drops 13 spots to rank 27th, perhaps suggesting that the region’s large college enrollment isn’t effectively translating into the regional labor market.
A final analysis examines the percentage of a region’s young adult labor force that is highly skilled, or those with a graduate or professional degree. Slicing the labor force data this way is important in that a region’s highest-skilled workers are drivers of economic growth. Specifically, a metro’s top talent—think engineers, scientists, and doctors—are key agents of knowledge production and transference3, which— when translated into the marketplace—mean new firms and the evolution of existing firms. Those metros that have a high concentration of highly-skilled young adult workers have a head start in the race toward the “next” new economy.
Figure 4 ranks the metros by the percentage of 25- to 34-year-olds in the labor force with a graduate or professional degree. Pittsburgh ranks 3rd nationally, whereas Greater Cleveland moves up 13 spots to rank 8th, ahead of Chicago, Seattle, and Austin. The implications of these findings are discussed below.
A Rust Belt Rising?
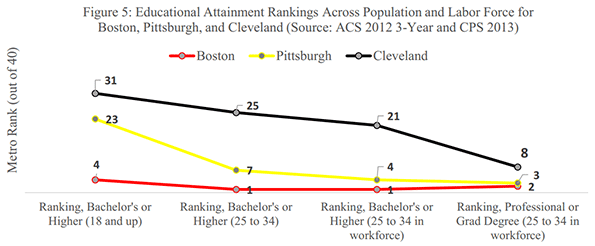
Economic restructuring from a labor- to a knowledge-based economy is no easy endeavor. Perhaps no other metro has made this transformation as successfully as Boston. What has driven the region’s evolution from a “dying factory town to a thriving information city”4 has been its gains in human capital. As shown in Figure 5, Boston ranks as an elite metro when it comes to educational attainment rates in both its population and labor force.
What metro is the “next Boston”? Pittsburgh is a likely candidate. The “Steel City” region is increasingly marrying its legacies of manufacturing and knowledge production, with the evolution of new industries and products to show for it5. Enabling Pittsburgh’s ascent is a highly-skilled young adult workforce that’s rivaling Boston in terms of concentration of human capital (See Figure 5 below).
here does that leave Cleveland? While the region is far from being the “next Boston”, one can make the case it is trending to be the “next Pittsburgh”. Specifically, a line of emerging thought—and one that will be developed by the Center for Population Dynamics in the coming months in two working papers—is that Cleveland’s 8th-placed ranking in its concentration of young workers with an advanced degree is a harbinger of broader economic growth. While this supposition is exactly that, there are several mechanisms by which this can occur.
First, it is important to note that there is an industry demand for workers with advanced degrees in Greater Cleveland, else its 8th-place ranking wouldn’t occur. Termed a “magnet city”6, Cleveland’s knowledge economy is forming world-class clusters of expertise that are attracting top talent in key industry sectors, particularly life sciences and advanced manufacturing. In other words, if you want to act, you go to Hollywood. If you want to practice cardiac care or make medical devices you come to Cleveland. The next step for the region is to scale up its emerging economies so that the amassing of knowledge and investment becomes multiplied into the creation of a “thicker, stickier” regional economy.
Part of this scaling up process relates to the effect that Cleveland’s concentration of highly-skilled workers can have on the local economic ecosystem. To wit, those with advanced degrees are most likely to migrate across state or international lines7. For instance, 29% of newly-arriving immigrants into Cleveland’s Cuyahoga County had a graduate or professional degree8. This means Cleveland’s burgeoning new economy demand is commonly fueled from outside the market. Why does this matter? For a historically insular region like Cleveland, this out-of-the-market knowledge migration brings a deepening of a region’s idea bank, as well as increasing global connectivity. The ability of a region to cross-pollinate ideas and get connected with global markets is crucial in the creation of new firms and emerging industries9.
Now, what does, for example, a new biotech firm in Cleveland’s Health Tech Corridor mean for the local mechanic, bartender, lawyer, or accountant? A lot actually. Specifically, economist Enrico Moretti found that for every high-skilled job created, an additional 5 jobs are created in the professional or service sector10. What’s more, the job creation goes beyond the local services and taps into semi-skilled professions in emerging industries. For example, a recent Brookings study found that the Cleveland metro ranked 20th out of the nation’s largest 100 metros in the number of workers without bachelor’s degrees employed in pre-baccalaureate health care occupations11.
Summary
Perhaps Cleveland is the next Pittsburgh, and Pittsburgh the next Boston. Clarifying this entails analyzing how human capital development and economic restructuring takes place. Simply, is Cleveland’s talent profile today similar to Pittsburgh’s a decade ago, and to Boston’s twenty years prior? Moreover, what policies have been proven effective in translating knowledge production to regional economic growth?
The Center for Population Dynamics is in the process of answering these questions. The information intends to help Cleveland speed up how quickly tomorrow gets here.
This is a new report brief from the Center for Population Dynamics at Cleveland State University, download the pdf version here.
Creative Commons photo “Cleveland Skyline from the Flats” by Flickr.com user Erik Drost.
———–
2 The Current Population Survey (CPS) is a monthly survey of households conducted by the Bureau of Census for the Bureau of Labor Statistics. The monthly workforce educational attainment rate estimates were aggregated for a 2013 annual estimate.
Networking Regionalised Innovative Labour Markets; Eds. Hilpert, U and Smith. H. Routledge: New York.
5 See: http://www.politico.com/magazine/story/2014/02/pittsburgh-robots-technology-103062.html#.U-UXIU10zIU
7 See: http://www.economist.com/news/britain/21611102-some-5m-britons-live-abroad-country-could-do-far-more- exploit-its-high-flying-expats-and
9 Hilpert, U. 2008. Knowledge in the region: Development based on tradition, culture and change. European Planning Studies, 14, 5.