Author: Susanne Trimbath

  • TruMpISSION: Impossible – Border Wall

    While running for office, President Trump said the border wall would cost about $8 billion, a figure widely recognized as an unreasonably low estimate”. This week, the Department of Homeland Security (DHS) estimated the cost of construction at $21.6 billion. Figuring out what the wall would cost has been a source of debate for longer than the last election cycle. In 2013, the bipartisan “Gang of Eight” senators set aside $1.5 billion for a plan to add 700 miles of wall – also a completely unrealistic budget.

    In this edition of TruMpISSION: Impossible we examine the numbers behind building a wall along the U.S.- Mexico border. There are five main reasons why this mission is impossible.

    1. It will be hideously expensive. The un-walled portion of the border covers the most difficult terrain, a lot of which could cost $17 million per mile. Historically, building on flat land cost about $4 million per mile. The government spent $2.4 billion between 2006 and 2009 to build a stretch of wall along 670 miles of easy terrain (Secure Fence Act of 2006). A 2009 attempt to build along one rugged stretch of the border was budgeted at $58 million for just 3.5 miles.

    Since most of the easier stuff is already built, I calculated that the cost for the next 1.289 miles could easily run $19.3 billion – I think the new DHS estimate is close to the mark. To put the number into perspective, the cost will be about seven times the entire 2016 budget of the U.S. Border Portal. Construction isn’t the only expense. Section 10 of the Executive Order basically “deputizes” local law enforcement – at the expense of local taxpayers – to act as immigration officers for carrying out deportations.

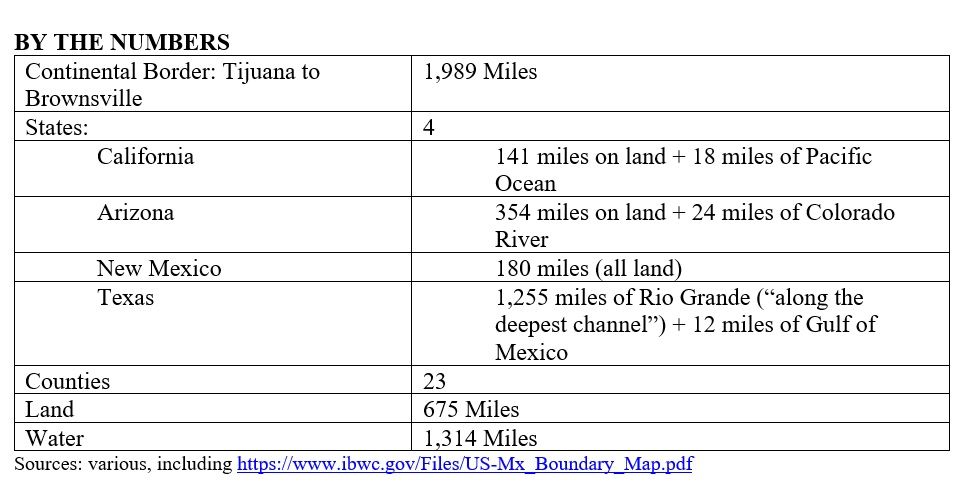
    2. More than 1,000 of the open border is under water. Building a wall in the water would be wildly expensive and would have to be replaced frequently. In February 2012, construction began to extend began to extend an 18-foot high border fence 300 feet into the Pacific Ocean to seal off the gap that opened at the beach between Tijuana and San Diego during low tide. The private contractor who built it (Granite Construction Company, NYSE:GVA) gave the government a 30-year warranty. The budget for that Surf Fence Project was $4.3 million (I did not find the final cost in any public source). Based on that budget, the cost of building the wall in water could run $75.9 million per mile or about 4.5 times the cost of building on rugged land and nearly 20 times the cost of building the parts on more level ground. Building a fence on the water part of the border would cost close to $9 billion alone.

    3. Maybe Trump does not really mean to build on the border that lies underwater. The Executive Order defines the “Southern border” as only the “land border”. To avoid the extra expense of building in the ocean, the gulf, and two rivers, we can build on the land outside the flood-plain/tidal-zone. It is likely the Mexican president Enrique Peña Nieto has heard of the “adverse possession”. Along the border, state laws transfer rights to abandoned property to the possessor in 5 to 10 years. Building just one half mile from the rivers means the United States could relinquish at least 657 square miles to Mexico. Are we prepared to cede to Mexico an area 1.5 times the size of Los Angeles?

    Fox News has noted that “[w]hile 1,254 miles of [the] borders is in Texas, the state has only 100 miles of wall”. At least 65 miles of the 100 mile route proposed through Texas in 2008 sat a half mile from the border. In some places, like the McAllen area of Texas, the proposed track separated a water reservoir from the pumping stations that bring water to US citizens. Building up to a mile into the US side has already stranded the property of US citizens on the Mexico side of the wall.

    4. The border land that is not under water or already fenced is mostly in private hands. In a January 2016 story Fox News recognized that finishing the wall along the border in Texas could require hundreds of lawsuits by the federal government. The Washington Post also reported going into the 2009 expansion of the wall that much of the planned route would slice through private property. Private property adds an average of $61,491 per mile (based on actual costs in 2012). During the 2009 expansion, 135 private landowners refused to let surveyors onto their property. Seventy percent of the landowners who held out were in Texas. Anybody remember Jade Helm 15 when part of Texas was labeled “hostile territory” during military exercises? The Governor ordered the Texas State Guard to monitor the exercises. What do you think will happen if bulldozers show up uninvited to begin claiming 1,000 miles of Texan’s private property? The federal government can use eminent domain, but it is costly, takes a long time and holds an uncertain outcome.

    5. There may not be enough brick and mortar to build a wall along the US/Mexico border, especially if Trump keeps talking it up. During the 2009 expansion of the wall, cost estimates ballooned as a Border States construction boom led to labor shortages and rising costs for construction materials (e.g., steel and cement). Try building more than 1,000 miles of border wall while re-building transportation infrastructure, the strain will be beyond the global peak in prices seen when shovel-ready projects were initiated under post-financial-crisis stimulus spending.

    The Executive Order gave DHS 180 days (until about the second anniversary of Jade 15) to come up with a plan. DHS also has to figure out how to return deportable aliens “to the territory from which they came” – imagine millions of aliens lined up along the US/Mexico border. DHS has less time (until March 26) to figure out how to pay for the wall by withholding “all bilateral and multilateral development aid, economic assistance, humanitarian aid, and military aid” that the US may be planning to send to Mexico. That sounds like it could actually work to balance the budget outlay. Except that it won’t actually work. Total U.S. foreign aid to Mexico disbursed from all agencies in 2015 was $338.5 million (that’s “million” with an “m”). At that rate, it will take 54 years to recover the cost!

    Aid to Mexico includes $215 million for international drug and law enforcement plus $50 million more for in-country drug enforcement. The other hundred million or so was for justice projects, legal reform, crime prevention and military support. According to former Secretary of Homeland Security Jeh Johnson, “…experience teaches that border security alone cannot overcome the powerful push factors of poverty and violence that exist in Central America. Ultimately, the solution is long-term investment in Central America to address the underlying push factors in the region.”

    [After I calculate the costs for several more truMpISSIONs, I will calculate the cost of financing with debt. Just because something is impossible, doesn’t mean Trump won’t spend your money on it.]

    Susanne Trimbath, Ph.D. is CEO and Chief Economist of STP Advisory Services. Dr. Trimbath’s credits include appearances on national television and radio programs and the Emmy® Award nominated Bloomberg report Phantom Shares. She appears in four documentaries on the financial crisis, including Stock Shock: the Rise of Sirius XM and Collapse of Wall Street Ethics and the newly released Wall Street Conspiracy. Her newest book, Lessons Not Learned: 10 Steps to Stable Financial Markets, was published in November by Spiramus Press (UK). Dr. Trimbath teaches graduate and undergraduate finance and economics.

    Photo: ourfunnyfarm, CC License

  • TruMpISSION Impossible: Deportation

    This is the first in an occasional series of articles that will look at some of the campaign promises made by Donald Trump in his run-up to November 8, 2016. I will be taking a “by the numbers” look at ideas ranging from immigration and border security to trade and infrastructure. I will not be taking a position on whether these are good ideas or bad ideas – this is not a normative analysis. Instead, I will be outlining the feasibility and the economic consequences of several potential policies. In economics, we call this a “positive analysis” – that doesn’t mean it is optimistic, only that the analysis leaves judgment about good versus bad policy to the reader.

    These are also only potential policies – Trump is not yet President and has yet to articulate a coherent action plan for any of these ideas. For all we know, they may end up being the same sort of campaign rhetoric that George H. W. “Read My Lips” Bush was using when he promised “No New Taxes.” I begin with deportation.

    Whatever label you want to put on the foreign-born residents of the United States who do not have visas, green cards or citizenship papers, the idea of deporting all illegal aliens has been around for a more than a decade – it isn’t something Donald Trump invented to win votes. A 2006 bill in the House of Representatives, championed by Tom Tancerdo (R-CO, 1979-2009) and James Sensenbrenner (R-WI since 1979) attempted to stop the flow of migrants, expel millions and construct a fence along the Mexican border – sound familiar? President George W. Bush was adamantly opposed to any legislative proposal that included mass deportation. “…[W]e’re talking about human beings – decent human beings that need to be treated with respect,” he told the Orange County Business Council in California at the time.

    In his 2007 State of the Union address, George Bush addressed the issue again, saying: “It is neither wise nor realistic to round up and deport millions of illegal immigrants in the United States.” Subsequently, The Comprehensive Immigration Reform Act of 2007 (S. 1348) was introduced in the United States Senate on May 9, 2007. It was never voted on. After several amendments, the Senate failed 34-61 to end debate and call for a vote. A related bill (S. 1639) failed 46-53 on June 28, 2007.

    Being a numbers nerd, my initial thought in 2006 was: are there even enough buses available in the United State that could take 11 million people to Mexico?

    A typical school bus in the US holds about 55 people (without luggage or a toilet). On most school days in the US, there are over 480,000 school buses transporting more than 25 million students to school. Allowing room equivalent to one-half person each for luggage, you would need approximately 300,000 buses or 62.5% of the buses in use.

    Let’s assume you take everyone to the national capital, Mexico City. You don’t just want to dump 11,000,000 people at the border – that would be a recipe for disaster if they decided to walk back in en mass! Assuming some of the schools are private or semi-private and could not (easily) be coerced by government to relinquish their buses, you would need to count on getting a little more than one-half of all the school buses in the US to move 11,000,000 people.

    The drive from Bangor, Maine to Mexico City would take 51 hours. Assuming driving 9 hours/day, including 3 1-hour breaks for meals, that drive would take almost 9 days each way. The buses would be unavailable to take children to school for almost 3 weeks. There are no fall, spring or holiday breaks during the school year that would accommodate such a long period of time without buses to take children to school. Still, it might work if you did it during the summer, although many schools run summer sessions and use school buses for summer educational events.

    The real impossibility is that there are 14,000 school districts in the US, each with an independent structure of authority (principal, school board, etc.). It might be tempting to think you could just work out a deal with 50 states who could then dictate participation to the school districts, but there are also private and semi-private schools.

    An alternative might be to use buses from public transportation systems, all of which would be under the control of government authorities. According to the American Public Transportation Association (APTA.com) there are 1,078 bus public transportation systems in the United States (2011 date) operating 67,288 vehicles. The 300,000 bus-trips required to deport illegal aliens would require each bus to make about 4.5 trips each – meaning they would not be available to provide regular public transportation services for 81 days (or nearly 3 months). For those 3 months, about 7 million American workers would have to find another way to get to work.

    TruMpISSION Impossible!

    Susanne Trimbath, Ph.D. is CEO and Chief Economist of STP Advisory Services. Dr. Trimbath’s credits include appearances on national television and radio programs and the Emmy® Award nominated Bloomberg report Phantom Shares. She appears in four documentaries on the financial crisis, including Stock Shock: the Rise of Sirius XM and Collapse of Wall Street Ethics and the newly released Wall Street Conspiracy. Dr. Trimbath was formerly Senior Research Economist at the Milken Institute. She served as Senior Advisor on United States Agency for International Development capital markets projects in Russia, Romania and Ukraine. Dr. Trimbath teaches graduate and undergraduate finance and economics.

    Photo by Gage Skidmore [CC BY-SA 3.0], via Wikimedia Commons

  • Are-You-Better-Off: 2016 Update

    The 2016 US Presidential campaign has gotten so crazy that the term “silly season” just doesn’t do it justice. In a September 2012 article on ng, I asked the question “Are you better off today than you were four years ago?” Eight years ago, the answer in the swing states was clearly “no” as I described it then:

    “Comparing the swing states not to their conditions four years ago, but how they might feel compared to the rest of the nation, Virginia, Colorado and New Hampshire appear to be “better off” than the average American. But in North Carolina, Florida and Pennsylvania, prices for the basic necessities are above the national average while median incomes are lagging. If consumer confidence translates into voter confidence, then the elections in some of the key swing states will belong to the Republicans in 2012.”

    Indeed, in November 2012, despite winning the White House, the Democrats, lost nearly every contested race for seats in the Senate while also losing governorships and seats in the House of Representatives.

    This time, the economic picture is less clear. States like Colorado are doing well: despite a higher than national average cost of living, their median income is even higher by comparison and the unemployment rate is more than 20% below the national average. Although they were enjoying the same higher incomes in 2012, their unemployment rate then was at the national average – higher by comparison than in 2016. In contrast, Nevada is clearly worse off now than they were in 2012 – unemployment remains high, above the national average. The cost of living stands 6% above the national average while the median income has fallen from slightly above the national average to a little below. With the exception of Wisconsin, every swing state is worse off going into this election than they were going into the 2012 election . In the table, we use red figures to indicate where conditions in the swing states worsened relative to the national average between 2012 and 2016, either a reduction in relative state median income or an increase in relative unemployment (expressed as a percent of the national average).

    Contested State

    2012 income

    2016 Income

    2012 unemployment

    2016 Unemployment

    CO

    118%

    110%

    100%

    78%

    FL

    85%

    88%

    106%

    96%

    IA

    100%

    98%

    64%

    84%

    NC

    85%

    87%

    116%

    96%

    NH

    131%

    128%

    65%

    59%

    NV

    105%

    97%

    145%

    133%

    OH

    92%

    91%

    87%

    98%

    PA

    98%

    99%

    95%

    114%

    VA

    121%

    125%

    71%

    76%

    WI

    101%

    100%

    88%

    86%

    Unemployment from BLS.gov, median income from Census.gov

    Only 4 of the swing states have both cost of living and median income above the national average (Virginia, New Hampshire, Colorado and Iowa). In the other six, the cost of living index is above the national average while the median income is near or below the national average. A lot of Republican voters may be thinking it is time for a change. The Republican pundits will want to blame Donald Trump for “down ballot” losses. Trump seems unconcerned about working with a majority of Democrats in Washington. If the change in Congress occurs, it will more likely be the result of these poor economic conditions in the states than anything specifically that Donald wished for or caused.

    Contested State

    Cost of Living

    Income

    CO

    106%

    110%

    FL

    110%

    88%

    IA

    92%

    98%

    NC

    95%

    87%

    NH

    117%

    128%

    NV

    106%

    97%

    OH

    101%

    91%

    PA

    120%

    99%

    VA

    100%

    125%

    WI

    106%

    100%

    Cost of living overall from Payscale.com for major city in each state. Unemployment from BLS.gov, median income from Census.gov.

    In an April 2009 NG article, I compared measures of economic well-being before and after passage of the Emergency Economic Stabilization Act of 2008, more commonly known as the Bank Bailout Bill. Then Treasury Secretary Hank Paulson assured Congress who in turn assured voters that they would improve “the economic well-being of Americans.” The numbers showed a very different story. We were, in fact, largely worse off in the first six months after the bill passed. Between October 2008 and April 2009, foreclosure rates were no lower, unemployment was higher and the stock market pretty much tanked.

    Looking at the same data again, I think it is pretty clear that the US economy is in an improved condition, across the board. By every measure, we are also even a little better off than this time last year.


    2008

    2009

    2015

    2016

    National Unemployment

    7%

    8%

    5.5%

    4.9%

        Lowest state unemployment

    3.3% (WY)

    3.9% (WY)

    2.6% (NE)

    2.8% (SD)

        Highest state unemployment

    9.3% (MI)

    12% (MI)

    7.6% (CO)

    6.7% (AK)

    National Foreclosure rate (per 5,000 homes)

    11

    11

    5

    3.3

        Lowest state foreclosure rate

    < 1 in 7 states

    < 1 in 6 states

    <1 in 4 states

    <1 in 6 states

        Highest state foreclosure rate        

    68 (NV)

    71 (NV)

    12 (FL)

    9 (DE)

    Dow Jones Industrial Average

    10,325

    7,762

    18,126

    18,404

    2008 figures are as close as possible to passage of the Bank Bailout Bill (October 3, 2008); the date of the 2009 figures varies slightly by category from February through April 2009. 2015 data are May and 2016 are August. Unemployment and foreclosure rates by state were available at Stateline.org for 2008 and 2009; more recent national and state unemployment rates are available from BLS.gov; foreclosure rates are also available from Realtytrac.com. Dow Jones Industrial Average from Google Finance.

    What this means is that the national voter (meaning that majority that usually carries the Presidential election) will be answering the lead question with “yes” – yes, I have been made better off with a Democrat in the White House than I was with the last Republican in the White House. If Democrats take the White House in November, they are likely to take the House and the Senate down ballot.

    Susanne Trimbath, Ph.D. is CEO and Chief Economist of STP Advisory Services. Dr. Trimbath’s credits include appearances on national television and radio programs and the Emmy® Award nominated Bloomberg report Phantom Shares. She appears in four documentaries on the financial crisis, including Stock Shock: the Rise of Sirius XM and Collapse of Wall Street Ethicsand the newly released Wall Street Conspiracy. Dr. Trimbath was formerly Senior Research Economist at the Milken Institute. She served as Senior Advisor on United States Agency for International Development capital markets projects in Russia, Romania and Ukraine. Dr. Trimbath teaches graduate and undergraduate finance and economics.

    Top image by DonkeyHotey (Hillary Clinton vs. Donald Trump – Caricatures) [CC BY-SA 2.0], via Wikimedia Commons

  • No Wiggle Room in Housing Market

    The salary gap – where top-end incomes are rising faster than middle- and lower-end salaries – plays a large role in the affordability of middle-class housing along with interest rates and prices. Which factor has more influence depends on where you live and how you make your living.

    Using some simplifying assumptions (20 percent down payment and a 30-year fixed-rate mortgage), today’s middle-class household increasingly cannot afford a middle-class home. Two things hurt this market: poor job outlook (impacts income) and interest rates (impacts affordability).

    Cities

    Salary Needed

    Mortgage Rate

    Salary Gap

    Jobs/People Ratio

    Unemployment Rate

    Cleveland

    $33,714.17

    3.96

    10%

    .59

    5.3

    Pittsburgh

    $33,838.57

    3.87

    7%

    .61

    5.1

    Detroit

    $37,544.40

    4.05

    2%

    .54

    5.6

    Cincinnati

    $36,357.35

    3.98

    1%

    .60

    4.0

    St Louis

    $36,784.94

    3.94

    0%

    .62

    5.0

    Atlanta

    $39,356.45

    3.97

    -7%

    .61

    5.5

    Phoenix

    $43,170.07

    3.97

    -19%

    .59

    5.3

    Tampa

    $41,488.22

    4.04

    -23%

    .56

    5.0

    Minneapolis

    $50,969.96

    3.96

    -20%

    .69

    3.5

    Philadelphia

    $54,385.77

    3.96

    -34%

    .59

    5.5

    Baltimore

    $55,842.76

    3.89

    -34%

    .62

    5.3

    Houston

    $53,684.45

    3.94

    -41%

    .64

    4.3

    Orlando

    $46,300.92

    3.99

    -52%

    .61

    4.8

    San Antonio

    $48,092.30

    3.99

    -50%

    .60

    3.4

    Dallas

    $52,947.58

    3.97

    -44%

    .65

    3.7

    Sacramento

    $61,517.63

    4.03

    -47%

    .55

    5.6

    Chicago

    $61,068.50

    3.97

    -58%

    .60

    5.5

    Portland

    $65,009.41

    4.01

    -61%

    .61

    5.5

    Denver

    $69,912.24

    4.04

    -68%

    .67

    3.7

    Miami

    $63,289.86

    4.00

    -93%

    .59

    5.2

    Washington

    $83,027.24

    3.90

    -61%

    .67

    4.3

    Seattle

    $78,118.97

    4.05

    -69%

    .66

    4.2

    Boston

    $86,164.15

    3.91

    -78%

    .63

    4.1

    New York City

    $90,750.14

    3.97

    -102%

    .58

    5.1

    Los Angeles

    $88,315.32

    3.94

    -124%

    .59

    6.0

    San Diego

    $104,839.73

    4.04

    -161%

    .56

    4.8

    San Francisco

    $157,912.06

    3.95

    -211%

    .63

    4.0

    Salary Gap expressed as percent of Median Salary (that is, Salary Gap = (Median Salary minus Salary Needed) divided by Median Salary); negative numbers mean the salary needed to buy the median-priced home is greater than the median salary in that city. Data on salary needed and mortgage rates from http://www.hsh.com/finance/mortgage/salary-home-buying-25-cities.html; data on median salary from http://www.bls.gov/oes/current/oessrcma.htm. Unemployment rate for August 2015 and Participation rate is 2014 annual average from www.bls.gov.

    In some ways, Minneapolis is not unlike San Francisco: both enjoy relatively low levels of unemployment and low mortgage costs. Nationally, the average 30-year mortgage rate is 4.09% (for July 17, 2015). Minneapolis and San Francisco are at 3.96% and 3.95%, respectively. Compared to the national unemployment rate of 5.3%, Minneapolis is at 3.5% and San Francisco is at 4.0%. So how do we explain the difference in affordability, aside from the realtor’s rant of “location, location, location”? San Francisco has a higher jobs/population ratio than Minneapolis, but that is only part of the story. As someone once told me when I was trying to understand why the jobs/housing relationship in Orange County didn’t fit the model: “What makes you think those people have jobs?”

    In other words, where a population is less dependent on the traditional economy, higher home prices may be sustainable. This occurs in areas with a concentration of rich (“high-net-worth”) individuals. Some cities, like San Francisco and New York, are also attractive to rich homebuyers from outside the US. About 5% of existing home sales in California were to buyers from China (mainland, Hong Kong and Taiwan), who spent about $12 billion on homes primarily in San Francisco, Los Angeles and San Diego. The Chinese buyers paid an average of $831,000 per home – 69% paid with all-cash. In that sense, San Francisco is more like New York. The New York metro has an unemployment rate slightly below the national average, but only 57.8% as many jobs as there are people, compared to the national average of 59.2%. Foreign buyers from Canada and Mexico – who, along with China, make up about half of all foreign home buyers in the US – tend to buy in lower-priced housing markets in Florida, Arizona and Texas. Although more units are sold to international buyers in Florida (about 21% in 2015), the higher dollar volume is in California and New York. Homebuyers from Canada spent $6.4 billion in Florida and Arizona last year while buyers from China spent a total of $12 billion in California and New York. These statistics hint at a population that is less job-dependent, less “middle-class” than the national average.

    The behavior of middle-class households in the decade before the 2008 collapse confirmed what I called a “distinct shift in the paradigm governing the housing market.” In November 2004, the stock market was climbing and the Fed was raising interest rates. The combination brought out talk of a real estate bubble. If investors started moving money away from housing they would be selling houses at a time when higher mortgage interest rates would make it more difficult to find buyers. That was 2004, mind you, not 2008; there were four years of housing prosperity ahead.

    Under the new paradigm, rising stock market prices are neither cause nor effect for changes in residential real estate prices. (One exception is the New York metropolitan area, where Wall Street drives home prices by virtue of its impact on employment and income.) The break in the statistical relationship between Wall Street and Main Street started around 1980. In 1979, the Federal Reserve changed their policy away from interest rate targeting. As they attempted to control the supply of money, interest rates began to swing wildly. Households put more money in real estate when they saw more uncertainty in the economy. At the time I dubbed housing “A New Kind of Gold.” It wasn’t that the prices of houses behaved the same way as gold prices but because of the shared attitude from buyers. Gold is a traditional hedge against economic uncertainty. In the 1990s, people started buying homes when other investments seemed uncertain.

    Prior to 1995, the Federal Reserve kept secret their monetary policy objectives. Twenty years later, we know that they are using the federal funds rate to reach targets for the money supply. Technically, the federal funds rate is the rate at which the Federal Reserve would like banks to lend to each other (although the banks are free to charge each other whatever they want). Banks also use the federal funds rate as the basis for setting consumer interest rates, like mortgage rates. Real estate investments are sensitive to interest rate changes in very specific ways. The total impact of current events on home prices will come from the Federal Reserve, regardless of what happens in the stock market. When interest rates rise it makes expansion more expensive for businesses by raising their borrowing costs. When businesses don’t expand, neither does employment. In addition to the fact that homes with mortgages become affordable to a smaller portion of the population, the impact on jobs is another reason why rising interest rates would reduce the demand for homes.

    The gap between the mean- and median-priced homes was increasing across the country before the 2008 crisis, indicating that prices at the top of the scale were rising faster than the prices of more modest homes. The return of the home price gap to pre-1995 levels could have equalized affordability for middle-class Americans if income had followed suit. In addition to the poor employment outlook, fewer and fewer people will be able to afford the higher priced homes because the gap between mean- and median-income is rising faster than the home price gap is falling.

    Median and mean (average) home sales prices are for new homes sold in the U.S. where the sales price includes land. Data from www.census.gov. Median and mean (average) salary from www.census.gov (Table H-13).

    If the long-anticipated strengthening in the jobs market had appeared after the Great Recession, it could have made a real difference for middle-America. But so far, the employment recovery has not appeared. As weak job growth appeared in September, the previously encouraging July and August growth numbers were revised downward. The labor force participation rate declined, leaving only 59.2% of the population working. Population growth in the US is less than 1% per year but job growth is not keeping up with it.

    Month 2015

    Civilian Population Growth

    Employment Growth

    June

    199,362

    -56,000

    July

    205,661

    101,000

    August

    220,858

    196,000

    September

    233,715

    -236,000

    4-Month Total

    859,596

    5,000

    Civilian Population Growth based on population estimates from www.FactFinder.census.gov, Employment Growth based on number of persons employed from www.bls.gov.

    As long as the monthly payments on median-priced homes are out of reach for median-income households, demand in the middle-class housing market cannot strengthen. This is one more reason the Federal Reserve cannot afford to raise interest rates this year. That doesn’t mean that they won’t do; just that they shouldn’t – that don’t always do that smart thing.

    Housing photo courtesy of BigStockPhoto.com.

    Susanne Trimbath, Ph.D. is CEO and Chief Economist of STP Advisory Services. Dr. Trimbath’s credits include appearances on national television and radio programs and the Emmy® Award nominated Bloomberg report Phantom Shares. She appears in four documentaries on the financial crisis, including Stock Shock: the Rise of Sirius XM and Collapse of Wall Street Ethicsand the newly released Wall Street Conspiracy. Dr. Trimbath was formerly Senior Research Economist at the Milken Institute. She served as Senior Advisor on United States Agency for International Development capital markets projects in Russia, Romania and Ukraine. Dr. Trimbath teaches graduate and undergraduate finance and economics.

  • Are-You-Better-Off: An Update

    Going into the silly-season of US Presidential campaigning, I want to get a head start on updating the “Are you better off today than you were four years ago?” discussion. In an April 2009 ng article, Rogue Treasury, I compared measures of our economic well-being before and after passage of the Emergency Economic Stabilization Act of 2008. Treasury assured Congress and the people that spending $700 billion would “ensure the economic well-being of Americans.” The Troubled Asset Relief Program (TARP) was going to save the American Dream of homeownership. The numbers showed a very different story. We were, in fact, largely worse off in the first six months after the bill passed. In the table below, I update the figures for May 2015.


    Before TARP

    So Far

    2015 Update

    National Unemployment

    7%

    8%

    5.5%

        Lowest state unemployment

    3.3% (WY)

    3.9% (WY)

    2.6% (NE)

        Highest state unemployment

    9.3% (MI)

    12% (MI)

    7.6% (CO)

    National Foreclosure rate (per 5,000 homes)

    11

    11

    5

        Lowest state foreclosure rate

    < 1 in 7 states

    < 1 in 6 states

    <1 in 4 states

        Highest state foreclosure rate        

    68 (NV)

    71 (NV)

    12 (FL)

    Dow Jones Industrial Average

    10,325

    7,762

    18,126

    “Before TARP” figures are as close to passage of the Bailout Bill (October 3, 2008) as possible; “So Far” figures vary slightly by category from February through April 2009. Unemployment and foreclosure rates by state were available at Stateline.org. The 2015 Update are May 2015 from RealtyTrac.com and BLS.gov.

    “Before TARP” figures are as close to passage of the Bailout Bill (October 3, 2008) as possible; “So Far” figures vary slightly by category from February through April 2009. Unemployment and foreclosure rates by state were available at Stateline.org. The 2015 Update are May 2015 from RealtyTrac.com and BLS.gov.

    Six years later, homeowners appear to be potentially better off even in the worst hit state, Nevada, where they can no longer claim the highest state foreclosure rate. That honor now belongs to Florida. But look at the other end – there are fewer states than ever in the category of having less than 1 foreclosure per 5,000 homes. In December 2006, there were 17 states with less than 1 per 5,000 homes. Nationally, foreclosures in May 2015 were about where they were in December 2006, before things got really bad but after foreclosures were already on the rise nationally – up 35% from the previous year. In December 2006, Florida was at about 6 foreclosures per 5,000 homes; the rate is double that now at 12. Nevada was at 13 in 2006 compared to about 10 now.

    National unemployment before the recession and all the bailouts and stimulus packages (2007 average) was 4.6% – we just are not seeing full recovery yet. Nebraska’s unemployment rate is a little lower now than the 2007 annual average of 3.0%. At the other end of the spectrum, Colorado’s May 2015 unemployment rate is 7.6%, still about double its rate of 3.8% from 2007. Where there is recovery, it is very, very uneven. The battle ground states in the 2012 Presidential election were Colorado (worse), Florida (worse), Michigan (better), and Nevada (better).

    Meanwhile, the rich got richer with TARP. The Dow Jones Industrial Average is up 75% above its pre-TARP level. This as it turns out, seems to be the point of TARP after all. Instead of helping citizens stay in their homes, TARP was used to bailout the banks by purchasing the mortgage-backed securities that weren’t backed by mortgages. After about a month of that, in November 2008, Quantitative Easing (QE) was used to buy the mortgage-related bonds and the TARP money was re-directed so the Fed could take ownership positions in financial institutions.

    By the way, just as we had pointed out in our January 2009 ng article Should We Bailout Geithner Too? a US Court ruled that the New York Fed did not have legal authority to take over a business. On June 15, 2015, Judge Thomas C. Wheeler ruled (in Starr International v. The United States, Case No. 11-779C) wrote: ‘there is nothing in the Federal Reserve Act or in any other federal statute that would permit a Federal Reserve Bank to take over a private corporation and run its business as if the Government were the owner’ the way they did with AIG. Judge Wheeler noted that the Fed’s own lawyers told them they were ‘on thin ice’ going forward with their plans.

    Here’s the bottom line: Legislation that was passed to support homeownership ended up supplying cash to banks both domestic and foreign. Between TARP and QE, the banks were able to sell all of their junk bonds to the government and use the extra cash to pad their reserve funds. More than half of the total money supply in the US is sitting in banks as excess reserves, earning 0.25% interest. That’s about $6.3 billion a year going to the banks on top of all the bailouts, loans, junk bond sales, etc. When the Fed decides to raise interest rates – my guess is February 2016 – the banks will be earning even more by holding on to the money they got from the Fed


    Data Source: http://www.federalreserve.gov/releases/h3/Current/, Table 2. Monthly August 2014 through June 2015, then bi-weekly from July 8 through September 2, 2015.

    Banks are using their excess reserves to run up the value of the stock market through overnight lending and investments. These are short-term investments – overnight is very short term! They are not the kinds of investments that create jobs or make homeowners better off. They are, however, the kinds of investments that make bankers better off. They also add to the wild swings you see in the Dow Jones Industrials Average (volatility).

    Richard Nixon was quoted by a British newspaper in 1987 as saying that if the economy turns down, “a jackass” could be elected on the Democratic ticket.* As the 1988 presidential election approached, the US had just completed 6 years of economic expansion and the unemployment rate was 5.3%. George H.W. Bush (R) won the White House over Michael Dukakis (D) with 426 electoral votes to 111. In November 2008, the banks got the biggest bailouts in history while the nation and the world were entering the Great Recession. Barack Obama (D) beat out John McCain (R) by 365 to 173. If the banks keep going the way they have been, it could be very good news for some jackass running to extend the Obama economy … and bad news for the rest of us.

    *Cited in ‘A New Political Picture’ by Tom Wicker, New York Times, 22 October 1987, p. A35.
    Susanne Trimbath, Ph.D. is CEO and Chief Economist of STP Advisory Services. Dr. Trimbath’s credits include appearances on national television and radio programs and the Emmy® Award nominated Bloomberg report Phantom Shares. She appears in four documentaries on the financial crisis, including Stock Shock: the Rise of Sirius XM and Collapse of Wall Street Ethicsand the newly released Wall Street Conspiracy. Dr. Trimbath was formerly Senior Research Economist at the Milken Institute. She served as Senior Advisor on United States Agency for International Development capital markets projects in Russia, Romania and Ukraine. Dr. Trimbath teaches graduate and undergraduate finance and economics.

    Wall Street photo by flickr user Manu_H.

  • The Incompetence Hypothesis to Explain the Great Recession

    Seeking an understanding of the Great Recession, I am finding that most of the 2008 financial crisis and its aftermath can be explained by incompetence. In the final weeks of writing a book on the systemic failure in US capital markets, I had to re-read the Securities and Exchange Commission (SEC) Inspector General’s 2009 report on their failure to stop Bernard Madoff despite having received credible evidence of a Ponzi scheme. The inspector concluded that it did not have anything to do with the fact that an SEC assistant director was dating (and later married) Madoff’s niece; or that Madoff had held a Board seats at important financial regulators.* Despite eight substantive complaints and two academic journal research reports over 16.5 years about problems with Madoff’s investments, Madoff was never caught. In the end he turned himself in, admitting to a $64 billion Ponzi scheme. The inspector’s conclusion: incompetence.

    In economics, ‘interest’ – whether it be self-interest or interest group pressure – is the ‘safe’ explanation for outcomes that are detrimental to the public. If interest group pressure (or even populism) is behind a bad policy decision, then it is not a ‘mistake.’ Rather, it is an intentional, rational decision as described by Chicago School economist and Nobel laureate George Stigler. However, if a policy decision is the result of bad judgment, then Stigler cannot explain it. Brazilian economist Luiz Carlos Bresser-Pereira suggests that the relevant variable in this case is incompetence. Incompetence is an independent explanatory variable; it cannot be explained in rational or historical terms.

    Incompetence arises from three sources: 1) ignorance, 2) arrogance, or 3) fear. Policy advisors and regulators may be guilty of applying theories second-hand but with great authority and self confidence. They may be ignorant of the complexities of economic theory and they may apply abstract economic theories inappropriately to specific policy problems. For example, they allowed banks to engage in a wide range of investments under the financial theory of ‘diversification.’ That theory works for portfolios but not for businesses, which need to specialize to realize the gains from their comparative advantage. Financially derived theories like this were applied automatically, transformed into a series of clichés.

    ‘Diversification’ in a portfolio of financial investments lets you increase the returns while reducing the risk. But in business it means ‘splintering’ which destroys performance capacity and increases risk. Financial institutions are tools to be used in furthering the efforts of the broad economy: the more specialized financial institutions become, the greater their performance capacity. Increased productivity from specialization comes with better quality as businesses become more adept at their specific products and services. The differences in natural aptitudes and abilities produce economic benefits when tasks are matched to capabilities. The more experience a worker has at performing a task, they more efficient they become in doing the work. As management guru Peter Drucker wrote: ‘Organizations can only do damage to themselves and to society if they tackle tasks that are beyond their specialized competence.’

    An example of an economic theory applied arrogantly is Washington’s constant fawning over ‘free market solutions’ when the rules, regulations and court decisions covering capital markets fill the bookshelves of law offices around the world. There is no such thing as a free market – no economist of value believes that the perfectly competitive market exists. The Wall Street Bailout is a good example of the third source of incompetence – fear. Consider this description of the exchange between Treasury Secretary Henry Paulson, Federal Reserve Chairman Ben Bernanke and the senior legislators from the House and Senate on Thursday, September 18, 2008:

    Sen. CHRISTOPHER DODD: Sitting in that room with Hank Paulson saying to us in very measured tones, no hyperbole, no excessive adjectives, that, "Unless you act, the financial system of this country and the world will melt down in a matter of days. "
    JOE NOCERA: Bernanke said, "If we don’t do this tomorrow, we won’t have an economy on Monday."
    Sen. CHRISTOPHER DODD: There was literally a pause in that room where the oxygen left.
    Inside the Meltdown, Frontline February 17, 2009, WGBH Educational Foundation, Boston. 

    Regardless of the source of the incompetence, the visible results are 1) failure to take correct strategic policy decisions, and 2) failure to adopt well-designed reforms.

    Policy decisions are the day-to-day management decisions that usually produce immediate results. In monetary policy, for example, these would be interest rate decisions. Interest rate policy decisions need to be made at the right time and to move rates in the right direction.

    Reforms produce medium-term outcomes that may or may not require legislative approval. The Dodd-Frank Act, which was supposed to reform Wall Street and protect Main Street, in reality created very little change but suggested that financial regulators reform their own rules. Poor reforms may be the result of incompetent designs and not just pressure from interest groups, although this also happens.

    Bresser-Pereira’s analysis offers one more alternative explanation for the cause of bad policy and reforms. Between interest and incompetence lies ‘confidence building.’ It is simply doing what is expected in an effort to gain the confidence of financial supporters. If we substitute “Goldman Sachs” for “United States” and “Wall Street” for “developed countries” in this quote from Bresser-Pereira, then his description of ‘confidence building’ is as true of Washington, D.C. as it is of Brazil:

    ‘They do not limit themselves to seeing the United States and, more broadly, the developed countries, as richer and more powerful nations, whose political institutions and scientific and technological development should be imitated. No, they see the elites in the developed countries both as the source of truth and as natural leaders to be followed. This subordinate internationalism ideology, already called ‘colonial inferiority complex’ and entreguismo**, is as detrimental to a country as old-time nationalism. What I am singling out as a major source of incompetent macroeconomic policies is the uncritical adoption of developed countries’ recommendations.’

    If we say that bad policy decisions are always rational, motivated by interest, then we must conclude that policy-makers are ‘dishonest, protecting their own interest or those of their constituencies rather than the public interest’ (Bresser-Pereira).  If this view were always true, then the world would look more like communist Russia in 1980 than the way it does today. How would entrepreneurs and consumers have financed not only the invention but the proliferation of microchips, cell phones, and personal computers that have made the world safer and easier to navigate; how would they have discovered and made widely available artificial hearts, HIV medications and targeted cancer therapies? Since 1981, the number of poor people in the world declined for the first time in history, by 375 million. Global life expectancy was 68 in 2014, up from 61 in 1980; infant mortality is down to 49.4 per 1000 live births in 2014 from 80 in 1980. Yet as a result of the havoc wrecked upon the global economy in 2008 by incompetent regulators, policy makers and bankers, global unemployment grew from 20 to 50 million while falling incomes combined with rising food prices to raise the number of undernourished people in the world by 11%.

    A solution, from this perspective, lies in cleaning house of the incompetent staff from Washington to Wall Street and improving recruiting methods to build competence for the future.

    * Madoff has a seat on the Board of the International Securities Clearing Corporation, one of the predecessor organizations to the Depository Trust and Clearing Corporation, the world’s largest post-trade processing center. Madoff was also Chairman of the NASDAQ, and had seats on the Boards at the National Association of Securities Dealers (now the Financial Industry Regulatory Authority – the same organization that failed to act on a referral letter from the SEC to stop R. Allen Stanford’s Ponzi scheme.
    **Brazilian Portguese roughly translated as ‘appeasement’ or ‘submission.’

    For more information:
    Luiz Carlos Bresser-Pereira, Latin America’s quasi-stagnation, in A Post Keynesian Perspective on 21st Century Economic Problems, Elgar, UK. http://www.bresserpereira.org.br/
    The World Factbook 2013-14. Washington, DC: Central Intelligence Agency, 2013.
    https://www.cia.gov/library/publications/the-world-factbook/index.html

    Susanne Trimbath, Ph.D. is CEO and Chief Economist of STP Advisory Services. Dr. Trimbath’s credits include appearances on national television and radio programs and the Emmy® Award nominated Bloomberg report Phantom Shares. She appears in four documentaries on the financial crisis, including Stock Shock: the Rise of Sirius XM and Collapse of Wall Street Ethicsand the newly released Wall Street Conspiracy. Dr. Trimbath was formerly Senior Research Economist at the Milken Institute. She served as Senior Advisor on United States Agency for International Development capital markets projects in Russia, Romania and Ukraine. Dr. Trimbath teaches graduate and undergraduate finance and economics.

  • A Leaky Economy

    Real gross domestic product is growing at an anemic pace. Exports are down, and state and local governments are spending less. The consumer price index is falling in a condition known as deflation. Even national defense spending is down. Despite the bad news, consumer spending and home building are rising. Real disposable personal income is roaring ahead at growth rates of 6.2 percent in the first quarter of 2015 and 3.6 percent at the end of 2014. Even the personal savings rate is up (5.5 percent so far this year and 6.2 percent at the end of 2014). These consumer factors are attributed to an increase in government social benefits, though, and not to jobs and economic prosperity. Social Security makes payments to more than 64 million Americans and nearly 3 million more receive federal government retirement checks. More than 20 percent of the US population is basically living on fixed-incomes.

    The banks also continue to benefit from government largess. The Federal Reserve’s Open Market Committee has been holding onto the view “that the current 0 to 1/4 percent target range for the federal funds rate remains appropriate” for more than five years. The stated purpose of offering this free money to banks is to maintain high employment. Although the Fed declines to set a specific goal, they generally believe that the unemployment rate should be around “5.2 percent to 6.0 percent.” For perspective, the US unemployment rate averaged 6.15 percent last year (2014); compare that to an average unemployment rate of 4.62 percent in 2007, the year before the financial crisis that was the reason for dropping the federal funds rate to zero.

    The offsetting condition that could thwart the Fed’s efforts to bolster the economy is high inflation – too much money chasing too few goods. The Fed has a stated goal of keeping inflation at or below 2%. As long as there are enough people working, producing plenty of goods and having money to spend on those goods, inflation this should not be a problem. In the 12 months just ended, consumer prices fell 0.1 percent. In 2007, prices rose about 2.1 percent. The most recent peak inflation was nearly 6 percent in 2008 and the peak deflation was about -2.4 percent in 2009.

    As long as there is some unemployment, wages and prices will not rise too rapidly – if we had more jobs than workers there would be a tendency for employers to bid up wages in trying to attract the best workers. But we are facing the opposite situation. Despite so much Federal Reserve money pouring into banks, the economy is slowing and deflating.

    There is worse news. Corporate fixed investment is running higher than the cash being generated by businesses. This was true in 2007 right before the crash and also in 1977 when Hyman Minsky wrote about “the era of the post-World War II financial crunches, squeezes, and debacles.” Corporations investing more than they are earning is the kind of event the Fed means when they write: “The Committee currently anticipates that, even after employment and inflation are near mandate-consistent levels, economic conditions may, for some time, warrant” continuing their loose money policy. They are referring to exactly this condition where an incipient financial crisis can be triggered by increases in interest rates.


    Borrowing to Make Ends Meet: Then

    $ Billions

    2003

    2004

    2005

    2006Q4

    2007Q3

    Internal funds (US)

    732.0

    850.7

    1061.3

    747.2

    782.4

    Internal funds (total)

    831.3

    928.4

    995.0

    935.8

    912.3

    Fixed investment

    747.5

    788.3

    889.7

    1000.6

    1057.0

    Source: Flow of Funds, Table F.102 Nonfarm Nonfinancial Corporate Business March 6, 2008 (Federal Reserve System, Washington, D.C.)

    Borrowing to Make Ends Meet: Now

    $ Billions

    2010

    2011

    2012

    2013Q4

    2014Q4

    Internal funds (US)

    1520.4

    1575.2

    1569.2

    1607.2

    1590.2

    Internal funds (total)

    1676.7

    1728.5

    1761.0

    1844.6

    1782.6

    Fixed investment

    1178.6

    1297.4

    1415.2

    1512.9

    1681.0

    Source: Flow of Funds, Table F.103 Nonfinancial Corporate business March 12, 2015 (Federal Reserve System, Washington, D.C.)


    The reasoning is quite simple: if businesses are investing more than they are making, they must be borrowing to do it. Fixed investment – the construction of things like buildings, plants and factories – has to be paid for before it produces income. That means taking a lot of short term loans, refinancing them when they come due and sometimes borrowing a little more to cover the interest due on the last loan. If interest rates rise between the planning phase and when the completed project starts generating revenue, that is what triggers Minsky’s “incipient” financial crisis. The only difference between the gap in 2007 and the gap in 2014 is that some of it is being made up by foreign earnings – a source that may not hold up as Europe teeters on its third recession in six years, China’s growth slows and Japan continues to struggle. The possibility of the Fed raising interest rates is receding further and further into the future.

    Falling prices and low interest rates might sound like “good” things. They are not. Low interest rates favor borrowers (and speculators) but it harms the elderly and baby-boomers going onto pensions because it reduces the rate of return they can earn on their safe-harbor investments like savings accounts and government bonds. Speculators in stocks, real estate, collectibles, etc. make out in a low-interest rate environment with deflation. Safe-and-sound investors are more likely to lose because they are more likely to depend on interest for income. This is especially true for households living on fixed incomes and have a low tolerance for investment risk.

    This is another Lesson Not Learned by US policymakers: Banks and businesses find a way around Fed policy while consumers take it on the chin. We will all be better off when businesses depart from the crony-capitalist cycle of dependency on Federal Reserve hand outs. The business and consumer winners in the post-Capitalist society will be the ones who learn to accumulate human-capital knowledge instead of staking the health of the economy on financial capital. Capital flows are characterized by panics and manias. It will take human knowledge to resolve the financial crises that follow.

    Susanne Trimbath, Ph.D. is CEO and Chief Economist of STP Advisory Services. Dr. Trimbath’s credits include appearances on national television and radio programs and the Emmy® Award nominated Bloomberg report Phantom Shares. She appears in four documentaries on the financial crisis, including Stock Shock: the Rise of Sirius XM and Collapse of Wall Street Ethicsand the newly released Wall Street Conspiracy. Dr. Trimbath was formerly Senior Research Economist at the Milken Institute. She served as Senior Advisor on United States Agency for International Development capital markets projects in Russia, Romania and Ukraine. Dr. Trimbath teaches graduate and undergraduate finance and economics.

    Photo: “Federal Reserve” by Dan SmithOwn work. Licensed under CC BY-SA 2.5 via Wikimedia Commons.

  • Lobbying Pays Off 500-to-1

    I suppose we should not be shocked: businesses that spend money for lobbying and campaign contributions get more favors from government than those that do not. I spent the weekend at Creighton University in a seminar sponsored by the Institute for Humane Studies. I asked Creighton Associate Professor of Economics Diana Thomas about her research on the unintended consequences of regulation. One thing led to another and the next day I downloaded her 2013 paper “Corporate Lobbying, Political Connections, and the Bailout of Banks.” Here is a summary of what can be supported with scientific (statistical) evidence about the influence of big money on big government:

    • Campaign contributions and lobbying influence the voting behavior of politicians.
    • Campaign contributions and lobbying have a positive effect on wealth for the shareholders of the companies that spend.
    • Businesses that pay lobbyists before committing fraud are 38% less likely to get caught; even when they get caught they are able to evade detection almost 4 months longer than those that do not pay for lobbying.
    • Firms with political connections are more likely to receive government bailouts in times of economic distress.

    The US government has a long history of bailing out private industry. In 1970, the Federal Reserve provided financial support to commercial banks after Penn Central Railroad declared bankruptcy. Throughout that decade federal financial support was provided to private companies, banks and municipal governments: Lockheed, ($1.4 billion) Franklin National Bank ($7.8 billion) and New York City ($9.4 billion) were all recipients Uncle Sam’s largess. In the1980s, it was Chrysler Motors ($4.0 billion), Continental Illinois National Bank ($9.5 billion) and the savings and loan industry ($293.3 billion). The data available at OpenSecrets.org doesn’t go back further than 1990, but last year the finance industry spent nearly half a billion dollars on lobbying and campaigns – the most of any industry sector. Just after the terrorist attacks of September 11, 2001, the airline industry received $5 billion in compensation and $10 billion in federal credit. For these favors, the airlines spent barely $15 million in 1996-2000.

    These are all pittances in comparison to the money handed out in 2008 and 2009. NewGeography readers know that the average member of Congress who voted in favor of the $700 billion Bank Bailout received 51% more campaign money from Wall Street than those who voted no – Republicans and Democrats alike. The main finding in Dr. Thomas’ paper is that banks that paid lobbyists and made political campaign contributions were more likely to receive TARP money. To put a fine point on it, for every dollar spent lobbying in the 5 years before the bailout, banks averaged $535.71 in TARP bailout money! We knew the bank bailout was rigged, but that is a better rate of return than even Warren Buffett got for his contribution to the bailout of Goldman Sachs.

    The only good news is that spending – at least the spending that can be tracked – was down in 2014 from 2013. Spending by most industry categories has been in general decline since 2010. Between Congress and the Federal Reserve, businesses benefited from an estimated $16 trillion in government assistance since 2008. They are either having a “why bother” moment or the 2016 Presidential election will be another record breaking year for campaign spending.

  • A Lifetime of Financial Advice for 2015

    When household savings falls and household debt rises, “most people” are spending more than they make. When people find out I’m an economist, they often ask if I can explain why “most people” can’t figure out how to handle their money. The New York Fed recently reported the end of deleveraging: American households are borrowing again. When you get paid, you can do one of two things with your money: save it or spend it. If you aren’t saving AND you are borrowing, then clearly you are spending more than you make.

    There are a lot of people in America who are young, struggling and without inheritance or some initial endowment to get started in life. The Census Bureau reports a 17.5% rise in the number of 25 to 34 year olds living with their parents (from 2007 to 2010). This increase cuts across all socio-economic lines. Regardless of the demographics that impact the way the economy grows, we all go through life-cycles. I did it, you did it and “most people” will do it, too. If you are smart, you’ll engage the economy throughout the cycles of your life. Here’s how it works. The six cycles correspond roughly to the decades from your 20s to your 70s.

    CYCLE 1 (20s): Without an initial endowment, we all struggle in the first decade after we leave our parents home (or foster care, or whatever situation it was that brought you to adulthood). Your skill set is very low and you may or may not have gotten a college education. You are an unknown quantity in the job market, untried and unproven, so your wages will be quite low. You also have no secondary source of income (no endowment, remember, means no investment income). If you are smart and lucky, you’ll figure out that you have nothing and so you will spend nothing that you don’t have. Focus on keeping a good job, building some skills, try to get a little more education and keep your nose clean. That’s enough for the first decade.

    CYCLE 2 (30s): By now, you’ve got a resume built up so you can expect to be promoted or to look for a better job that pays more, maybe has some benefits like health insurance and some kind of a savings plan. Put something into that employer-matched 401k plan: sure, you probably won’t be able to wait until age 65 to dip into it, but it will be money that you won’t otherwise have. The match means that you earn an instant 100% on your money. Even if the penalty for early withdrawal is about 25%, you will still be ahead by 75% even if you can’t wait for retirement. If you have some financial assistance (from family or a grant of some kind), you’ll probably acquire some sort of property at this point. Maybe it’s a small business or a home but it’s the grown-up thing to do. Stay away from making a big investment in some depreciable asset, like a sports car, at this point. These are the beginning of the years in which you will build capital for the future: financial capital (investments), human capital (skills and education), and social capital (a good network of contacts, both social and business). Focus on moving up in your career a couple of times so that you can begin to put money into savings and investment on a regular basis. Avoid the trap of building up a lot of debt during this stage and be sure to stay within your means.

    CYCLE 3 (40s): These are the real building years. You should be well-established in your field of work and hopefully you have built strong and stable social connections, too. It’s time to start thinking about giving back to the community that supports you. You can volunteer, start making larger cash donations to charities, attend some charity balls or even run for office (or get active in the campaign of a candidate you support). Some of these social and charitable contacts will be helpful to you in business and some will just be the kind that makes living in a community more pleasant. Your focus now is to set achievable life-goals. Whatever your ambition was in your 20s, by now you will have a clear vision of what you can realistically attain. With that idea in mind, set goals for your career, your finances, when you want to retire from work, etc. Make them realistic for now, based on what you know. You’ll get a chance to adjust them only once more in your lifetime.

    CYCLE 4 (50s): Now’s the time to begin planning for the culmination of your work life. It could be another 20 years off, but you need to think through how you will sustain that longer career, or to plan to stop working altogether. If you wait till the next cycle, when you are in your 60’s, it may be too late to make any changes that will be necessary for you to achieve your goal. Your earnings will peak in this decade so if you haven’t saved enough along the way, this is the last chance to start to bring your savings in line with your goals.

    CYCLE 5: (60s): By now, if you’ve followed through with planning and budgeting, you should be able to take it easier. A lot easier (retire from working) or a little easier (work part-time or in your own business). If you’ve been able to get some education, you may be able to support yourself fully as a knowledge-worker. Knowledge workers have longer work lives because they won’t have limitations on endurance or other physical job requirements. Even if your job was physically demanding, it is possible that an employer will need your advice as a manager or consultant on a project that will benefit from your years of experience.

    CYCLE 6 (70s): Average life expectancy in the US is in the low- to mid-80s for both men and women. That means that, on average, this will be the penultimate decade of your life. Depending on your early choices, you may find yourself now at the pinnacle of your profession. Try to pass along as much of your knowledge as you can to the next generation, both what you learned in your career and what you learned from your life experiences.

    If it seems they aren’t listening, keep talking. Maybe something will sink in and when they read in the news that “most people” spend more than they make, they will be able to count themselves among the unusual. Have a safe and prosperous 2015!

  • Governments’ Oil Windfall

    We are reading a lot about the windfall coming to consumers due to falling gas prices now that oil is under $50/barrel. But cheap energy also represents a windfall for governments, including governments who are hard pressed for cash.

    The US uses nearly 20% of the world’s energy consumption every year. That spending includes households, businesses, industries and governments. Households in the US spend nearly $450 billion on gasoline alone to fuel their 2.28 vehicles. Energy for transportation represents about 50% of US consumer spending on average and climbs to nearly 70% in the summer when there is more driving. Governments spend money on gasoline, too.

    Not just the federal government, but government at every level – federal, state, county, city – all of which have fleets of cars and trucks that use gasoline.  We could not locate data on fuel spending by state governments for either gasoline or heating/cooling. The Bureau of Economic Analysis tables lump spending at gas stations in with “Other retail” which includes furniture and appliance stores and places like home depot. We did locate the numbers of cars owned by governments and police. Governments in the United States own about 1.5% of all vehicles on the road. That includes military vehicles, cars and trucks owned by the federal, state, county and local government plus police vehicles.


    Data is from www.rita.dot.gov, sourced as www.automotive-fleet.com as of Nov 26, 2013.

    Whether we extrapolate from the number of vehicles and use the “per car” savings estimates or estimate the savings based on the governments’ share of vehicle ownership, we guess that governments across the US will be sharing in at least $1 billion this year. And that is just on gasoline alone.

    They could also be saving on heating bills for real property. The Federal government alone owns almost 400,000 buildings located throughout the country. According to the Consortium for Science, Policy and Outcomes at Arizona State University, the US Federal government spends up to $610 billion annually on energy consumption. Every 1% drop in the prices could mean a $6 billion windfall for Uncle Sam.

    Don’t be surprised if he expands spending instead of using the savings to reduce the national debt or to balance a budget.