Author: Susanne Trimbath

  • States Taxes on Internet Commerce

    The Internet Tax Freedom Act (ITFA), signed into law by President Clinton in 1998 and extended three times since, was scheduled to expire on November 1, 2014 if Congress did nothing – which they are very good at. ITFA placed a moratorium on new taxes either for Internet access services or for products and services not already taxed in local commerce. A more definitive action, the Marketplace Fairness Act (MFA), has been attached to various versions of the ITFA renewals. The MFA would force all remote vendors (regardless of physical presence) to collect and remit sales taxes for every state where buyers take delivery of goods (and services, if subject to sales taxes).

    About seven states had charges on Internet access fees prior to the first ITFA, which included a grandfather clause for them. Eight states passed “Amazon Laws” since 2008. New York was first. Big retailers like Amazon and Overstock terminated agreements with small in-state e-tailers who earned revenue by linking their websites with the big companies’. Amazon sued the state of California over being forced to collect sales tax because they had related businesses in the state. The Direct Marketing Association got a U.S. District court to stop the state of Colorado from requiring remote vendors to notify residents that they are responsible for paying sales taxes and to provide information to the state for them to enforce collections.

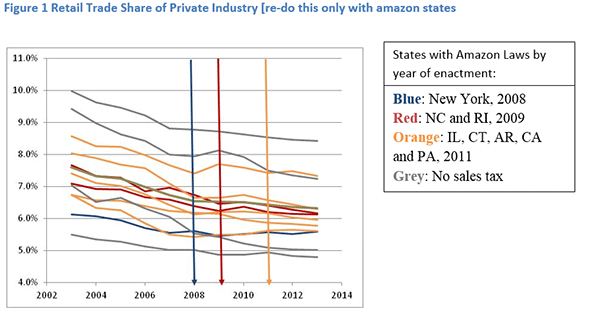
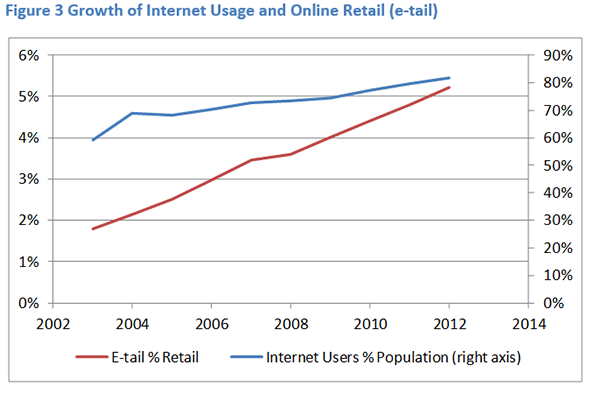
    I ran a statistical analysis to test whether enacting Internet sales tax laws (“Amazon Laws”) had an impact on total retail sales in the state. When we control for the share of the population that are Internet users – something not taken into account by other data analysts – we found no statistically significant impact on retail trade from enacting Amazon Laws. A sample of our results are presented visually in the chart. Note, especially, that even states with no sales tax saw a decline in retail trade around 2008-2009, the time of the first Amazon Laws. The drop is likely due to the global economic recession.

    After sixteen years and four extensions of ITFA, plus numerous lawsuits, Amazon is collecting sales taxes on purchases made by customers from 23 states with one more slated to be added in 2016. Including the five states without sales tax, that covers about 69% of Americans, according to the Wall Street Journal (October 1, 2014). Amazon has a physical presence in just 21 states and only 8 states have “Amazon Laws.”

    Most news reports on the subject of Internet sales taxes present only a partial rhetoric, similar to this:
    “At issue is a bill that would allow states to collect sales tax revenue from online retailers outside their borders. Right now, states can only collect sales taxes from a business with a physical location in that state.”

    But the real point “at issue” is the inability of states to enforce existing tax laws. Forcing e-tailers to collect the tax means they will incur costs well-beyond that of terrestrial retailers because they must collect and remit for 49 more states than local retailers. To be completely fair, local retailers would have to check the identification of buyers and collect and remit state sales taxes to the states where the buyers reside. Imagine the burden on retailers in states with high visitor traffic – like Nevada, California, New York, or Florida.

    Every state wants to know the potential income from extending sales tax to out-of-state Internet retailers. Recently, we completed an analysis of this potential in Nevada for the Las Vegas Global Economic Alliance. We found that the increased tax revenue would be quite small and likely to remain so for several more years. At the same time, the cost to the states could be quite high. These costs may diminish in the future as retailers and states with Amazon Laws are forced to work out operational solutions. Given that many states already have working arrangements with Amazon and other large national retailers (including through multi-state agreements), there appears to be little benefit from new state tax legislation on this issue.

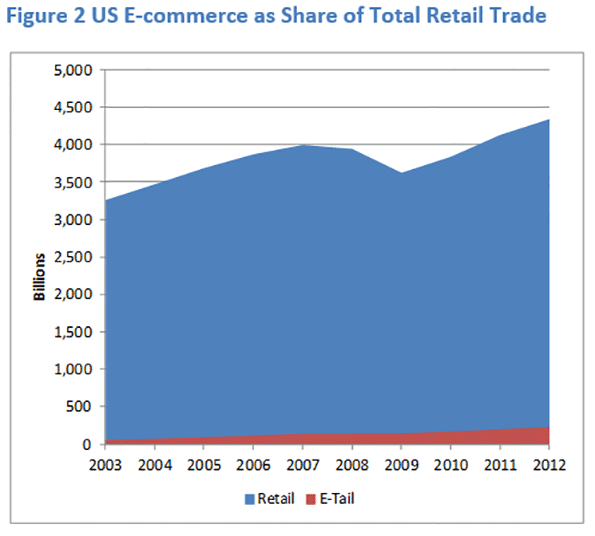
    In reality, only a small part of internet commerce is taxable. Manufacturers’ e-commerce shipments were more than one-half of all online sales in 2012. Much of these sales are not subject to state sales tax regardless of the location of the buyer or the seller because they are purchased for re-sale. In most of the US, total retail trade is a declining share of private industry. The part of e-commerce that matters from a sales tax perspective is retail consumer sales: just $227 billion in 2012, or about 5.2% of total retail trade in the United States.

    Business-to-business (B2B) sales are about 90% of all e-commerce, of which only about 13% is taxable. Of retail sales provided through e-commerce, more than 10% of the value is in motor vehicles where taxes are easily collected because most states require proof that taxes have been paid to register a vehicle. There is wide variation in the estimates of uncollected sales tax. One study from 2014 found significantly smaller estimates than an earlier study because they surveyed the states about compliance and then checked the online order platforms of several large e-tailers for compliance. The earlier study (2010) simply assumed an extremely small tax compliance rate among sellers.

    Many online retailers are remote geographically and/or economically from their buyers. This connection of the e-tailer to the state is referred to as “nexus”.  An important difficulty for e-tailers has to do with identifying the state entitled to the sales tax. A simple example illustrates this problem. If a resident of Nevada purchases a bar-b-que grill to be delivered and used at his vacation home in Utah from a retailer in California, who gets the tax? And who bears the cost of compliance which court decisions place on the taxing state?

    Some e-commerce businesses claim state taxes on e-commerce are detrimental the states’ ability to compete with surrounding states. This attitude belies some lack of understanding about the issues. If these businesses are selling to residents in the same state, they should already be collecting sales tax. It is only the population of the other states that should be of concern. In fact, Amazon founder Jeff Bezos is reported to have selected Washington as home for his Internet retailer, at least in part, because of the small state population from which he would be obligated to collect sales taxes. Washington’s population ranks 13th among states – that leaves 37 states with fewer people for internet retailers to choose from, including many that have a lower share of internet usage in the population (see the table at the end of this article for a complete list).

    More than 10% of e-commerce retail sales are conducted over Ebay, where many small retailers make up most of the sellers’ market. Legislative proposals generally include an exception for small sellers – usually those with between $500,000 and $1,000,000 sales annually delivered to the state. There is some evidence that buyers prefer to purchase from local sellers even when making online purchases: Ebay shoppers are 7% more likely to buy from an in-state vendor. But, research also indicates that states with no sales tax are no more likely than other states to generate in-state purchase preferences among online shoppers. 

    E-tail is growing but it has yet to reach the levels predicted in early research. For example, in 1999 the National Governors Association forecast e-commerce would reach $300 billion by 2002. Even ten years further into the future, e-commerce in the US was just $192 billion.

    Forcing e-tailers to collect sales taxes for every states is wrought with technical and legal pitfalls and unproven financial payoffs. Many states are finding a fast and reliable way to increase collections without creating new sales tax schemes. States with income taxes provide a space on the form for reporting it and states without an income tax provide convenient online filing – a process already familiar to consumers of e-commerce a. Several states provide look-up tables based on income (compared to saving and calculating actual purchase receipts) to make paying your sales tax on out-of-state purchases more convenient.

    One of the main reasons for low compliance with consumer sales tax payments is lack of knowledge: Ask a random person on the street if they know they are liable for sales taxes on out-of-state purchases and chances are they will say “no.” Oklahoma aired a television ad that included a list of the projects that sales tax collections could fund (e.g., education, police, and fire). As a result, the number of income tax returns with sales tax payments leaped by 20%. These options will produce faster results at a lower cost than defending new tax legislation at the state or federal level.

    Susanne Trimbath, Ph.D. is CEO and Chief Economist of STP Advisory Services. Dr. Trimbath’s credits include appearances on national television and radio programs and the Emmy® Award nominated Bloomberg report Phantom Shares. She appears in four documentaries on the financial crisis, including Stock Shock: the Rise of Sirius XM and Collapse of Wall Street Ethicsand the newly released Wall Street Conspiracy. Dr. Trimbath was formerly Senior Research Economist at the Milken Institute. She served as Senior Advisor on United States Agency for International Development capital markets projects in Russia, Romania and Ukraine. Dr. Trimbath teaches graduate and undergraduate finance and economics.


    State Sales Tax and Internet Usage

    State

    Sales Tax Rate (%)

    Retail (% Private Industries GDP)

    Internet Users (% population)

    Private Industries GDP ($mil)

    Alabama

    4.0

    8%

    65.0

    156,917

    Alaska

    0

    4%

    84.0

    49,414

    Arizona

    5.6

    9%

    78.5

    233,547

    Arkansas

    6.5

    7%

    66.8

    103,810

    California

    7.5

    6%

    79.7

    1,851,147

    Colorado

    2.9

    6%

    79.9

    243,303

    Connecticut

    6.35

    6%

    86.5

    218,141

    Delaware

    0.0

    5%

    80.4

    54,193

    Florida

    6.0

    9%

    78.8

    668,823

    Georgia

    4.0

    7%

    76.5

    378,343

    Hawaii

    4.0

    9%

    82.6

    55,818

    Idaho

    6.0

    9%

    82.2

    49,840

    Illinois

    6.25

    6%

    78.5

    630,775

    Indiana

    7.0

    6%

    73.5

    277,853

    Iowa

    6.0

    6%

    77.5

    138,367

    Kansas

    6.15

    7%

    78.9

    118,833

    Kentucky

    6.0

    7%

    68.8

    151,035

    Louisiana

    4.0

    6%

    67.7

    223,985

    Maine

    5.5

    10%

    82.8

    45,636

    Maryland

    6.0

    7%

    82.3

    265,329

    Massachusetts

    6.25

    5%

    86.2

    381,249

    Michigan

    6.0

    7%

    78.4

    367,147

    Minnesota

    6.875

    6%

    82.1

    267,937

    Mississippi

    7.0

    10%

    53.3

    83,605

    Missouri

    4.225

    7%

    72.4

    235,769

    Montana

    0.0

    7%

    73.6

    35,665

    Nebraska

    5.5

    6%

    80.2

    89,736

    Nevada

    6.85

    8%

    80.0

    113,774

    New Hampshire

    0.0

    8%

    90.1

    57,963

    New Jersey

    7.0

    6%

    87.8

    470,251

    New Mexico

    5.125

    8%

    68.0

    68,052

    New York

    4.0

    6%

    81.5

    1,130,320

    North Carolina

    4.75

    6%

    71.8

    387,032

    North Dakota

    5.0

    6%

    75.9

    44,281

    Ohio

    5.75

    7%

    76.7

    484,156

    Oklahoma

    4.5

    7%

    67.9

    144,100

    Oregon

    0.0

    5%

    86.1

    186,325

    Pennsylvania

    6.0

    6%

    77.8

    563,086

    Rhode Island

    7.0

    6%

    81.0

    44,003

    South Carolina

    6.0

    9%

    67.0

    147,884

    South Dakota

    4.0

    7%

    72.9

    38,572

    Tennessee

    7.0

    8%

    72.9

    246,840

    Texas

    6.25

    6%

    68.6

    1,313,557

    Utah

    5.95

    7%

    87.6

    116,212

    Vermont

    6.0

    9%

    81.7

    24,170

    Virginia

    5.3

    6%

    77.8

    359,664

    Washington

    6.5

    8%

    85.7

    333,994

    West Virginia

    6.0

    8%

    70.5

    58,325

    Wisconsin

    5.0

    6%

    83.0

    240,059

    Wyoming

    4.0

    5%

    79.4

    36,357

    US Total

    7%

    84.2

    14,058,314

    Sources: State sales tax rates 2014 from Federal of Tax Administrators (does not include any municipal or special district sales tax); Internet Usage 2010 from InternetWorldStats.com; GDP 2012 from Bureau of Economic Analysis

  • 10 Steps to Financial System Stability: Lessons Not Learned

    Recently, BloombergView writer Michael Lewis called attention to tape recordings made by a Federal Reserve Bank of New York bank examiner who was stationed inside Goldman Sachs’ offices for several months during 2011-2012. She released the tapes to This American Life who aired her story on September 26, 2014. Every media article I’ve seen on this begins with a prelude warning how complicated and hard to follow the story will be. Regular readers of New Geography are several steps ahead in their understanding of these causes and consequences of the financial crisis. If you are new here, you can follow the links in this piece to earlier NG articles.

    Central to the theme of the story is the release of a 2009 report by Columbia University professor David Beim on why the Federal Reserve – especially the New York office which was supposed to be watching the banks – failed to act to prevent the crisis. Beim listed about a dozen “Lessons Learned” by bank supervisors after the financial crisis. In this article, we list the Lessons not Learned before the financial crisis. These lessons come from decades-old studies of financial regulation from around the world. If any US policy makers had paid attention in school, we would have avoided the global financial collapse of 2008. The United States – which was at the center of that storm – had been preaching these steps to emerging market nations for decades. Unfortunately, they just were not following them for us. In the fall of 1998, those emerging market economies seriously threatened the financial stability of the West. In the fall of 2008, it was the West that brought the threat upon itself and the rest of the world.

    Four Policies, Five Tasks and One Idea

    Policies not implemented

    1. Have private, independent rating agencies: US rating agencies were technically independent because they were not owned by the government. However, with the creation by the Securities and Exchange Commission (SEC) of the “Nationally Recognized Statistical Rating Organization” or NRSRO designation, three big credit rating agencies were the only ones accepted for use to meet regulatory requirements – they were issuing 98% of all credit ratings. This gave a government imprimatur to selected businesses, creating undue reliance by financial markets globally. By 2008, the “NRSRO” term appeared in more than 15 SEC rules and forms (not including those directly used for NRSROs), plus rules in all 50 states. NRSROs are also referenced in 46 Federal Reserve rules and regulations. Even though the SEC sanctioned and required the use of the NRSROs they had no say in the process used to establish the ratings.

    Despite even pseudo-independence from the government, the NRSROs were not independent of the financial institutions that paid them to issue credit ratings. The government sanction gave them more power to wield against – or in favor of – the banks and companies they rated. They made money consulting for the same firms, resulting in pressure to rate bonds higher than they should have been rated.

    2. Provide some government safety net but not so much that banks are not held accountable:  Many banks – and all of the New York Feds “primary dealers” – achieved “too big to fail” status through the Wall Street Bailout Act. A few were allowed to fail in the months leading up to the passage of the Bailout – most notably Lehman Brothers – in what amounted to the federal government picking winners and losers without accountability. The Federal Deposit Insurance Corporation was nearly bankrupted in late 2009, removing the safety net that protected depositors. The FDIC was so depleted by the epidemic of collapsing banks, they eased the rules on buyers of failing banks, opening the door for hedge funds and private investors to gain access to “bank” status – and the protections that go with it. At the end of September 2009, the FDIC’s fund was already negative by $8.2 billion, a decrease of 180% in just three months. FDIC is projected to remain negative over the next several years as they absorb some $75 billion in failure costs just through the end of last year.

    At the same time, bailed-out banks, brokers and private corporations received additional financial support from the Federal Reserve in a move unprecedented in US history. Billions of dollars in loans were made to the banks without proper documentation. The lack of transparency in the process used by the Treasury to decide who would receive bailout funds and what the recipients have done with the hundreds of billions of dollars was the subject of a GAO audit we wrote about in 2011.

    3. Allow very little government ownership and control of national financial assets: Four years after the crisis, the U.S. Treasury still owned more than half of American International Group, Inc., (AIG). AIG was the world’s largest insurance company – giving the government ownership in international financial assets, too. The U.S. government took ownership positions in virtually every major financial institution during the bailout, plus some non-banks that had lending arms (like General Motors Acceptance Corporation). The GAO audit of the Fed shows we loaned money to and took ownership stakes in a slew of non-regulated businesses like Target and Harley Davidson. The lack of transparency in these transactions is dangerous. Austrian Economist Ludwig von Mises warned decades earlier that market data could be “falsified by the interference of the government,” with misleading results for businesses and consumers.

    4. Allow banks to reduce the volatility of returns by offering a wide-range of services: Until the passage of the Dodd-Frank Wall Street Reform and Consumer Protection Act in 2010, banks were restricted to buying securities defined as investment grade by the NRSROs. Given what we now know about these ratings and the actual riskiness of some AAA-rated investments, the requirement actually made bank investments more dangerous. The process followed in the years (even decades) leading up to the collapse of credit markets was not one that would meet the definition of “unrestricted.” Although there appeared to be a wide range of activities available to US banks, the restriction on credit ratings would eventually increase volatility by concentrating risk instead of dispersing it. Just because a bank can deal in a particular investment does not mean that they should.

    The steps outlined here are a comprehensive program, not a menu of options.  There is no sense allowing banks wide latitude to make risky investments if proper supervision and enforcement is not in place. That leads us to the next steps: the necessary tasks for prudent regulation.

    Tasks Not Taken

    Ten years before the most recent financial crisis (1998), the international financial system had already entered a new era. Speaking at the Western Economics International Association in 2001, Lord John Eatwell said, “The potential economy-wide inefficiency of liberalised financial markets was indisputable.” Eatwell had been writing about these problems for decades.

    5. Require financial market players to register and be authorized: US regulators failed to act on establishing registration for hedge funds, failed to establish requirements for registering who can issue collateralized mortgage obligations (mortgage-backed securities), and failed to act on loopholes in regulations prohibiting insurance companies like AIG from issuing credit default swaps through subsidiaries – the list goes on. Dodd-Frank established the Financial Stability Oversight Council to designate “Systemically Important Nonbank” – yet another government imprimatur for unregulated entities. Instead of making sure only authorized businesses perform financial activity they are only making sure those big financial firms are bailed-out faster in the future.

    6. Provide information, including setting standards, to enhance market transparency: There were no standards for issuing derivatives. Nor for collateralized debt like the mortgage-backed bonds where there was no link from homes/real estate. Because the financial issuers had no standard for reporting changes in ownership to land offices who keep track of liens on homes (usually county-level property office), probably one-third of the bonds the Fed is buying in their monthly “quantitative easing” purchases are truly worthless.

    7. Routinely examine financial institutions to ensure that the regulatory code is obeyed: Without registration and standards, of course, they can be no surveillance by any regulator. Congress admitted that while “most of the largest, most interconnected, and most highly leveraged financial firms in the country were subject to some form of supervision” it proved to be “inadequate and inconsistent.” The story described to This American Life by Carmen Segarra is not news – it is only one more in a long history of problems.

    8. Enforce the code and discipline transgressors: Despite existing rules allowing regulators to prohibit offenders from engaging in future financial activity, only minimal fines have been issued.  “Too big to fail” practices allow regulators to “look the other way” on money laundering and other issues that put our national security at risk. According to the Special Inspector General’s Quarterly Report (September 2012), the “Treasury [is] selling its investment in banks at a loss, sometimes back to the bank itself” allowing even banks who have the ability to pay to get out of the program for less than they owe. Those responsible for creating the situation that required the Bailout have not been called to discipline. Quite the contrary, many were paid elaborate bonuses at the same time their financial institutions were receiving bailout funds.

    9. Develop policies that keep the regulatory code up to date: More than a decade before the crisis, Brooksley Born raised enormous concerns over derivatives in the US – including credit default swaps – during her tenure as chair of the Commodity Futures Trading Commission (1996-1999).  Both the SEC and the Federal Reserve Board objected to her ideas.  On June 1, 1999, Congress passed legislation prohibiting such regulation, ushering in a long period of growth in the unregulated market. Five years after the financial crisis began, rules are still not implemented. AIG became subject to Federal Reserve supervision only in September 2012 when they bought a savings and loan holding company. By October 2, 2012, AIG had been notified that it is being considered for the “systemically important” designation – the “too big to fail” stamp of approval for everything they do.

    One Way Out

    Which leads us to one old idea that every student who ever took economics 101 should remember:

    10. Create specialized financial institutions: In the context of what we know about the policies and tasks that support financial stability, only one additional factor needs to be considered, and that is an old theory on the economic gains from specialization. In The Wealth of Nations, Adam Smith told us that the bigger the market the greater the potential gains from specialization. With equity markets alone reaching a global value of $46 trillion, the potential gains are enormous.

    Peter Drucker made this point on specialization in 1993 in his prophetic book “Post-Capitalist Society.” While diversification is good for a portfolio of financial investments, in large systems it means “splintering.” In a system as large as financial markets, diversification “destroys the performance capacity.” If financial institutions are tools to be used in furthering the efforts of the broad economy, then as Drucker writes “the more specialized its given task, the greater its performance capacity” and therefore the greater the need for specialization.

    The rise of the financial sector has been tied to economic expansion throughout our modern business history. The more robust the flow of finance, the more robust is the potential for economic activity. Greater efficiency in capital markets can lead directly to greater efficiency in industry. Our economy, our livelihood and our well-being are inextricably related to finance at home and around the world. It is now necessary to return to the basics and recognize the long run value of economically efficient specialization. We are living in the post-capitalist society described by Drucker. US regulators have been overly focused on the financial theory of portfolio diversification, ignoring the economic importance of gains through specialization. Drucker’s forecast was accurate: “Organizations can only do damage to themselves and to society if they tackle tasks that are beyond their specialized competence.”

    None of this is to say that our long-term failure is guaranteed. What happens next will be an experiment on a grand scale. The Financial Crisis Inquiry Commission concluded: “The captains of finance and the public stewards of our financial system ignored warnings and failed to question, understand, and manage evolving risks within a system essential to the well-being of the American public.” Carmen Segarra did not tell us anything new: hopefully what she told us – and what ProPublica and others are writing about it – will help a wider public to understand the problem.

    Susanne Trimbath, Ph.D. is CEO and Chief Economist of STP Advisory Services. Dr. Trimbath’s credits include appearances on national television and radio programs and the Emmy® Award nominated Bloomberg report Phantom Shares. She appears in four documentaries on the financial crisis, including Stock Shock: the Rise of Sirius XM and Collapse of Wall Street Ethicsand the newly released Wall Street Conspiracy. Dr. Trimbath was formerly Senior Research Economist at the Milken Institute. She served as Senior Advisor on United States Agency for International Development capital markets projects in Russia, Romania and Ukraine. Dr. Trimbath teaches graduate and undergraduate finance and economics.

    Wall Street bull photo by Bigstockphoto.com.

  • Real Economic Payoff from Infrastructure

    With the Obama proposal to get some money for infrastructure, it is time to revisit the payoff from investments in transportation. Investments that improve the performance of transportation in the US will pay for themselves in 17 years through increased economic activity and the resulting gains in federal tax revenue. The rate of return for national investments in transportation is 7%, significantly more than the cost of borrowing. Recently released research verbalizes a theory of why the performance of infrastructure matters for the economy.

    Transportation provides the foundation for all economic activity. Transportation is used to bring labor and inputs to places of production, to deliver final goods and services to end users and to bring customers to the market place. How well is it doing its job? In an economy the size of the US even small improvements can mean big dollar gains. Making the investment to improve transportation performance can result in a measurable return on investment with a payback period that is well short of the life-expectancy of most transportation infrastructure.

    Just as infrared is the invisible part of the spectrum of light, it often seems that infrastructure is the invisible part of the economy. It has become popular – especially since the turn of the century – to think of the economy as increasingly dependent on the insubstantial and the ethereal – emailing, e-trading, e-commerce. The reality is that all commerce – even e-commerce – eventually depends on transportation infrastructure. After all, someone has to get the computer components from the factory to the e-business; and when the computer hardware breaks down, someone will likely use transportation infrastructure to get to the place of business to fix it. No e-commerce can occur until transportation infrastructure is used to get the equipment to the location where rare earth minerals are extracted and to take those minerals to the factory – usually on another continent – where workers arrive via transportation infrastructure to build the computers in the first place. In many ways, there can be no commerce – “e“ or otherwise – without bricks-and-mortar infrastructure.

    Despite repeated outcries for additional funding, transportation spending in the US was more than $100 billion under budget in the first decade of the new century. While there is much debate about how much to spend on transportation, since 1980 (1990), federal spending on transportation in the US has been $152.3 billion ($125.5B) less than budgeted. Federal spending on transportation exceeded budget in only four years: 2011 by $6.5 billion (the most ever), 2012 by $4.4 billion, 1996 by about $3 billion, and 1995 by $50 million. The $10.9 billion spending over-budget in 2011 and 2012 was necessary to fulfill commitments from 2009, when spending was under-budget by an extraordinary $40.7 billion. Excluding 2009, the average annual under budget since 1980 (1990) was $3.5 billion ($3.8 billion).

    Figure 1 Federal Spending Over/Under-Budget 1980-2012

    Screen Shot 2014-05-21 at 2.20.23 PM

    Data Source: Budget of the United States, Transportation Budget Authority FY 2011, Table 3.1 Outlays by Superfunction and function, updated with Table 5.1 from FY2014 tables; actual spending through 2012. Red on either line indicates spending over budget for that year. Author’s calculations.

    Table 1 Federal Spending Under-Budget by Decade

    Screen Shot 2014-05-19 at 5.03.29 PM

    Worse yet, transportation policy has been allowed to stagnate: the strategic economic goals and performance measures in the Department of Transportation’s 2014 performance plan are nearly identical to the 2002 plan. Economic competitiveness is one of the strategic goals set by the US Department of Transportation (Performance Plan FY2014, available at www.dot.gov). By their definition, economic competitiveness means maximizing the economic returns of the network and keeping the transportation system responsive to consumer needs. This may sound like the kind of initiative that would allow the US to stay globally competitive. However, these strategic goals are little changed from ten years ago; and most of the performance measures in the 2014 economic strategy were the same in 2002. Each strategic goal is also associated with a line-item in the federal budget, making them more than just slogans, making them actual cost centers.

    Figure 2 Department of Transportation Performance Plans

    Screen Shot 2014-05-19 at 5.53.47 PM

    Clearly, what the US needs now is better planning and strategic project selection, plus streamlined delivery processes to increase the productivity of infrastructure investment. Most of the existing transportation infrastructure could not handle the coming surge in demand. The surge is not only the result of organic growth in the size of the country, but also from an increase in the fundamental reliance of our economy on the use of transportation infrastructure. The result will be a nation falling further and further behind our global competitors.Yet, the world that business moves in has changed significantly as has the way that business moves. The service sector – the fastest growing part of the economy – is increasingly dependent on transportation. The services sector has the second fastest growing usage of transportation services (after construction) and remains the fastest growing sector in the US economy. Measuring the economy’s response to a change in the demand for transportation services, DOT-RITA conclude that “an investment in … transportation will have a greater economic impact than an equally sized investment in trade or utilities.” Investments to improve air transportation services would have the biggest economic impact. Except for rail transportation, the impact of improving the nation’s airports is bigger than investments in government and information services.

    Table 2 World Economic Forum, Global Competitiveness Report 2009-2010


    *The European Union economy is the largest in the world (CIA, 2013).  Scores are the result of responses to questions in the format: “How would you assess the quality of  [X] in your country? (1 = extremely underdeveloped; 7 = extensive and efficient by international standards),” where [X] is “Basic Infrastructure”, “Roads”, Railroads”, etc.  Scores for 2009-2010, US rank for transportation infrastructure was little change in 2012-2013 (13th). Details available at http://www.weforum.org/

    What will it cost?

    The US has more airports, roads and railways than any other country in the world – only Russia, China and Brazil have more waterways. However, the US is not alone in needing massive investments in infrastructure.

    The total investment needed for all infrastructures worldwide is estimated at $53 trillion through 2030, with a total of $15.5 trillion just for transportation. The Organization for Economic Cooperation and Development and others estimate a cost equivalent to 3.5% of GDP to improve infrastructure across all sectors – water, energy and transportation. A report from McKinsey Global Institute (McKinsey Infrastructure Practice) calculates that this investment is 60% more than all spending in the last 18 years; and more than the estimated value of today’s worldwide infrastructure. Consulting firm Booz Allen projects the cumulative infrastructure spending needs for the US (and Canada) from 2005 to 2030 to be $936 billion for road and rail and $432 billion for airports and seaports (about $1.4 Trillion total). Dividing this between the US and Canada in proportion to real GDP, just over $1.2 trillion is needed to upgrade the performance of US transportation infrastructure to first class.

    For the purpose of demonstration, let’s assume that the entire $1.2 trillion is invested in the US in 2014. The latest models demonstrate that the economic gains would begin to appear as higher GDP per capita in 2018. The economy starts 2018 at a level that is higher than it would have been without the investment in infrastructure. By 2025, the economy is larger by an amount greater than the initial investment in 2014. In financial terms, the investment has a 17 year payback period – substantially shorter than the life expectancy of transportation infrastructure. Taking 25% of the gain each year as government revenue (average government tax revenue as a percent of GDP in the US), the cumulative increased tax revenue will exceed the cost by 2025. A standard, basic financial analysis well-understood by both business executives and policy-makers shows a 7% internal rate of return – a number significantly higher than the borrowing costs for financing transportation infrastructure investments in the United States.

    Paying For It

    But what about the rest of the story: where does the initial funding come from to make the needed performance improvements? There is no “free ride” here – the construction and renovation of transportation infrastructure carries a hefty price tag that has to be paid one way or another. The options currently under discussion among researchers and policy makers in the United States are:

    1. The status quo – which has not worked in over 20 years.

    2. Reducing demand – One way to improve performance is to discourage the use of transportation infrastructure. Joel Kotkin reports the work of demographer Wendell Cox on the new migration to America’s “Efficient Cities” – resulting in net outmigration from America’s most congested cities.  Smaller populations are one way that the demands on infrastructure may fall naturally – but with potentially undesirable consequences for economic growth. While American’s do more driving than any other nation on earth, there is some new evidence that the long standing trend of increasing driving is tailing off.

    3. Increasing user fees — Unfortunately, user fees are wrought with difficulties. First, “congestion pricing” fees are used to reduce demand rather than as a way to generate a revenue stream (with the obvious exception of some toll roads). There are several specific challenges: federal barriers to implementing fees and transaction costs are the most obvious. While the impact of fees as a revenue mechanism may be modest, there are additional implications for land use patterns and policies. Urban Land Institute provides an important cautionary note on tolling that could be applied to user fees in general. If the fees are permanent and not limited to rewarding investors in a particular facility, local policies will need to be established regarding the distribution of income beyond the designated payback period. The alternative, of course, is to tie the period of the fees to the reward and repayment of investors.

    4. Public-Private Partnerships — Also known as PPP or P3 – cover a spectrum of financing options ranging from private concession operators to privately owned roads. At the lowest level on the PPP spectrum are private operators who raise their own financing for upfront costs and ongoing operations for concessions such as food service on highway plazas or newspaper stands inside train stations. Their revenue generally comes from sales. At a higher level, risk is allocated between public and private partners (e.g., public carries demand risk, private carries construction risk). Financing is often shared and comes in the form of both equity and debt. The revenue stream to repay debt (or reward equity investors) comes from user fees. In “build, operate, transfer” (BOT) cases, the government’s role changes from manager, operator and financier to regulator. Effective government controls on safety and security, anti-competitive behavior (access, pricing, service quality, etc.) are critical to the success of these projects. The final level is a purely private project which is used for public purposes. The private owner/operator builds the facility. A revenue stream is necessary to service debt, repay financial loans/borrowings, and reward capital investment. Freight railroads in the US are a good example of privately financed infrastructure in the US.

    There is no lack of private money – especially under the current conditions of Federal Reserve intervention in the economy. According to a 2013 study by consulting firm McKinsey, an additional $2.5 trillion will be made available for infrastructure financing by 2030 if institutional investors meet their target allocations. The trouble is finding ways to direct revenue back to the private investors.

    Other Revenue StreamsUntitled

    How do we create that revenue stream to attract private investment into public infrastructure? Americans are notoriously opposed to paying for public goods. Branded revenue opportunities are just coming on the table in the US but have been used wide and far in other countries.

    Branded revenue streams – or private advertising in public spaces – has come a long way since realtors put their faces on benches or lawyers put their names on the backs of city buses. Branding now extends to the infrastructure itself. New York City’s Metropolitan Transit Authority added branding to turnstiles and train doors. More opportunities exist, including entrances, escalators, stairs, trains, overpasses, poles, walls, and even floors. Phoenix and Denver expect to earn up to $1 million in annual revenue from wrapping light rail trains in advertisements.

     Branding is not limited to print, either. New York, Chicago and Santa Monica are exploring LED advertising on the sides of busses. Dayton, Champaign-Urbana, Toledo (TARTA) and Kansas City (KCATA) have audio ads timed to promote businesses along routes. Just as advertising in metro transit is no longer limited to framed posters on subway platforms, highway advertising is no longer just for billboards. Why not, as pictured here, allow branding on overpasses? In November 2010 (USA Today November 22), cash-strapped California considered generating a much-needed revenue stream by allowing advertisements on emergency (“Amber-alert”) highway signs. But even these signs are virtual antiques. Ideas for where and what can accommodate an attractive yet discrete opportunity for a branded revenue stream are only limited by the number of pixels that can be used in an electronic display.

    The Way Forward

    All is not doom and gloom. There is a new, improving trend in the performance of transportation infrastructure in the United States. These improvements are a reflection of broad-based initiatives on both the supply and the demand sides. Meanwhile, the US continues to decline in the global rankings for poor transportation infrastructure (World Economic Forum, Global Competitiveness Index, shown earlier). Although US road, rail and even port rankings manage to stay in or near the top 20 in the world in the rankings, the US airport infrastructure quality ranking fell from 9th in the world in 2007-2008 to 32nd in 2010-2011 (currently at 30th).

    The underlying question is not how much to invest it is how that investment can deliver improvements in infrastructure. Analysts at McKinsey estimate that streamlining infrastructure delivery alone could generate 15% in cost savings. Clearly, additional funding alone is not enough. We also need innovative ways to fund, build, maintain and operate the vital transportation structures that support economic activity.

    Acknowledgements: Some of this material was previously published as STP Working Paper 2014_02, Calculating the Real Economic Payoff of Infrastructure. The Let’s Rebuild America initiative at the US Chamber of Commerce is headed by Janet Kavinoky. Funding for the project was also provided by the National Chamber Foundation in Washington, D.C. The original project team for developing indices to measure the performance of infrastructure in the United States was led by Michael Gallis and Associates of Charlotte, NC. The author is grateful to Kamna Pandey in New Dehli (India) for her slide show on revenue streams.

    Susanne Trimbath, Ph.D. is CEO and Chief Economist of STP Advisory Services. Dr. Trimbath’s credits include appearances on national television and radio programs and the Emmy® Award nominated Bloomberg report Phantom Shares. She appears in four documentaries on the financial crisis, including Stock Shock: the Rise of Sirius XM and Collapse of Wall Street Ethicsand the newly released Wall Street Conspiracy. Dr. Trimbath was formerly Senior Research Economist at the Milken Institute. She served as Senior Advisor on United States Agency for International Development capital markets projects in Russia, Romania and Ukraine. Dr. Trimbath teaches graduate and undergraduate finance and economics.

    This piece was originally published by IO Sustainability.

  • High Frequency Trading Is Not Fast Enough

    A new book by the original yellow journalist of Wall Street, Michael Lewis, initiated global coverage about the flaws of American capitalism. The culprit in Lewis’ new book is High Frequency Trading or “HFT.” There is no doubt that US capital markets are imperfect. New York Times DealBook writer Andrew Sorkin lays the blame at the feet of the stock exchanges of which there are so few remaining that the Federal Trade Commission could label them a monopoly.

    Even defenders of HFT, like Tim Worstall at Forbes, have to admit that it has risks and problems. It pushes volatility when markets are under stress; programming errors and misuse of software packages have been known to bankrupt the trading companies. The argument in favor of HFT fails when its proponents bring in “free market” economic theories – primarily because the stock market is not “free” in any economic sense. There are a limited number of big players – 5 banks in the US control 85-95% of trading depending on which market you measure. That is still more like an oligopoly than a competitive market. There are barriers to entry set up by the SEC, the FRB, and state banking and securities commissions. Finally, the transaction costs are enormous. Anyone active in the market knows about trading commissions and management fees. DTCC took in over $1 billion in revenue in 2012 (latest available) and still lost over $25 million. You get the picture – there is no free market argument.

    The programs used for high frequency trading are bastardizations of heat transfer dynamic equations. Those underlying equations are based on assumptions. First, they only hold true when time goes to infinity – but trades are executed in finite time. Next, they assume linear behavior – but markets are more like waves than straight lines. Finally, those equations require simultaneity of action. No matter how close the servers are located to the exchange, the computers are not fast enough to read the prices in one market and execute a trade in the next without some lag which violates the assumption. Richard Bookstaber called it A Demon of Our Own Design (Wiley, 2007). The university whiz-kids who built the programs knew they were violating the assumptions but they were under pressure from their Wall Street bosses so they decided to take the money and run the programs – warts and all.

    Trading programs treat capital markets as if one security is indistinguishable from the next – and that defeats the purpose of having capital markets at all. The reason we have these markets is so that entrepreneurs can access capital to fund new opportunities. Instead of letting computer programs decide which stock has the best opportunity for a price change, investors should be deciding which business has the best opportunity for success. The funded opportunities create jobs that pay income to households who turn around and put some of those earnings into savings. Lots of little savings accumulate into a pool of loanable funds that become available to other businesses to fund other opportunities to create more jobs, etc., etc. The goal of high frequency trading is to make money – at any cost. And the cost is the ability of capital markets to serve their primary purpose.

  • Our Federal Government: “There You Go Again!”

    Remember this?

    The fact remains that Congress has not passed a real federal budget since 1997 (“the first balanced budget in a generation”.) An “omnibus spending bill” was passed in April of 2009 but that is not technically a budget.

    Congressional inaction has left the federal government running on extensions (“Continuing Resolutions”) of a budget that was passed when Bill Gates was still CEO of Microsoft, NASA landed the first spacecraft on Mars, and Google was working out of a garage. The last federal budget is from the time before iPods and iPads, before SPAM e-mail exceeded legitimate email, before Facebook, YouTube and Twitter – and before the global financial crisis that sent the world into recession and US federal spending into the stratosphere.

    (“This is Your Government on Crack,” by Susanne Trimbath 02/12/2013).

    As one very famous Republican President said (repeatedly in his defeat of Jimmy Carter): “There you go again!”

    And, sure, this isn’t the first time the federal government has shut down for lack of spending authorization. I remember when my elderly mother and her sisters – first generation Americans eager to see the place where their parents disembarked after their long ocean voyage from Sicily – were so disappointed to find Ellis Island and the Status of Liberty closed that October of 1996.

    The big difference this time is the way government is spending – which I discuss in detail in the article quoted above. USAToday has an article that summarizes just how different the government operates today than it did 17 years ago. There is a big reason Republicans might want to re-think shutting down the government. According to USAToday, gun permits cannot be issued while the federal government is closed.

    Let’s hope one thing is the same in 2013 as it was in 1996 – when they re-opened the government Congress passed a real budget.

  • This is Your Government on Crack

    Forget about a fiscal cliff or the threat of sequestrations. Bernanke’s use of the term “cliff” in 2012 is based on the erroneous analogy that fiscal policy had been moving along some level road for a period of time and was just now approaching an “end” or “falling-off” point. The reality is that federal spending has been rising rapidly since the federal government 1) absorbed the cost of repairing the damage done by the terrorist attacks of 2001, 2) decided to support wars on multiple fronts in the Middle East, 3) bailed out the Wall Street Banks, and 4) failed to pass a budget but 5) decided to continue spending as if nothing had happened. So called “sequestration” – which in this case basically means reducing spending and increasing revenue – would simply be a return to reality, coming down to earth, getting our feet back under us. Unfortunately, we the people appear co-dependents in this addiction.

    This year started with Congress succeeding at its favorite athletic event: kicking the can down the road. The January inauguration of the President and installation of their new members provided the excuse. The fact remains that Congress has not passed a real federal budget since 1997 (“the first balanced budget in a generation”.) An “omnibus spending bill” was passed in April of 2009 but that is not technically a budget.

    Congressional inaction has left the federal government running on extensions (“Continuing Resolutions”) of a budget that was passed when Bill Gates was still CEO of Microsoft, NASA landed the first spacecraft on Mars, and Google was working out of a garage. The last federal budget is from the time before iPods and iPads, before SPAM e-mail exceeded legitimate email, before Facebook, YouTube and Twitter – and before the global financial crisis that sent the world into recession and US federal spending into the stratosphere.

    In lieu of doing anything meaningful, three senators – Kelly Ayotte (R-NH), Ron Johnson (R-WI) and Marco Rubio (R-FL), all in office since 2011 – took the time to write and introduce an amendment to the 1974 Budget Act that would require a macroeconomic analysis of the impact of new legislation. This monumental act of denial was such a complete waste of time that GovTrack.us gave it only a 9% chance of getting out of committee and a 1% chance of being enacted. In fact, from 2011 to 2013, while we were paying these three senators and hundreds more people in Congress, only 12% of the bills introduced in the Senate made it out of committee (11% in the House) and only 14% of those were enacted (24% in the House)! Having passed just a few more than 200 bills, the 112th Congress will go down in history as even less productive than President Harry Truman’s "Do-Nothing Congress" (the 80th, 1947-1948) which nevertheless managed to get 906 bills enacted.

    In the 2012 election, openings were available for 1 new president, 33 new senators and 435 new representatives. Instead, Americans re-elected the same President, 19 of the same senators (58%) and 351 of the same representatives (81%). As a result, the 113th congress looks a lot like the 112th.

    Recently, President Obama signed an executive order to lift the 2009 freeze on federal employee salaries – including the salaries for all members of Congress. When Congress voted to rescind the executive order – they have to vote to prevent an automatic annual pay increase – they did it not just for themselves but for all federal employees. Then they kicked the can (of the “sequestration” spending cuts) down the road two more months.

    Their final act in January was suspending the debt limit “at least until May 19”. H.R. 325 may turn out to be the bright spot in this whole mess despite the fact that it gives Geithner’s, now Lew’s, Treasury carte blanche for financing profligate spending. The “No Budget, No Pay Act” was written on Thursday January 3, 2013; introduced in the House on January 21st by Rep. Dave Camp (R-MI since 1991) and cosponsor Rep. Candice S. Miller (R-MI since 2003); passed in the House on January 23rd by a vote of 285-144; passed in the Senate on January 31st by a vote of 64 to 34.

    According to the bill, if Congress does not pass a real budget by April 15, the salaries of the members of the chamber unable to agree to the budget will be held in escrow until either they pass a budget or the last day of the 113th Congress. All the new Democrat senators voted “aye”; all the new Republican senators voted “nay”. The new House members were mixed. The bill goes to President Obama this week for signature.

    Assuming he signs it, H.R. 325 allows the federal government to borrow money beyond the record $16.4 trillion debt we already owe. That debt is 104.5% of 2012’s $15.7 trillion GDP. The budget deficit – which has to be covered by borrowing – is running over $1 trillion each year or about 7% of GDP. The deficit alone is 44% of federal receipts. In other words, the government is spending over 40% more than it earns! That’s your government on crack.

    It is like living with a drug addict:

    “Waiting for the problem to resolve itself will get you nowhere. What you are seeing now, if it isn’t already completely out of control, will get completely out of control.”

    The difference is that we, the taxpayers and our children and our children’s children, have to shoulder the burden – something the families of addicts are advised not to do. In a democracy, the majority rules and the majority decided to continue to live with these fiscal crack addicts. For the rest of us, our choice has to be to try to remain optimistic – take the good news where you can find it. There are no “fiscal therapists” or “family support groups” for disgruntled voters. We must seek out the venues where we can talk about the problem openly, don’t be fooled when the fourth estate hides the crack vials to gain favor with the Washington and Wall Street elites and take care of ourselves.

    Susanne Trimbath, Ph.D. is CEO and Chief Economist of STP Advisory Services. Dr. Trimbath’s credits include appearances on national television and radio programs and the Emmy® Award nominated Bloomberg report Phantom Shares. She appears in four documentaries on the financial crisis, including Stock Shock: the Rise of Sirius XM and Collapse of Wall Street Ethics and the newly released Wall Street Conspiracy. Dr. Trimbath was formerly Senior Research Economist at the Milken Institute. She served as Senior Advisor on United States Agency for International Development capital markets projects in Russia, Romania and Ukraine. Dr. Trimbath teaches graduate and undergraduate finance and economics.

    Lead photo: Marion Barry smoking crack, screenshot from FBI surveillance video footage in 1990 via Wikipedia Commons.

  • The Swaps of Damocles

    "Privileged people don’t march and protest; their world is safe and clean and governed by laws designed to keep them happy…." Michael Brock in John Grisham’s The Street Lawyer (Doubleday, 1998).

    "There can be nothing happy for the person over whom some fear always looms…” Cicero, Tusculan Disputations 5.62, via Wikipedia.com

    If you were fearful after Wall Street decimated your life-savings in September 2008 then you should know that the sword of Damocles remains above your head.

    Absolutely nothing of any significance has changed. Not rules, laws or regulations. Not government oversight or external auditing. Nothing. What happened to our financial well-being in the Fall of 2008 can happen again tomorrow. If anything is being done, it is being expertly designed to make things worse for Main Street and better for Wall Street. When the tech bubble burst in March 2000, the Federal Reserve dropped dollar bills from helicopters and inflated the housing market. At least that time around, it was obvious where the next bubble would come. In an effort to hide the inflation this time around, the Fed is pumping money into dark corners of finance where it will eventually impact everything everywhere.

    First, a quick recap: During 2007, mortgage-backed bonds began failing faster than actual mortgages. Wall Street wrote bonds faster than Main Street needed mortgages – two bankruptcy judges estimated that one-third of the bonds didn’t have mortgages backing them.

    Meanwhile, insurance companies like AIG were writing credit default swaps even faster – some say there were as many as 15 swaps for every bond (by value). In 2008, AIG was unable to pay off on the credit default swaps (like insurance contracts) they wrote for the Wall Street bankers. The bankers had named themselves beneficiaries and they began cashing in – again – when the whole thing went up in flames.

    Then-Secretary of the Treasury Hank Paulson went to Congress and said the world would end if taxpayers did not give him $750 billion to bailout the banks. Congress said, “Sure, why not, you seem like a nice guy” and the Wall Street Bailout was signed into law by George W. Bush on October 1, 2008. In the months that followed, we learned that the Federal Reserve topped off the Wall Street tanks with trillions more dollars – a lot of which went to foreigners and private companies not under their regulatory purview. Since then, Federal Reserve Chairman Ben Bernanke has been dropping dollar bills out of helicopters by buying more and more mortgage un-backed bonds from Wall Street because – well, no one is quite sure why he is doing this.

    Eventually, Senator Chris Dodd (D-CT) and Representative Barney Frank (D-MA) got their names attached to a new public law, which President Obama signed on July 21, 2010 – about two years after the bailout – that was supposed to reform Wall Street and protect Consumers. Five months after the signing, Sen. Dodd announced his retirement (not long after it was made public that he and several Senators received very friendly terms on a mortgage from sub-prime mortgage bond King Angelo Mozilo of Countrywide). Rep. Frank will not seek reelection in November 2012. Neither Dodd nor Frank planned to be around when the bill is actually effective. You see, a lot of Dodd-Frank was only to require that someone else do studies, write reports and propose rules. Less than half of the rules were required to be written before Rep. Frank leaves office – Dodd left office before any action was required under the public law with his name on it.

    Both Dodd and Frank are retiring with full pensions, but the same cannot be said about the public law with their names on it. As of September 21, 2012, about as many Dodd-Frank rules have been proposed as there are mortgages backing those mortgage-bonds the Fed is buying. According to a review by New York law firm Davis Polk (as of September 4, 2012):

    • Of the 398 total Dodd-Frank rulemaking requirements:
      • 131 (32.9%) have final rules
      • 135 (33.9%) have proposed rules
      • 132 (33.2%) have not yet been proposed
    • Of the 247 rulemaking deadlines that have passed:
      • 145 (61.2%) have been missed
      • 31 (13%) have not even had proposals
        Source: http://regreformtracker.aba.com

    So far as I was concerned, the only actual success of Dodd-Frank came from an amendment which required the Federal Reserve to disclose exactly to whom they gave the bailout money  – information on 21,000 transactions valued at $16 trillion that Fox News, Bloomberg and Rolling Stone Magazine sued to get after the Chairman and Vice Chairman of the Fed refused to reply to questions from Congress. Turns out the Fed officials went from sins of omission to sins of commission – Bloomberg reported in December that they hid billions of dollars in loans from the mandated reports. Despite now knowing that the Federal Reserve is giving money to unregulated companies with no means of retrieving it, the U.S. public – outside of a faithful few Occupy Wall Street protestors still out there – have failed to notice or react. Hence, nothing has changed that would prevent a repeat of the events that precipitated the 2008 bailouts from occurring again tomorrow.

    “But wait! That’s not all!” as they say in late-night TV infomercials. More than ignoring the law, more than delaying the reforms, Wall Street is now actively working to get new laws written to exempt themselves from Dodd-Frank – which, we thought, was specifically written to reform their activities. On September 19, H.R. 2827 was passed by Congress to exempt from any Dodd–Frank rulemaking the very activity that is bankrupting some US cities and states and counties.

    The law they are now exempted from is the one that would require them to accept legal responsibility for putting the best interests of the municipalities and taxpayers first – a blanket requirement for fiduciary duty that already exists but is consistently ignored by the “survivors of Wall Street survivors of the financial crisis” as they are called by William D. Cohan, author of the New York Times bestseller House of Cards: A Tale of Hubris and Wretched Excess on Wall Street. Cohan emphasizes that bribing clients like Jefferson County is not new – although it seems evident that the problem may be more wide spread now than ever before in US history. Jefferson County (AL) may be the best known – bankruptcy followed on the heels of bribes and billions of dollars worth of toxic swap deals. The Wall Street banks not only bribe officials to commit municipal taxpayers to financial obligations they can never repay, they also pay competing banks so they can charge higher fees and interest rates. This breaches the simple trust you are entitled to expect even from used car salesmen (in states with “Lemon Laws”) – but no such protection is afforded anyone who has to deal with Wall Street.

    In the end, we are all required to deal with Wall Street. This is a danger more real, and more imminent, than anything the world may ever have faced. It is as if we have been told that an asteroid the size of Texas is barreling toward Earth and Ben Bernanke hit the button that launched the nuke — that missed. It’s still coming. Wall Street remains unreformed and consumers of financial services remain unprotected.

    Susanne Trimbath, Ph.D. is CEO and Chief Economist of STP Advisory Services. Dr. Trimbath’s credits include appearances on national television and radio programs and the Emmy® Award nominated Bloomberg report Phantom Shares. She appears in four documentaries on the financial crisis, including Stock Shock: the Rise of Sirius XM and Collapse of Wall Street Ethics and the newly released Wall Street Conspiracy. Dr. Trimbath was formerly Senior Research Economist at the Milken Institute. She served as Senior Advisor on United States Agency for International Development capital markets projects in Russia, Romania and Ukraine. Dr. Trimbath teaches graduate and undergraduate finance and economics.

  • The State of Economy in the Swing States

    I was living in Pennsylvania, voting in my second presidential election when my mom asked me that question in the months leading up to Ronald Reagan’s defeat of Jimmy Carter: “Are you better off today than you were four years ago?” Four-year-ago comparisons are tricky when the worst financial collapse in my lifetime occurred four years ago. Comparing the swing states not to their conditions four years ago, but how they might feel compared to the rest of the nation, Virginia, Colorado and New Hampshire appear to be “better off” than the average American. But in North Carolina, Florida and Pennsylvania, prices for the basic necessities are above the national average while median incomes are lagging. If consumer confidence translates into voter confidence, then the elections in some of the key swing states will belong to the Republicans in 2012.

    Conditions as Percent of National Averages

    Contested State

    Dozen Eggs

    Gasoline

    Utilities

    Income

    Unemployment

    NC

    110%

    100%

    100%

    85%

    116%

    FL

    114%

    101%

    126%

    85%

    106%

    PA

    117%

    101%

    97%

    98%

    95%

    CO

    103%

    97%

    84%

    118%

    100%

    NV

    90%

    104%

    54%

    105%

    145%

    VA

    101%

    99%

    96%

    121%

    71%

    NH

    78%

    95%

    87%

    131%

    65%

    OH

    78%

    97%

    126%

    92%

    87%

    WI

    69%

    108%

    89%

    101%

    88%

    IA

    61%

    80%

    94%

    100%

    64%

    Prices for eggs, gasoline and utilities from www.numbeo.com. Unemployment rates from www.bea.gov. Median income from www.census.gov. Percent of national average calculated by author.  Contested states from www.brookings.edu.

    A presidential election year may be a bumper season for political professionals, but it’s also a time of worry for voters. In the months leading up to the 2000 election, we were wondering how long we could ride the upside of prosperity while the Federal Reserve was busy raising interest rates designed to keep inflation in check. Eighteen months before the 2004 election, tax cuts were battling with the cost of the Iraq war in the federal budget, unemployment was up and consumer confidence was at a 10-year low with stocks headed for their third straight annual decline. A Republican – in fact the same Republican – became president both times.

    Eighteen months before the 2008 election, the overall economy was very mixed according to a Federal Reserve Board report based on data collected from their twelve district banks. Economic activity through the summer was slowing down in five regions, while the other seven reported relatively steady – though not really growing – economic activity. That summer, with the election looming, most people were worried about inflation.

    Discussions of labor shortages showed up in the Federal Reserve reports before the 2008 election from some of the swing states –  states with a large number of unaffiliated voters-like Ohio (shortages in truck drivers), Wisconsin and Iowa (shortages in skilled manufacturing workers and engineers). Pennsylvania reported tight labor markets for both skilled and unskilled workers, suggesting that wages would rise in 2009 while prices were expected to hold steady – a sure way for consumers to feel prosperous. The onset of the financial crisis in September turned all that into a fantasy.

    The party that controlled the White House during the collapse got the blame – Democrats retained the control over the House of Representatives that they won in 2006, no incumbent Democratic senators lost their seats and a Democrat was elected to the White House in 2008. In the 2010 mid-term elections, Democrats retained control over the Senate despite the largest gains by the Republican Party since 1994, yet lost their majority in the House of Representatives. The House has constitutional responsibility for federal spending; a federal budget has not passed on time (meaning there were no threatened shut-downs of the federal government) since 2007. Neither Democrats nor Republicans in the House are doing the job we pay them for – hence, their current new-record-low well-deserved 12% approval.

    This time around, Wall Street has all of the Washington Democrats cheering for a rally. New Geography reader NellyHills put it succinctly (08/26/2012 comment on The Next Public Debt Crisis Has Arrived): “Unfortunately at this point we have 2 choices which are both bad: Continue to believe live with the inflation…, or, Pop the bubble and all suffer through a 10 to 20 year depression. Either way, the middle class loses.” Regular New Geograpphy readers know that having a choice of candidates does not always mean having a good choice. But presidential elections are not won at the national level – they are won in the states, thanks to the Electoral College process of assigning votes. Jobs are a subject every voter understands: Either you have one or you don’t. Again, some of the swing states are really not feeling it while a few – notably Iowa, New Hampshire and Virginia – are doing better than the rest of the nation.

    Contested State

    Unemployment as percent of national rate

    NV

    145%

    NC

    116%

    FL

    106%

    CO

    100%

    PA

    95%

    WI

    88%

    OH

    87%

    VA

    71%

    NH

    65%

    IA

    64%

    Unemployment rates from www.bea.gov. Percent of national average calculated by author.  Contested states from www.brookings.edu.

    Reviewing more recent Federal Reserve Board reports, it is clear that the uncertainty about U.S. fiscal policy and weak demand from consumers are being blamed for the conservative approach to hiring by most employers.

    District

    Contested States

    Jobs

    Wages

    Atlanta

    FL

    Flat to up slightly except in discount retailers where hiring is up significantly

    Positive growth, especially for highly skilled*

    Boston

    NH

    Mostly flat, but without layoffs

    (No comment provided)

    Chicago

    IA, WI

    Flat to up slightly

    Flat except for highly skilled*

    Cleveland

    OH + Pgh PA

    Little hiring except highly skilled

    Flat

    Philadelphia

    PA Ex Pgh

    Up slightly

    Steady to falling

    Kansas City

    CO

    Flat

    Flat except for highly skilled*

    Richmond

    VA, NC

    Temp-to-permanent transitions rising though demand for labor continues to weaken except in highly skilled

    Some widespread gains in wages.

    San Francisco

    NV

    High unemployment and tepid hiring except in highly skilled

    Limited upward pressure (mainly from cost of benefits)

    *Highly skilled workers include information technology, health care, transportation and some profession services, plus certain manufacturing jobs. Source: Federal Reserve Board Beige Book, July 2012

    Once voters have a source of income, the next concern has to be prices — Reagan’s exact words were “Is it easier for you to go and buy things in the store?” Despite lower input prices, consumer product prices are creeping higher across most of the nation.

    District

    Contested States

    Input Prices

    Consumer Prices

    Atlanta

    FL

    Lower energy prices, slightly higher input prices with expectation of future decline

    Higher (based on increased sales in discount stores).

    Boston

    NH

    Steady, but sluggish production

    Steady to slightly higher

    Chicago

    IA, WI

    Lower energy prices, lower retail and wholesale prices for cotton, lower steel and scrap metal prices.

    Food prices expected to rise as crop production deteriorates. Weak response to “sale” promotions.

    Cleveland

    OH + Pgh PA

    Steel and scrap metal price rises easing, some off-shore labor costs rising

    Steady

    Kansas City

    CO

    Steel and scrap metal price rises easing, increases in the cost of building supply materials

    Steady

    Philadelphia

    PA Ex Pgh

    Increases in the cost of building supply materials; otherwise, falling prices.

    Generally falling price levels. Limited ability to pass price increases to homebuyers.

    Richmond

    VA, NC

    Lower prices for cotton to retailers and manufacturers, increases in the cost of building supply materials

    Price increases passed on to homebuyers

    San Francisco

    NV

    Declining prices for raw materials and energy

    Upward pressure easing somewhat

    Source: Federal Reserve Board Beige Book, July 2012

    Back in 2000, Alan Greenspan’s Federal Reserve raised interest rates one time too many, Al Gore won the popular vote, George Bush became president and by March of 2001 we were in recession. In 2008, Bernanke considered making changes to the Fed’s policy to stop all the guessing and swooning that the markets do over Federal Reserve interest-rate changes by making a target known. Credit markets froze solid, Wall Street got bailed out in September, Barack Obama was elected in November. The Wall Street Reform Act passed in 2009 has yet to be enacted in any significant way. Changes in monetary policy – along with double-dip recessions and other economic problems overseas – have so far offset any predicted decline in the dollar that would result in measurable inflation. But that doesn’t matter if you are in Pennsylvania, Florida or North Carolina and struggling to put a roof over your head and food on the table.

    Susanne Trimbath, Ph.D. is CEO and Chief Economist of STP Advisory Services. Dr. Trimbath’s credits include appearances on national television and radio programs and the Emmy® Award nominated Bloomberg report Phantom Shares. She appears in four documentaries on the financial crisis, including Stock Shock: the Rise of Sirius XM and Collapse of Wall Street Ethics and the newly released Wall Street Conspiracy. Dr. Trimbath was formerly Senior Research Economist at the Milken Institute. She served as Senior Advisor on United States Agency for International Development capital markets projects in Russia, Romania and Ukraine. Dr. Trimbath teaches graduate and undergraduate finance and economics.

    States map image by Bigstock.

  • Enjoying the Kool-Aid in Omaha

    I left Santa Monica for Omaha less than 3 months before the collapse of the global financial infrastructure in September 2008. The impending problems in housing and credit markets – obvious from early 2007 and exacerbated by the pile-on effect of derivatives gone wild – were increasingly in the bank of my mind. I made the decision to leave the dense urban population center of southern California and head to a place where —as recently described in an episode of The Walking Dead – there is a small population and lots of guns. I figured if the world was going to fall apart (something short of being over-run by zombies but worse than a minor recession) I’d rather not be sitting with my back to the ocean and no boat.

    Omaha has turned out to be blessed. The farm economy is strong. It is home to 5 of the Fortune 500: ConAgra, Berkshire Hathaway, Union Pacific, Peter Kiewit Sons’ and Mutual of Omaha Insurance all call Omaha home. Best of all, Omaha is home to Warren Buffett – the Oracle of Omaha and financial genius of Wall Street, one of the world’s richest men, head of legendary Berkshire Hathaway and, best of all for me, patron of the arts, humanities, community and politics in Nebraska.

    We all hail Uncle Warren’s beneficence but we may not want to look too closely at where the money comes from – like the 15 percent return he’s earning on the $5 billion investment he made in Goldman Sachs the week before they got a $10 billion bailout; or the fact that Berkshire Hathaway was the largest shareholder in American Express Co. when they received $3.4 billion from Uncle Sam. Nebraska may be a red state but Buffett has chosen Democrats, like retiring Senator Ben Nelson, to service his economic agenda. According to data from the Federal Election Commission, Uncle Buffett’s political contributions go almost exclusively to Democrats. I could write a whole story just on what Ben Nelson has done for Nebraska, but to conserve space, let me just say “Cornhusker Kickback” – you get the picture. We have more roads, bridges, and military contractors than can likely be required in a state with a population of 2 million – about the same as the population of Manhattan. This in a place where rush hour means there is a car in front of you and you can see more than 12 cars on either side of the road – compare that to Los Angeles (see photos above). The one electoral vote from Nebraska that went to Obama in 2008 is the one that includes Uncle Buffett’s house.

    Author Peter Schweizer (Reason March 2012) describes Buffett using a “bootleggers and Baptists” comparison that’s too close to Immanuel Kant’s “Private vice, public virtue” dichotomy to be accurate. I think Uncle Buffett is much more open about his vices. He does his good works in public but clearly   publically influences his politicians. Buffett made that $5 billion investment in Goldman Sachs on September 23, 2008 – a week before Senator Nelson voted “aye” on the bailout that greatly enhanced Goldman’s value and protected it from the massive losses which would have resulted from the need to raise capital by liquidating assets at collapsing market prices. The Wall Street Bailout not only gave Goldman Sachs an infusion of capital but it also covered the credit default swap payments that Goldman Sachs demanded from American International Group (AIG) as it was going into bankruptcy.  Goldman’s share of the AIG bailout was $2.5 billion in credit default swap payments, plus $5.6 billion in payments from the Federal Reserve Bank of New York and another $4.8 billion as “vig” for lending securities to AIG. That’s enough to cover the dividend payments to Buffett for 14 years with enough left over to pay back the principle. Ten percent rate of return with zero risk – not the risk/reward tradeoff I learned about in college.

    Most Omaha residents know Buffett’s political savvy and appreciate his understated style. Ben Nelson does. He bragged at a Chamber of Commerce meeting that he took advice from Warren before he voted for the Wall Street Bailout. He completely ignored the irony: a Senator asks a banker for advice on a bank bailout, the banker encourages the senator to payout $750 billion of taxpayer money to banks. This is something much less benign than drinkin’ likker on Saturday night and singin’ in the choir on Sunday morning.

    Ben Nelson is among the members of congress who invested in shares of Berkshire Hathaway before passing the Bailout that Benefited Buffett – a move that would probably have gotten them fired from Berkshire Hathaway. The very fact that Buffett was reported as saying something so banal as “I’d never be so brave as to try to influence congress” is all you need to hear to know that he’s not telling the truth. According the Congressional testimony of former- Special Inspector General for the Troubled Asset Relief Program (SigTARP) Neil Barofsky, and a report from the Government Accountability Office, the TARP bailout program was rigged. Firms with “political connections,” were more likely to get TARP funds. This was reported to Congress at hearings and reported here in 2009:

    “Treasury, the New York Federal Reserve and even Presidential Economic Advisor Larry Summers may be passing information to their friends that can be used for financial gain, giving positions in bailout programs to business associates, and engaging in ‘too cordial relationships’ with bailout recipients.”

    We may object to Warren Buffet’s manipulations on moral ground but residents of Omaha and Nebraska get to enjoy his largess. The procession of bailouts is anathema to many here. Uncle Buffett may live halfway from Wall Street but he is an insider in the classic sense. His huge bets on municipal bonds mean he needs to work to keep cities and counties from bankruptcy. In March 2008, just months after credit markets began to seize up, Buffett told CNBC he had “written 206 transactions in the last three weeks” which were default swaps on municipal bonds – the financing used by cities, counties and states to fund everything from building schools to running services. Since that means Buffett will have to payout if the municipalities experience “credit events” (like missing bond payments), he has the incentive to push for another bailout. The virtue? The bailout will also benefit the millions of people who live and work in places like Detroit, Illinois, and Jefferson County, Alabama. The vice? He controls enough bank stock to have managed a refinance for those municipalities without siphoning off significant premiums for profit. Buffett is willing to pay to get a government that caters to profligate cities and offers bailouts to companies in his industry, too. Buffett hosts a fundraiser for Obama’s political campaign and Obama names a tax-reform after Buffett – one hand washes the other, all done in the bright sunshine of Sunday morning.

    There is no denying that Buffett is smart with his money. In the same way, it would be foolish to suggest that he does this for some personal gratification instead of for profit. His long-hailed strategy of “value investing” has now gone by the wayside in favor of a strategy that can only be described as “grab the profit while you can but don’t stray too far from the government teat.”  When the music stops Uncle Buffett will get bailed out, again, by his good friend Uncle Sam.

    So I’m not disagreeing with the point being made by Shweitzer and others that “America’s favorite billionaire plays politics to make money.” I’m not even disagreeing that this is bad for America. In fact, I side with Nebraska’s Republican Governor Dave Heineman when it comes to the doings of Buffett and Nelson: If it’s bad for America in the short run, it can’t be good for Nebraska long term. I don’t agree with what Buffett and Nelson have been doing for Nebraska but I am enjoying the benefits. And maybe that’s your answer – move into their neighborhoods, enjoy the protection, but whatever you do – don’t drink the Kool-Aid.*

    *Wikipedia cites a reporter from the Washington Post who wrote about seeing “’packets of unopened Flavor Aid’ scattered in the dust in Guyana….”, not actual Kool-Aid. (Source: Krause, Charles A. (Dec. 17, 1978). "Jonestown Is an Eerie Ghost Town Now.") As an aside, Kool-Aid was invented in the 1920s by a Nebraska mail-order entrepreneur.

    Susanne Trimbath, Ph.D. is CEO and Chief Economist of STP Advisory Services. Dr. Trimbath’s credits include appearances on national television and radio programs and the Emmy® Award nominated Bloomberg report Phantom Shares. She appears in four documentaries on the financial crisis, including Stock Shock: the Rise of Sirius XM and Collapse of Wall Street Ethics and the newly released Wall Street Conspiracy. Dr. Trimbath was formerly Senior Research Economist at the Milken Institute. She served as Senior Advisor on United States Agency for International Development capital markets projects in Russia, Romania and Ukraine. Dr. Trimbath teaches graduate and undergraduate finance and economics.

    Lead Photo: 7:15pm May 21, 2011, Santa Monica Freeway, Eastbound © STP Advisory Services, LLC

  • The Next Public Debt Crisis Has Arrived

    In July of 2009, while the smoke from the global financial bonfire was still thick in the air, I wrote for this website about another crisis of massive proportions just looming on the horizon: the Global Crisis in Public Debt.

    Three years later, the news of defaults, bankruptcies, debt forgiveness requests, receiverships, and bailouts are in the news every day. Across the globe, sovereign entities – from US cities to European nations – are suffering under staggering debt loads, decimated revenues and intense pressure from the very capital markets that they should be able to turn to for refuge. Last month, Jefferson County, the largest in Alabama, moved forward with their bankruptcy proceedings over the objections of the Wall Street banks. Suffolk County in New York declared a financial emergency. The Financial Times has an interactive map showing all but 12 U.S. states with budget shortfalls for 2012. Eleven U.S. cities, counties and villages have filed bankruptcy since 2008, plus 21 municipal non-government entities (e.g., utilities, hospitals, schools, etc.), according to the Pew Center on the States.

    This crisis for cities, states and nations, like so many other financial crises, has its root in the free flow of credit that existed during the preceding economic boom years. The market prices of assets rose steadily. Rising valuations, especially based on improving revenues from robust economic activity, led to rising income streams for governments. This encouraged governments to borrow more, perhaps often to expand services – and the bureaucracy required to deliver them – and sometimes to improve infrastructure and make capital investments.

    At the same time, rising market prices for financial assets encouraged more savers and investors into the market. In the US, the flow of cash to Wall Street was further encouraged by favorable tax treatment for the earnings on retirement savings and municipal bonds. The steady influx of new money produced an increasing supply of investable funds, which drove demand for sovereign and municipal debt (in addition to the mortgage-backed securities).

    This process was driven more by the financial services industry than the real economy. As of March 5, 2012, the Federal Reserve Bank of New York reported more than $5,000,000,000,000 ($5 trillion) in overnight securities financing – that’s money that makes money but nothing else – that’s more than 20% of US GDP sitting around, not creating jobs, not building infrastructure, just sitting. Since the investment of securities financing is virtually all done electronically, it creates very few jobs. What it does produce is a boost in revenues for bankers – which they can translate into often lavish bonuses.

    The financial sector also adds to its profits from issuance fees, trading fees, underwriting fees, etc. Then there’s “Market Risk Trading,” a euphemism for letting anyone buy a contract to gamble on the probability that Greece won’t be able to repay their debt or that you will miss a mortgage payment. Anyone can buy that contract, even the arsonist next door who has a say in whether or not Greece gets access to capital. In the end it is the borrowers who will suffer the consequences because they will be unable to refinance their debt and the gamblers who will win by withholding financing in anticipation of the insurance payout.

    At the end of June 2009, only Italy, Turkey and Brazil were covered by more credit default swap contracts than JP Morgan Chase and Bank of America.   Goldman Sachs, Morgan Stanley, and Wells Fargo Bank all had more credit derivate coverage than the Philippines.   

    Entered the Top 1,000 for credit default swaps after 2009

    Reference Entity

    Debt as %GDP

    CDS* as %Debt

    Australia

    30.3%

    11.2%

    New Jersey

    7.8%

    11.2%

    New Zealand

    33.7%

    8.6%

    Illinois

    6.8%

    8.2%

    Texas

    3.4%

    6.6%

    Kingdom of Saudi Arabia

    9.4%

    3.8%

    Lebanese Republic

    137.1%

    2.4%

    Arab Republic of Egypt

    85.7%

    1.0%

    *CDS are credit default swaps, financial contracts that pay off if the named (reference) entity experiences a credit event like a ratings downgrade or a missed payment.
    [Abu Dhabi also appears in the 2012 list of the top 1,000 entities named in credit default swaps at DTCC, but debt and GDP data are not available.]

    What was a potential default problem in 2009 has become reality in 2012. In 2009, gross credit default swaps outstanding for the debt of Iceland were equal to 66 percent of GDP, and around 18 percent for Portugal. As these countries struggle with their debt, the global banks – primarily the US banks – sell credit derivatives and stand to collect enormous payments – whether or not the defaulting countries receive any support or bailouts from international donor organizations. The reason is that most credit derivatives contracts pay out on “credit events.” A “credit event” can be something as simple as a downgrade from Moody’s or Standard and Poor’s – whose managers testified before Congress that credit rating changes can be bought. Standard & Poor’s executives admitted in 2008 that they were being forced to relax rating requirements to improve revenues. If, for example, $69 billion worth of credit derivative payoffs are available on a Greek default then how much could the owner of a credit swap afford to pay for a rating change?

    The absurdity of rating Egypt more credit worthy than Australia is only part of the story. The sad fact is that Wall Street banks can sell more credit risk protection than there is credit risk. If all the public debt of a country is $1 billion, it means that country has borrowed $1 billion in public capital markets.  But   Wall Street banks are buying and selling more credit risk insurance than there is credit risk. This is the same problem I wrote about in 2008 that we saw in the Treasury bond market – when you sell more bonds than exist these trades are called “naked” sales or “phantoms”. A similar problem in stocks contributed to the 2008 crash.

    There are more cities, counties, states and nations in financial trouble   According to the Bank for International Settlements, there were $615 trillion in Over-The-Counter (OTC) derivatives contracts outstanding worldwide at the end of 2009. That’s about 9 times global GDP.  In other words, the entire world would have to work for 9 year just to produce enough to pay off the derivatives – before we had a dime left over to pay off the original debts.

    In this environment, the sovereign debt crises may produce something scarier than anything we have experienced in the past. The use of credit derivate products has increased the chance of a default turning into a global catastrophe. It won’t be enough to pay off the debt owed by one of these sovereigns. That payoff will be magnified by the value of the credit derivatives. These derivatives will have a multiplier effect on every sovereign debt default or “credit event.” The table at the end of this article only includes the credit derivatives warehoused with the Depository Trust and Clearing Corporation in the US – there is no source of information on the real magnitude.

    A crisis in sovereign debt would cause problems not just within those nations, states or cities but also for the global financial institutions who sell default protection through the credit derivatives markets. The bankruptcy of Jefferson County (AL) threatens to take down muni-bond insurer Syncora Guarantee (who, by the way, is suing JPMorgan Chase over losses in mortgage-backed securities saying that JPMorgan Chase misrepresented the loans to obtain the insurance). Another such institution was Ambac Financial Group, Inc., which I described in an article published here months before the original prediction of the global crisis in public debt. Ambac – like Berkshire Hathaway – was in the business of guaranteeing the payments of public debt (and mortgage backed securities). Ambac filed for bankruptcy in November 2010.  With Ambac gone, Berkshire is next in line to pay because of Warren Buffett’s credit default swaps.

    Policy makers have had few options available across the globe to combat this crisis. The European Union Commission is attempting to control the amount of credit insurance being sold by limiting the sale of “naked” credit default swaps.  A proposal was approved by the European Parliament on November 15, 2011 to restrict the sale of credit insurance to any buyer who “does not have ownership of the underlying government debt.”    The limited regulation passed by the EU Parliament allows the sale if the buyer has ownership in something vaguely related to the sovereign debt – like allowing the purchase of swaps on Italian government debt if the buyer owns shares of an Italian bank. French President Sarkozy said in January that he would propose “special levies on naked credit default swaps.”  The imposition of fines or taxes (levies) has not eliminated similar activity in stock and bond markets in the US, though it is at least a start which is more than US regulators have done.

    Meanwhile, Federal Reserve Chairman Ben Bernanke and Treasury Secretary Timothy Geithner continue to load the helicopter with dollar bills to finance the payouts with freshly-minted U.S. dollars. They sell us the fantasy of free-market capitalism while laying down a labyrinth of financial rules and regulations allowing a dozen or so politically connected banks to reap the rewards while avoiding the risk of failing, US financial institutions have been placing losing bets through unregulated derivatives markets only to be bailed out as “systemically important” – a euphemism for “too politically connected to fail.” The rest of the world is taking steps to stop the damage. When will the US government step up to the plate?

    Sovereigns named in most credit default protection*
    2009 2012 2009 2012
    Sovereign Entity Debt % GDP Debt % GDP CDS % Debt CDS % Debt CDS change 2008 to 2012*** Region
    REPUBLIC OF ICELAND 23.0% 130.1% 315.2% 40.4% -2,322,155,904 Europe
    REPUBLIC OF ESTONIA 3.8% 5.8% 206.7% 193.4% 844,012,716 Europe
    UKRAINE 10.0% 44.8% 194.5% 28.9% -23,102,981,592 Europe
    REPUBLIC OF KAZAKHSTAN 9.1% 16.0% 144.0% 57.5% -3,440,253,859 Europe
    REPUBLIC OF BULGARIA 16.7% 17.5% 100.6% 112.5% 4,163,215,975 Europe
    REPUBLIC OF LATVIA 17.0% 44.8% 92.4% 62.3% 3,369,945,521 Europe
    BOLIVARIAN REPUBLIC OF VENEZUELA 17.4% 38.0% 80.7% 45.9% 5,646,959,440 Americas
    STATE OF QATAR 6.0% 8.9% 76.4% 55.4% 5,040,787,988 Europe
    RUSSIAN FEDERATION 6.8% 8.7% 72.7% 55.7% 4,966,368,803 Europe
    REPUBLIC OF TURKEY 37.1% 42.4% 56.1% 32.5% -43,726,859,566 Europe
    REPUBLIC OF LITHUANIA 11.9% 37.7% 42.7% 28.8% 3,438,691,822 Europe
    REPUBLIC OF PANAMA 46.4% 41.7% 36.7% 37.1% 989,207,525 Americas
    REPUBLIC OF THE PHILIPPINES 56.5% 49.4% 36.6% 28.8% -10,157,402,334 Asia Ex-Japan
    REPUBLIC OF PERU 24.1% 21.9% 34.1% 41.1% 7,324,285,482 Americas
    ROMANIA 14.1% 34.0% 31.2% 20.6% 6,566,917,982 Europe
    REPUBLIC OF CHILE 3.8% 9.4% 30.9% 21.2% 2,719,694,915 Americas
    IRELAND 31.5% 209.2% 28.2% 22.5% 27,767,560,886 Europe
    UNITED MEXICAN STATES 20.3% 37.5% 23.7% 20.2% 50,658,161,703 Americas
    REPUBLIC OF SLOVENIA 22.0% 45.5% 22.5% 23.0% 3,206,639,043 Europe
    REPUBLIC OF HUNGARY 73.8% 76.0% 21.6% 47.1% 37,403,179,311 Europe
    REPUBLIC OF SOUTH AFRICA 29.9% 35.6% 21.5% 24.6% 17,010,145,334 Europe
    ARGENTINE REPUBLIC 51.0% 42.9% 18.7% 17.2% -2,448,737,614 Americas
    FEDERATIVE REPUBLIC OF BRAZIL 40.7% 54.4% 18.2% 13.0% 14,703,918,548 Americas
    PORTUGUESE REPUBLIC 64.2% 72.1% 15.9% 25.2% 39,897,746,989 Europe
    REPUBLIC OF COLOMBIA 48.0% 45.6% 15.9% 14.9% 1,221,052,625 Americas
    SLOVAK REPUBLIC 35.0% 44.5% 12.8% 19.3% 5,533,166,393 Europe
    KINGDOM OF SPAIN 37.5% 68.2% 11.9% 16.9% 101,554,412,387 Europe
    REPUBLIC OF KOREA 32.7% 22.9% 11.8% 20.0% 22,088,912,724 Asia Ex-Japan
    REPUBLIC OF CROATIA 48.9% 60.5% 11.5% 19.9% 5,612,474,098 Europe
    HELLENIC REPUBLIC (Greece) 90.1% 165.4% 11.1% 13.6% 34,488,989,840 Europe
    REPUBLIC OF INDONESIA 30.1% 24.5% 11.0% 16.1% 13,723,880,843 Asia Ex-Japan
    MALAYSIA 42.7% 57.9% 9.7% 7.8% 4,044,633,137 Asia Ex-Japan
    KINGDOM OF DENMARK 21.8% 46.9% 9.3% 17.2% 12,665,229,924 Europe
    STATE OF FLORIDA 3.2% 17.9% 8.1% 16.8% 2,787,096,121 Americas
    REPUBLIC OF AUSTRIA 58.8% 103.3% 7.9% 21.3% 38,904,764,846 Europe
    REPUBLIC OF ITALY 103.7% 120.1% 7.9% 14.6% 171,818,588,038 Europe
    KINGDOM OF THAILAND 42.0% 45.6% 7.1% 6.5% 1,675,447,429 Asia Ex-Japan
    SOCIALIST REPUBLIC OF VIETNAM 38.6% 54.5% 6.4% 5.9% 3,717,696,305 Asia Ex-Japan
    CZECH REPUBLIC 29.4% 39.9% 6.0% 11.5% 7,793,110,452 Europe
    REPUBLIC OF POLAND 41.6% 56.7% 5.9% 9.7% 25,523,188,448 Europe
    REPUBLIC OF FINLAND 33.0% 49.0% 5.7% 17.3% 12,868,084,419 Europe
    THE CITY OF NEW YORK ** 7.5% 4.3% 8.4% 3,555,950,000 Americas
    STATE OF NEW YORK 4.2% 24.8% 4.3% 5.3% 1,215,398,707 Americas
    KINGDOM OF SWEDEN 36.5% 36.8% 4.1% 15.0% 15,665,446,384 Europe
    KINGDOM OF BELGIUM 80.8% 99.7% 3.9% 15.1% 49,607,728,521 Europe
    STATE OF ISRAEL 75.7% 74.0% 3.4% 7.0% 7,093,224,168 Europe
    STATE OF CALIFORNIA 3.9% 18.3% 3.2% 12.7% 8,068,160,000 Americas
    FEDERAL REPUBLIC OF GERMANY 62.6% 81.5% 2.1% 4.5% 75,770,481,300 Europe
    KINGDOM OF NORWAY 52.0% 48.4% 1.6% 6.3% 5,953,647,323 Europe
    KINGDOM OF THE NETHERLANDS 43.0% 64.4% 1.6% 5.3% 19,494,129,128 Europe
    PEOPLE’S REPUBLIC OF CHINA 15.7% 16.3% 1.5% 3.7% 49,294,027,432 Asia Ex-Japan
    FRENCH REPUBLIC 67.0% 85.5% 1.5% 6.8% 108,226,300,245 Europe
    UNITED KINGDOM OF GREAT BRITAIN
    & NORTHERN IRELAND
    47.2% 79.5% 1.2% 3.6% 51,470,774,560 Europe
    JAPAN 170.4% 208.2% 0.1% 0.8% 67,160,972,268 Japan
    UNITED STATES OF AMERICA 60.8% 69.4% 0.1% 0.2% 19,471,174,892 Americas
    *List from Depository Trust and Clearing Corporation. [www.dtcc.com] Dubai was also on this list, but debt and GDP data were not available.
    **2012 GDP for City of NY was calculated by subtracting all other MSA output from state GDP.
    *** Lower totals may indicate that some credit default swap contracts have been paid off.
    Countries in Italics had not failed to meet their debt repayment schedules before 2008 (Reinhart and Rogoff 2008); Thailand and Korea received IMF assistance to avoid default in the 1990s.


    Susanne Trimbath, Ph.D. is CEO and Chief Economist of STP Advisory Services. Dr. Trimbath’s credits include appearances on national television and radio programs and the Emmy® Award nominated Bloomberg report Phantom Shares. She appears in four documentaries on the financial crisis, including Stock Shock: the Rise of Sirius XM and Collapse of Wall Street Ethics and the newly released Wall Street Conspiracy. Dr. Trimbath was formerly Senior Research Economist at the Milken Institute. She served as Senior Advisor on United States Agency for International Development capital markets projects in Russia, Romania and Ukraine. Dr. Trimbath teaches graduate and undergraduate finance and economics.

    Treasury Department photo by BigStockPhoto.com.