Author: Wendell Cox

  • New Central Business District Employment and Transit Commuting Data

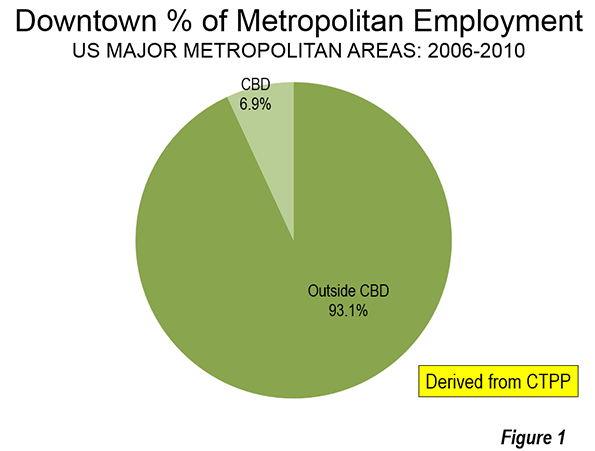
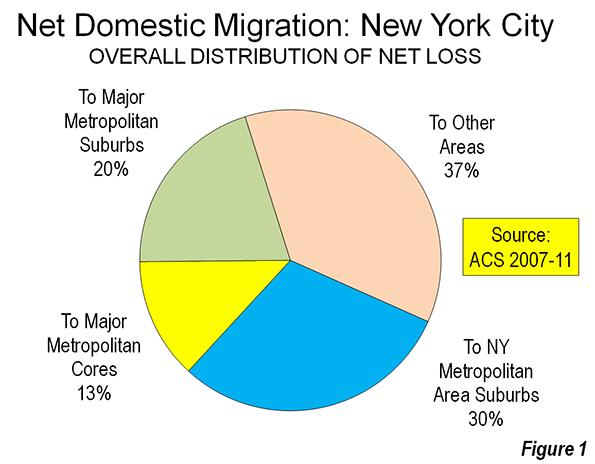
    Photographs of downtown skylines are often the "signature" of major metropolitan areas, as my former Amtrak Reform Council colleague and then Mayor of Milwaukee (later President and CEO of the Congress of New Urbanism) John Norquist has rightly said. The cluster of high rise office towers in the central business district (CBD) is often so spectacular – certainly compared with an edge city development or suburban strip center – as to give the impression of virtual dominance. I have often asked audiences to guess how much of a metropolitan area’s employment is in the CBD. Answers of 50 percent to 80 percent are not unusual. In fact, the average is 7 percent in the major metropolitan areas (over 1,000,000) and reaches its peak at only 22 percent in New York (Figure 1), which sports the second largest business district in the world (after Tokyo).

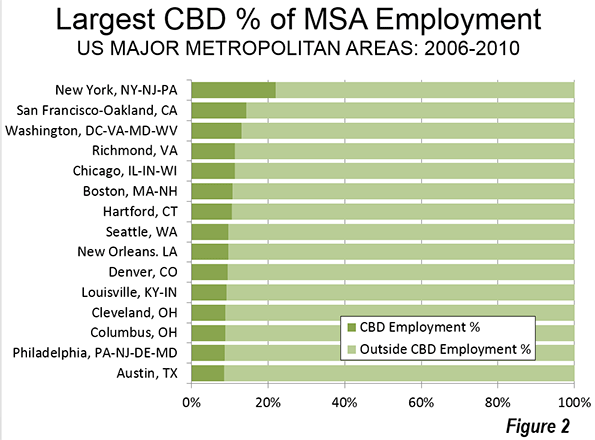
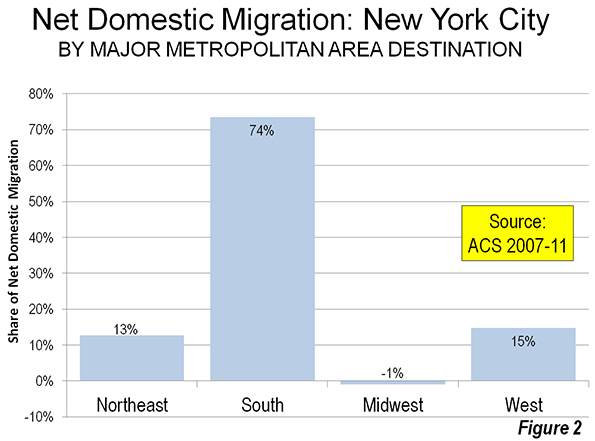
    Only seven of the 52 major metropolitan areas have CBDs with 10 percent or more of employment. Some are much lower. For example, Los Angeles and Dallas have had some of the nation’s tallest skyscrapers outside New York or Chicago for decades, yet these downtowns have only 2.4 percent and 2.3 percent of their metropolitan area employment respectively (Figure 2).

    This and similar information has been summarized in the third edition of Demographia Central Business Districts, which is based on the 2006-2010 Census Transportation Planning Package, a joint venture of the Census Bureau and the American Association of State Highway and Transportation Officials (AASHTO). The two previous editions of the report summarized data from the 1990 and 2000 censuses.

    The Declining Role of Downtown

    Downtowns have become far less important than before World War II, when a large share of American households did not have access to automobiles and when employment was far more concentrated than today. Indeed, the highly concentrated American downtown area is "unique," as Robert Fogelson indicates in Downtown: Its Rise and Fall: 1880-1950, and could be easily located as the destination of the "street railways." Downtown was a product of transit and remains transit’s principal destination today. The concentrated US style CBD form is really quite rare outside other new world nations, such as Canada, Australia, South Africa and New Zealand. Some, but only a few Asian cities have also followed the example, most notably Shanghai, Hong Kong, Nanjing, Chongqing, Singapore, and Seoul.

    The US, however, for all its role as originator of the downtown paradigm has also led the world in employment dispersion. This reflects the dominance in the US of automobiles. Dispersion is more amenable to mobility by the car, which dominates motorized mobility in virtually all major metropolitan areas of North America and Western Europe. This has led in the US to generally shorter work trip travel times and less traffic congestion, according to Tom Tom and Inrix. The continuing expansion of working at home could improve the situation even more.

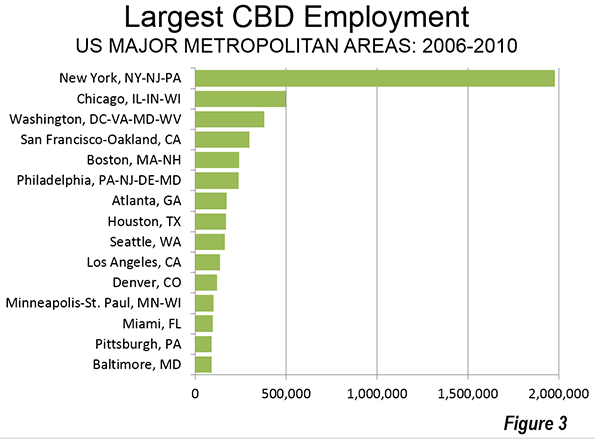
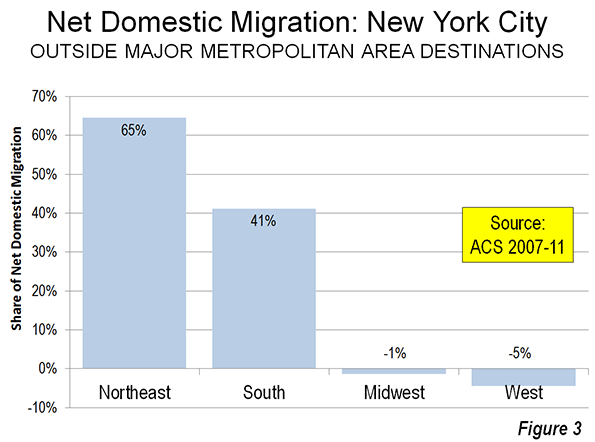
    New York has the largest CBD in the nation by far, with nearly 2,000,000 jobs. Chicago’s CBD (the Loop and North Michigan Avenue) has about one-quarter as many jobs (500,000) and Washington approximately 375,000. San Francisco, Boston and Philadelphia, also ranked among the nation’s transit "legacy cities," have between 200,000 and 300,000 jobs. Automobile oriented Houston and Atlanta are the largest otherwise, with Houston’s downtown being much more compact than Atlanta’s. Atlanta’s downtown has expanded strongly (and less densely) to the north and includes "Midtown" (Figure 3)

    Transit is About Downtown

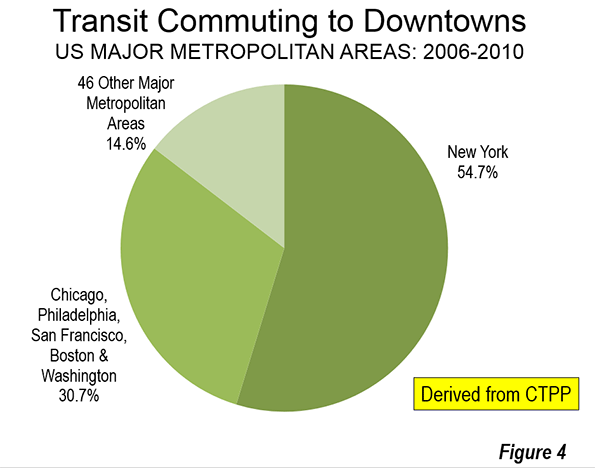
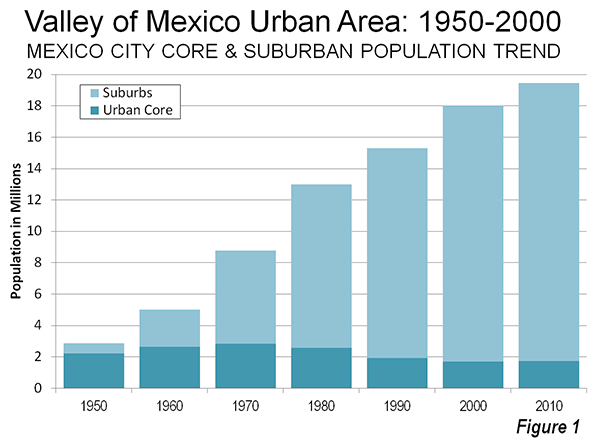
    Transit is about downtown. Approximately 55 percent of transit commuting in the United States is to jobs in just six municipalities (not to be confused with metropolitan areas), which I have called transit’s "legacy cities." Most of that commuting is to the six downtown areas. Of course, the city of New York is dominant, which alone accounts for 55 percent of the country’s CBD transit commuting (Figure 4), with much of the balance in the other five legacy cities (Figure 4). Only 14 percent of the CBD commuting is to the other 46 smaller downtowns.

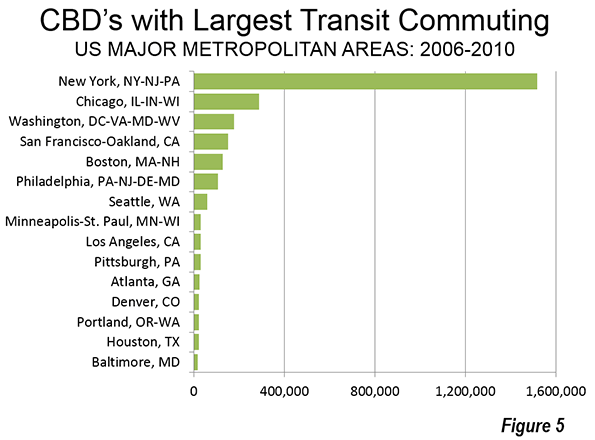
    More than 1.5 million transit commuters converge on jobs in Manhattan every day. In the other five legacy cities, the figure ranges from 100,000 to 300,000 daily. All of the other central business districts draw fewer than 100,000 daily commuters. Seattle ranks 7th, at 60,000, and has double or more the CBD transit commuters of any of the other 44 CBDs (Figure 5). 

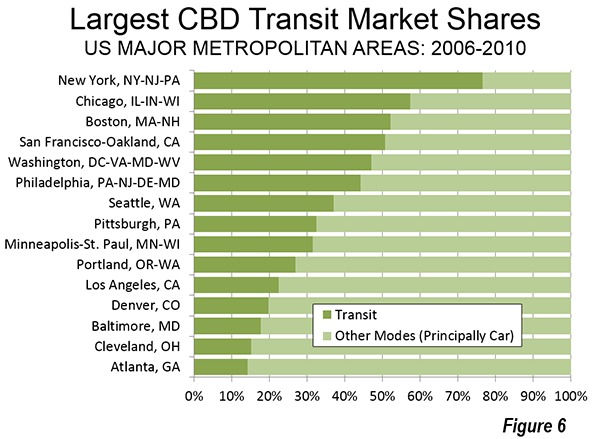
    New York has by far the highest transit commuting share of any downtown in the nation. Approximately 77 percent of people who work in the New York central business district commute by transit. The other legacy cities post impressive market shares as well, though well below those of New York. The CBDs in Chicago, Boston, and San Francisco draw between 50 percent and 60 percent of their commuters by transit. Downtown Philadelphia and Washington attract more than 40 percent of their commuters by transit (Figure 6).

    Transit is About Downtown II

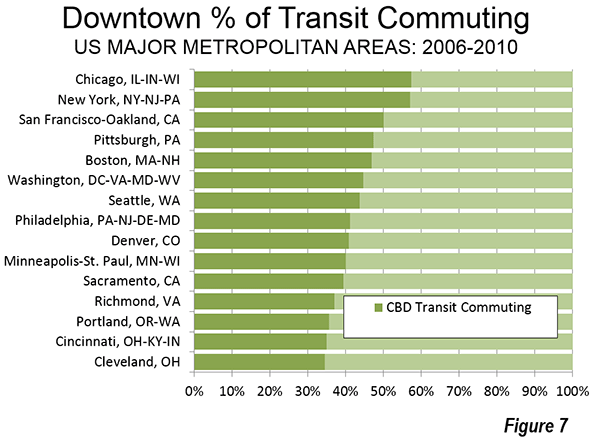
    The importance of downtown to transit is also indicated by its predominance in transit commuting destinations. In the New York metropolitan area, with a transit market share of approximately 30 percent, 57 percent of all transit commuting is to downtown jobs. Chicago’s transit commuting is concentrated in downtown to a slightly greater degree than in New York. One half of all the transit commuting in the San Francisco metropolitan area is to downtown. The CBDs of Boston, Philadelphia, and Washington account for between 40 percent and 50 percent of all transit commuting in their downtown areas. Seattle and Pittsburgh also are in this range (Figure 7). Seven of the eight metropolitan areas with the largest transit market shares have a CBD commuting dominance of 40 percent or more (Pittsburgh is the exception).

    The 52 major metropolitan area CBDs combined have less than five percent of the nation’s jobs. Elsewhere, downtowns and otherwise, the other 95 percent of American commuters use transit at only a three percent rate.

    Other Employment Centers

    In a new feature, Demographia Central Business Districts also provides data for selected employment centers other than the principal central business districts. These also include some surprises. For example, downtown Brooklyn, long since engulfed by the expansion of New York, has the second highest transit market share of any employment center identified other than New York, at 60 percent. Across the river, the Jersey City Waterfront area achieves a transit market share of more than 50 percent, greater than the downtowns of legacy cities Philadelphia and Washington.

    Data on supplemental employment center and corridor data is selected and therefore not representative. It is notable that some employment corridors and centers have employment totals that dwarf those of the principal downtown areas in their respective metropolitan areas, such as Los Angeles, Portland, Dallas, and Kansas City.

    With a few exceptions, the transit commuting shares for most of these selected centers and corridors is modest. Many are served by new rail systems, which are simply not up to the task of providing mobility to these dispersed centers. Nor can they provide the radial, high quality service that makes transit such a success in the six legacy city downtowns. For example, the Dallas light rail system provides service along virtually the entire US-75 corridor from north of downtown to Plano. Transit’s share of commutes in this corridor is only 2 percent, far below the downtown Dallas share of 14 percent and the legacy city downtown average of 65 percent.

    Wendell Cox is principal of Demographia, an international public policy and demographics firm. He is co-author of the "Demographia International Housing Affordability Survey" and author of "Demographia World Urban Areas" and "War on the Dream: How Anti-Sprawl Policy Threatens the Quality of Life." He was appointed to three terms on the Los Angeles County Transportation Commission, where he served with the leading city and county leadership as the only non-elected member. He was appointed to the Amtrak Reform Council to fill the unexpired term of Governor Christine Todd Whitman and has served as a visiting professor at the Conservatoire National des Arts et Metiers, a national university in Paris.

  • More Criticism of the Mythical Shift to Transit

    There has been additional attention to the exaggeration of transit ridership trends claimed by the American Public Transit Association. Writing in The Washington Post, David King of Columbia University. Michael Manville of Cornell University and Michael Smart of Rutgers University said that the "association’s numbers are deceptive" and that the "interpretation is wrong.” Noting their strong support of public transportation, King, Manville and Smart said that "misguided optimism about transit’s resurgence helps neither transit users nor the larger traveling public." They further say that "there is no national transit boom."

    They examine the data by metropolitan area and find that "transit use outside New York declined in absolute terms last year, and conclude that this "fact shows how crucial public transportation is to our largest city and how small a role it plays in most other Americans’ lives.

    Also see: No Fundamental Shift, Not Even a Shift.

  • No Fundamental Shift to Transit: Not Even a Shift

    The American Public Transportation Association (APTA) is out with news of higher transit ridership. APTA President and CEO Michael Melaniphy characterizes the new figures as indicating "a fundamental shift going on in the way we move about our communities.” Others even characterized the results as indicating "shifting consumer preferences." The data shows either view to be an exaggeration.

    1935 and 2013

    This is hardly a reliable time for making judgments about fundamental shifts or shifts in consumer preferences. Economic performance has been more abysmally abnormal only once in the last century –during the Great Depression – than at present.

    The last year, 2013, is the sixth year in a row that total employment, as reported by the Bureau of Labor Statistics was below the peak year of 2007 (Figure 1). This run of dismal job creation was exceeded only between the Great Depression years of 1929 and 1936 in the last 100 years (Note 1). From World War II until the Great Recession, the maximum number of years that employment fell below a previous peak was two, following the 9/11 terrorist attacks (2001 to 2003). The Great Recession may have ended, according to the National Bureau of Economic Research, but the Great Malaise continues as the economy is performing well below historic levels. Judgments about fundamental shifts and consumer choice today are not more reliable than they would have been in the Great Depression year of 1935.

    Transit’s Market Share: Stuck in Neutral

    But more importantly, there is no shift to transit.  APTA is right to point out that transit ridership has grown faster than vehicle travel in the United States since 1995. Nonetheless, transit’s share of urban travel has barely budged, because its 1995 share of travel was so small. This is indicated by Figure 2, which compares the overall market share of transit to that of cars and light trucks from 1995 to 2013. Indeed, the top of Figure 2 (the 100 percent line) is virtually indistinguishable from the personal vehicle share over the entire period. The bottom of the chart (the zero percent line) is virtually indistinguishable from the transit share. This is not the stuff of fundamental shift.

    Commuting: The Story is Not Transit

    A similar pattern of little or no change is indicated by the commuting (work access) data from the Census Bureau’s American Community Survey.

    Over the past five years, as with virtually all the years since such data has been collected, the overwhelming majority of new commuters have driven alone (Figure 3). Indeed, transit has not taken a single net automobile off the road since 1960, and not in the last five years. Between 2007 and 2012, 93 percent of the additional commuters drove alone (Note 2). The drive alone market, which might have been thought to be saturated, actually rose from 76.1 percent to a 76.3 percent market between 2007 and 2012.

    The biggest change has been the continuing loss in carpool use, which dropped from 10.4 percent to 9.7 percent from 2007 to 2012. It is estimated that nearly 450,000 passengers left carpools (excluding drivers), approximately 1.8 passengers for each additional commuter using transit (250,000).

    The largest gain from 2007 to 2012 was in working at home, including telecommuting. Working at home increased from 4.1 percent to 4.4 percent. In actual numbers, working at home added 1.9 times the increase in transit commuting. Its change in market share was greater than that of transit in 42 of the 52 major metropolitan areas. Surprisingly, this includes New York, with its incomparable transit system (by US standards).

    Transit’s share of commuting inched up only 0.1 percentage points between 2007 and 2012. This is so small that if this rate of annual increase were sustained for 50 years, transit’s commute market share would  edge up to only 6 percent (Figure 4), approximately transit’s 1980 market share (doubling to 10 percent would require 130 years). The latest data indicates both gains and losses for transit, with market shares up in 28 major metropolitan areas and down in 24.

    Transit Losses

    In Atlanta, with the nation’s second largest Metro (subway) system built since 1975, a declining overall employment base was accompanied by a loss of 13,000 transit commuters, at the same time that there was an increase in working at home of 19,000.

    In Portland, considered by many around the world to be an urban planning Utopia, the data is hardly favorable. Since 1980, the last year with data before the first of five light rail lines and one commuter rail line opened, transit’s market share has dropped from 8.4 percent to 6.0 percent. While spending billions of dollars on rail, working at home – which involves little or no public expenditure – increased by triple the number of people drawn to transit. And things have not changed materially, even during the claimed "fundamental shift." In the last five years, the working at home increase is more than double that of transit.

    In Los Angeles, ridership at the largest transit agency continues to languish below its 1985 peak, despite having opened 9 light rail, Metro, and rapid busway lines and adding more than 1.5 million residents. Even this decline may be under-stated because of how transit counts passengers. Each time someone steps on a transit vehicle, they are counted (as a boarding). A person who transfers between two or three buses to make a trip counts as two or three boardings, which is what the APTA data reports.

    When rail is added to a transit system, bus services are reconfigured to serve the rail system. This can mean many more boardings from transfers without more passenger trips. This potential inflation of ridership is likely to have occurred not only in Los Angeles, but in all metropolitan areas that added rail systems.

    Transit Gains

    At the same time, gains are being made in some metropolitan areas. Ridership has risen more strongly in transit’s six "legacy cities," the municipalities (not metropolitan areas) of New York, Chicago, Philadelphia, San Francisco, Boston, and Washington. Between 2007 and 2012, 68 percent of the additional transit commuting occurred to employment locations in these six municipalities. This is higher than the 55 percent of national transit commuting that these areas represented in 2012. The much larger share being attracted by these areas in the last 5 years is an indication that transit ridership, already highly concentrated in just a few places, is becoming even more concentrated.  Further, 50 percent to 75 percent of commuters to the corresponding six downtowns reach work by transit.

    Rational Consumer Behavior

    Even when the nation finally emerges from the Great Malaise, only vain hope will be able to conceive of a large scale consumer preference driven shift toward transit. The rational consumer will not choose transit that is slower or less convenient than the car. Where transit access is impractical or impossible, people will use cars. This is the case for most trips in all US metropolitan area, as the Brookings Institution research cited below indicates

    The Brookings Institution research indicated that the average employee in the nation’s major metropolitan areas are able to access fewer than 10 percent of jobs in 45 minutes. This is not only a small number of jobs, but it is a travel time that is approximately twice that of the average employee in the United States (most of whom travel by car).

    More funding for transit cannot solve this problem. The kind of automobile competitive transit system needed to provide rational consumer choice between cars and transit would require annual expenditures rivaling the total personal income in the metropolitan area, as Jean-Claude Ziv and I showed in our 2007 11th World Conference on Transport Research paper (2007). It is no wonder that not a single comprehensive automobile competitive transit system exists or has been seriously proposed in any major US or Western European metropolitan area (Note 3).  Transit is about the largest downtowns and the largest urban cores.

    Unbalanced Coverage

    All of this appears to have escaped many media outlets, which largely parroted the APTA press release. For example, The New York Times, CBS News, the Washington Post, and the Chicago Tribune were as parish newsletters commenting on a homily by the priest, for their failure to report both sides. A notable exception was USA Today, whose reporter consulted outsider Alan Pisarski (who has written for newgeography.com). Pisarski placed the APTA figures in historical context and expressed reservations about restoration of the transit commuting share numbers of 1980 or before. 

    Wendell Cox is principal of Demographia, an international public policy and demographics firm. He is co-author of the "Demographia International Housing Affordability Survey" and author of "Demographia World Urban Areas" and "War on the Dream: How Anti-Sprawl Policy Threatens the Quality of Life." He was appointed to three terms on the Los Angeles County Transportation Commission, where he served with the leading city and county leadership as the only non-elected member. He was appointed to the Amtrak Reform Council to fill the unexpired term of Governor Christine Todd Whitman and has served as a visiting professor at the Conservatoire National des Arts et Metiers, a national university in Paris.

    Photograph: DART light rail train in downtown Dallas (by author)

    ———————

    Note 1: Current Employment Statistics Survey data, 1939 to 2013. 1913 to 1938 estimated from data in Historical Statistics of the United States: Bicentennial Edition.

    Note 2: The source for the commuting data is the American Community Survey of the Census Bureau, which indicates an employment level in 2012 that is higher than in 2007. The Current Employment Statistics Survey of the Bureau of Labor Statistics indicates a decline.

    Note 3: I would be pleased to be corrected on this. In 2004, we issued a challenge on this subject, and while there were some responses, none met the required criteria (see http://demographia.com/db-challenge-choice.htm). The criteria are repeated below:

    To identify an actual system or propose a system that provides the following in an urban area of more than 1,000,000 population:

    · Transit choice (automobile competitive public transport service) for at least 90 percent of trips and passenger kilometers in the particular urban area.

    · Automobile competitiveness is defined as door to door trip times no more than 1.5 times automobile travel time.

    The description of any system not already in operation should also include an estimate of its cost, capital and annual operating.

  • Work Access in the Non-centered San Francisco Bay Area

    The San Francisco Bay Area (San Jose-San Francisco combined statistical area or CSA) has a superior access to work systems, including its important work at home element. The freeway system provides primary access between all points, importantly supplemented by arterial streets, and accounts for nearly 70 percent of all work trips. There are more types of transit than in other metropolitan regions (metro, street car, commuter rail, light rail, ferry, and cable car) and generally with a higher level of service. The Silicon Valley virtually defines information technology and is behind the huge increase in working at home, much of it telecommuting.

    The recently released American Community Survey five-year file provides the opportunity to examine state of employment access in all Bay Area municipalities

    Employment Access by Car

    Like every major metropolitan area in the United States, more people use cars or light trucks (for simplicity called "cars" in this article) to get to work than any other mode of transport. In the Bay Area, 68 percent of commuting is by car. Cars provide the overwhelming majority of work access to jobs in 11 of the Bay Area’s 12 counties. This ranges from 80 percent in Alameda County (secondary core municipality Oakland is the county seat) to 91 percent in San Joaquin County, which was recently added to the San Jose-San Francisco CSA (Figure 1). In the 12th county, San Francisco, cars provide work access for nearly equal to that of transit, walking and cycling combined (both approximately 46 percent).

    Employment Access from Home

    Working at home continues to grow and, to an even greater extent than car travel, is relatively evenly distributed throughout the 12 Bay Area counties. The highest percentage is in Marin County, at 9.6 percent. The combination of a technology friendly regional environment and horrific traffic on the primary commuting routes to most of the Bay Area (US-101 and the Golden Gate Bridge) probably drive this figure higher. Contra Costa County and Santa Cruz County also have a high work at home shares, at 7.3 percent and 7.1 percent respectively. This is than 50 percent above the national rate.

    Most surprisingly, however, the lowest work at home share in the Bay Area is in Santa Clara County, the very heart of Silicon Valley. This is slightly less than the national average. Another surprise is counties on the periphery of the Bay Area also have small work at home shares. Sonoma, Napa and San Joaquin counties have work at home shares of under 5.0 percent.

    Outside the core cities of San Francisco and Oakland, more than 1.5 times as many employees work at home (including telecommuting) than access work by transit (Figure 2).

    Employment Access by Transit

    The Bay Area remains monocentric only in aerial photographs and transit market share. San Francisco is served by one of the nation’s busiest metro (subway or underground) systems in the nation, Bay Area Rapid Transit (BART), which carries over 400,000 one-way rides daily. BART was the first of the major post-World War II rapid transit systems in the United States and was followed by other fully grade separated Metro systems in Washington and Atlanta and individual lines in Los Angeles.

    As we indicated in Transit Legacy Cities, most of the transit commuting (55 percent) in the United States is to just six core municipalities, New York, Chicago, Philadelphia, Boston, Washington, and San Francisco. Approximately 60 percent of commuting to those cities is to the downtown areas, which are also the largest in the United States. Yet these legacy cities, with a majority of the nation’s transit commuting, account for only six percent of the nation’s employment.

    Nearly two-thirds of Bay Area transit commuters work in the city of San Francisco and that figure rises to more than 70 percent, including the city of Oakland, with its strong downtown. Yet, these two core cities have only 21 percent of employment in the Bay Area. The downtowns of both core cities are well served by transit, including BART and radial surface transit systems. Buses serve downtown Oakland, while buses, trolley buses (electric buses), street cars and cable cars are focused on downtown San Francisco.

    The Non-Centered Metropolis

    Even with a regional Metro system, the Bay Area has developed in a strongly dispersed and polycentric form. Polycentricity is represented by edge cities (suburban office centers) such as Walnut Creek (with a BART station), the San Francisco Airport office area (not generally walkable from any rapid transit) and in the Silicon Valley (San Mateo and Santa Clara counties). Even more, however, employment is dispersed well beyond even these nodes.  Authors Robert Lang and Jennifer LeFurg have called this phenomenon "edgeless cities," though their other term, the "non-centered metropolis," says it better.

    Outside the San Francisco-Oakland core, the commuting pattern in the Bay Area is little different than in the rest of the nation (as is also the case in New York, outside the urban core). Nearly 80 percent of the Bay Area’s jobs are outside the cities of San Francisco and Oakland, however only 4.0 percent of commuters use transit to jobs located outside these cores. Among municipalities other than San Francisco and Oakland with BART stations, work access by transit is 5.1 percent, only slightly higher than the national average (which includes all urban and rural areas). Commuting by transit is even lower (3.0 percent) to jobs in outside municipalities with BART stations (Figure 3).

    Among the municipalities with BART stations and favorable "jobs-housing balances," only San Francisco, Oakland and Berkeley (home of the University of California) attract more transit commuters than the national average. Walnut Creek illustrates the problem of regional transit commuting to suburban locations. Walnut Creek has a strong suburban office center and a stronger jobs-housing balance than all BART municipalities but much smaller Colma. Yet, only 3.5 percent of commuters who work in Walnut Creek used transit to get to work (Figure 4).

    Overall, outside the core cities of San Francisco and Oakland, approximately 20 times as many people commute to jobs by car as by transit.

    The Illusion of Monocentricity

    With transit’s failure to carry large numbers of workers to jobs throughout the Bay Area (not just to the two older core municipalities), planners have switched strategies. Now the focus is on urban villages (transit oriented development), by which people and jobs will be located close together, reducing the need for long automobile commutes. The adopted regional plan, "Plan Bay Area" imagines people living in transit oriented developments and walking, cycling or using transit to get to employment. However, former principal planner of the World Bank Alain Bertaud says that this "urban village model exists only in the mind of urban planners" and worse, that "it contradicts the economic justification of large cities:  the efficiency of large labor markets." (see: Urban Planning 101) That means a lower standard of living and more poverty.

    The reality for the Bay Area and for metropolitan areas around the world is that transit is structurally incapable of replacing the automobile for the bulk of the workforce. The fundamental problem is that no transit system can attract drivers to jobs by offering travel times competitive with the automobile (Note). Transit can compete to some downtowns, but downtowns have only a small minority of employment. Outside of those, trip patterns are simply too dispersed for transit to serve as well as cars. Monocentric cities, to duplicate Bertaud’s logic, exist "only in the mind of urban planners."

    Wendell Cox is principal of Demographia, an international public policy and demographics firm. He is co-author of the "Demographia International Housing Affordability Survey" and author of "Demographia World Urban Areas" and "War on the Dream: How Anti-Sprawl Policy Threatens the Quality of Life." He was appointed to three terms on the Los Angeles County Transportation Commission, where he served with the leading city and county leadership as the only non-elected member. He was appointed to the Amtrak Reform Council to fill the unexpired term of Governor Christine Todd Whitman and has served as a visiting professor at the Conservatoire National des Arts et Metiers, a national university in Paris.

    ————–

    Note: In 2003, I issued a challenge to identify an existing or proposed transit system design that would achieve automobile competitiveness throughout a metropolitan area of more than 1,000,000 in Western Europe or the United States (see: Smart Growth Challenge: Transportation Choice for All, Not Just a Few [Automobile Competitiveness]). No complete responses were received. This is not surprising. In 2007, Professor Jean-Claude Ziv and I authored a paper for the 11th World Conference on Transport Research (2007 WCTRS) that estimated such a system could cost as much as the total gross domestic product of any such metropolitan area each year).

    Photo: Bart A car Oakland Coliseum Station

  • Portland Light Rail Revolt Continues

    In a hard fought election campaign, voters in the city of Tigard appear to have narrowly enacted another barrier to light rail expansion in suburban Portland. The Washington County Elections Division reported that with 100 percent of precincts counted, Charter Amendment 34-210 had obtained 51 percent of the vote, compared to 49 percent opposed.

    The Charter Amendment establishes as city policy that no transit high capacity corridor can be developed within the city without first having been approved by a vote of the people. High capacity transit in Portland has virtually always meant light rail.

    In a previous ballot issue, Tigard voters had enacted an ordinance requiring voter approval of any city funding for light rail. Similar measures were enacted in Clackamas County as well as King City in Washington County. Across the Columbia River in Clark County (county seat: Vancouver), voters rejected funding for connecting to the Portland light rail system. After the Clackamas County Commission rushed through a $20 million loan for light rail (just days before the anti-light rail vote), two county commissioners were defeated by candidates opposed to light rail, with a commission majority now in opposition.

    Further, a Columbia River Crossing, which would have included light rail to Vancouver was cancelled after the Washington legislature declined funding. In a surreal aftermath, interests in Oregon seriously proposed virtually forcing the bridge on Washington, fully funding the project itself. A just adjourned session of the Oregon legislature failed to act on the proposal, which now (like Rasputin) appears to be dead.

    At the same time, Portland’s transit agency faces financial difficulty and has been seriously criticized in a report by Secretary of State. The agency has more than $1 billion in unfunded liabilities and carries a smaller share of commuters than before the first of its six light rail and commuter rail lines was opened. Moreover, the latest American Community Survey data indicates that 3,000 more people work at home than ride transit (including light rail and commuter rail) to work in the Portland metropolitan area. Before light rail (1980), transit commuters numbered 35,000 more than people working at home. Over the period, transit’s market share has dropped one-quarter.

  • Urban Planning 101

    Former World Bank principal planner Alain Bertaud has performed an important service that should provide a much needed midcourse correction to urban planning around the world. Bertaud returns to the fundamentals in his "Cities as Labor Markets."

    Bertaud begins by reminding us that without well functioning labor markets, cities will not be successful. This requires mobility, which he defines as "the ability to move quickly and easily between locations within a metropolitan area" and "the ability to locate one’s house or one’s firm in any location within a metropolitan area." This mobility, he maintains, is indispensable in facilitating growth of the city.

    There is just one exception, according to Bertaud. These are retiree cities, which do not principally rely on mobility for their growth. Yet, Bertaud notes that these are themselves products of the much more numerous conventional cities, where mobility has facilitated growth and in which future retirees accumulate the resources that permit migration to the retirement cities.

    There are also the planned cities for government, such as Brasilia and Washington. Bertaud contends that they have become successful because "more diversified labor market "was grafted " onto the government activities."Before that, however: "The ‘cost is no object’ concept presided over their construction and insured their initial survival as they were financed by taxes paid by the rest of the country." This should give pause to nations, especially in the developing world proposing to build and thereby divert resources from improving the lives of people (see;  Unmanageable Jakarta Soon to Lose National Capital?).

    Imaginary "Urban Villages"

    Bertaud insists on the importance of cities as unified labor markets. Metropolitan areas will be hampered in their development and innovation to the extent that they are fragmented.

    He is particularly critical of planning attempts to create "urban villages" within the unified labor markets (metropolitan areas). He contends that: "The urban village model” implies a systematic fragmentation of labor markets within a large metropolis and does not make economic sense in the real world."

    Bertaud does not accept the notion that:

    "… everybody could walk or bicycle to work, even in a very large metropolis. To allow a city to grow, it would only be necessary to add more clusters. The assumption behind this model is either that urban planners would be able to perfectly match work places and residences, or that workers and employers would spontaneously organize themselves into the appropriate clusters."

    He is concerned at the "prevalence of this conceit in many urban master plans," which he characterizes as "utopian trip patterns."

    According to Bertaud, the urban village "model does not exist in the real world because it contradicts the economic justification of large cities: the efficiency of large labor markets." The cold water of reality is that "… the urban village model exists only in the mind of urban planners."

    Uncontained Self-Contained Satellite Towns

    He supports his claim. Seoul’s satellite communities were intended to be self contained towns (urban villages), in which most residents both lived and worked. Yet, most of the workers employed in the satellite towns live in other parts of the metropolitan area. At the same time, most of the residents of the satellite  work in other parts of the Seoul metropolitan area. He cites Stockholm regulations requiring neighborhood jobs – housing balances as having no impact on shortening commute distances even when such a balance is achieved.

    My own research using 2001 census data indicated that the London area new towns, also intended to be populated principally by people who work in them, had average work trip travel distances more than their diameter (See: Jobs-Housing Balance and Urban Villages in Southeast England). This means that large numbers of people were traveling to work outside the towns. In London as in Seoul, the planners can conceptualize the self-contained satellite towns, but it is beyond them to force the behaviors to make them work.

    Similarly misguided efforts elsewhere, from the San Francisco Bay Area and other California metropolitan areas to Montréal and beyond are destined for similar failures.

    Commuting and the City

    Bertaud cites research by Remy Prud’homme and ChoonWong Lee at the University of Paris showing that the efficiency of cities tends to increase up so long as a large share of the commutes are less than 60 minutes, though optimal efficiency occurs at shorter commute distances. Lest there be any misunderstanding, American cities have average commute times of approximately 25 minutes, according the Census Bureau’s American Community Survey, not the hour or two hour journeys of urban legends.

    Defining the City

    This large commuting radius makes it clear that Bertaud does not accept the distorted urban definition that would, for example, define the urban form to not extend beyond the borders of New York City, or worse beyond the Hudson, East and Harlem Rivers – the boundaries of the island of Manhattan. If the city is limited to dense cores, then the "half urban" world recently announced won’t be here for many decades. The city is the metropolitan area – the labor market, which extends to the far reaches of the commuting shed.

    The Bottom Line

    According to Bertaud, 

    "Increasing mobility and affordability are the two main objectives of urban planning. These two objectives are directly related to the overall goal of maximizing the size of a city’s labor market, and therefore, its economic prosperity." 

    That brings us back to first principles. Cities are about people. Planning is justified to the extent that it facilitates the aspirations of people. The city requires prosperity, which Bertaud shows in a much needed first installment of Urban Planning 101.

    Wendell Cox is a Visiting Professor, Conservatoire National des Arts et Metiers, Paris and the author of “War on the Dream: How Anti-Sprawl Policy Threatens the Quality of Life.

    —–

    Note: Alain Bertaud’s "Cities as Labor Markets," was published by the Marron Institute on Cities and the Urban Environment at New York University and is intended to be a chapter in his forthcoming book, tentatively titled Order without Design.

  • Where New Yorkers are Moving

    The American Community Survey has released domestic migration data that was collected over a five year period (2007 to 2011).  There is newer domestic migration data available, such as is annually provided by the Census Bureau’s population estimates program, but not in the detail that the latest data provides.

    The new release is significant because domestic migration data is provided between each of the nation’s more than 3,100 counties. Because the survey was taken over a five-year period, the data represents, in effect, a one-fifth snapshot of domestic migration for each of the years from 2007 to 2011. Each year respondents are asked where they lived a year ago. It is thus a rolling annual figure, rather than a picture of a single year.

    The Uniqueness of New York City

    The city of New York provides an interesting case for many reasons. The city is by far the largest municipality in the United States and the only municipality composed of at least two complete counties. New York is coterminous with five counties. New York also has by far the greatest extent of high density in the United States, comprising more than 85 percent population of zip codes with greater than 25,000 per square mile density (10,000 per square kilometer).

    Finally, New York is at the center of the largest metropolitan area in the United States, which in its expanded, combined form (combined statistical area) has a population of 23.1 million, most of which (20.7 million) is in a built-up urban area that covers the largest land area in the world (has the largest urban footprint). This is more than a third larger than Tokyo, the world’s largest urban area by population, with an 80 percent higher population. It is surprising to many that New York’s urban area covers nearly twice the land area of Los Angeles and is nearly one-quarter less dense.

    Domestic Migration and New York City

    New York’s broad suburban expanse generally resembles the suburbs of Dallas-Fort Worth, Seattle or Toronto and much of its Staten Island borough (county of Richmond) looks more like suburban New Jersey than New York, most of its urban core – the city of New York – is unique.

    And the city continues to export large numbers of people – 90,000 more than arrived in the rolling year represented by the latest ACS data. This is a big number, representing 1.1 percent of the city’s 2010 population. This is a larger loss than Philadelphia (0.5 percent), but smaller than Washington (1.4 percent).

    This has been evident in the large numbers net domestic migrants reported each year in the Census Bureau estimates. The data shows that people are leaving not only the city of New York not only for the suburbs, but moving in even greater numbers to beyond the metropolitan area. Approximately 27,000 more New Yorkers moved to the suburbs than to the city of New York over the period. However, an even larger 63,000 net domestic migrants left the city of New York for areas outside the metropolitan area.

    Approximately 30,000 of these inter-regional migrants moved to other major metropolitan areas (those with more than 1 million population). By far the largest share – 74 percent – of the city’s net domestic migrants to other major metropolitan areas moved to the South. Four of the five largest major metropolitan gainers at the city’s expense were Miami (net 5,600) and Atlanta (net 4,300), followed by Tampa-St. Petersburg, and Dallas-Fort Worth.

    Another 13 percent of the city’s net domestic migrants moved to other major metropolitan areas in the Northeast. Rochester was the largest gainer with nearly 1000 net domestic migrants from the city of New York, followed by Philadelphia. The city gained more than 250 residents from Boston.

    Approximately 9 percent of the city’s net domestic migrants moved to major metropolitan areas in the West. Los Angeles led in the West, gaining 1,800 net migrants from the city. The outlier was the Midwest, which sent more than 300 net migrants to the city (Figure 1).

    City residents tended to move to the suburbs of the major metropolitan areas, which attracted 60 percent, while the core cities received 40 percent of the net migrants.

    Dispersing Beyond the Larger Metropolitan Areas

    However, the most striking trend is that most of the net domestic migrants who left the city of New York to move outside the New York metropolitan area moved to areas outside the major metropolitan areas. In this regard, New Yorkers who move seem to be more inclined toward the greater dispersion of the nation’s smaller metropolitan areas and micropolitan areas.

    Over the period, approximately 32,500 net domestic migrants left the city for areas outside major metropolitan areas. This is more than moved to the other major metropolitan areas or to the New York metropolitan area suburbs (Figure 2).

    The most surprising finding is that the majority (65 percent) of net domestic migrants from the city who moved to outside the major metropolitan areas settled in the Northeast. Most of these 23,000 residents moved to smaller areas in Upstate New York and Pennsylvania. Virtually all of the other migrants not moving to major metropolitan areas moved to states in the South (41 percent). In contrast, there was a small amount of migration to New York from the West and Midwest totaling less than 2,000 (Figure 3).

    Outside New York and New Jersey, which contain nearly all of the New York metropolitan area, Florida received the largest number of net migrants from the city (11,000), followed by Pennsylvania (8,000). Only 100 of the Pennsylvania migrants were to Pike County, which is in the New York metropolitan area. Georgia, Texas and North Carolina all received approximately 5,000 net migrants from the city. The top ten destinations were rounded out by Virginia, Connecticut and South Carolina. A total of 37 states received net domestic migrants from the city. Only Alaska and the District of Columbia sent more than 1,000 net domestic migrants to New York City.

    Conclusion

    The New York City migration data indicates continuing dispersion of the population. People are moving from the core to the periphery in New York, and many going beyond to less urban areas in the Northeast. More are moving to other major metropolitan and other smaller areas, located for the most part in the South. This year’s brutal winter could make the South look even better to New Yorkers.

    Wendell Cox is a Visiting Professor, Conservatoire National des Arts et Metiers, Paris and the author of “War on the Dream: How Anti-Sprawl Policy Threatens the Quality of Life.

    Photo: Leaving New York City via the Holland Tunnel (by author)

  • Business Insider: “Americans are Still Moving to the Suburbs”

    Andy Kiersz’s article in the Business Insider  (see Americans are Still Moving to the Suburbs) summarizes data from the US Census Bureau’s American Community Survey (ACS) to conclude that "Americans still love the suburbs, and are still moving there from big cities."

    This has long been and continues to be indicated in the data, even as major media rely on anecdotes are to suggest that large numbers of people are leaving the suburbs to "return" to the core cities (from which, by the way, most never moved). There is no doubt that the core cities are doing much better than before, and that is a good thing. Much of this is because the cities are safer than in the 1970s and 1980s. The historic urban core has been restored as an integral part of the modern urban area. However, promoting the health of core cities does not require demeaning or dismissing the suburbs, which are just as integral to modern urbanism as core cities.

    Kiersz refers to a list of the 25 largest met migration movements between counties as reported by the ACS for 2007 to 2011. In every case, the 25 largest net domestic migration movements are from more highly urban core environments to more suburban environments (domestic migration is measured only at the county level).

    The list shows that even within the nation’s largest core city, New York, people are moving to more dispersed areas. This includes net migration from Manhattan to the Bronx and Brooklyn to Queens. Then there is the suburban movement, with a stream of migrants from Queens, in the city to adjacent, suburban Nassau County. Migration from Nassau County even further out, to Suffolk County also made the top 25.

    The outward movement is not limited to New York. A net 50,000 people left the Los Angeles metropolitan area than arrived, just among the 25 largest county migration pairs. Most went to the Riverside-San Bernardino area (which depending on the definition can be called "exurban") and a large number to the Bakersfield metropolitan area. Within the metropolitan area, 10,000 moved from Los Angeles County to Orange County.

    The city (also a county) of San Francisco, which has had the strongest growth of any fully developed major US municipality that has not annexed since 1950, lost 5,000 people to nearby suburban San Mateo County.

    The top 25 also includes nearly 20,000 people moving from Chicago’s core Cook County to three suburban counties.

    It will probably be quite a long time, if ever, before the top 25 migration list has meaningful representation showing movement from suburban counties to core counties. Yet, today’s more healthy cities will do better if they genuinely tackle their remaining challenges. Most important are their education systems that send a disproportionate share of young families to the suburbs. However, from the United States to Europe, Japan, and China, the natural order is that cities (metropolitan areas with their core cities, suburbs, and exurbs) tend to disperse as they add population. That reality is again confirmed by the new data.

  • The Evolving Urban Form: Suburbanizing Mexico

    There is an increasing recognition – at least outside the academy, planning organization and urban core developer groups – that the spatial expansion of cities or suburbanization represents the evolving urban form of not only the United States and virtually all of the high income world but also across the developing world, whether middle income or third world.

    In recent years, Mexico has made substantial economic progress. Per capita income (purchasing power parity) in Mexico exceeds that of all the "BRIC" nations (Brazil, Russia, India, and China) except resource-rich Russia.

    In Mexico, as almost everywhere, cities continue to expand to provide more living space for an emerging suburban middle-class. This is obvious in the new townhouse (attached house) and detached house developments that ring the urban areas (photograph above). Some of the best evidence of this can be observed on and beyond the southern edge of the nation’s second-largest urban area, Guadalajara (for example on Google Earth).

    The Valley of Mexico

    Nearly 3 years ago, one of the first Evolving Urban Form articles highlighted the Valley of Mexico metropolitan area, which is Mexico City in its functional (economic) manifestation. That article noted that the core municipality of Mexico City in 1950 had 2.23 million residents out of the urban area’s fewer than 3 million and comprised only 54 square miles (139 square kilometers). By 1970, the city’s population had risen to 2.85 million. However, as has happened in Paris, Copenhagen, Milan, Osaka, Glasgow, Detroit, and many others, the urban core population plummeted. By 2000, the former city had a population of only 1.69 million, a 40 percent loss from 1970. There was a modest population increase between the 2000 and 2010 censuses, but its population seems unlikely to ever be restored to near their previous peak, which mirrors the experience of Paris and Copenhagen.

    Instead all population growth in the Valley of Mexico metropolitan area has been outside the 1950 area of Mexico City and in the post-World War II suburbs. While comparable metropolitan area data is not available, the Mexico City urban area added more than 10 million residents between 1970 and 2010. The same period, the suburban areas added more than 11 million residents (Figure 1). The Valley of Mexico metropolitan area is located not only in the Distrito Federal, but also in the states of Mexico and Hidalgo.

    The Other Major Metropolitan Areas

    While the scale of urbanization in the Valley of Mexico dwarfs that of the rest of the nation, similar dispersion is evident in the nation’s other 11 metropolitan areas with more than 1,000,000 population (Figures 2 and 3).

    Guadalajara

    Guadalajara, capital of state of Jalisco, is Mexico’s second largest metropolitan area. Between 2000 and 2010, the metropolitan area grew nearly 20 per cent, from 3.7 million residents to 4.4 million. The core city (locality) of Guadalajara lost 150,000 residents, registering a population of just under 1.5 million in 2010. Suburbs accounted for approximately all the metropolitan area’s population growth.

    Monterey

    Monterey, capital of the state of Nuevo Leon, is currently the third largest metropolitan area in Mexico and is growing slightly more rapidly than Guadalajara. Between 2000 and 2010, Monterey added 22 per cent to its population, which increased from 3.4 million residents to 4.1 million. The central locality grew modestly, but 97 per cent of the metropolitan area growth was in the suburbs.

    Central Mexico

    The Valley of Mexico metropolitan area is encircled by smaller, but major metropolitan areas that are among the fastest-growing in the nation.

    Queretaro, the capital of the state of Queretaro, is located 130 miles (220 kilometers) north of Mexico City by freeway. Queretaro is the fastest-growing major metropolitan area in Mexico, having added 34 per cent to its population over the last census period, to reach 1.1 million. More than two thirds of the growth was in the suburbs.

    Toluca, capital of the state of Mexico (Note), is located across a mountain range only 40 miles (65 kilometers) west of Mexico City. Toluca grew 33 percent to 1.9 million residents in 2010. Nearly 90 per cent of Toluca’s population growth was in the suburbs between 2000 and 2010.

    Pueblo, capital of the state of Puebla, is located across mountain range 130 miles (80 kilometers) to the east of Mexico City. Puebla is located in a valley surrounded by some of the most spectacular volcanoes in the world, including Popocateptl and Iztaccihuatl (both more than 17,000 feet, or 5,100 meters), toward Mexico City, La Malinche (14,600 feet or 4,500 meters), only 17 miles from the city center and Orizaba (18,500 feet or 5,600 meters). The three tallest of these reach elevations higher than any in North America outside of the Yukon and Alaska. Puebla was the slowest growing of the Central Mexico metropolitan areas, adding 23 percent to its population, and reaching 2.9 million residents in 2010. Three quarters of Puebla’s growth was in the suburbs. The Puebla metropolitan area extends into the state of Tlaxcala.

    Border Metropolitan Areas

    In comparison,   the large metropolitan areas on the United States border expanded outwards but not as rapidly. Tijuana, which is adjacent to the San Diego metropolitan area now has 1.75 million residents. More than 60 percent of its growth over the preceding 10 years was suburban. Juarez (located in the state of Chihuahua), is across the border from the El Paso metropolitan area and reached a population of 1.5 million, with slightly more than one half of its growth being in the suburbs. Neither San Diego-Tijuana area nor Juarez -El Paso qualify as metropolitan areas because they are not labor markets – there are significant limitations on the movement of labor (employees).

    Other Interior Metropolitan Areas

    Three other major metropolitan areas are located in the interior. In Torreon (states of Coahuila and Durango), more than 60 percent of the population growth was in the suburbs. A smaller 51 percent of the growth in San Luis Potosi (state of San Luis Potosi) was in the suburbs. The significant exception was Leon (state of Guanajuato), where only 36 percent of the growth was outside the core urban core.

    Continuing Dispersion

    Overall, 5.1 million of the 6.0 residents added to Mexico’s major metropolitan areas between 2000 and 2010 were outside the urban cores (Figure 4). Most of the growth was in the three largest metropolitan areas (Mexico City, Guadalajara and Monterrey), which added 3.2 million residents. The urban cores of these three metropolitan areas together declined approximately 100,000, while the suburbs attracted more than all of the metropolitan area growth. Mexico seems well positioned for continued economic growth and a populace that seeks better standards of living, more often than not in dispersed settings.

    Wendell Cox is a Visiting Professor, Conservatoire National des Arts et Metiers, Paris and the author of “War on the Dream: How Anti-Sprawl Policy Threatens the Quality of Life.

    —————-

    Note: The state of Mexico has the largest population in the nation, at 15.2 million (2010). This is 70 percent more than the second largest federal division, the Distrito Federal. This state of Mexico borders the Distrito Federal (Mexico City) on three sides and it outer suburban areas constitute more than one-half of the Valley of Mexico metropolitan area population (11 million of 21 million). Another 2 million are located in the even more distant state of Hidalgo. This state of Mexico also includes Toluca, another major metropolitan area (see above).

    ————

    Photograph: Southern suburbs of Guadalajara (by author)

    Correction: This version removes reference to Tijuana as the capital of Baja California. Mexicali is the state capital.

  • The Evolving Urban Form: The San Francisco Bay Area

    Despite planning efforts to restrict it, the Bay Area  continues to disperse. For decades, nearly all population and employment growth in the San Jose-San Francisco Combined Statistical Area has been in the suburbs, rather than in the core cities of San Francisco and Oakland. The CSA (Note) is composed of seven adjacent metropolitan areas (San Francisco, San Jose, Santa Cruz, Santa Rosa, Vallejo, Napa, and Stockton). A similar expansion also occurred in the New York CSA.

    The San Francisco Bay Area is home to two of the three most dense built-up urban areas in the United States, the San Francisco urban area, (6,266 residents per square mile or 2,419 per square kilometer) with the core cities of San Francisco and Oakland and the all-suburban San Jose urban area (5,820 residents per square mile or 2,247 per square kilometer), according to US Census 2010 data. Only the Los Angeles urban area is denser (6,999 per square mile or 2.702 per square kilometer). The more spread out New York urban area trails at 5,319 per square mile (2,054 per square kilometer).

    The San Francisco Bay & Central Valley Area

    The continuing dispersion was reflected in commuting patterns that developed between 2000 and 2010, with the addition of the Stockton metropolitan area, which is composed of San Joaquin County, with more than 700,000 residents. San Joaquin County is located in the Central Valley and is so far removed from San Francisco Bay that it may be appropriate in the long run to think of the area as the "San Francisco Bay & Central Valley Area." The distance from Stockton to the closest point shore of San Francisco Bay is 60 miles, and it is nearly another 25 miles to the city of San Francisco.

    Ironically, this continued dispersion of jobs and residences is, at least in part, driven by the San Francisco Bay Area’s urban containment land use policies designed to prevent it. What the planners have ignored is the impact on house prices associated with highly restrictive land use planning. The San Francisco metropolitan area and the San Jose metropolitan area are the third and fourth most unaffordable major housing markets out of 85 rated in the recent 10th Annual Demographia International Housing Affordability Survey, trailing only Hong Kong and Vancouver.

    Historical Core Cities: San Francisco and Oakland

    The historical core municipalities (cities) of the San Francisco Bay Area, San Francisco and Oakland have held their population very well. Each essentially retains it 1950 borders. Among the 40 US cities with more than 250,000 residents in 1950, only San Francisco and Oakland managed population increases by 2000 without substantial annexations and substantial non-urban (rural) territory within their city limits. For example, New York and Los Angeles, both of which have grown, have nearly the same city limits as in 1950 and 2000, yet much of New York’s Staten Island was rural in 1950 as was much of the San Fernando Valley in Los Angeles.

    Yet both San Francisco and Oakland have had difficult times. Between 1950 and 1980, both San Francisco and Oakland suffered 12 percent population losses, which were followed by recoveries. The losses were modest compared to the emptying out of municipalities like St. Louis. Detroit, Chicago, Copenhagen, and Paris, which remain one quarter to nearly two-thirds below their 1950s figures. Further, population gains from annexations masked losses within the 1950 boundaries of many cities, such as Portland, Seattle, and Indianapolis, etc.

    San Jose: Now the Largest City

    San Jose is now the Bay Area’s largest city. San Jose has grown spectacularly, from a population of 95,000 in 1950 to nearly 1,000,000 today. San Jose passed San Francisco by the 1990 census and Oakland by the 1970 census (Figure 1). Virtually all of San Jose’s population growth has occurred during the postwar period of automobile suburbanization. The pre-automobile urban form familiar in San Francisco and central Oakland simply does not exist in San Jose. Even attempts to pretend the pre-war urban form has returned have been famously unsuccessful. Even after building an extensive light rail system, San Jose’s transit work trip market share is barely one quarter that of the adjacent San Francisco metropolitan area.

    Nonetheless, suburban San Jose has become a dominant force in the "Silicon Valley", which stretches through San Mateo County in the San Francisco metropolitan area and into Santa Clara County, which includes San Jose. The Silicon Valley has been the capital of the international information technology business for at least a half century. The highly suburbanized region has done more than its share to elevate the San Francisco Bay Area to its high standard of living (According to Brookings Institution data), a phenomenon that has spread also the urban core of San Francisco. At the same time, San Jose is the second most affluent major metropolitan in the world and San Francisco ranks seventh. The Silicon Valley, which includes much of San Mateo County (adjacent to Santa Clara County in the San Francisco metropolitan area), is clearly the economic engine of the region with twice as many jobs as San Francisco (which is both a city and a county).

    Metropolitan Growth

    Overall, the San Francisco Bay Area has grown approximately 180 percent since 1950, considerably more than the national average from 1950 to 2012 of 107 percent. The Bay Area’s growth was strong, but well behind the 280 percent growth achieved in the Los Angeles CSA (Los Angeles, Riverside-San Bernardino, and Oxnard MSAs).

    However, growth has since moderated substantially. Between 1950 and 2000, the Bay Area grew at an annual rate of 1.9 percent but since 2000, the annual growth rate has dropped to 0.7 percent annually. Even so, in recent years, the Bay Area has nearly equaled the much slowed growth of the Los Angeles CSA, adding 23.6 percent to its population since 1990, compared to 25.5 percent in Los Angeles. Both areas, however, grew at less than the national population increase rate (25.8 percent), and slowing, in the 2000s to the slowest growth rates since California became a state in 1850.

    Suburban Growth

    Despite the decent demographic performance of the cities of San Francisco and Oakland since 1950, nearly all Bay Area growth occurred in the suburbs. Between 1950 and 2012, only one percent of population growth in the CSA occurred in the two historical core municipalities and 99 percent in suburban areas. Things have been somewhat better for the two cities since 2000, with seven percent of the growth in the historical core municipalities and 93 percent of the growth in suburban areas (Figure 2).

    Since 1950, the San Jose metropolitan area has grown by far the fastest in the CSA, with the more than 500 percent increase in population. The outer metropolitan areas (Santa Cruz, Santa Rosa, Vallejo, Napa, and Stockton) have grown nearly 300 percent, while the parts of the San Francisco metropolitan area outside the two core cities grew more than 200 percent. San Francisco and Oakland grew approximately 5 percent (Figure 3).

    Domestic Migration

    As house prices increased before the subprime crisis, the Bay Area lost more than 600,000 domestic migrants, a rate of more than 85,000 per year. Since 2008, however, with substantially lower house prices, and a renewed tech boom, there has been an annual gain of approximately 4,000 to the Bay Area in domestic migration. However, if the substantial house price increases since 2012 continue, the area could again become a net exporter of people.

    Future Urban Evolution

    Like much of California, San Francisco Bay CSA exhibits much slower population growth than before. How much of this is tied to the regional and state policies constricting suburban housing remains an open question, but it seems much growth that might have occurred in the original San Francisco metropolitan area or the later developing San Jose metropolitan area will instead occur in the Vallejo or Stockton metropolitan areas, where housing prices  tend to be much lower, particularly for larger homes that are increasingly unaffordable closer to the urban core. Indeed, it is not impossible that Modesto (Stanislaus County) could be added  to the San Francisco Bay CSA by 2020, which is even farther away from the historical core than the Stockton metropolitan area.

    At the same time, many potential new residents may find either the high prices near the core nor the long commutes associated with Central Valley residence unappealing. Many households may instead seek their aspirations in Utah, Colorado, Texas, and even Oklahoma, not least because the "California Dream" has been made affordable.

    Wendell Cox is a Visiting Professor, Conservatoire National des Arts et Metiers, Paris and the author of “War on the Dream: How Anti-Sprawl Policy Threatens the Quality of Life.

    —–

    Note: Metropolitan areas are labor markets. Their building blocks in the United States are complete counties. Metropolitan statistical areas are organized around built up urban areas with counties reaching a threshold of the urban area population being considered central counties and included in the metropolitan area. In addition, any county with an employment interchange of 25 percent or more with the core counties is also included in the metropolitan area. Adjacent metropolitan areas are added together to form Combined Statistical Areas if there is a 15 percent or more employment interchange. This is a simplified definition. Complete details are available from the US Office of Management and the Budget.

    Photo: Market Street, San Francisco (by author)