Author: Wendell Cox

  • The Grenfell High-Rise Fire: A Litany of Failures?

    At this writing, the London (Kensington) Grenfell high-rise fire has taken a confirmed 58 lives, with an unknown number missing and many more sent to hospitals. The 24 story low income housing tower block caught fire on Wednesday, June 14. It was virtually all consumed, as shown in the photograph above.

    There is much to be concerned about here. This building was not owned by any of those private developers who politicians seem to blame for every all that’s wrong with housing in severely unaffordable Britain. The building, now a burned out shell, is owned by the affluent Royal Borough of Kensington and Chelsea (a local government unit within the Greater London Authority).

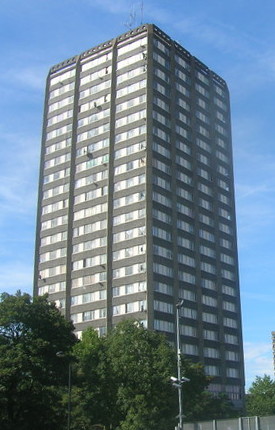
    This is how the structure appeared before the recent refurbishment (photo by R Sones).

    Government Failure?

    It is not as if the council had not been warned. The Grenfell Action Group has been monitoring problems at Grenfell Tower on behalf of tenants for years. On June 15, they published a blog with links to their previously expressed concerns about fire safety in the building, including one entitled KCTMCO Playing with Fire that details the frustrations of dealing with the Council’s tenant manager. The post, from last November included called the conditions, including the management of the KCTMO (Royal Borough of Kensington and Chelsea Tenant Management Organisation) and the Borough "a recipe for a future major disaster." Of course, that’s how it turned out.

    There is talk of criminal proceedings, and doubtless the private contractor who installed the cladding (exterior building facing) currently thought to have spread the fire quickly will be at greatest risk. However, the installation was procured by the KCTMO, the agent of the RBKC Borough Council, including an approved award to the contractor. Further, all of this was related to a refurbishment of the building, in which the RBKC did not require include installation of sprinklers, which would have "prevented the fire from developing." The Royal Borough of Kensington and Chelsea council is being barraged with criticisms, including from members of Parliament, for its administration of the Grenfell Tower over recent years.

    A Great Planning Disaster?

    Worse, in a larger sense, the Grenfell fire may turn out to be one of the world’s great planning disasters. One headline put it this way: "Report: Grenfell Tower Fire May Have Been Caused By Panelling Installed To Make Rich Neighbors Happy." Only slightly less incendiary was The Independent headline, which read "Grenfell Tower cladding that may have led to fire was chosen to improve appearance of Kensington block of flats."

    According to planning documents obtained by The Independent:

    “Due to its height the tower is visible from the adjacent Avondale Conservation Area to the south and the Ladbroke Conservation Area to the east,” … “The changes to the existing tower will improve its appearance especially when viewed from the surrounding area.”

    The Independent also reported that the planning document made repeated references to the "appearance of the area" and that this was the "justification for the material used on the outside of the building, which has since been claimed to have contributed to the horror." The materials were chosen, according to the planning document "to accord with the development plan (our emphasis added) by ensuring that the character and appearance of the area are preserved and living conditions of those living near the development suitably protected,”

    One expert indicated apparent frustration at the use of flammable cladding materials: "We are still wrapping postwar high-rise buildings in highly flammable materials and leaving them without sprinkler systems installed, then being surprised when they burn down."

    The extent and spread of the fire was unusual for a high rise building. London Fire Commissioner Dany Cotton told The Engineer: “This is an unprecedented situation, with a major fire that has affected all floors of this 24 storey building, from the second floor up. In my 29 years with London Fire Brigade I have never seen a fire of this nature.” According to the Evening Standard: "…flames engulfed the block from the second floor upwards “within seconds”

    Concern in Australia

    While the Grenfell fire’s severity has been attributed to the flammable cladding installed during renovation, similar cladding is being used on new high rise buildings elsewhere. For example, according to The Age the Melbourne Fire Brigade found that the fire at the contemporary LaCrosse building ignited external wall cladding, which quickly spread to the top of the building through the "combustible material located in the wall structure." Two days after the Grenfell fire, The Guardian ("Former fire chief says Melbourne’s Lacrosse Tower still poses risk") reported that the cladding had still not been replaced, though the building has been reoccupied. Peter Rau, a former Melbourne Fire Brigade Chief told The Guardian that "he would not allow his children to live there."

    Australians may have plenty of reason to be concerned. Planning policies throughout Australia have sought to convince households to live in central city high-rises, seeking to entice them from their preferred suburban detached housing. In a June 15 story, The Age ("London tower fire could happen here: Australian buildings cloaked in flammable cladding") reported that Australian buildings are clad in "millions of square meters" of flammable cladding. This is not a new problem. According to The Age building code authorities were advised of the problem seven years ago.

    Tony Recsei, President of Save Our Suburbs in Sydney expressed concern in a  Sydney Morning Herald letter. Referring to the New South Wales government policy that seeks to increase high rise living, Recsei said "But this calamity starkly reveals there can be long-term consequences. It is to be hoped that the Greater Sydney Commission will seriously consider all the implications of its current strategy of imposing density quotas onto local neighborhoods."

    The extent of the concern in Australia is indicated in this video and article from news.com.au.

    New Zealand and the United States

    Even in New Zealand, where officials recently strengthened external materials fire regulations, the government asked local authorities to check buildings constructed before the regulatory reform to see if there are any with combustible cladding.

    According to the Times of London, the cladding used on Grenfell Tower has been illegal in the United States for five years.

    Further Developments in London

    Meanwhile, back in London, there remains considerable anger. London Mayor Sadiq Kahn visited the site on June 16 was questioned and heckled by survivors. On the same day, Prime Minister Theresa May also visited the scene and was criticized for meeting only with emergency services personnel, but not with any residents.

    The fatality count could go much higher. Fears of a building collapse are slowing inspection efforts. Metropolitan Police Commander Stuart Cundy told The Independentthat "he hoped the death toll would not be in “triple figures”.

    No Clean Hands?

    Of course, final assessments will have to await more formal inquiries. But there is plenty of reason to be concerned. Save the fire brigade, which has been roundly praised for its work, including being on the scene within six minutes, there may be no clean hands. Cities, from the days of ancient Rome, have been vulnerable to fiery disasters like this one; policies that encourage densification while failing to provide adequate safety procedures are creating the potential for more such disasters.

    Grenfell fire photo by Natalie Oxford.

    Wendell Cox is principal of Demographia, an international public policy and demographics firm. He is a Senior Fellow of the Center for Opportunity Urbanism (US), Senior Fellow for Housing Affordability and Municipal Policy for the Frontier Centre for Public Policy (Canada), and a member of the Board of Advisors of the Center for Demographics and Policy at Chapman University (California). He is co-author of the "Demographia International Housing Affordability Survey" and author of "Demographia World Urban Areas" and "War on the Dream: How Anti-Sprawl Policy Threatens the Quality of Life." He was appointed to three terms on the Los Angeles County Transportation Commission, where he served with the leading city and county leadership as the only non-elected member. He served as a visiting professor at the Conservatoire National des Arts et Metiers, a national university in Paris.

  • Dispersed Cities: Starting the 3rd Decade

    Cities (urban areas or settlements) have been around for millennia. Over that time, cities have changed in form and function. But the way that people move around the city has materially changed only twice. Walking was predominant until less than 200 years ago, then came mass transit, the automobile and now autonomous cars and some substitution for driving by online technology.

    The Walking City

    When walking predominated, cities had to be very dense, because things had to be close enough for pedestrian access. Walking Paris reached approximately 250,000 persons per square mile and London over 100,000 in the 17th century. The US also had dense walking cities, but they were smaller , emerged much later and never reached the highest densities of old-world cities. By 1820, New York had an estimated 50,000 residents per square mile, but a population of less than 150,000.

    Indeed in 1820 urban travel was little different than in for the average resident than in the pre-urban temple center of Gobekli Tepe (Turkey) 11,000 years ago, the Caral (Peru) of 4,500 years ago or the Wangchenggang (China) of 4,000 years ago.

    The Transit City

    However, the second quarter of the 19th century saw the emergence of the mass transit revolution. The new the horse drawn omnibuses were affordable to many people, unlike individual horses and horse drawn carriages. Over nearly all of the next century, transit shaped the city. Services were expanded and improved. Electric streetcars and interurbans appeared. If the Census Bureau had asked a “journey to work” question in the 1900 census, the answers would have shown transit’s share of mechanized to be virtually 100 percent.

    During this period, transit shaped the dominant downtowns (central business districts or CBDs), as is chronicled by Robert Fogelson in Downtown: Its Rise and Fall: 1880-1950. Transit lines converged on the CBD, which was the key to its emergence as the central point of a monocentric city. Transit retained its primacy through much of the 1910s, as people who worked downtown were able to move further away.

    The Automobile City

    But, just as the transit city was peaking, the car began its ascent, with automobile ownership expanding rapidly in the 1920s. By 1929, 90 percent of the world’s car registrations were in the United States, according to Northwestern University economist Robert Gordon. All of this made it possible to travel farther in urban areas and to live even farther from the urban core.

    After the Great Depression and World War II, which slowed growth, automobile ownership expanded even more. By 1950, New York region’s urban density had dropped below 10,000 per square mile and the average density among the principal urban areas in today’s 53 major metropolitan areas (more than 1,000,000 population) was approximately 6,000 per square mile. By 2010, New York’s urban density had dropped to 5,300, and Los Angeles had become the densest at 7,000. The average of the principal urban areas to 3,100.

    Polycentricity’s Short Interlude

    The dominance of the automobile ended much of the need for a CBD. As people moved farther away (suburbanized), employment and commercial development also suburbanized. Large retail shopping centers appeared throughout the suburbs. Soon after, large employment centers developed outside the downtowns, such as Bellevue (Seattle), Uptown (Houston), Century City (Los Angeles) and Research Triangle (Raleigh-Durham). In 1991 Joel Garreau first brought centers like this to public attention, coining the term “edge city” in his book Edge Cities: Life on the New Frontier. It had become clear to those who were paying attention that the monocentric, CBD oriented US city was a thing of the past. There were still CBDs, of course, but most were shadows of their former selves in employment and shopping shares. American cities were increasingly referred to as “polycentric.”

    Dispersion: The New Urban Form

    But polycentricity did not last very long. In 1997, University of Southern California economists Peter Gordon and Harry W. Richardson noted the trend toward dispersion in Beyond Polycentricity: The Dispersed Metropolis, Los Angeles, 1970-1990. In a 1998 Brookings Institution paper, they highlighted one of the most important advantages of dispersion. Traffic “doomsday” forecasts, for example, have gone the way of most other dire predictions. Why? Because suburbanization has turned out to be the traffic safety valve. Increasingly footloose industry has followed workers into the suburbs and exurban areas and most commuting now takes place suburb-to-suburb on faster, less crowded roads.”

    Further evidence came in 2003 from University of Nevada Las Vegas Professor Robert Lang who documented the dispersion of office space outside the CBDs in Edgeless Cities: Exploring the Elusive Metropolis.

    Finally, Bumsoo Lee (now at the University of Illinois, Champaign-Urbana) and Peter Gordon published Urban Spatial Structure and Economic Growth in US Metropolitan Areas which looked at 2000 census tract data and classified employment based on job density into three categories, CBDs, subcenters and dispersed.

    Among metropolitan areas with more than 500,000 population, all had most of their employment outside CBDs and subcenters. In other words, all metropolitan areas were more dispersed than polycentric or monocentric. Further, in the largest metropolitan areas, more than twice as many jobs were in subcenters as the CBDs (Figure 1).

    • Among metropolitan areas with more than 3,000,000 residents, 77.9 percent of employment was dispersed, 15.0 percent in subcenters and 7.1 percent in CBDs.

    • Among metropolitan areas with from 1,000,000 to 3,000,000 residents, 82.2 percent of employment was dispersed, 7.0 percent in subcenters and 10.8 percent in CBDs.

    • Among metropolitan areas with from 500,000 to 1,000,000 residents, 82.6 percent of employment was dispersed, 5.6 percent in subcenters and 12.2 percent in CBDs.

    Unfortunately, this research has not been updated with the results of the 2010 census. But, there is every reason to believe that the dispersion continued. A City Sector Model (Figure 2) analysis of County Business Pattern data suggests that the dispersion has continued (Figure 3). Between 2000 and 2015, 90 percent of new jobs were in the suburbs and exurbs. The largest gains were in the Later Suburbs and Exurbs, while there were losses in the Urban Core Inner Ring and the Earlier Suburbs. While there was an increase in CBD employment, exurban job growth was nearly twice as great.

    This reality of the dispersed city, however, does not get in the way of media and others who talk as if the city remains monocentric. Yet in an era of new possibilities unleashed by technology — Uber, Lyft, autonomous vehicles — the likely trajectory is for more dispersion not less.

    Wendell Cox is principal of Demographia, an international public policy and demographics firm. He is a Senior Fellow of the Center for Opportunity Urbanism (US), Senior Fellow for Housing Affordability and Municipal Policy for the Frontier Centre for Public Policy (Canada), and a member of the Board of Advisors of the Center for Demographics and Policy at Chapman University (California). He is co-author of the “Demographia International Housing Affordability Survey” and author of “Demographia World Urban Areas” and “War on the Dream: How Anti-Sprawl Policy Threatens the Quality of Life.” He was appointed to three terms on the Los Angeles County Transportation Commission, where he served with the leading city and county leadership as the only non-elected member. He served as a visiting professor at the Conservatoire National des Arts et Metiers, a national university in Paris.

    Top photo: Los Angeles, CBD, polycentric (Wilshire district, Hollywood and Glendale) and dispersed (the rest), by author.

  • America’s Most Suburbanized Cities

    Recently, The Wall Street Journal and Newsday, in a photographic spread, trumpeted the 70th anniversary of Levittown, the New York suburban development that provided the model for much of the rapid suburbanization that occurred after the Second World War in the United States. Levittown’s production line building also set the stage for the similar suburbs of cities in Canada, Australia, New Zealand and elsewhere.

    Over the last seven decades, the United States has become a predominantly suburban nation. In 2011-2015, 85 percent of the population in the 53 major metropolitan areas (over 1,000,000 population) lived in the suburbs or exurbs. This is based on analysis at the small area level (zip code tabulation areas) from the American Community Survey that classifies population based on demographic data (Figure 1).

    Generally similar findings have been made about Canada and Australia by research teams led by Professor David L. A. Gordon of Queen’s University in Kingston, Ontario. Gordon and his Canadian team pioneered this type of analysis, which is not dependent on core municipality versus surrounding area analysis. Core municipalities often do not reflect the realities of metropolitan areas because they vary so greatly in their share of metropolitan area population. For example, the city of Atlanta has only 8 percent of the metropolitan area population, while San Antonio has more than 60 percent of the metropolitan area population.

    Suburban Nation: United States

    Many people, including urban analysts, are unaware of the extent to which American cities have become suburbanized. But the former mono-centricity that characterized most metropolitan areas at the end of World War II has been replaced first by multi-centered suburban employment development (polycentricity) and more recently by dispersion of employment. As early as 2000, more people worked in dispersed worksites in the major metropolitan areas, including New York, than in the downtowns (CBD’s) and suburban office centers, according to research by Bumsoo Lee and Peter Gordon. City Sector Model analysis shows that CBDs lost two percent of their market share from 2000 to 2015, based on a City Sector Analysis of County Business Patterns data. It seems likely that the trend of dispersion has continued (Figure 2).

    We took a look at the population distribution of the 53 major metropolitan areas (those with more than 1,000,000 population) to rate down by the extent to which they are suburban. The City Sector Model classifies the population of any area where there is an employment density of 20,000 or more as a CBD considers the urban core inner ring to have population densities exceeding 7500 per square mile. Such densities were characteristic of pre-automobile urban areas in the United States. According to estimates prepared by the Urban Land Institute, in 1920 the 24 urban areas with more 250,000 residents had an average population density of 7500.

    As it turns out, 10 metropolitan areas have virtually no urban core population by this definition. To rank these metropolitan areas by their extent of suburbanization, we broke the 10 way tie by ranking the metropolitan areas by the extent of their exurban population. Exurban areas have very low population densities (250 per square mile or less) and are generally outside the urban area, which includes all contiguous built up area, surrounded by rural territory.

    Seven of the 10 most suburban cities are in three states. Three are in Florida and two each in North Carolina and Arizona. They are listed in the Table 1, and data is provided for all 53 in Table 2.

    Table 1
    Most Suburban Cities: (Metroplitan Areas)
    1 Charlotte, NC-SC
    2 Riverside-San Bernardino, CA
    3 Raleigh, NC
    4 Orlando, FL
    5 Birmingham, AL
    6 Jacksonville, FL
    7 Phoenix, AZ
    8 San Antonio, TX
    9 Tampa-St. Petersburg, FL
    10 Tucson, AZ
    Out of 53 with more than 1,000,000 population

    The Most Suburban: Charlotte, NC-SC

    Charlotte turns out to be the country’s most suburban metropolitan area. The exurban commuting patterns of Charlotte expanded substantially over the 2000 to 2010 decade, which resulted in the largest geographic expansion of any major metropolitan area. Its exurban population is 51 percent and its urban population density is approximately 1,700.

    2nd Most Suburban: Riverside-San Bernardino, CA

    Second ranked Riverside-San Bernardino, which in many ways is an extension of the Los Angeles metropolitan area (and is included in the Los Angeles combined statistical area), ranked as the second most suburban city. However, like other California cities, Riverside-San Bernardino is comparatively dense as an urban area, ranking above both Chicago and world renown densification model Portland as the 11th densest major urban area in the nation.

    3rd Most Suburban: Raleigh, NC

    At the opposite end of the density scale is third ranked Raleigh, a high tech center with an exurban population of 42 percent. Raleigh has an urban area population density of approximately 1,700, about the same as top ranked Charlotte and 16th ranked Atlanta.

    4th Most Suburban: Orlando, FL

    Fourth ranked Orlando has an exurban population of 34 percent and is suburban by nature. This is not surprising considering that it is virtually all new, having principally been developed since Walt Disney World made its decision to locate there and other entertainment venues followed.

    5th Most Suburban: Birmingham, AL

    Fifth ranked Birmingham, Alabama’s largest city, had far slower growth than most major metropolitan areas of the South. In 1950, the metropolitan population was approximately 20 percent behind Atlanta, according to the 1950 census. Now, virtually all-suburban Atlanta has grown to nearly 5 times that of Birmingham since that time. Even so, Birmingham has expanded to have the lowest density of any principal urban area in a major metropolitan area.

    6th Most Suburban: Jacksonville, FL

    Sixth ranked Jacksonville, another all-suburban metropolitan area has an exurban population of 25 percent.

    7th Most Suburban: Phoenix, AZ

    Phoenix, like Orlando is virtually all a postwar product. With its 100 percent suburban population, 19 percent of it is in the exurbs ranking Phoenix as seventh most suburban. Phoenix is the largest among the all-suburban cities, with more than 4.6 million residents and is likely to displace San Francisco to become the nation’s 11th largest metropolitan area this year, and could take 10th position away from Boston by the 2020 Census.

    8th Most Suburban: San Antonio, TX

    San Antonio, ranked as eighth most suburban, with an exurban population of 17 percent.

    9th Most Suburban: Tampa-St. Petersburg, FL

    Tampa – St. Petersburg ranks as the ninth most suburban city, with a 14 percent exurban population. Like San Antonio, Tampa has a comparatively strong downtown area, but its inner densities do not reach the levels necessary for population to be classified as urban core.

    10th Most Suburban: Tucson, AZ

    Tucson, the newest entry among the nations 53 major metropolitan areas takes the 10th position and rounds out the cities that are 100 percent suburban.

    Other Cities

    Nashville and San Jose ranked 11th, but are very different. Nashville, as the capital of Tennessee, has a comparatively strong CBD, but the urban area is one of the least dense. On the other hand, San Jose, which is really an extension of the San Francisco metropolitan area and a part of the San Francisco Bay combined statistical area has a weak CBD, but a very high urban area density. San Jose ranks after only Los Angeles and San Francisco in its urban density and ahead of the sprawling New York urban area.

    There are a total of 34 metropolitan areas that are 95 percent or more suburban. These include examples such as Atlanta, at 99.2 percent San Diego at 98.9 percent Sacramento at 98.3 percent, Austin and 97.9 percent, Denver at 96.9 percent and Portland at 90.0 percent.

    Los Angeles, with the nation’s densest urban area, is 89.4 percent suburban, nearly matched by Seattle’s 89.3 percent.

    A number of older cities are overwhelmingly suburban as well, such as St. Louis at 88.4 suburban, Minneapolis-St. Paul at 86.8 percent, Washington at 83.3 percent, and Milwaukee at 76.6 percent. Chicago, Philadelphia, Providence, San Francisco – Oakland and Buffalo are all more than 70 percent suburban.

    Boston and New York are considerably less suburban than the other 51 major metropolitan areas. Boston is 64.3 percent suburban, while New York is the only major metropolitan area that has a larger urban core population than its suburban and exurban area. New York is only 46.7 percent suburban.

    Fast Growing and Automobile Oriented

    As with all suburban areas, these suburban cities are automobile oriented. The journey to work transit market shares average 1.7 percent, one third of the national average for all areas. They are also among the fastest growing, with six ranking in the top 10 for 2010 to 2016 growth. A close look shows that the American urban form is changing, but not in ways commonly discussed among planners, urban land speculators and many academics.

    Table 2
    Cities (Metropolitan Areas) Ranked by Extent of Suburbanization
    Major Metropolitan Areas: 2011-2015
    Share (%) of Metropolitan Population by Sector
    Rank Metropolitan Area % Suburban CBD Urban Core: Inner Ring Earlier Suburbs Later Suburbs Exurbs
    1 Charlotte, NC-SC 100.0% 0.0% 0.0% 10.2% 39.2% 50.6%
    2 Riverside-San Bernardino, CA 100.0% 0.0% 0.0% 28.9% 29.6% 41.5%
    3 Raleigh, NC 100.0% 0.0% 0.0% 7.4% 56.8% 35.8%
    4 Orlando, FL 100.0% 0.0% 0.0% 15.7% 50.6% 33.7%
    5 Birmingham, AL 100.0% 0.0% 0.0% 41.6% 25.2% 33.2%
    6 Jacksonville, FL 100.0% 0.0% 0.0% 25.6% 49.0% 25.4%
    7 Phoenix, AZ 100.0% 0.0% 0.0% 29.1% 52.0% 18.9%
    8 San Antonio, TX 100.0% 0.0% 0.0% 38.6% 44.1% 17.3%
    9 Tampa-St. Petersburg, FL 100.0% 0.0% 0.0% 44.2% 41.7% 14.1%
    10 Tucson, AZ 100.0% 0.0% 0.0% 46.9% 41.0% 12.2%
    11 Nashville, TN 99.8% 0.2% 0.0% 24.4% 36.9% 38.5%
    12 San Jose, CA 99.8% 0.1% 0.1% 77.5% 9.3% 13.0%
    13 Houston, TX 99.6% 0.4% 0.0% 33.2% 50.0% 16.4%
    14 Dallas-Fort Worth, TX 99.5% 0.2% 0.3% 33.7% 43.1% 22.7%
    15 Virginia Beach-Norfolk, VA-NC 99.5% 0.0% 0.5% 45.9% 38.0% 15.7%
    16 Atlanta, GA 99.2% 0.2% 0.6% 14.8% 70.8% 13.6%
    17 San Diego, CA 98.9% 0.0% 1.1% 61.3% 30.9% 6.7%
    18 Sacramento, CA 98.3% 0.0% 1.7% 37.7% 40.9% 19.8%
    19 Memphis, TN-MS-AR 98.1% 0.0% 1.9% 39.9% 35.3% 23.0%
    20 Austin, TX 97.9% 0.4% 1.7% 15.4% 63.0% 19.6%
    21 Las Vegas, NV 97.6% 0.4% 2.0% 16.2% 77.7% 3.8%
    22 Oklahoma City, OK 97.2% 0.4% 2.4% 34.1% 32.6% 30.6%
    23 Miami, FL 97.1% 0.3% 2.6% 50.0% 44.8% 2.4%
    24 Denver, CO 96.9% 0.5% 2.7% 42.7% 42.7% 11.4%
    25 Grand Rapids, MI 96.5% 0.0% 3.5% 33.0% 15.4% 48.0%
    26 Salt Lake City, UT 96.5% 0.0% 3.5% 47.9% 39.2% 9.3%
    27 Richmond, VA 95.6% 0.0% 4.4% 38.5% 38.4% 18.6%
    28 Columbus, OH 95.3% 0.0% 4.7% 28.5% 38.6% 28.3%
    29 Indianapolis. IN 95.0% 0.3% 4.6% 27.3% 42.6% 25.2%
    30 Kansas City, MO-KS 94.8% 0.2% 5.0% 37.5% 26.9% 30.4%
    31 Detroit,  MI 93.7% 0.1% 6.1% 60.2% 16.6% 17.0%
    32 Louisville, KY-IN 91.2% 0.5% 8.3% 44.5% 26.0% 20.8%
    33 Cincinnati, OH-KY-IN 90.0% 0.6% 9.4% 40.3% 27.9% 21.8%
    34 Portland, OR-WA 90.0% 0.7% 9.3% 36.0% 39.7% 14.3%
    35 Los Angeles, CA 89.4% 0.4% 10.1% 76.1% 5.3% 8.0%
    36 Seattle, WA 89.3% 1.1% 9.7% 35.9% 40.7% 12.6%
    37 New Orleans. LA 89.1% 0.2% 10.7% 50.3% 7.0% 31.8%
    38 Hartford, CT 88.7% 0.1% 11.2% 77.4% 1.0% 10.3%
    39 Rochester, NY 88.6% 0.3% 11.1% 46.8% 7.9% 34.0%
    40 St. Louis,, MO-IL 88.4% 0.1% 11.5% 39.6% 26.1% 22.7%
    41 Minneapolis-St. Paul, MN-WI 86.8% 0.5% 12.7% 31.4% 33.7% 21.7%
    42 Baltimore, MD 84.3% 1.4% 14.3% 42.0% 20.6% 21.8%
    43 Pittsburgh, PA 84.1% 1.3% 14.5% 56.0% 5.0% 23.1%
    44 Washington, DC-VA-MD-WV 83.3% 1.6% 15.1% 28.2% 36.6% 18.4%
    45 Cleveland, OH 78.3% 0.0% 21.7% 48.5% 13.6% 16.2%
    46 Milwaukee,WI 76.6% 1.6% 21.7% 50.7% 10.5% 15.4%
    47 Chicago, IL-IN-WI 74.2% 1.2% 24.6% 44.9% 18.5% 10.8%
    48 Philadelphia, PA-NJ-DE-MD 74.1% 0.9% 25.0% 50.5% 15.1% 8.5%
    49 Providence, RI-MA 73.9% 0.6% 25.5% 47.9% 2.8% 23.1%
    50 San Francisco-Oakland, CA 73.0% 3.3% 23.7% 54.0% 7.6% 11.4%
    51 Buffalo, NY 71.0% 0.3% 28.7% 51.3% 3.1% 16.6%
    52 Boston, MA-NH 64.3% 3.2% 32.5% 48.6% 3.6% 12.2%
    53 New York, NY-NJ-PA 46.7% 6.5% 46.8% 35.2% 5.5% 6.0%
    Derived from American Community Survey using City Sector Model


    Wendell Cox is principal of Demographia, an international public policy and demographics firm. He is a Senior Fellow of the Center for Opportunity Urbanism (US), Senior Fellow for Housing Affordability and Municipal Policy for the Frontier Centre for Public Policy (Canada), and a member of the Board of Advisors of the Center for Demographics and Policy at Chapman University (California). He is co-author of the “Demographia International Housing Affordability Survey” and author of “Demographia World Urban Areas” and “War on the Dream: How Anti-Sprawl Policy Threatens the Quality of Life.” He was appointed to three terms on the Los Angeles County Transportation Commission, where he served with the leading city and county leadership as the only non-elected member. He served as a visiting professor at the Conservatoire National des Arts et Metiers, a national university in Paris.

    Top photograph: Exurban Charlotte, by author.

  • The Evolving Urban Form: Prague

    Prague is the capital of Czechia, a nation most readers have probably never heard of. Last year, the Czech Republic adopted a new name that does not reveal its governance structure (republic). The new name has not enjoyed widespread acclaim. The union of Czechoslovakia, which dates from the end of World War I, split peacefully in 1993, resulting in the creation of Czech Republic and Slovakia.

    Prague, like its central and eastern European cousins, Warsaw, Budapest and Bucharest, has experienced substantial decentralization of its population following the collapse of communism. As economies improved and more housing choices opened up, many residents opted to move to outer parts of the core cities or even beyond to suburban and exurban areas.

    Today, the municipality of Prague has approximately 100,000 more residents than in 1980. Yet, the distribution of the population is quite different than before. Then, the central and inner districts of the city had a population of approximately 980,000, while the outer districts were home to 200,000. The latest Czech Statistical Office estimates (for January 1, 2017) show the center and inner districts have declined to approximately 785,000 residents. The city’s outer districts have experienced all of the population increase, more than doubling to above 460,000.

    Meanwhile, two-thirds of the growth (Graphic 1) has been in the suburbs of the Středočeský region (Central Bohemia), which surrounds Prague (Graphic 2).

    The Historic Inner District

    Prague’s central district (District 1) comprises the pre-transit walking core of the city. It stretches across the Vltava River (Smetana’s “The Moldau”) from Wenceslaus Square across the Charles Bridge to Prague Castle, the site of St. Vitus Cathedral. The district also includes the Old Town Square. The population of District 1 dropped from 53,000 in 1980 to 29,000 in 2017, a decline of 44 percent.

    The most recent historic events have virtually all taken place in District 1. The 1968 revolt against Soviet control occurred in Wenceslaus Square and was put down by Warsaw Pact military action and tanks, with a loss of 500 Czechoslovakian citizens.

    This was the end of Alexander Dubček’s “Prague Spring” attempt to liberalize communism. Dubček rose from head of the Slovak communist party to leader of the Czechoslovakian communist government. Dubček, however, was luckier than Imre Nagy of Hungary, the communist leader who paid for his liberalizing tendencies by being executed after the 1956 rebellion.

    Wenceslaus Square, named after St. Wenceslaus, Duke of Bohemia, was also the center of the “Velvet Revolution”. Led by Václav Havel, he became Czechoslovakia’s first president following the fall of communism. The communist parliament building (Graphic 3) played a major role, as described by prague-stay.com:

    “This Communist eyesore, loathed by many, loved by few was built after the old Exchange building was destroyed from 1966 – 1973. This glass monstrosity with its two giant pillars is still complete with nuclear shelters. The demands of the Velvet Revolution were accepted here in 1989 and the building was once home to Radio Free Europe who rented the location from former president Vaclav Havel for a very small fee per year (rumor has it that the fee was 1 CZK).”

    I watched Dubček, an unsurprising supporter of the Velvet Revolution, from the building’s gallery in his role as chairman of the national parliament in 1991. Soon after, the national parliament relocated from the building, which is now part of the National Museum. The main building is shown in the top photograph (my photo was not used because of the present scaffolding being used in its refurbishment).

    There is a memorial to victims of the 1968 Warsaw Pact action in front of the main building (Graphic 4), with a barbed wire wreath. Graphics 5 to 7 are also of Wenceslaus Square, which some travel guide books point out is more of a boulevard than a square.

    Old Town Square is shown in Graphics 8 to 12. Charles Bridge is illustrated in Graphics 13 to 16. This historic bridge was built between 1357 and 1402. The approach to Prague Castle and related views are in Graphics 17 to 21. Other views of the inner district are in Graphic 22 (the National Theatre) and Graphic 23.

    Inner and Outer Districts of Prague

    The inner districts (2 through 10) were mainly developed during the mass transit area. The outer districts, where all the city’s growth has occurred, have generally lower population densities. There are some detached houses in the outer districts. Besides the historical buildings, Prague, like other European cities, is in many ways spatially dominated by the automobile, with its narrow, crowded streets and parking on sidewalks. (Graphics 24 to 27).

    The Suburbs

    The Středočeský region surrounds Prague and contains both suburban and exurban development (Graphics 28 to 36), including new construction (Graphics 30 to 36). The Středočeský suburbs exhibit a high quality of suburban infrastructure for eastern Europe, including sidewalks in most cases and curbs. However, the quality of the visible suburban infrastructure falls considerably short of that enjoyed by suburban residents of the United States, Canada, Australia, and New Zealand, where for decades nearly all suburban development has included these features, as well as streets wide enough for parking and cars to pass one-another in opposite directions.

    The Prague Area: Dominating Czechia’s Population Growth

    As is occurring in Tokyo-Yokohama and Budapest, the Prague area is capturing nearly all the national growth, at 86 percent. This includes 58 percent in the suburbs and 28 percent in the outer districts. This is a far greater percentage than Prague’s 25 percent of the population in 1980. (Graphic 37).

    Prague’s Popularity

    For nearly three decades, Prague has been the capital of a nation free to set its own course, the longest period since the 1918 establishment of Czechoslovakia. Prague has become particularly popular among foreign tourists. Trip Advisor ranked Prague 5th among the cities of Europe last year, trailing London, Paris, Rome and Barcelona and ninth in the world. It is no minor accomplishment to edge out cities like Vienna, Amsterdam, and Budapest.

    Wendell Cox is principal of Demographia, an international public policy and demographics firm. He is a Senior Fellow of the Center for Opportunity Urbanism (US), Senior Fellow for Housing Affordability and Municipal Policy for the Frontier Centre for Public Policy (Canada), and a member of the Board of Advisors of the Center for Demographics and Policy at Chapman University (California). He is co-author of the “Demographia International Housing Affordability Survey” and author of “Demographia World Urban Areas” and “War on the Dream: How Anti-Sprawl Policy Threatens the Quality of Life.” He was appointed to three terms on the Los Angeles County Transportation Commission, where he served with the leading city and county leadership as the only non-elected member. He served as a visiting professor at the Conservatoire National des Arts et Metiers, a national university in Paris.

    Top photograph: National Museum. Main building. By Jorge Láscar [CC BY-SA 2.0], via Wikimedia Commons

  • The Evolving Urban Form: Budapest

    The Budapest area has lost population overall since 1980, having fallen from 3.03 million to 2.99 million in 2016, according to Hungarian Central Statistical Office data as reported by citypopulation.de (Graphic 1). This 1.3 percent loss is smaller than the national population loss over the same period of 8.2 percent. Moreover, during the last five years, the Budapest area is estimated to have gained 1.7 percent, even as Hungary lost 1.1 percent. In this regard, the trend in Budapest has been similar to that of Warsaw, with stronger population growth than in the nation as a whole, but at the same time greater population growth outside the urban core.

    The Budapest area described in this article includes two of Hungary’s county level jurisdictions (megyék), the core municipality of Budapest and Pest, which surrounds Budapest with inner and outer suburbs. Each of the county level jurisdictions is further divided into districts.

    Urban Core Districts

    Budapest’s center spans the Danube River and includes District I (former Pest) and District V (former Buda). These districts largely encompassed the “walking city” that existed before the coming of transit in the 18th century. Walking cities have especially high densities, and were subject to huge population losses when after transit and the automobile arrive. For example, from 1860 to 2010, core walking arrondissements (I through IV) of the ville de Paris have lost nearly 75 percent of their population (earlier comparisons are not readily available because new arrondissement boundaries were adopted in 1860).

    Similarly, since 1980, the former walking center of Budapest has lost 44 percent of its population. The largest loss occurred in the decade following the exit of Soviet influence, between 1990 and 2001. Over the past five years, these two districts have experienced a small population reversal, having increased approximately four percent.

    On the east side of the Danube, there are a number of high density districts adjacent to District V (Districts VI, VII, VIII, IX, X and XIII). These largely developed in the mass transit era and have suffered less serious losses. Since 1980, these districts have loss 29 percent of their population. Again, the greatest declines were between 1990 and 2001. However, modest losses continue and the most recent five year loss more than offset the gains noted above in the inner core districts.

    Budapest’s urban core is renowned for its magnificent buildings, largely from the 19th century. Its core is a feast of architecture rivaling such urban showpieces as Paris, Barcelona and Buenos Aires.

    The urban core of Budapest includes the Royal Palace (Graphic 2) on the west side of the river and Parliament on the east side. There is the notable ‘Chain Bridge,” which opened in 1848 and still handles pedestrian, transit and highway traffic (Graphic 3).

    Parliament was completed in 1904, when Budapest was one of the two capitals of the Austrian-Hungarian Empire, under the dual monarchy (top photograph and Graphics 4 and 5). It is, in my view, one of the most distinctive seats of government in the world, having features that resemble those of the Palace of Westminster in London and a dome resembling that of the U.S. Capitol. Its distinctive reddish roofs are seen in current river cruise PBS television commercials.

    The Parliament is in Kussuth Square (Graphics 6 and 7), which was at the heart of the 1956 rebellion against Soviet rule, which resulted in a death toll of 2,500, followed by the loss of 200,000 refugees. There is now a memorial to the event below Kussuth Square, with exhibits tied together by a lighted red line symbolizing the bloody event (Graphic 8).

    The urban core also includes the Opera House that reminds one of the Garnier Opera in Paris. There are many more examples of ornate architecture, principally from the 19th century (Graphics 9 to 17), extending to “Heroes Square,” where Imre Nagy, Chairman of the Council of Ministers of the Hungarian People’s Republic (the national leader) was reburied, after having been executed for leadership of the 1956 rebellion.

    Other City Districts

    The other 15 districts of Budapest have lost six percent of their population since 1980. These districts are newer, have lower population densities and are more automobile oriented (Graphic 18). However, since 2011, these districts experienced a three percent increase. The other districts have more than 70 percent of Budapest’s population, and this increase was enough to produce an overall two percent increase for Budapest county between 2011 and 2016. Even so, Budapest county has lost 15 percent of its population since 1980.

    The Suburbs (Pest County)

    The only part of the Budapest area that has grown since 1980 is Pest County, with its inner and outer suburbs (Graphics 19 and 20). Overall, Pest County has grown 27 percent. The eight inner suburban counties experienced the bulk of the growth, adding 50 percent, while the 10 outer suburban counties added four percent to their population.

    In the Soviet era, high rise apartment blocks were the rule, while there was little construction of detached housing. Following the Soviet exit, suburbanization developed rapidly, with considerable single family detached housing construction (Graphics 21 to 22). Houses continue to be under construction, both in existing suburban areas and in greenfield areas (Graphics 23 to 28), some in the Buda Hills, with stunning views of the city. This greenfield development appears to have stronger infrastructure regulations, illustrated by unusually wide (for Europe) suburban roadways and complete sidewalk development, even before house construction begins (Graphic 29).

    Progress in Budapest

    Hungary faces serious challenges, particularly due to its substantial population losses. Yet, as in the case of Tokyo-Yokohama, a national capital in a nation losing population can prosper by capturing nearly all of the nation’s growth. This is also the reality in the Budapest region, where recent modest population gains have been achieved, even as the nation continued to lose population. Over the last three decades, Budapest has moved quickly from the excessive political and economic controls to a new future of people-centered modernity that the more fortunate cities in North America, Europe and Oceania were able to embrace much earlier.

    Wendell Cox is principal of Demographia, an international public policy and demographics firm. He is a Senior Fellow of the Center for Opportunity Urbanism (US), Senior Fellow for Housing Affordability and Municipal Policy for the Frontier Centre for Public Policy (Canada), and a member of the Board of Advisors of the Center for Demographics and Policy at Chapman University (California). He is co-author of the “Demographia International Housing Affordability Survey” and author of “Demographia World Urban Areas” and “War on the Dream: How Anti-Sprawl Policy Threatens the Quality of Life.” He was appointed to three terms on the Los Angeles County Transportation Commission, where he served with the leading city and county leadership as the only non-elected member. He served as a visiting professor at the Conservatoire National des Arts et Metiers, a national university in Paris.

    Top photograph: Parliament from across the Danube (by author).

  • The Evolving Urban Form: Warsaw

    Like other major cities in the high income world, Warsaw has seen central area population losses, with all of the population growth taking place outside the urban core, principally in the suburbs and exurbs (Graphic 1). The city’s districts were reconfigured so that direct comparisons cannot be made before the 2002 census.

    The Warsaw region consists of the city of Warsaw, a county-level national jurisdiction (powiat) and seven powiats in the suburbs and nine in the exurbs. The Warsaw region grew from 3.31 million residents in 2002 to 3.58 million in 2016, a 0.5 percent annual growth rate. Warsaw’s slow growth is substantially faster than that of the nation, which has not gained in population since 2002, both as a result of a below-replacement fertility rate and migration to other parts of Europe.

    The Central District

    The central district (Śródmieście), which includes the central business district (CBD) and the central railway station (Warszawa Centralna) experienced a loss in population of 14 percent from the 2002 census to 2016, according to the Central Statistical Office of Poland.

    The skyline of Warsaw (Graphic 2) used to be dominated by the Palace of Culture and Science, which was constructed as a “gift” to the Polish people from Soviet leader Josef Stalin in the early 1950s (though completed after his death). It is sometimes called the “Eighth Sister,” referring to its similarity to the “seven sisters” in Moscow that share a very similar “wedding cake” design. Like Moscow State University and Ukraina Hotel buildings in the Russian capital, the Palace of Culture and Science is fully symmetric from the base up. The Palace is located at the very center of Warsaw, adjacent to Warszawa Centralna and even has suburban rail entry structures in the surrounding green area.

    The building spent decades as a reviled reminder of Soviet domination and the restrictions imposed under Soviet communism. When the Poles took control of their own destiny about 28 years ago, there was considerable pressure to dismantle the Palace as many felt it was a symbol of oppression. The parliament defeated a measure to demolish the building, despite significant public pressure. Today, the Palace seems to have been, at least reluctantly accepted. It is now impressively lighted at night.

    Since that time, the building has had a significant change in function. The building now houses offices, a museum, university facilities, the Polish Academy of Sciences, a fitness center and other functions. Even so, some people will still tell you that the best place to see Warsaw from is the Palace of Culture and Science, because it is the one place from which you cannot see the building. However, the view from the top is certainly worthwhile (Graphics 3-8).

    A number of new, modern skyscrapers have been built, principally to the west. The buildings, however, are not closely packed, as would be expected in an American, Canadian, or Australian central business district. Graphic 9 shows the skyline, with the Palace of Culture and Science in the center and other large buildings around it. The distribution of Warsaw’s post-Soviet commercial high rises is similar throughout both the central districts and the inner districts, widely spaced and reflecting a modern metropolitan area that has become much more automobile oriented.

    The central district also includes the intersection of (Pope) Jana Pawla II and Solidarity (the trade union led by Poland’s first post-Soviet president, Lech Walesa), boulevards named for two of the strongest forces responsible for separation from control by the Soviet Union and restoration of Polish independence (photograph at the top). Significantly, one of the corners of the intersection is occupied by a McDonald’s, one of the most obvious symbols of the market economy that Poland has embraced.

    The central district also includes the “old town,” which like most of Warsaw was reduced to rubble by the bombing and street battles of World War II, including the premeditated destruction of the city by retreating German forces. It has been painstakingly rebuilt as it was before (Graphic 10).

    Other Districts of Warsaw

    The inner ring of districts, each of which borders on Śródmieście, lost eight percent of its population between 2002 and 2016. These six districts include Mokotów, Ochota, Praga Północ, Praga Południe, Wola and Żoliborz.

    The outer city districts gained 13 percent in population. Their nearly 120,000 gain more than offset the 60,000 loss in the inner ring districts and the 20,000 loss in the central district.

    Suburbs and Exurbs

    The inner suburban powiats captured most of the growth, growing 20 percent, and adding 182,000 residents. Growth in the outer nine counties was much less, at three percent and 20,000. Nearly 85 percent of the Warsaw area’s population growth occurred in these suburban and exurban areas (Graphics 11 and 12).

    The suburban and exurban residential areas are comparatively sparsely developed. Development is more contiguous in the inner ring of suburbs and much less dense exurbs of the outer ring (Graphics 13-16). Many suburban and exurban residential streets are far narrower and often without sidewalks and curbs. The suburban infrastructure generally appears to be of a lower standard than is found in the suburban areas of Australia, Canada and the United States, where larger individual developments have been required to install wide streets, sidewalks and usually sewers, as opposed to the generally smaller or even individually developed parcels that are more evident in suburban Warsaw.

    Nevertheless, Warsaw, and Poland, are developing rapidly. Real gross domestic product per capita in the nation has increased by at least three times since 1990. The shopping centers of Warsaw look very much like others in the core of western Europe, and even similar to those in Canada and the United States. The nation is constructing a high-speed motorway system, which has among the highest posted speeds in the world, at 140 kilometers per hour (87 miles per hour), though a number of important segments remain to be built. After many difficult decades, Warsaw and Poland are truly a part of modern Europe.

    Wendell Cox is principal of Demographia, an international public policy and demographics firm. He is a Senior Fellow of the Center for Opportunity Urbanism (US), Senior Fellow for Housing Affordability and Municipal Policy for the Frontier Centre for Public Policy (Canada), and a member of the Board of Advisors of the Center for Demographics and Policy at Chapman University (California). He is co-author of the “Demographia International Housing Affordability Survey” and author of “Demographia World Urban Areas” and “War on the Dream: How Anti-Sprawl Policy Threatens the Quality of Life.” He was appointed to three terms on the Los Angeles County Transportation Commission, where he served with the leading city and county leadership as the only non-elected member. He served as a visiting professor at the Conservatoire National des Arts et Metiers, a national university in Paris.

    Top Photograph: Street signs at the intersection of Jana Pawla II and Solidarity, named respectively for their roles in securing independence from the Soviet bloc (Pope John Paul II and the Solidarity Trade Union, led by eventual President Lech Walesa). By author.

  • Driving Alone Hits High, Transit Hits Low in “Post-Car” City of Los Angeles

    According to The New York Times, the car used to be “king” in the city (municipality) of Los Angeles. “’A Different Los Angeles’, The City Moves to Alter its Sprawling Image,” was another story that seeks to portray the nation’s second largest municipality as having fundamentally changed. Following this now popular meme, a Slate story in 2016 referred to Los Angeles becoming “America’s next great transit city.” Los Angeles has surely become America’s greatest transit tax city, with Los Angeles County voters in 2016 approving a fourth half-cent sales tax increase principally for transit since 1980. Yet transit’s market share has fallen, not only in the nation’s largest county but even in the city of Los Angeles.

    The Ascent of Transit: A False Narrative

    The Los Angeles political establishment and media is virtually unanimous in its praise for the now quarter century old rail system. Yet, despite more than $15 billion being spent on rail transit the already meager levels of transit commuting in the city have fallen further, while solo driving has risen to an all time high. Unless platitudes are more important than results, rail’s success is a false narrative. People are driving more and using transit less according to the American Community Survey for 2015.

    The share of city of Los Angeles residents commuting by transit fell from 11.2 percent in 2010 to 9.5 percent in 2015 (Figure 1, note truncated axis). The 2010 figure was the highest decennial census year transit figure in the period starting in 1980. Just five years later, in 2015, however, the city of Los Angeles transit commuting share had fallen below 1980 levels.

    In 1980, 10.8 percent of the city’s commuters used transit, a figure that fell to 10.5 percent just before the initial Long Beach “Blue Line” opened in 1990. While new light rail lines and the Metro (subway) line opened after 1990, transit’s market share fell further, to 10.1 percent by 2010. During the 2000s, transit commuting rose 1.1 percentage points to the 11.2 percent figure, propelled by unprecedented gasoline price increases. But progress was short-lived as the share dropped to 9.5 percent in 2015.

    City of Los Angeles Surge in Driving Alone

    At the same time, commuters were turning even more to driving alone. In 2015, 69.8 percent of work trip access was by solo drivers. This represents a substantial increase from the 66.8 percent drive alone share in 2010. From 1980 to 2010, driving alone edged up slightly, much less than the increase in the last five years. In 1980, 65.1 percent of commuters drove alone. In 1990, a nearly identical 65.2 percent drove alone. In the last five years, driving alone has risen more than the entire previous 30-year increase in the city of Los Angeles.

    The news could get worse. According to new American Public Transportation (APTA) data, total ridership on all Los Angeles County MTA services dropped more than five percent from 2016. The APTA reported decline is astounding, since the highly touted extension of the Expo light rail line to downtown Santa Monica opened in 2016. Even more astounding is that the expensive, at least seven line (counted at radial line ends plus the transverse Green Line) system has added not a soul to transit ridership on the Los Angeles MTA bus and rail system since 1985. Not all MTA service is in the city of Los Angeles, however, the APTA data could presage a further transit market share decline in the city with the American Community Survey data due in the Autumn.

    All of this is consistent with the larger trend in the Los Angeles metropolitan area (which includes Los Angeles and Orange Counties). Overall, the transit work trip market share in the metropolitan area fell from 6.1 percent in 2010 to 5.1 percent in 2015. The MTA 2016 decline is likely to push this figure lower.

    The Illusion of a “Different Los Angeles”

    Yet to read the press and media accounts in Los Angeles, one might be inclined to believe an alternate reality that LA transit is ascendant.

    Christopher Hawthorne, who teaches urban and environment policy at Occidental College told The New York Times that the recent defeat of a development moratorium, along with approval of the transit tax and an affordable housing measure is “a very clear statement from the voters that they want a different Los Angeles.”

    The voters may want a different Los Angeles, but apparently commuters are sufficiently happy with driving and have been for the more than a quarter century since rail transit was restored to Los Angeles. This is not surprising, since the average commuter can reach 60 times as many jobs by car in 30 minutes in the Los Angeles metropolitan area as by transit. (30 minutes is the average one-way commute time in the metropolitan area). Data is not available for the city of Los Angeles (see: “Access in the City”).

    However, it is a generally hopeless task for transit to be an alternative to the automobile, except for trips to and from the urban core (downtown and nearby). The reality is that it could take as much as the total income, every year, of a metropolitan area to provide transit that could effectively compete with the car throughout a metropolitan area for work and other trips.

    Platitudes do not ride, people do. At least with respect to the implied transit ridership increases and forsaken cars, the “different” Los Angeles is an illusion, completely inconsistent with reality.

    Wendell Cox is principal of Demographia, an international public policy and demographics firm. He is a Senior Fellow of the Center for Opportunity Urbanism (US), Senior Fellow for Housing Affordability and Municipal Policy for the Frontier Centre for Public Policy (Canada), and a member of the Board of Advisors of the Center for Demographics and Policy at Chapman University (California). He is co-author of the “Demographia International Housing Affordability Survey” and author of “Demographia World Urban Areas” and “War on the Dream: How Anti-Sprawl Policy Threatens the Quality of Life.” He was appointed to three terms on the Los Angeles County Transportation Commission, where he served with the leading city and county leadership as the only non-elected member. He served as a visiting professor at the Conservatoire National des Arts et Metiers, a national university in Paris.

    Photo: Los Angeles City Hall (by author)

  • Ryerson University Research Cites Urban Containment Policy as Major Factor in Toronto House Price Escalation

    A Globe and Mail article on April 25 cites Ryerson University research found that Ontario’s urban containment based growth controls have "spurred soaring increases in house prices in the Toronto region by limiting construction of new low-rise family homes…" This effect was predicted by a number of analysts when the program was being formulated more than a decade ago and has been associated with huge price increases relative to incomes in such widely distributed metropolitan areas as Vancouver, San Francisco, Portland, Seattle, Sydney, Auckland, Melbourne and others.

    According to reporter Janet McFarland, the Centre for Urban Research and Land Development report identified “’a marked mismatch” between the types of units completed and the types demanded, according to the report from the Centre for Urban Research and Land Development at Ryerson University in Toronto." The report concludes that "The public discussion on the fundamental causes behind the rise in prices of ground-related housing (singles, semis and townhouses) in the GTA over the past decade by ignoring or downplaying the role played by the shortfall of serviced sites available to build new homes misses the only viable solution to dealing with deteriorating longer-term affordability – significantly increasing the number of new ground-related housing units built."

    Over the 13 years of the Demographia International Housing Affordability Survey, Toronto’s housing affordability has substantially worsened, with median prices at 3.8 times median incomes in 2004 (before the growth controls were fully implemented) to 7.7 times in 2016. This measure, the "median multiple," had changed little between 1970 and 2004, when land use regulations were more liberal in the Toronto area.

    Without liberalization of the housing market to permit supply that meets demand (not only in numbers but also in preferred type of housing), Toronto can expect its house prices to rise even more. Already, Vancouver and Sydney, for example are more than 50 percent higher (at median multiples of 11.8 and 12.2 respectively).

  • The 37 Megacities and Largest Cities: Demographia World Urban Areas: 2017

    Many of the world’s biggest cities are getting bigger still. In 2017, the number of megacities — urban areas with better than ten million people —   increased to 37 in 2017, as the Chennai urban area entered their ranks. Chennai becomes India’s fourth megacity, along with Delhi, Mumbai and Kolkota. These are among the major findings in the just released 13th annual edition of Demographia World Urban Areas, which provides population, land area and population density estimates for the 1,040 identified built-up urban areas (cities) in the world. Built-up urban areas are the physical form of the city, a definition which separates out the urban, or constructed form of the city from the rural and smaller town areas with which they form a metropolitan area or labor market (Figure 1).

    The World’s Largest Cities

    Asia increasingly dominates the ranks of the world’s most populous cities. Tokyo-Yokohama continues to be the largest urban area in the world (Figure 2), a ranking it has held for more than six decades. It is estimated the Tokyo Yokohama house a population of 37.9 million, living in approximately 3300 square miles (8,500 square kilometers) with a population density of 11,500 per square mile (4,400 per square kilometer).

    Jakarta is the second largest urban area, with a population of 31.8 million 9,600 per square kilometer). Delhi, India’s capital held onto third position, with a population of 26.5 million. Delhi has now opened up a more than 3.5 million lead on 8th ranked Mumbai, which had been India’s largest urban area before and which some experts had considered likely to become the world’s largest city. This prediction, like a similar ones made with respect to Mexico City in the 1980s has not come to fruition and it seems unlikely that either urban area will ever be, the world’s largest.

    Manila moved up from fifth position to fourth position, passing Seoul-Incheon (Figure 3). Manila’s population is estimated at 24.3 million, in an area of 690 square miles (1,790 square kilometers) in a population density of 35,100 per square mile (13,600 per square kilometer), the highest density among the top five built-up urban areas.

    Seoul-Incheon remains the only high income city, besides Tokyo,  in the top five. Seoul-Incheon is estimated to have a population of 24.1 million and an urban population density of 22,700 per square mile (8800 per square kilometer).

    The second five includes Karachi, Shanghai, Mumbai, New York and Sao Paulo, with only New York in the high income world. Thus, seven  of the largest 10 cities in the world are now outside the high income world. New York was the largest city in the world from the 1920s until the mid-1950s. London, which was the largest city in the world from the early 19th century to the 1920s is now ranked 34th, while Beijing, which preceded London as largest ranks 11th. Among the next ten largest urban areas, only two — Osaka-Kobe-Kyoto, at 14th and Los Angeles, at 19th are in the high-income world.  Formerly rapidly growing Los Angeles seems likely to drop out of the top 20 before long.

    Dhaka’s High Density

    Dhaka (Figure 4) remains far and away the highest density built-up urban area in the world (Figure 5), Dhaka has an urban density of 118,500 per square mile (45,700 per square kilometer). No other urban area exceeds 70,000 per square mile (27,000 per square kilometer). Yet, Dhaka is not dense enough for some critics, who perceive it to sprawl too much. Notably, Dhaka is about 50 percent denser than Mumbai or Hong Kong (the high income world’s densest city) and more than 30 times as dense as international densification model Portland, Oregon. Portland ranks 963rd in population density out of the 1040 built-up urban areas.

    A Half Urban World?

    In recent years, the population of the world has become majority urban for the first time. Yet, most people do not live in the largest urban areas. For example, only 15 percent of the urban population resides  in the 37 megacities. The middle of the urban population distribution is at a population of approximately 680,000. People who live in urban areas such as Shizuoka (Japan), Mangalore (India), not to be confused with Bangalore, Qitaihe (China) and Allentown (United States) are the average. The population of the urban areas that are larger have half of the urban population, while the smaller includes the other half.

    Distribution of the Population

    World urbanization is dominated by Asia, which has a majority (54 percent) of the built-up urban areas with at least 500,000 population. Asia’s dominance is even greater in population, with 58 percent of the residents in urban areas of 500,000 or more. North America has the second largest share of urban area population, at 12.5 percent, followed by Africa (11.2 percent) and Europe (9.9 percent). By contrast, Europe has the second largest number of urban areas of 500,000 population or more, reflecting the generally smaller population of its cities (Figures 6 and 7).

    Concentration of Future Growth in Asia and Africa

    The latest data underscores the substantial changes that have occurred in urbanization in recent decades. In 1950, 11 of the 20 largest cities were in the high income world, according to the United Nations. On average these cities had 5 million population. Today, only five of the 20 largest cities are in the high income world and their average population is 21.5 million.

    In the decades to come, Asia  seems likely to continue its dominance, while Africa will capture an increasing share of urban population growth. By 2050, the United Nations projects that approximately 1.2 billion residents will be added to Asian urban areas, while nearly 900 million will be added to the urban areas of Africa. This would leave only about 125 million, or five percent of total urban growth for the rest of the world. Of course, projections can be wrong, but the strength of current trends make these forecasts all the more credible.

    Note: Demographia World Urban Areas uses base population figures, derived from official census and estimates data, to develop basic year population estimates within the confines of built-up urban areas. These figures are then adjusted to account for population change forecasts, principally from the United Nations or national statistics bureaus for a 2016 estimate.

    Built-up urban areas are continuously built-up development that excludes rural lands. Built-Up urban areas are the city in its physical form, as opposed to metropolitan areas, which are the city in its economic or functional form. Metropolitan areas include rural areas and secondary built-up urban areas that are outside the primary built-up urban area. These concepts are illustrated in Figure 1 (above), which uses the Paris built-up urban area (unité urbaine) and metropolitan area ("aire urbaine") as an example.

    Wendell Cox is principal of Demographia, an international public policy and demographics firm. He is a Senior Fellow of the Center for Opportunity Urbanism (US), Senior Fellow for Housing Affordability and Municipal Policy for the Frontier Centre for Public Policy (Canada), and a member of the Board of Advisors of the Center for Demographics and Policy at Chapman University (California). He is co-author of the “Demographia International Housing Affordability Survey” and author of “Demographia World Urban Areas” and “War on the Dream: How Anti-Sprawl Policy Threatens the Quality of Life.” He was appointed to three terms on the Los Angeles County Transportation Commission, where he served with the leading city and county leadership as the only non-elected member. He served as a visiting professor at the Conservatoire National des Arts et Metiers, a national university in Paris.

    Photo: Cover of Demographia World Urban Areas: 13th Annual Edition.

  • Former Hawaii Democratic Governor Urges Trump to Stop Funds for Honolulu Rail

    A full page ad in today’s Washington Post (April 21, 2017) featured former Democratic Governor Benjamin J. Cayetano asking President Trump to stop further funding for the Honolulu rail project. The project has ballooned in cost from $5 billion to $10 billion, with most of the funding coming from local sources. There are serious concerns about the ability of Honolulu or Hawaii to afford completion of the project. Cayetano says that the line will be the most costly in the world. A proof of the ad is below and a pdf is available here.

    Several Newgeography.com articles have followed this issue:
    http://www.newgeography.com/content/005156-live-honolulu-hart-rail-a-megaproject-failure-making
    http://www.newgeography.com/content/002316-honolulu-mega-rail-project-a-micro-city
    http://www.newgeography.com/content/005410-honolulu-rail-from-46-b-86-b-eight-years-now-what
    http://www.newgeography.com/content/005257-honolulu-rail-it-just-keeps-getting-worse
    http://www.newgeography.com/content/002719-honolulu%E2%80%99s-money-train
    http://www.newgeography.com/content/001912-honolulu-rail-costs-balloon-ridership-projections-called-high