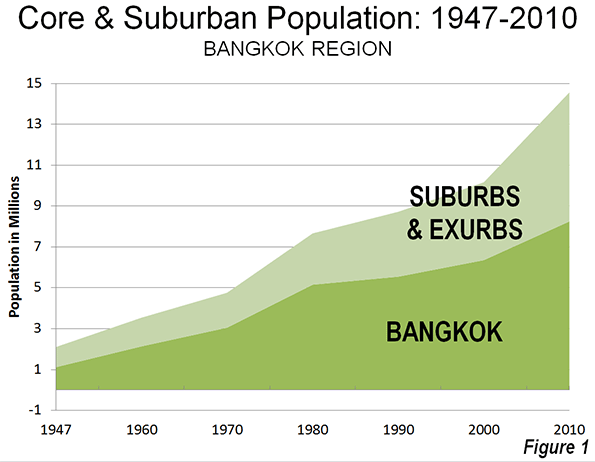
Since 2000, the Bangkok region has experienced annual population growth 2.5 times the rate of growth from 1980 to 2000. By 2010, the Bangkok region – which includes the provincial level city of Bangkok and the provinces of Samat Prakan, Samut Sakhon, Pathum Thani, Nonthaburi and Nakhon Pathom – was nearing a population of 15 million (Note 1).
As is characteristic of urbanization in both developing and developed countries, much of Bangkok’s recent growth has occurred outside the city, in suburban (and exurban) areas. Between 2000 and 2010, the city grew by 30%, while the suburban provinces grew more than twice as quickly, at 66%. The city’s population growth was 1.9 million, while the suburban provinces added 2.5 million population (Figure 1).
Much of the urban expansion has been on the periphery both within the city of Bangkok and in the provinces of Samut Prakon to the east, Samut Sakhon to the west and Pathum Thani to the north. Unlike most cities in Asia, where new development has taken high-rise form, much of this new development has been townhouses and detached housing. (Photo: Detached housing).
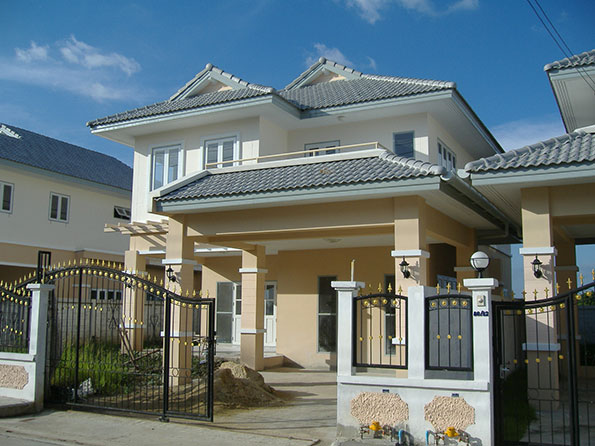
Photo: Detached Housing in the Bangkok city eastern sector
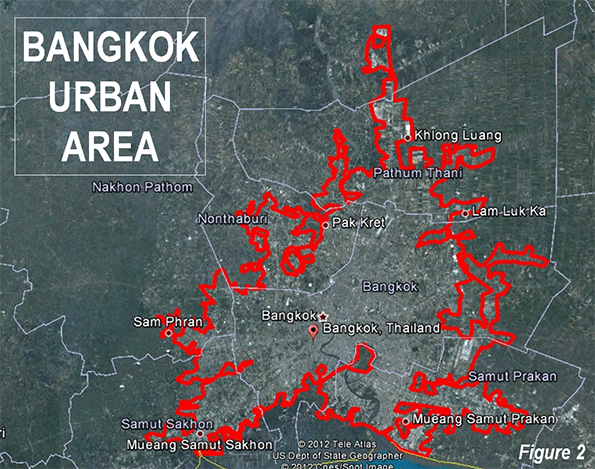
The Urban Area
The urban area, or area of continuous urban (and suburban) development will reach 14.5 million residents in 2013, according to United Nations projections. The urban area (Figure 2) covers approximately 900 square miles (2,330 square kilometers) and has a population density of the urban area is 16,200 per square mile (6,200 per square kilometer). This is 1.5 times the density of the Paris urban areas and more than 2.5 times that of the Los Angeles. However, Dhaka (Bangladesh), the most dense urban area, is at least eight times as dense.
Bangkok’s high density and inadequate road system combine to make Bangkok’s traffic among the worst in the world. The Bangkok region is well served by freeways but government authorities have failed to provide the necessary arterial road (secondary road) infrastructure, as noted by Shlomo Angel, Stephen C. Sheppard, and Daniel L. Civco in a World Bank report (Note 2). As a consequence, they said that:
The cost of reducing congestion in Bangkok is now higher—by one or two orders of magnitude—from what it would have been had adequate rights-of-way been secured earlier.
Bangkok is not the first urban area to have made this mistake. Atlanta’s traffic congestion is substantially worsened by its failure to provide a proper arterial roadway system.
Bangkok’s best chance of reducing its traffic congestion lies in the expansion of its underdeveloped arterial roadway system. Nonetheless, the scattered development has preserved opportunities to develop arterial roads cost effectively in some suburban areas. The siting of more commercial and employment growth in these areas would also help.
Some officials have suggested that expanded rapid transit would reduce traffic congestion. Bangkok has been expanding its small rapid transit system (as can be appropriate in very high density centers). There is little potential, however, for transit to reduce traffic congestion, as the intense traffic congestion and long commutes in cities well served with transit indicates (See photo at top and Note 3)
Suburban and Exurban Bangkok
Suburban expansion has been made possible by the increasing affluence of the Bangkok area, inexpensive land and house construction prices and the rising share of households with personal motorized vehicles (automobiles and motorcycles). Suburban dwellers are in the process of obtaining their own "Thai Dream" of home ownership, the popularity of which is demonstrated by the continuing draw of households to these rapidly developing areas.
Angel, et al noted that the Bangkok area had become “model of a well–functioning land and housing
market," and that:
Affordable and minimally–serviced land was brought into the market by the efficient creation of a minimal number of narrow tertiary roads that connected building plots to the existing road system; mortgages became widely available; and private developers went down–market in large numbers, selling land–and–house packages that were affordable for more than half the urban households.
Data from the Real Estate Information Centre of Thailand indicates that average new house prices remain similar in relation to average household income as a decade ago. By maintaining a competitive land market for new housing, Bangkok has retained housing affordability.
However there are difficulties. Some suburban areas, particularly in Pathum Thani, were hard hit by the 2011 floods. There has been controversy on this issue, as governments, national and local have come under criticism for their failures to control the flooding. At a minimum, the failure of the Bangkok region governments to coordinate their efforts contributed to the seriousness of this disaster. Nonetheless, new house construction continues in the suburbs and exurbs.
The City ("Bangkok Metropolis")
The core city of Bangkok is a provincial level jurisdiction, referred to popularly as the "Bangkok Metropolis" (Note 4). Bangkok is not a compact city, however, covering 605 square miles (1.570 square kilometers). This is 15 times the land area of the ville de Paris and larger than either Houston or Los Angeles, two of the most geographically expansive municipalities in the United States.
Beyond central Bangkok, the north, east and west sectors of the core city have experienced strong growth in detached and attached (row house or townhouse) construction.
Bangkok’s commercial core is dispersed, like many other Asian cities, in China and elsewhere. Manila is every bit as polycentric as Los Angeles or Atlanta. Bangkok, however, may be the ultimate core dispersion. There are at least five areas of high-rise commercial concentration, and large office buildings are sprinkled throughout the large central area (Photo: Dispersed core development). The UITP Millennium Cities Database indicated that only 11 percent of employment was in the central business district in the middle 1990s. With the ongoing dispersion, this figure may be lower now.
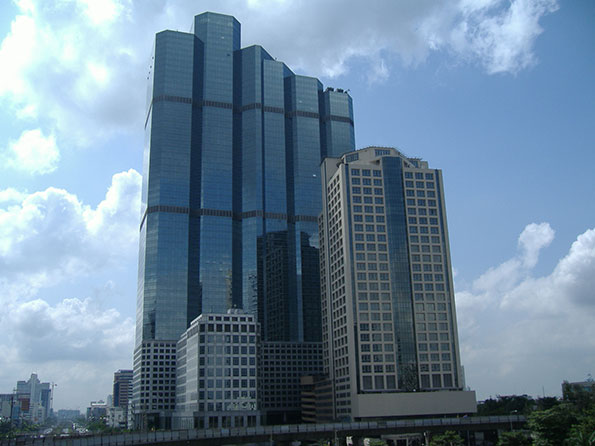
Photo: Dispersed core development
An Economic Success
Bangkok residents live well compared to many living in other East Asian cities. Not only is their housing more affordable, but they have achieved much higher incomes. According to the most recent Brookings Global Metro Monitor, Bangkok has gross domestic product per capita of $23,400 annually (based on purchasing power). This is more than all but four of Latin America’s metropolitan economies (Brasilia, Monterrey, Buenos Aires and Sao Paulo), according to the Brookings the data. If Bangkok were in China, its per capita GDP would rank in the top quarter of metropolitan economies (Note 5).
Challenges Facing the Bangkok Region
Bangkok seems likely to continue to grow rapidly, simply because it is virtually the only "urban draw" in Thailand. None of the world’s megacities (over 10 million population) is larger relative to other urban areas in the nation. Bangkok has more than 20 times the population of the next largest urban area in Thailand (Chon Buri). Strong population growth always presents formidable challenges for governments. The Bangkok region’s principal tasks will be to retain housing affordability by ensuring a competitive land market, and by providing a road system that reduces its exceedingly long travel times.
—–
Note 1: There has been confusion about the Bangkok region’s total population. As late as 2009, the city of Bangkok projected the 2010 regional population, excluding Nakhon Pathom’s fewer than 1 million population at 10.3 million. The population as counted in the 2010 census was 3.3 higher.
Note 2: Developers (and thus home buyers) pay for building the tertiary road systems that serve the new housing developments, similar to the practice in nations like the United States, Canada, Australia and New Zealand.
Note 3: This is illustrated by Tokyo and Hong Kong, which each have one-way work trip travel times of 46 minutes — the longest reported in high-income world metropolitan areas. Tokyo has the world’s largest transit system and Hong Kong has the highest average urban density in the high-income world. By contrast, Los Angeles, where transit carries a small share of travel, and which has much lower densities than Tokyo or Hong Kong, has a one-way average work trip travel time of 27 minutes.
Note 4: The city of Bangkok is a provincial level jurisdiction, formally called the Bangkok Metropolitan Administration. This use of the term "metropolitan" can be confusing, since much of the metropolitan area is outside the city (in between two and four other provinces, depending on the definition. This is similar to Tokyo and the former situation in Toronto. The prefecture of Tokyo is referred to as the "Tokyo Metropolis," which comprises barely one-third of the population of the Tokyo metropolitan area. Before the formation of the present city of Toronto, the regional authority was called the "Municipality of Metropolitan Toronto," however contained barely one half of the metropolitan area population. These semantic issues have been the source of considerable misunderstanding, not only by casual observers, but also by some academics.
Note 5: The ranking for Chinese metropolitan areas is adjusted in China, using the population figures from the 2010 census (which included the urban migrant population). The issue is described in Endnote 19 in the Brookings Global Metro Monitor.
Wendell Cox is a Visiting Professor, Conservatoire National des Arts et Metiers, Paris and the author of “War on the Dream: How Anti-Sprawl Policy Threatens the Quality of Life.”
——
Photo: Rapid transit and traffic congestion in Bangkok (all photographs by author)
