Author: Wendell Cox

  • Finally, A Vegas Train That Makes Sense

    Las Vegas Railway Express has signed an agreement with the Union Pacific Railroad to operate a conventional speed train from Fullerton, in Orange County to downtown Las Vegas, according to a story by Michelle Rindells of the Associated Press.

    This is not to be confused with the proposed Xpress West (formerly DesertXpress) high-speed rail line which would operate from Victorville to Las Vegas, expecting riders to drive through Los Angeles Basin traffic congestion to get to the station. Further, unlike Xpress West, the Las Vegas Railway Express train would require no financial assistance from taxpayers for its largely leisure travelers. As we indicated previously, our analysis concludes that XpressWest revenues are unlikely to be sufficient to repay a proposed federal loan. This could expose taxpayers to a loss of $5.5 billion or more — approximately 10 times as great as taxpayer losses in the Solyndra federal loan guarantee debacle.

    The Las Vegas Railway Express promoters intend to take the full financial risk, as do most entrepreneurs who start businesses. Moreover, the Las Vegas Railway Express train would operate only when demand is substantial, with all trips between Thursday and Monday. The first trip is tentatively scheduled for New Year’s Eve, 2013.

    Here’s hoping the train is successful and that the owners make at least a competitive return on investment, while providing employees commercially funded (not subsidized) jobs, paying, not consuming taxes and with revenues earned from willing customers, rather than relying on public funding. And just as important, if they fail, taxpayers will not be left holding the bag. That’s how things should work.

  • What is a Half-Urban World?

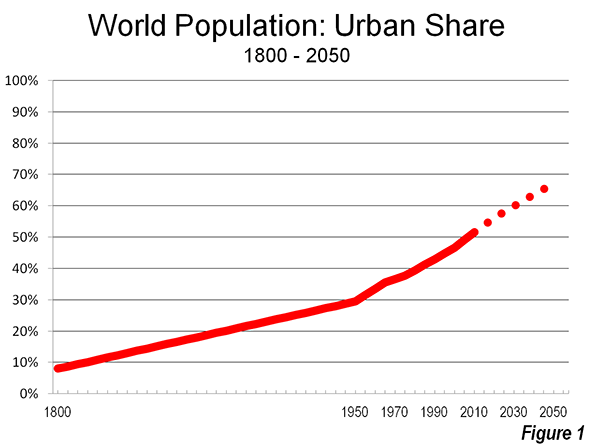
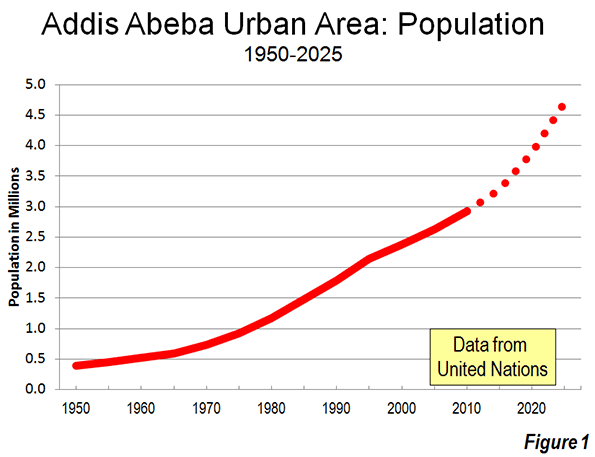
    Within the last couple of years, the population of the world has become more than one half urban for the first time in history. By 2025, the world’s urban areas are expected to account for 58% of the world population, rising further to two-thirds in 2050. This represents a huge increase from the 29% that was urban in 1950, or estimates of approximately 10% (or less) in 1800. (Figure 1).

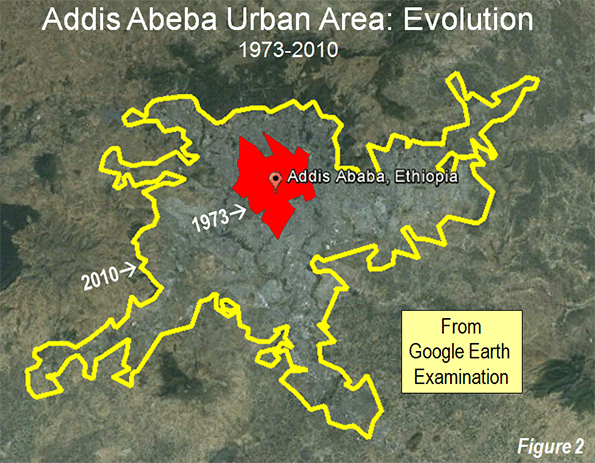
    Urban areas have also gotten much bigger. In 1800, only Beijing had a population over 1,000,000. A number of others, such as Baghdad, Rome, Xi’an, Hanghzhou and Ayutthaya (Thailand) are reported to have reached between 1.0 and 1.5 million in the more distant past, but all had fallen back below the 1.0 million threshold by 1800 (Note 1). These population declines occurred for a variety of reasons, such as military losses, disease, as well as political and economic instability. In short, before the 19th century, large urban populations were largely unsustainable (Figure 2).

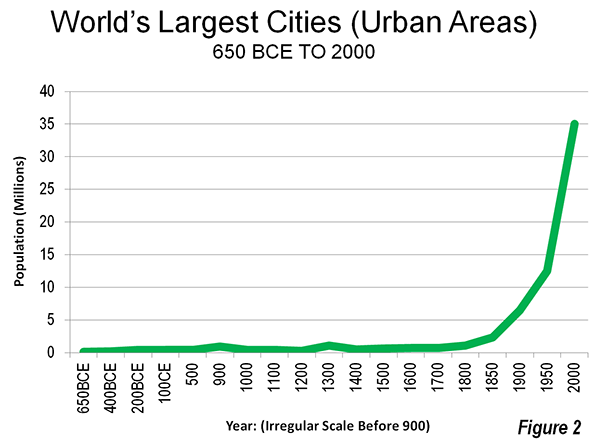
    Over the intervening two centuries there has been an exponential increase in the number of large urban areas. By 1900, there were at least 15 urban areas over 1,000,000 population. By 2010, the figure had grown to approximately 450. New York had become the world’s first megacity (over 10 million population) by 1950, now there are at least 25 over 10 million.

    What is Urban?

    However, it would be a mistake to imagine that "half urban" means a world of large cities, or that the world is highly urbanized. The principal source for urban population data is the United Nations, which relies upon individual countries to provide the urban versus rural data. These nations each have their own definitions, which can vary markedly.

    For example, in the United States, a settlement must reach 2,500 population before it is considered urban. Thus, Van, Texas, with a population of 2,502 in the 2010 census is urban, like New York with its 18 million. Canada requires settlements to have 1,000 residents. This means that Nobleford, Alberta, with a population of 1,000 in the 2011 census is urban, along with Toronto with its 6 million population. It seems curious that, with their similarities, United States and Canada have such different urban definitions.

    However, as the UN indicates, differing definitions make sense in some cases. For example, agricultural villages in China can be larger than small urban areas in the United States, Canada or Western Europe. However, given the common view that agricultural dependence is an important difference between rural and urban, a Western urban definition would be inappropriate in China.

    The differences in urban definitions can be substantial. According to the UN, urban definitions can require a population of as much as 50,000, and as little as 200, as in Sweden. With thresholds so low as 200, 1,000 or 2,500 population, the world urbanization data includes not only "cities," but also smaller settlements like small towns and villages (though there is no standard definition to differentiate between cities, towns and villages and the definitional problem is made worse by the sometimes use of these terms for administrative boundaries).

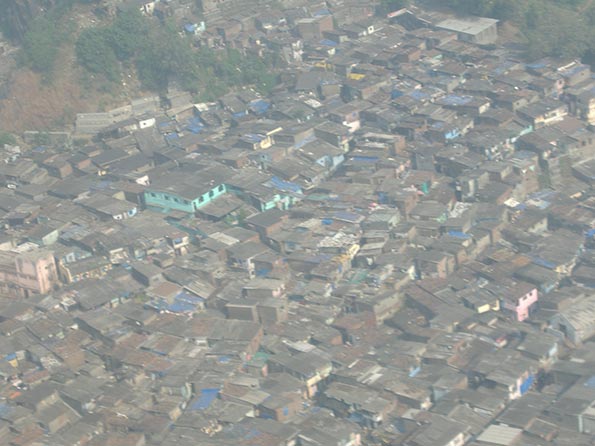
    It is generally recognized that the world’s largest urban area is Tokyo, with a population of more than 35 million. However, there is no consensus about the smallest urban area in the world. Our candidate is Godegård, located in the Motala municipality (Östergötland County) in Sweden. The 2010 census indicated that Godegård had a population of 200 residents, at the urban definition threshold for Sweden.  Godegårdians live in an urban area of 0.10 square miles or 0.26 square kilometers (see Google Earth image above).

    Distribution of the World Urban Population

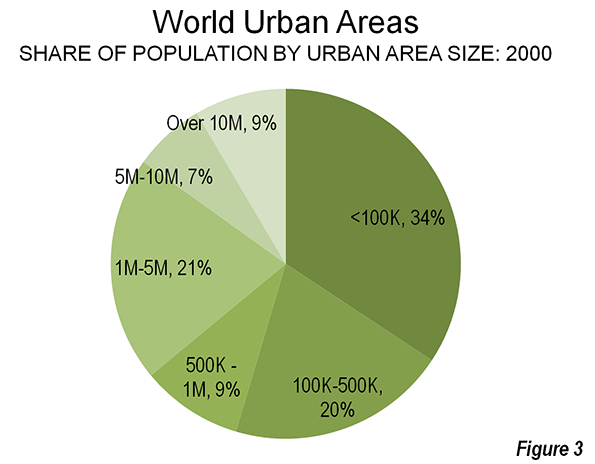
    Urban areas are becoming physically larger and that a larger share of the urbanization is moving to the larger urban areas (areas of continuous urban development, including both urban cores and surrounding areas, generally called suburbs). However, a majority of the world’s urban population lives in smaller urban areas. In 2000, 30% of the world urban population lived in urban areas of less than 100,000 population (Note 2). Another 20% of the population lived in urban areas with between 100,000 and 500,000 population. Thus, nearly 55% of the world’s urban population lived in small and medium-sized urban areas in 2000 (Figure 3).

    Historical and Projected Distribution of World Urban Population

    The United Nations data is available back to 1950 and includes projections to 2025, based upon the size of urban areas in each year in five-year increments. The data is specific to the population categories, so that as an urban area changes categories (generally moving to a higher category), its population is reflected in the higher category and subtracted from the lower category.

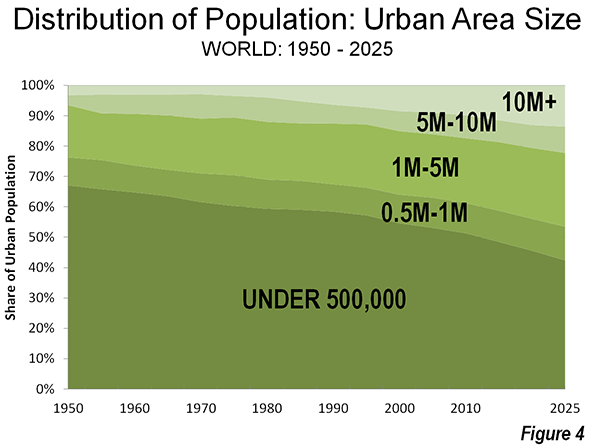
    Despite all of the attention given to the world’s megacities, only 10% of the world’s urban residents are in urban areas with more than 10 million population. However, both the number and share of people living in megacities has increased substantially. From 1950 to 2010, the share of world urban population living in megacities more than tripled, from 3% to 10%. By 2025, the United Nations projects that the megacities will have nearly 14% of the urban population.

    Strong growth has also emerged among the urban areas with from 5,000,000 to 10,000,000 population. Their share of the population has more than doubled since 1950 and is expected to rise further by 2025.
    The share of the population in urban areas with from 1,000,000 to 5,000,000 population has grown more slowly, but accounted for 20% of world urbanization in 2010 and is expected to rise to nearly 25% by 2025. These urban areas are projected to add more people than the world’s megacities by 2025.

    Urban areas from 500,000 to 1,000,000 population have increased their share even less, rising from 9% of the world urban population in 1950, to 10% in 2010 and a projected 11% by 2025.

    Virtually all of the loss in urban population share has been in the urban areas with populations below 500,000. In 1950, these urban areas represented more than two thirds of the world urban population. This has since fallen to one-half and is expected to drop to 42% by 2025. (Figure 4)
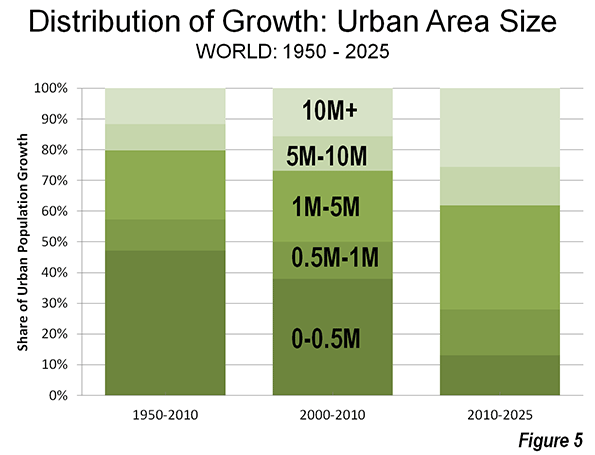
    Share of Growth

    This does not mean the smaller urban areas are losing population. Between 1950 and 2010, these urban areas added more than 1.3 billion residents, and are expected to add nearly 150 million more between 2010 and 2025. However, urban population growth has been increasingly to the larger urban areas. Between 1950 and 2010, 47% of the urban population growth was in areas with less than 500,000 people. This dominance continued from 2000 and 2010, with a 38% share of the growth. However, it is expected that between 2010 and 2025 the greatest growth will be among urban areas with from 1,000,000 to 10,000,000 population (47%) and in the megacities (26%), while the smaller urban areas are expected to account for less than 13% of growth (Figure 5). Even so, the smaller urban areas will still have nearly three times as many residents as the megacities.

    An Urbanizing, But Not Heavily Urbanized World

    A half urban world is a world of settlements that includes villages, small towns, larger urban areas and megacities. Even as the population becomes more concentrated in the larger urban areas, smaller urban areas will continue to account for a large share of the world urban population for the foreseeable future. Thus, a half (or more) urban world will continue to include the likes of Godegård, Nobleford and Van as well as megacities that could approach 50 million.

    Wendell Cox is a Visiting Professor, Conservatoire National des Arts et Metiers, Paris and the author of “War on the Dream: How Anti-Sprawl Policy Threatens the Quality of Life.”

    —-

    Photo: Google Earth image of Godegård, Sweden, which may be the smallest urban area in the world (see text above).

    Note 1: There is a considerable range of research on the size of the largest urban areas throughout history. The authoritative source is Tertius Chandler (Four Thousand Years of Urban Growth: An Historical Census).

    Note 2: This estimate is developed from data in Angel, Parent, Civco, Blei and Potere (2010) and United Nations data. Angel, et al (also see A Planet of People: Angel’s "Planet of Cities") provide estimates for urban areas from 100,000 to 500,000 population in 2000, which makes it possible to estimate the population of urban areas below 100,000 population, using UN data for 2000. Estimates for urban areas under 100,000 population is not available for other years.

  • Single Family Houses Sales Up, Builders Register Confidence

    A continuing increase in new single-family house sales has fueled the substantial increase in the NAHB/Wells Fargo Housing Market Index (HMI) to 46 in November. This indicates that nearly one half of surveyed home builders are positive about future sales of single family houses. This is a strong increase from the HMI of 41 in October. The HMI had reached its low point in the midst of the housing bus in January 2009 at 8 and is now higher than at any point in more than six years.

    NAHB reported that national single-family house sales in September were nearly 30% above the September 2011 rate, though remained approximately one-half the 2007 rate.

    The National Association of Realtors also reported that single family houses continued to dominate existing house sales, garnering approximately 88% of sales in October.

    The strengthening of the single-family housing market Is to be expected as the economy improves. These developments are further indication that the claimed change in housing preferences from single-family to multifamily is not occurring. In a related development, the latest available data indicates a preference in California for single-family housing on conventional sized lots, which is described in A Housing Preference Sea Change: Not in California.

  • A Housing Preference Sea Change? Not in California

    For some time, many in the urban planning community have been proclaiming a “sea-change” in household preferences away from suburban housing in the United States.

    Perhaps no one is more identified with the "sea-change" thesis than Arthur C. Nelson, Presidential Professor, City & Metropolitan Planning, University of Utah. Professor Nelson has provided detailed modeled market estimates for California in a paper published by the Urban Land Institute, entitled The New California Dream: How Demographic and Economic Trends May Shape the Housing Market: A Land Use Scenario for 2020 and 2035 (He had made generally similar points in a Journal of the American Planning Association article in 2006).

    Professor Nelson says that the supply of detached housing on what he defines as conventional sized lots (more than 1/8 acre) is far greater than the demand in California (Note 1). He further finds that the demand of detached housing on smaller lots is far greater than the supply. Professor Nelson’s conclusions are principally modeled from stated preference surveys, which can mislead if people act differently when they make choices in the real world.

    The Modeled Demand Estimates

    Nelson models the demand for housing types in California’s largest four planning regions (Southern California Association of Governments for the Los Angeles area, and the Bay Area Association of Governments for the San Francisco-San Jose area, the San Diego Association of Governments and the Sacramento Area Council of Governments). He estimates 2010 both supply and demand. His demand estimates rely strongly on data from three early 2000s stated preference surveys conducted by the Public Policy Institute of California (PPIC).

    • Nelson’s data indicates a strong preference for multi-family housing, which he places at 62% of demand in 2010, compared to the 2000 supply of 42%. Thus, the demand for multi-family housing is suggested to be one half above the supply.
    • The most stunning conclusion, however, is an over-supply of detached housing on conventional lots that Nelson estimates. Compared to a 2000 supply of 42% of the market, Nelson estimates the demand to be only 16%. This would indicate the supply of such housing to be more than 2.5 times the demand as is indicated in Figure 1.

    Nelson’s findings on conventional lot detached housing have obtained the most attention. He surmises that virtually all of the demand over the next 25 years can be met by the existing stock of conventional lot detached housing. This is music to the ears of many urban planners, who have for decades demonized  the suburbanization that has been preferred by the overwhelming majority of Californians (and Americans, and people elsewhere in the world where they can afford them).

    Actual Demand: Revealed Preferences: 2000-2008

    To perform a similar analysis, we used revealed preference data: the actual change in housing by type from the 2000 Census data to the latest American Community Survey (ACS) 2006-2010 data at the census tract level (Note 2).  

    In contrast to Professor Nelson’s estimates, the demand data indicates a strong continuing preference among Californians for detached housing on conventional lots. From 2000 to 2008 (the middle year for the 2006-2010 data), 51 percent of the new occupied housing in the four planning areas is estimated to have been detached on conventional lots (Figure 2). This is more than three times the 16% demand estimate in Professor Nelson’s data. In fact, the actual demand was higher than the 2000 supply (42%), indicating that the demand for detached houses on conventional lots has increased.

    If there is a sea change, it would appear to be in multi-family housing. In contrast with the 62% share for multi-family dwellings modeled by Nelson, the actual demand indicated in the census tract data was two-thirds less, at 19% (Figure 3), well below the supply of 43 percent in 2000. This suggests a tanking of demand for multi-family housing, even as builders, in California and elsewhere, put more product on the market.

    Why Accounts for the Difference

    Various factors appear likely to contribute to the difference between the modeled demand and the actual demand.

    Smaller Lots and Higher Density Do Not Mean Shorter Commutes: The PPIC survey questions implied a connection between larger lots (lower density) and longer commutes. This is the broadly shared perception, but in reality houses on smaller lots (necessarily in higher density neighborhoods) do not mean shorter commutes. This is illustrated in a chart by Southern California Association of Governments (SCAG) researchers on page 62 of The New California Dream. In the original SCAG document, the authors note that "commuting time is about the same for all density" (Figure 4).  This is not surprising, since higher densities are associated with more intense traffic congestion and with greater transit use, both of which lengthen commutes (Note 3).

    The "higher density means shorter commute" myth is rooted in the obsolete mono-centric conception of the city. Almost all US urban areas have become poly-centric with job locations highly-dispersed, as jobs have followed people to the suburbs. Gordon and Lee (Note 4) have shown that work trip travel times in the United States are shorter to dispersed employment locations than to central business districts or secondary business centers (such as "Edge Cities").  

    Invalid Perceptions of Transit Mobility: Professor Nelson also stresses stated preference responses showing that many people would prefer to live near transit service. All things being equal, who wouldn’t?

    But all things are not equal. Living near transit does not mean practical transit access to most of the urban area. In most cases, only a car can provide that. Transit systems are necessarily focused on downtown areas (central business districts), which contain, on average, only 8% of employment in the four planning regions. , Travel to other destinations is usually inconvenient, because of time-consuming transfers, or   not available at all.

    A Brookings Institution report indicated that 87 percent of people in California’s major metropolitan areas (Los Angeles, San Francisco, Riverside-San Bernardino, San Diego and Sacramento) live within walking distance of transit. Yet, the average employee can reach only 6% of the jobs in their respective metropolitan area in 45 minutes (Figure 5). By contrast, the average work trip travel time ranges from 25 minutes to under 30 minutes in the four planning regions .

    Households thinking about a move to higher density could have been, upon more serious examination, deterred by transit’s severe mobility limitations. 

    Data Insufficiently Robust for the Modeling: There is also the potential that the PPIC surveys, with their general questions, were not of sufficient robustness to support Professor Nelson’s assertions. For example, PPIC did not define the size of small lots.

    Planning and Reality

    If households were so eager to move from detached houses on conventional lots to smaller lots, 2000 to 2008 would have been the ideal time. The mortgage industry was literally falling over itself to fund home purchases. Urban core wannabes could have flooded the market pursuing their smaller lot "stated preferences." The actual, revealed preference data says they did not, which is also indicated by the continuing strength of suburban growth relative to central city growth (Note 5).

    Thus, the modeled demand estimates in The New California Dream appear to be at substantial odds with the actual demand.This is much more than an academic issue. The conclusions of The New California Dream have achieved the status of sacred text in the canon of urban planning and are mouthed unquestioningly by organizations like the Urban Land Institute.

    Worse, demand estimates from The New California Dream are being relied upon in regional transportation plans being developed by California’s metropolitan planning organizations (MPOs). This is particularly risky because these same MPOs have been granted greater power over housing under California’s Senate Bill 375, goaded on by a sue-happy state Attorney General’s office. The attempt by MPOs to impose their housing plans and regulations on consumers could well backfire, for investors in condominium and multifamily housing.  This would not be a first time that   developers followed urban planning illusions like lemmings over a cliff, to which huge losses in the last decade attest. The more destructive effects, however, are likely to be paid by households and the economies of California’s metropolitan areas.

    ———

    Note 1: More than 70% of the detached housing stock was on conventional lots in 2000.

    Note 2: There is no census tract data on detached house lot size. We scaled the detached housing data from the 2000 census to match Professor Nelson’s distribution of detached housing supply by lot size, using population density. Nelson’s method and ours were sufficiently similar that the results should have been roughly comparable. As the text indicates, they were not.

    Note 3: In each of the three PPIC surveys, respondents are asked to choose between housing alternatives that are high in the questions to commute "lengths." From the description and survey instruments in the PPIC reports, there is no indication that respondents were given any idea what commute "length" means. There are two way to judge commute "length." One is distance or miles, while the other is time. Based upon the PPIC survey instrument, it cannot be known which definition was perceived by the respondents.

    Even so, it seems more likely that the term "commute length" was perceived by respondents in time rather than in distance by respondents. Each day, people have only so many hours and minutes available. However, distance is not so constrained, depending upon the speed of the commute. Further, the extensive research on commuting often refers to "travel budgets," which are expressed in time, not distance.

    Note 4: Reference: Gordon, P. and B. Lee (2012), "Spatial Structure and Travel: Trends in Commuting and Non-Commuting Travels in US Metropolitan Areas," draft chapter for the International Handbook on Transport and Development edited by Robin Hickman, David Bonilla, Moshe Givoni and David Banister.

    Note 5: The most recent year (2010-2011), for which the Census Bureau had issued invalid municipal population estimates, indicated a continued the trend toward suburban rather than urban core growth, as has been shown by Trulia Chief Economist Jed Kolko (see: Even After the Housing Bust, Americans Still Love the Suburbs).

    =======

    Photograph: Suburban San Diego

    Wendell Cox is a Visiting Professor, Conservatoire National des Arts et Metiers, Paris and the author of “War on the Dream: How Anti-Sprawl Policy Threatens the Quality of Life.”

  • Election: “Stop Portland Creep” Resonates in Suburbs

    Election results from all three of Portland, Oregon’s largest suburban counties indicate a reaction against what has been called "Portland Creep," the expansion of the expansive light rail system without voter approval and the imposition of restrictive densification measures by Metro, the regional land-use agency.

    Portlanders in the three largest Oregon counties (Multnomah, Washington and Clackamas) have previously voted against financing light rail extensions, however the transit agency has found ways to continue the expansion and now operates five lines, with a sixth under construction. While urban rail aficionados tout the success of the Portland system, transit use by commuters has fallen significantly in relative terms from before the opening of the first light rail line. At the same time, working at home, which does not need billions in taxpayer subsidies, has caught up to and passed transit (Figure).

    The electoral events of the past 60 days could severely limit future expansion.

    Clackamas County: Chicanery and its Price

    In a September 2012 election, voters in Clackamas County approved a measure by a 60% – 40% majority requiring that any commitment of funding to rail would require a vote of the people. Perhaps fearing a negative result in the election, the pro-rail Clackamas County commission hastily approved $20 million to support the under construction Portland to Milwaukie (Clackamas County) light rail line.

    Things were to become substantially more difficult for light rail in the November election. In Clackamas County, the two incumbent commissioners on the ballot, both of whom voted for the $20 million bond issue, lost their seats. Voters rewarded their chicanery by replacing them with anti-rail commissioners, leaving the Clackamas County commission with a 3 to 2 anti-rail majority. The Oregonian characterized the election as "a referendum on light rail."

    John Ludlow, who defeated Clackamas County commission chair Charlotte Lehan by a 52% to 48% margin, told The Oregonian:

    "I think the biggest boost my campaign got was when those commissioners agreed to pay that $20 million to TriMet" for Portland-Milwaukie light rail four days before the September election. I think that put Tootie and me over the top." 

    "Tootie" is Tootie Smith, a former state legislator who unseated commissioner Jamie Damon in the same election by a similar margin.

    Washington County, Oregon: Taxpayers Take Control

    Meanwhile, light rail has run into substantial difficulty in suburban Washington County. In September, voters in King City approved a measure to require all light rail funding to be approved by the voters. In the more recent November election, voters in Tigard, the 6th largest city (50,000 population) in the metropolitan area, voted 81%-19% to subject all light rail expenditures to a vote of the people.

    Clark County, Washington: Voters Say No

    Portland’s transit agency also had its eye on expanding light rail service across the state line and the Columbia River to Vancouver, in Clark County, Washington. The plan was to build a new "Interstate Bridge" (Interstate 5) across the river, which would include light rail. The voters of Clark County were asked in a referendum to approve funding for the light rail system and turned it down soundly according to the Columbian, by a 56% – 44% margin.

    But there was more. For some time, citizen activist and business leader David Madore has been working to stop both tolls on the new bridge and light rail service. Madore was elected to the board of commissioners of Clark County at the same time that the light rail referendum was being defeated. Madore, like the two other Clark County commissioners, also hold seats on the transit agency board.

    Tri-Met’s Death Spiral?

    Further, Tri-Met’s dire financial situation could be another barrier to future expansion. As John Charles of the Cascade Policy Institute has shown, Tri-Met’s fringe-benefit bill is astronomically high, at $1.63 for each $1.00 in wages. This is more than five times the average for public employers, according to US Department of Commerce Bureau of Economic Analysis data. Charles refers to Tri-Met as being in a "death spiral" and says that:  

    "The agency is steadily devolving from a transit district to a retirement and health-care center, with unsustainable fringe benefit costs that now far exceed the mere cost of wages."

  • The Evolving Urban Form: Addis Abeba

    Addis Abeba is the capital of Ethiopia and calls itself the "diplomatic capital" of Africa, by virtue of the fact that the African Union is located here. Yet Ethiopia is still one of the most rural nations in both Africa and the world. Ethiopia also appears to be among the most tolerant. Various forms of Christianity claim account for approximately 65 percent of the population, with the Ethiopian Orthodox Church (Coptic) holding the dominant share. At the same time there is a sizable Muslim minority, at more than 30 percent of the population. Ethiopia has been spared the interfaith violence that has occurred in some other countries where there are large religious minorities.

    Growing Urban Area

    Addis Abeba is among the fastest growing urban areas in the world. Since 1970, the population has increased by nearly three times (Figure 1). However, the spatial expansion of the urban area has been much greater. The earliest available Google Earth satellite photos (1973) indicate that the urban land area (continuous urban development) has expanded over 12 times. Thus, the urban spatial expansion has been at least four times that of the population over the since the early 1970s (Figures 2 and 3).

    Since 1973, the urban population density of Addis Abeba has declined almost three quarters, from approximately 75,000 per square mile or 29,000 per square kilometer to 20,000 per square mile or 8,000 per square kilometer. Addis Abeba represents yet another example of the counter-intuitive reality of growing urban areas simultaneously becoming less dense, because population growth occurs the generally less  dense periphery in an organic city. It is not unusual for urban analysts to (wrongly) assume the opposite.

    One of the results of the spatial expansion is a significantly better lifestyle for residents of Addis Abeba, consistent with the view of Professor Shlomo Angel, who decries attempts to constrain cities within artificial boundaries (compact city policies) because they can deny people both a adequate housing and a decent standard of living.

    The Economy

    Ethiopia is one of the poorest nations on earth, with a 2010 gross domestic product-purchasing power parity (GDP-PPP) per capita of just above $1,000. This places it 170th out of 183 geographical areas according to the International Monetary Fund. By comparison, the GDP-PPP of the United States was $47,000 and Singapore $57,000.

    Ethiopia’s low income reflects  Ethiopia’s relativey low rate of urbanization. With 17 percent of the population in rural areas (outside urban areas), urbanization is concentrated in Addis Abeba (3.1 million), which is the only urban area in the nation with more than 300,000 population. Ethiopia can expect to experience a strong rate of urbanization in the decades to come, as people flock to the cities to seek better standards of living. By 2030, the total number of urban residents is projected by the United Nations to rise to 28.4 million from 13.9 million in 2010.

    Urbanization has its problems, but also economic advantages. The GDP-PPP in Addis Abeba, according to a Price-Waterhouse-Coopers estimate, is up to six times higher than that of the rest of the nation. Assuming that this ratio held to 2010, The GDP-PPP per capita of Addis Abeba would be $6,000 or more.

    Moreover, Price-Waterhouse-Coopers predicted that Addis Abeba would experience the 5th greatest economic growth to 2025, out of 151 urban areas. This would result in growth greater than that of Shanghai and Beijing. The four predicted to grow faster are the two large Viet Nam urban areas (Hanoi and Ho Chi Minh) and two in China (Guangzhou in the Pearl River Delta and Changchun in Manchuria).

    The Urban Core

    As would be expected in a developing world urban area, there is a large urban core with mixture of government and private buildings, literally surrounded by lower income, principally informal housing. With this predominant informal housing, the population density of the urban core is by far the highest in Addis Abeba (See Photo: Informal Housing in the Urban Core: Parliament and Holy Trinity Dome in the Distance).


    Photo: Informal Housing in the Urban Core: Parliament and Holy Trinity Dome in Distance

    Major government offices and cultural facilities are in this area, such as the Parliament, the prime minister’s residence, museums, the residence of the primate of the Ethiopian Orthodox Church (Coptic), the most important cathedral, Holy Trinity, in which former Ethiopian leader Haile Selassie  is buried, as well as the Catholic Cathedral and the largest Mosques.

    The New Addis Abeba

    There’s been a huge expansion of the periphery around Addis Abeba. Extensive tours around the urban area provide evidence of relative prosperity. It appears that Addis Abeba is rebuilding itself around its urban core. There is major construction in three directions from the urban core.

    The greatest activity is in the Bole District, which includes Bole International Airport, to the south of the urban core. There is a substantial amount of new commercial high-rise construction within a few kilometers to the north of the airport, along two major arterials and in between (Photo: Bole Corridor Development). There are also a large number of large, private condominium buildings. The Bole Corridor represents an edge city, in the sense defined by Joel Garreau in his seminal book Edge Cities  two decades ago. This is also the location of the largest Ethiopian Orthodox Church (see top photo) in the country.


    Photo: Bole Corridor Development

    An eastern corridor stretches for 6 miles/10 kilometers from what is locally called the "Chinese Road," a ring road built largely with the support of the Chinese government. There are many new commercial buildings, government buildings, public and private condominiums, and at the edges, large new detached houses (See photo: Detached Housing in the Eastern Corridor).


    Photo: Detached Housing in the Eastern Corridor

    To the west, principally, the southwest, is a new residential neighborhood composed principally of condominiums, generally up to five floors (Photo: Southwest Residential Area).


    Photo: Southwest Residential Area

    China in Africa

    Chinese financial assistance is not limited to the ring road. Much of the funding for the impressive new African Union headquarters (photo) was provided by the Chinese government. Further, a new light rail line will be largely financed by China. At the same time, the massive construction evident in the newer, outlying districts of Addis Abeba resemble (at least in a modest way) the urban development that has occurred in China over the past few decades.


    Photo: African Union Headquarters

    Conclusion

    The economic progress evident in Addis Abeba is encouraging. The government policies  are allowing the city to expand naturally as it grows, which facilitates  better lives for its citizens. It can only be hoped that the day will come that people in developing world urban areas, such as Addis Abeba, will enjoy the high standards of living that have been achieved in the developed world.

    Photo: Holy of Holies, Bole Mehani Alem Church (Ethiopian Orthodox Churches all have a replica of the “Ark of the Covenant,” behind a screen, which is referred to as the “holy of holies”). According to the Ethiopian Coptic tradition, the Ark of the Covenant, which tradition indicates, contained the tablets on which the Ten Commandments were written. The Ark was maintained in the holy of holies in the Jewish temple. The Ethiopian tradition holds that the Ark was taken to Ethiopia and is now kept at a chapel at a church in Axum, which is 600 miles/1,000 kilometers north of Addis Abeba.

    Wendell Cox is a Visiting Professor, Conservatoire National des Arts et Metiers, Paris and the author of “War on the Dream: How Anti-Sprawl Policy Threatens the Quality of Life.”

  • Honolulu Rail Project Legal Problems Mount

    According to the Hawaii Reporter, Honolulu’s rail transit project has lost a major legal test in The Federal Ninth Circuit Court, as Judge Wallace Tashima ruled in  HonoluluTraffic.com v. Federal Transit Administration et al that the city of Honolulu had violated federal environmental law on three counts.

    The plaintiffs included are a coalition of environmental, civic, political and taxpayer interests, including former Governor and mayoral candidate Benjamin Cayetano, University of Hawaii Law professor Randall Roth, Retired Judge Walter Heen, retired businessman and transportation expert Cliff Slater, Dr. Michael Uechi, Hawaii’s Thousand Friends, Outdoor Circle and the Small Business Hawaii Entrepreneurial Education Foundation.

    The plaintiffs and defendants differ strongly on the impact of the ruling, and the defendants are to return to court in December seeking a permanent injunction against the project.

    University of Hawaii Engineering Professor Panos Prevedouros told the Hawaii Reporter that the decision would require environmental planning revisions that could take up to 2 years.

    This setback is in addition to a previous unanimous Hawaii Supreme Court ruling that had already required construction to be suspended and which could delay project for at least a year, according to the Hawaii Reporter. The Supreme Court in Kaleikini v. Yoshioka, ruled that the city of Honolulu failed to comply with the state’s historic preservation and burial protection laws when it did not complete an archeological inventory survey for the 20-mile route before starting construction.

  • Local Government in Ohio: More Accessible and More Efficient

    There is general agreement that smaller units of government are more responsive and accountable to their electorates. However, proponents of larger governments often claim that this advantage also creates   higher spending and tax levels. On this basis, bigger-is-better proponents often suggest consolidating local governments to save money. Such calls have increased in recent years, with the unprecedented fiscal difficulties faced by governments from the federal to local level. However, more often than not, nothing more underlies consolidation proposals more than an interest in reducing the number (count) of local governments. It is largely taken as an article of faith that larger governments save money relative to smaller governments.

    Ohio has had more than its share of local government consolidation proposals. The Ohio Township Association asked us to review local government financial performance in the state. We were able to confirm that Ohio’s smaller governments are, on the whole, more responsive and accountable. However, the analysis clearly showed that smaller local governments have materially better financial performance.

    We analyzed per capita financial measures for all reporting local general purpose governments in the state, using Auditor of State data (Note). Ohio has three types of general purpose governments. Cities are incorporated municipalities with 5,000 or more population in the last federal census. Villages are incorporated municipalities with less than 5,000 population. The balance of the state is made of townships, which have virtually the same powers as municipalities.

    The Efficiency of Smaller Local Government

    The data indicates that smaller units of local government have median spending per capita that is less than larger local governments. Local governments with more than 10,000 population spent an average of at least twice that of smaller governments. The lowest per capita spending was in local governments with between 1,000 and 4,999 population (Figure 1).

    The smaller government advantage extended to debt. The median debt service per capita for local governments with fewer than 5,000 population was zero, while the median debt service per capita for local governments with 10,000 to 25,000 population was under $10 annually (Figure 2).

    The incidence of debt was also less among smaller local governments. Fewer than one-half of the local governments under 5,000 population had any debt. In contrast, all of the local governments with 50,000 or more population had debt (Figure 3).

    Smaller Governments Excel in Metropolitan Areas

    It might be thought that this smaller-is-better relationship stems from the more rural setting of some smaller local governments. However, an analysis of local government spending and debt per capita within metropolitan areas indicates the same conclusion:  smaller governments spend less and borrow less per capita (Figure 4).

    Townships: Even Less Costly

    Townships have been a particular target of "bigger-is-better" consolidation proposals, perhaps because of their smaller average population. Yet, despite their much larger average service areas (in square miles), townships represent a far smaller share of local government spending than their population share. Townships account for 11 percent of local general purpose government spending (excluding counties), yet have 35 percent of the state’s population.

    Townships have lower current expenditures per capita than villages and cities in all but one population category. In metropolitan areas, townships spend less per capita in all population categories (Figure 5). In addition, townships have lower per capita debt service payments than cities and villages
    The lower per capita spending of townships is attributable, at least in part, to lower administrative costs and lower labor costs per capita. Further, as with smaller municipalities, taxpayers often do not often demand the same level of service that is provided in the larger cities.

    Small Government: Less Likely to Enter Fiscal Distress

    Smaller local governments have experienced financial distress less. After the city of Cleveland bankruptcy in the 1970s, the state established the Local Government Fiscal Distress, which identifies local governments in serious distress and aids them in returning to normal fiscal health. The smallest cities and villages entered the Fiscal Distress program at a rate less than one-half that of the largest governments. The townships did even better. Only two of the state’s more than 1,300 townships were placed in the Local Government Distress Program (Figure 6).

    Why Larger Local Governments are Less Efficient

    One of the reasons that larger governments spend and borrow more is that they are less accessible to taxpayers and more accessible to interests which benefit from higher spending. This can lead to a vicious cycle that drives taxes so high that governments borrow more, followed by proposals to consolidate when the borrowing capacity becomes more constrained. Further, the very size of some larger governments can make them "too big to fail," like large financial institutions in the Great Financial Crisis. This can lead to "bailouts" by state taxpayers. Ohio’s Local Government Distress Program is an attempt to avoid these difficulties, by providing technical assistance and guidance.

    Smaller governments that consolidate face two critical challenges likely to increase costs. The first is that labor costs tend to be "leveled up" to the compensation levels in the higher cost jurisdiction. The other problem is that services and service levels also tend to be "leveled up."

    Proponents of consolidation sometimes assume that a large number of governments results in duplication of services. However, each of the local governments have exclusive service areas. For example, garbage is not collected by multiple jurisdictions to the same addresses. Smaller jurisdictions also tend to employ more part time staff, and even volunteers, especially in fire departments. Another advantage of smaller governments is that their elected officials are able to more directly manage the business of a smaller jurisdiction, because they do not have to rely more on intermediate staff.

    The performance of Ohio’s smaller governments shows that there is no need to choose between accessible government and efficient government. Ohio’s smaller local governments deliver both.

    Wendell Cox is a Visiting Professor, Conservatoire National des Arts et Metiers, Paris and the author of “War on the Dream: How Anti-Sprawl Policy Threatens the Quality of Life.”

    —–

    Note: These do not include counties, school districts or special districts.

    Illustration: Great Seal of the State of Ohio (from http://www.netstate.com/states/symb/seals/images/seal_ohio2.jpg)

  • A Planet of People: Angel’s Planet of Cities

    Professor Shlomo Angel’s new book, Planet of Cities, seems likely to command a place on the authoritative bookshelf of urbanization between Tertius Chandler’s Four Thousand Years of Urban Growthand Sir Peter Hall’s Cities and Civilization and The Containment of Urban England. Chandler produced the definitive volume of gross population figures for urban areas (cities) over millennia. Angel, takes the subject much further, describing detail how urban areas have grown over the last two centuries, both in population and continuous urban land area. The book focuses principally on population growth,  urban spatial expanse, and density. Moreover, Professor Angel develops both a statistical and analytic framework that complements the voluminous work of Peter Hall. Planet of Cities is liberally illustrated, which greatly aids understanding the trends.

    Urban Population, Land Area & Density Evolution from 1800

    Planet of Cities looks at the urbanization trend from various dimensions. A sample of 30 urban areas was used to gauge urban expansion and density changes from 1800 to 2000.

    At the same time, he describes the well documented urban density declines in the United States as well as the similar trends in Western European urban areas  often been missed by analysts who imagine that spatial expansion is limited to America.

    He goes further, showing that the rapidly growing urban areas of the developing world are also declining in urban density, with spatial expansion rates far exceeding those of population growth. This has been evident in New Geography’s  Evolving Urban Areas series (such as Mumbai, Jakarta, Manila, Ho Chi Minh City and others).

    Angel uses examples, such as Cairo and Accra, Ghana to illustrate both longer term and recent expansions of urban land area and the consequent drastic declines in urban density. In Cairo, the urban land area increased 16 times from 1938 to 2000, well in excess of the approximately 10 times population increase. In Accra, a 50 percent population increase from 1985 to 2000 was dwarfed by a 150 percent increase in urban land area.

    The analysis also includes a larger number (3600) with populations greater than 100,000. He estimates that all of the world’s urbanization covers no more than 0.5 percent of the world’s land. Angel suggests that the world the urban footprint could double or triple in the next few decades. However, he concludes that, even with this expansion, there are "adequate reserves of cultivatable land sufficient to feed the planet in perpetuity."

    Taking note of the slow growth or even population declines in the more developed world, he reminds readers that that nearly all of future population growth will occur in the urban areas of the less developed world. Angel strongly contends that this urban expansion is necessary. This, of course, places him "swimming upstream" against the prevailing doctrines of urban planning. The title of his first chapter "Coming to Terms with Urban Expansion" gives fair warning of his challenge to current planning doctrines. Throughout the volume, Angel expresses the view that declining urban densities are "inevitable," based upon his historic analysis, review of current trends and perceptions of the future.


    A Mumbai slum

    The Prime Concern: Housing

    Angel’s "primary policy concern" as "that in the absence of ample and accessible land for expansion on the urban periphery, artificial shortages of residential land will quickly extinguish any hope that housing will remain affordable, especially for the urban poor…"

    Angel expresses concern that the urban containment policies that so dominate American and Western European planning could be damaging to less developed nations, cancelling out much of the economic rewards of rapid urbanization. He expresses surprise that the attempt to impose Western planning models on the developing world raises so little objection (see China Should Send the Western Planners Home).

    Consistent with his "primary policy concern," Angel offers a "decent housing proposition," countering the present one-dimensional focus on environmental issues. In contrast, Angel suggests a more rounded approach to urban planning. He surmises \ the very purpose of cities:  to improve the economic lot of those who are attracted there. People are not generally attracted to cities because of the quality of their planning or the uniqueness of their architecture. In short, as he puts it, "few move to the city for its fountains." Unless they perform their economic task, cities stagnate or die, as so often happened before the modern age. The near exclusive draw of cities is household economics. Beyond the unprecedented value of the quantitative data and analysis provided, Planet of Cities is rooted in the reality of that   measure.

    At the same time, Angel is himself is unabashedly a planner. He is an adjunct professor of urban planning at the Robert F. Wagner School of Public Service at New York University, a lecturer at the Woodrow Wilson School at Princeton University and a senior research scholar at the urbanization project at the Stern School of Business at New York University.

    Restoring a Genuine Focus to Planning

    Angel expresses a strong interest in the most fundamental of planning issues: the provision of infrastructure that allows the urban area to better serve its residents and those it attracts. He is thus simultaneously for both more and less planning. He would curb the excesses of intervention in land markets that are now rife because they compromise the ability of cities to perform their primary function of improving affluence. He would expand the focus of planning to facilitate the organic urban expansion associated with growing cities.  This means that sufficient available land must be available for development without materially increasing land and house prices. It also requires making provision for the basic infrastructure such as an arterial grid of dirt roads on the expanding fringes of developing world cities.

    Abandoning Destructive Planning Doctrines

    Angel calls for abandonment of artificial limits on urban expansion and population growth (such as urban growth boundaries and housing moratoria) and instead seeks economic development and improvements in the quality of life.

    Professor Angel does not mince words about the consequences of relying of urban containment policy ("smart growth," "growth management," "compact cities,") as a strategy for reducing greenhouse gas emissions. The consequence would be that the "protection of our planet would likely come at the expense of the poor." He adds that strict measures to protect the natural environment by blocking urban expansion   could "choke the supplies of affordable lands on the fringes of cities and limit the abilities of ordinary people the house themselves."  He decries the notion that "cities should simply be contained and enclosed by greenbelts or impenetrable urban growth boundaries as "uninformed and utopian" because it makes sustainability "an absolute end that justifies all means to attain it." This policy approach sacrifices such imperatives as the quality of life and full employment.  

    A Planet of People

    Angel’s treatment is consistent with the urban scaling research of West et al at the Santa Fe Institute, which found that as cities increased in population they become more productive (As we indicated in a previous article, the Santa Fe Institute research did not deal with urban densities, despite misconceptions of some analysts).

    Angel’s concern about the impact on low income households is consistent with the focus of the international sustainability movement, which , declared at the recent Rio +20 conference:

    Eradicating poverty is the greatest global challenge facing the world today and an
    indispensable requirement for sustainable development. In this regard we are committed to
    free humanity from poverty and hunger as a matter of urgency.

    Angel’s Planet of Cities is about urban areas that serve their residents instead of theoretical, often utopian notions.

    Wendell Cox is a Visiting Professor, Conservatoire National des Arts et Metiers, Paris and the author of “War on the Dream: How Anti-Sprawl Policy Threatens the Quality of Life.”

    —–

    Publication information:
    Shlomo Angel, Planet of Cities (2012) Lincoln Institute of Land Policy

    Photo: Cover: Planet of Cities.  http://www.lincolninst.edu/pubs/images/2094_Planet_of_Cities_Cover_web.jpg

  • The Evolving Urban Form: Barcelona

    Among those for whom Paris is not their favorite European city, Barcelona often fills the void. Barcelona is the capital of Spain’s Catalonia region. Catalonia has been in the news in recent weeks because of the rising a settlement for independence from Spain, or at a minimum, considerably expanded autonomy. In part, the discontent is driven by a concern about the extent to which more affluent Catalonia subsidizes the rest of Spain. Another driving factor is the interest in separating Catalonian language and culture from that of Spain.

    Barcelona is nestled on the Mediterranean coast with mountains and valleys immediately behind. It would be easy to visit Barcelona without being aware of the huge expanse of suburbanization that has developed especially over the last 50 years.

    The Core City

    Like virtually all European core cities that have not annexed or combined with other jurisdictions, Barcelona’s population had peaked well before the turn of the 21st century. In 1960, the city of Barcelona had a population of just below 1.6 million people. Today, after having risen to 1.75 million in 1981, Barcelona’s population has dropped to approximately 1.62 million. Nonetheless, like other European core cities, Barcelona experienced strong growth before 1970, rising to nearly 7 times its 1890 population of 250,000.

    At the same time, like some other European and North American core cities, the city of Barcelona has begun to grow again. Having reached a modern low point of 1.5 million in 2001, the city grew by approximately 7 percent by the 2011 census.

    The city itself covers a land area of approximately 55 square miles/143 square kilometers, slightly less than that of Washington, DC. Barcelona’s density is much higher, at approximately 40,700 per square mile/15,700 per square kilometer, as opposed to the approximately 10,000 per square mile/4,000 per square kilometer of Washington. Yet, other core areas are considerably more dense, such as the ville de Paris, which is at least 30 percent more dense and Manhattan, which is approximately 50 percent more dense.

    The Metropolitan Area and the Urban Area

    The metropolitan area is generally considered to be the province of Barcelona, which is a part of the region of Catalonia (Figure 1). Since 1950, the metropolitan area has expanded from 2.2 million to 5.6 million people. Since 1960, nearly all of the population growth has been outside the city of Barcelona. The city has added approximately 60,000 people, while the balance of Barcelona province has added approximately 2.7 million people (Figure 2).


    The province of Barcelona is divided into comarques, which are the equivalent of counties. The core comarca (the singular form) is also called Barcelona and includes the city as well as other municipalities (or local government authorities), the largest of which is Hospitalet de Llobregat, with a population of 250,000.

    Barcelona’s urban area (area of continuous urban development) continues along the Mediterranean coast to the southwest into the comarca of Baix Llobregat, which includes the international airport. To the northwest the urbanization continues along the coast for some distance into the comarca of Maresme.

    The urbanization then surrounds Tibidabo Mountain behind the city along freeway routes on either side. These roadways connect with the AP-7 autopista (toll motorway), which provides direct access between Madrid, Valencia, Andalusia and France. The large valley through which the AP-7 runs contains the largest suburbs of Barcelona, which are divided into two comarques, the Valles Oriental (East Valley) and the Valles Occidental (West Valley).

    The Barcelona urban area covers approximately 415 square miles/1,075 square kilometers (Figure 3) and has a population of 4.6 million. At approximately 11,000 persons per square mile/4200 per square kilometer, Barcelona is one of Western Europe’s most dense urban areas. It is approximately 15 percent more dense than Paris and among the larger urban areas trails only Madrid (11,800 per square mile/4,500 per square kilometer) and London (15,100 per square mile/5,800 per square kilometer).

    The Barcelona urban area’s high density is also illustrated by comparison to the Zürich urban area, with its reputation for high density. As defined by the Federal Statistical Office of Switzerland, Zürich covers virtually the same land area as Barcelona, yet has less than one quarter of its population.

    Between the 2001 and the 2011 censuses, there was seven percent growth in the inner suburbs surrounding the city of Barcelona within the comarca of Barcelona. Much greater growth, however, was experienced in the more peripheral parts of the urban area. The coastal suburbs of Baix Llobregat and Maresme grew approximately 17 percent and now have a population of more than 1,000,000.

    Growth was even stronger in the interior valley, with the Valles Occidental growing at 19 percent and the Valles Oriental, which and with much more vacant land for development, grew 22 percent (Figure 4). Now the population of the Valles approaches 1.2 million.

    However the largest growth was outside the urban area entirely, in the balance of the metropolitan area, where the population increased 27 percent (Figure 5), and now approaches 1,000,000.

    Newer Development

    Much of the most recent growth has been relatively unusual for large Spanish urban areas, which have largely experienced high density expansion, with multi-family buildings (often high rise), even in the suburbs (see top photo). However, considerable detached housing has been built in the Barcelona metropolitan area over the past decade.

    Barcelona’s Dispersion

    Thus, the Barcelona metropolitan area is generally following the trend of greater growth in the urban periphery and the strongest growth in the rural and smaller urban areas that are outside the continuous urbanization.

    Wendell Cox is a Visiting Professor, Conservatoire National des Arts et Metiers, Paris and the author of “War on the Dream: How Anti-Sprawl Policy Threatens the Quality of Life.”

    Photo: Residential area in Valles Occidentale (Barcelona suburbs), by author.