Author: Wendell Cox

  • High Speed Rail in Brazil: The Need for Guarantees

    In an article entitled Fourth Time Unlucky, The Economist wonders why Brazil, with "a long list of more worthwhile infrastructure projects", does not dismiss high speed rail "out of hand."

    After three unsuccessful attempts to attract international bidders to build its Rio de Janeiro to Sao Paulo and Campinas line for a bargain basement price, the nation has decided that taxpayers will foot some (probably all) of the bill.

    The Economist continues:

    "Everywhere, new-build rail projects are horribly likely to come in way over budget and to be used much less than expected. A 2009 paper by Bent Flyvbjerg of Oxford’s Saïd Business School, ominously entitled "Survival of the Unfittest: Why the worst infrastructure gets built—and what we can do about it."

    As Flyvbjerg and others have noted, promoters, whether private or public, often seem to have a simple goal: to get the line under construction. That positions the projects for taxpayer bailouts when they run into problems.

    With bidders able to call upon other people’s money (taxpayer’s money) this time, it seems likely there will be takers. And, based upon the experience with major infrastructure projects around the world, that will be just the start of the taking.

    If elsewhere provides any guidance, the winning bidder can be confident that, down the road, the captive customer (the taxpayers) will pay any cost overruns. At the same time, the routine could be repeated in which a government kicks and screams, claiming it had no warning.

    They did. In this day and age, a link to the Economist’s warning is forever. A wise government will obtain the unlimited guarantees any company involved in the winning joint venture. Only then will Brazil’s taxpayers be protected.

  • Regionalism: Spreading the Fiscal Irresponsibility

    Stanley Kurtz’s new book, Spreading the Wealth: How Obama is Robbing the Suburbs to Pay for the Cities describes political forces closely tied to President Obama who have pursued an agenda to “destroy” the suburbs for many years. He expresses concern that a second Obama term will be marked by an intensification of efforts to destroy the suburbs through eviscerating their independence thought the imposition of "regionalism". The threat, however, long predates the Obama administration and has, at least in some cases, been supported by Republicans as well as by Democrats.

    America is a suburban nation. Nearly three-quarters of the residents of major metropolitan areas (over 1,000,000 population) live in suburbs, most in smaller local government jurisdictions. Further, outside the largest metropolitan areas most people live in suburbs, smaller towns or smaller local government jurisdictions.

    Smart Growth

    The anti-suburban agenda has more than one dimension. The best known is smart growth, known by a variety of labels, such as compact development, growth management, urban consolidation, etc. Smart growth, from our research, also is associated with higher housing prices, a lower standard of living, greater traffic congestion and health threats from more intense local air pollution.

    Regionalism

    Another, less well-known anti-suburban strategy is regionalism, to which Kurtz grants considerable attention. Regionalism includes two principal strains, local government amalgamation and metropolitan tax sharing. Both of these strategies are aimed at transferring tax funding from suburban local governments to larger core area governments.

    Social welfare and differing income levels are not an issue at this level of government. Local governments, cities, towns, villages, boroughs and townships, finance local services principally with their own local taxes. The programs aimed at social welfare or providing income support are generally administered and financed at the federal, state or regional (county) level. Any suggestion that local suburban jurisdictions are subsidized by core local governments simply reveals a basic unfamiliarity with US municipal finance.

    Local Government Amalgamation

    Opponents of the suburbs have long favored amalgamating local governments (such as cities, towns, villages, boroughs and townships). There are two principal justifications. One suggests "economies of scale" — the idea that larger local government jurisdictions are more efficient than smaller governments, and that, as a result, taxpayers will save. The second justification infers that a larger tax base, including former suburbs, will make additional money available to former core cities, which are routinely characterized as having insufficient revenues to pay for their services. Both rationales are without foundation.

    Proponents of amalgamation incessantly refer to the large number of local governments in some states, implying that this is less efficient. The late Elinor Ostrum put that illusion to rest in her acceptance speech for the Nobel Prize in economics in 2009:

    Scholars criticized the number of government agencies rather than trying to understand why created and how they performed. Maps showing many governments in a metropolitan area were used as evidence for the need to consolidate.

    The reality is that there is a single measure of efficiency: spending per capita. Here there is a strong relationship between smaller local government units and lower taxes and spending. Our review of local government finances in four states (Pennsylvania, New York, Indiana and Illinois) indicates that larger local governments tend to be  less efficient, not more. Moreover, the same smaller is more efficient dynamic is evident in both metropolitan areas as well as outside. "Smaller is better" is also evident at the national level (Figure 1).

    Yet the "bigger is better" faith in local government amalgamation remains compelling to many from   both the Right and Left. Proponents claim that smaller local governments are obsolete, characterizing them as being from the horse-and-buggy era. The same logic could be used to eliminate county and even state governments. However, democracy remains a timeless value. If people lose control of their governments to special interests (which rarely, if ever, lobby for less spending), then democracy is lost, though the word will still be invoked.

    Support of local government amalgamation arises from a misunderstanding of economics, politics and incentives (or perhaps worse, contempt for citizen control). When two jurisdictions merge, everything is leveled up, from labor costs to service levels. The labor contracts, for example, will reflect the wage, benefit and time off characteristics of the more expensive community, as the Toronto "megacity" learned to its detriment.

    Further, special interests have more power in larger jurisdictions, not least because they are needed to finance the election campaigns of elected officials, who always want to win the next election. They are also far more able to attend meetings – sending paid representatives – than local groups. This is particularly true the larger the metropolitan area covered, since meeting are usually held in the core of urban area not in areas further on the periphery. This greater influence to organized and well-funded special interests – such as big real estate developers, environmental groups, public employee unions – and drains the influence of the local grassroots. The result is that voters have less influence and that they can lose financial control of larger local governments. The only economies of scale in larger local government benefit lobbyists and special interests, not taxpayers or residents.

    Regional Tax Sharing

    Usually stymied by the electorate in their attempts to amalgamate local governments, regional proponents often make municipal tax sharing a priority. The idea is that suburban jurisdictions should send some of their tax money to the core jurisdictions to make up for the claimed financial shortages of older cities. Yet this ignores the fact, as Figure 1 indicates, that larger jurisdictions generally spend more per capita already and generally tax more, as our state reports cited above indicate. Larger jurisdictions also tend to receive more in state and federal aid per capita.  A principal reason is that the labor costs tend to be materially higher in larger jurisdictions. In addition to paying well above market employee compensation, many larger jurisdictions have burdened themselves with pension liabilities and post employment health benefits that are well above what their constituencies can afford. The regionalist solution is not to bring core government costs in line with suburban levels but force the periphery to help subsidize their out of control costs.

    Howard Husock, of Harvard University’s JFK School of Government (now at the Manhattan Institute) and I were asked to evaluate a tax sharing a plan put forward by former Albuquerque mayor David Rusk for Kalamazoo County, Michigan (The Kalamazoo Compact) more than a decade ago. Our report (Keeping Kalamazoo Competitive)found no justification for the suburban areas and townships of Kalamazoo County to share their tax bases with the core city of Kalamazoo. The city already spent substantially more per capita, received more state aid per capita and had failed to take advantage of opportunities to improve its efficiency (that is, lower the costs of service without reducing services).  We concluded that the "struggling" core city had a spending problem, not a revenue problem. To the credit of the electorate of Kalamazoo County, the tax sharing proposal is gathering dust, having been made impractical by suburban resistance.

    Spreading the Financial Irresponsibility

    The wanton spending that has gotten many larger core jurisdictions into trouble should not have occurred. The core cities are often struggling because their political leadership has "given away the store," behavior that does not warrant rewarding. Elected officials in the larger jurisdictions had no business, for example, allowing labor costs to become higher than necessary or granting rich pension benefits paid for by private sector employees (taxpayers), most of whom  enjoy only  much more modest pension programs, if at all (See note below).

    The voters are no match for the spending interests with more efficient access to City Hall. The incentives in such larger jurisdictions are skewed against fiscal responsibility and the interests of taxpayers. Making an even larger pool of tax revenues available can only make things worse.

    At the same time, the smaller, suburban jurisdictions around the nation are often the bright spot in an environment of excessive federal, state and larger municipal government spending. Their governments, close to the people, are the only defense against the kind of beggar-the-kids-future spending that has already captured the federal government, state governments and some larger local jurisdictions.

    Either Way the Threat is Very Real

    Even if President Obama is not re-elected or if a second Obama Administration does not pursue the anti-suburban agenda, the threat to the suburbs will remain very real. This is not just about the suburbs, and it is certainly not some secret conspiracy. What opposing regionalism means is the preservation of what is often the last vestige of fiscal responsibility. It is not that the elected officials in smaller  jurisdictions are better or that the electorate is better. The superior performance stems from the reality that smaller governments are closer to the people, and decision-making tends more to reflect their interests more faithfully than in a larger jurisdictions.

    Ed. note: This piece was corrected to add quotation marks around the word “destroy” in the first paragraph. That clause is included in reference to Kurtz’s characterization, not the author’s.

    ——

    Note: A report by the Pew Charitable Trusts (Promises with a Price) indicated that "… in general, the private sector never offered the level of benefits that have been traditionally available in the public sector." The report further indicated that 90 percent of state and local government retirees are covered by the more expensive defined benefit pension programs, compared to 20 percent in the private sector. The median annual pension in the state and local government sector was cited at 130 percent higher than in the private sector. While 82 percent of state and local government retirees are covered by post-employment medical benefits, the figure is 33 percent in the private sector. According to the Bureau of Labor Statistics, after accounting for the one-third higher wages per hour worked among state and local government workers, employer contribution to retirement and savings is 160 percent higher than in the private sector (March 2012). A just published Pew Center on the States report (The Widening Gap Update) indicates that states are $1.3 trillion short of the funding required to pay the pension and post employment medical benefits of employees. This does not include programs administered by local governments.

    Wendell Cox is a Visiting Professor, Conservatoire National des Arts et Metiers, Paris and the author of “War on the Dream: How Anti-Sprawl Policy Threatens the Quality of Life.”

    Lead Photo: Damascus City Hall (Portland, Oregon metropolitan area) by Wiki Commons user Tedder.

  • Texas High Speed Rail: On the Right Track?

    The Central Japan Railway (Note 1), which operates one of only two high-speed rail segments (Tokyo Station to Osaka Station) in the world that has been fully profitable (including the cost of building), proposes to build a line from Dallas to Houston, with top speeds of 205 miles per hour. This is slightly faster than the fastest speeds now operated. This line is radically different from others proposed around the nation and most that have been proposed around the world. The promoters intend to build and operate the route from commercial revenues.

    There is the understandable concern that eventually, the promoters will approach the state or the federal government for support. Not so, say Texas Central High Speed Railway officials. According to President Robert Eckels, not only is there no plan for subsidies, but "investors would likely walk away from a project that couldn’t stand on its own." He also told the Texas Tribune “If we start taking the federal money, it takes twice as long, costs twice as much,” Eckels said. “My guess is we’d end up pulling the plug on it.”

    Eckels is a former Harris County Judge (Houston), a position the equivalent of a county commission or county board of supervisors chair in other parts of the nation. Eckels developed a reputation for fiscal responsibility during his tenure at the county courthouse.

    The Texas project is in considerable contrast the California High Speed Rail project, which if built, is likely to require a 100 percent capital subsidy and perhaps subsidies for operations. It is also different from the Tampa to Orlando high speed rail project, which would have required a 100 percent capital subsidy and was cancelled by Florida Governor Rick Scott. The Texas project can also be contrasted with the Vegas to Victorville, California XpressWest high speed rail line that would require at least a $5.5 billion federal loan and a subsidized interest rate. Our recent Reason Foundation report predicted that XpressWest would not be able to repay its federal loan from commercial revenues and could impose a loss on federal taxpayers of up to 10 times the Solyndra loan guarantee loss (see The Washington Post, "Solyndra Scandal Timeline").

    From the horrific record of private investment in startup high speed rail lines and the huge losses that have been typical, I am certainly skeptical. The Taiwan high speed rail private investors have lost two-thirds of their capital investment and debts are guaranteed by the government. The Channel Tunnel rail line to St. Pancras station has been bailed out by British taxpayers. However, if any company can make money at high speed rail in the United States, it would be the Central Japan Railway.

    So far the Texas Central High Speed Railway seems to be doing it right. Like the other intercity modes, the airlines system and the intercity highway system (Note 2), this project would be paid for by people who use it.

    Without government subsidies or loans, the Texas Central High Speed Railway will certainly have an incentive to get the sums right. If they are not, it sounds like the plug will be pulled. If they are, high speed rail could be on the right track in the United States for the first time. More power to them.

    ——

    Note 1: Central Japan Railway, and other companies purchased the assets of the Japanese National Railway in the late 1980s. The nationalized railway had run up a debt of nearly $300 billion, which was eventually transferred to taxpayers.

    Note 2: There is a small subsidy to the airline system from the Federal Aviation Administration. Intercity highways have been financed by users until contributions from the federal general fund in recent years. However these contributions have been far less than diversions over the past 30 years from highway user fees, principally to mass transit a major transfer of highway trust fund interest to the general fund and now ongoing interest transfers.

    Photograph: Central Japan Railway corporate headquarters at Nagoya Station (by author)

  • Congratulations to America: Huge Greenhouse Gas Emission Reduction

    Congratulations to America. According to the US Department of Energy, Energy Information Administration, carbon dioxide (CO2) emissions were reduced 526 million tons from 2005 to 2011. This is no small amount. It is about the same as all the CO2 emissions in either Canada or the United Kingdom. Only five other nations emit more than that.

    The bigger news is that this was accomplished without any of the intrusive behavioral modification proposed by planners, such as by California’s anti-detached housing restrictions, Plan Maryland, or the state of Washington’s mandatory driving reduction program.

    Of course, part of the national reduction was due to the economic difficulties since 2005. However, even with 1.8 percent gross domestic product growth in 2011, EIA shows that CO2 emissions fell 2.4 percent in 2011.

    The magnitude of the decline over six years is impressive. Actual GHG/CO2 emissions were reduced more annually between 2005 and 2011 than smart growth proponents claim for their strategies after 45 years of draconian policy intrusions.Modeled smart growth forecasts in Moving Cooler’s middle scenario (by Cambridge Systematics and the Urban Land Institute) show the annual GHG/CO2 emission reduction in 2050, calculated from 2005, to be less than the emissions reduction in the average year between 2005 and 2011.

    This is despite what would be four decades of trying to force people to live where they don’t want, in housing they don’t prefer, while trying to drive them out of the cars that required to sustain economic growth in modern metropolitan areas.

    Moving Cooler’s forced densification and anti-automobile strategies were so radical that the Transportation Research Board authors of Driving and the Built Environment, could not agree that a similar approach was feasible, because it would be prevented by public resistance to the personal and political intrusions (Note 1). They would also be hideously expensive, as the Moving Cooler authors ignored the much higher costs of housing associated with smart growth’s behavioral strategies.

    This comparison demonstrates the conclusion of a recent Cambridge University (United Kingdom) led study (see "Questioning the Messianic Conception of Smart Growth", which stated:

    In many cases, the potential socioeconomic consequences of less housing choice, crowding, and congestion may outweigh its very modest CO2 reduction benefits.

    Government policies have had little to do with the reductions, except to the extent that they precipitated the greatest economic downturn since the Great Depression (such as by encouraging loose lending standards and the smart growth housing policies that drove house prices up so much that the housing bust became inevitable).

    Market forces have made a substantial contribution to the reduction. There was a substantial shift to the use of natural gas from coal, a conversion that is really only starting. There was also a modest improvement in automobile fuel efficiency (though much more is to come).

    In 2007, the McKinsey Corporation and The Conference Board published a study (co-sponsored by the Environmental Defense and the Natural Resources Defense Council), which said that sufficient GHG emissions reductions (Note 2) could be achieved without driving less or living in more dense housing. Our more recent Reason Foundation report showed that the potential for GHG emission reduction from more fuel efficient cars and carbon neutral housing far outweighed any potential for reductions from smart growth’s behavior modification.

    ——

    Note 1: Transport consultant Alan E. Pisarski evaluated Moving Cooler in an article entitled ULI Moving Cooler Report: Greenhouse Gases, Exaggerations and Misdirections.

    Note 2: Most of GHG emissions are CO2.

  • German Renewable Power: Making Sustainability Unsustainable?

    Der Speigel reports that Germany’s rushed program to convert to renewable energy is already imposing an economic burden. Part of the problem is the inherent instability of power produced by renewable sources such as wind and solar:

    The problem is that wind and solar farms just don’t deliver the same amount of continuous electricity compared with nuclear and gas-fired power plants. To match traditional energy sources, grid operators must be able to exactly predict how strong the wind will blow or the sun will shine.

    A national energy expert said:

    "In the long run, if we can’t guarantee a stable grid, companies will leave (Germany). "As a center of industry, we can’t afford that."

    An important principle of the international impetus to reduce greenhouse gas emissions is that there be little or no economic loss. Certainly, an industrial powerhouse like Germany cannot subject itself to such risks.

    At the same time, other locations would be similarly threatened by implementation of renewable power mandates whose "time has not yet come." Not only is there the potential to inflict economic harm on industry (and consumers through higher prices), but higher electricity prices would reduce discretionary incomes and could lead to greater poverty rates. The eradication of poverty has recently been declared to be a virtual prerequisite to sustainability at the Rio conference.

    eradicating poverty should be given the highest priority, overriding all other concerns to achieve sustainable development.

    Environmental sustainability requires economic sustainability. A litany of failures could do serious damage to GHG emission reduction efforts.

  • Toronto’s Greenbelt: Pushing up Congestion, Local Air Pollution and House Prices

    I had the pleasure of participating on Jerry Agar’s program on Newstalk 1010 in Toronto, with host Tasha Kheiriddin on August 15. The subject was a new report by the David Suzuki Foundation lauding the benefits of Toronto’s greenbelt greenhouse gas (GHG) emission reduction role as a carbon sink.

    Ms. Kheiriddin was interested in the other side of the issue, which I was happy to summarize. First and foremost, for all of their claimed benefits, greenbelts around growing cities have serious consequences. They force population densities up, which makes traffic more congested. This is because as densities rise, traffic volumes increase. There are various estimates of the increase in traffic congestion from a doubling of density, from (for example) 61 percent (Sierra Club) to 96 percent (Ewing and Cervero). The greater congestion produces more intense local air pollution, with the predictable health effects. Beyond that, as any Economics 101 student should know, rationing anything (such as land) tends to be associated with higher prices. It is no wonder that house prices have skyrocketed since the greenbelt was established.

    It is important to understand the dynamics of GHGs. It doesn’t matter whether they occur in the Toronto greenbelt or Patagonia. This means that there is no reason for GHG reduction to emanate from the Toronto greenbelt. It would be far better to forest some of the 7.5 million acres of disused farmland in Ontario (since 1951). This is many times as much land as the Toronto greenbelt. In other words, from a global (or local GHG emission perspective), the Toronto greenbelt is irrelevant (Note).

    The purpose of the city (metropolitan area) should be to facilitate higher discretionary incomes for its residents, while minimizing poverty, all within the constraints of sufficient environmental protection. The greenbelt reduces discretionary incomes by restricting mobility (more traffic congestion) and raising house prices. It increases poverty by raising costs and preventing job creation. The greenbelt’s claimed GHG emission benefits can readily be replaced by strategies elsewhere that do not reduce economic growth.

    Note: Large portions of the farmland in Ontario and Quebec have been taken out of production since 1951, as production has been transferred to the Prairie provinces (Alberta, Saskatchewan and Manitoba). Meanwhile, the real value of agricultural production in Canada increased 160 percent from 1961 to 2005.

  • Could a Las Vegas Train Produce Losses 10 Times More Than Solyndra? (Report Announcement)

    The Reason Foundation has released our "Xpress West" (formerly "DesertXpress") analysis. This high speed rail train would run from Victorville (90 miles from downtown Los Angeles) to Las Vegas. Promoters predict high ridership and profits. They are seeking a subsidized federal loan of more than $5.5 billion, which is within the discretionary authority of the US Department of Transportation to fund.

    Our analysis concludes the following:

    1. There is serious question whether there is a market for Las Vegas travel that would require driving one-third of the way and transferring to the train. If there is no such market, as seems likely from the international experience, ridership could be as low as 97 percent below projections. The reality can be known only after the line is running.

    The balance of the report is based upon the assumption that there is a market for driving to Victorville and boarding a train to Las Vegas.

    2. The ridership and revenue projections (by URS Corporation) are based upon data that is more than 7 years old and predates the Great Financial Crisis. There have been significant downward demand trends in the travel market and Las Vegas tourist market since that time, especially in the share of the market from the Los Angeles Basin. It is inappropriate to use such old data in projecting system performance (Certainly no private company would rely on such old data in a due diligence analysis).

    3. Even after adjusting the obsolete data (which our report does), the ridership projections are implausibly high — at four times the Amtrak Acela ridership between Washington, Baltimore, Philadelphia and New York.

    4. Over 24 years (the forecast period in the project document), we project that expenditures will exceed revenues by between $4 billion and $10 billion. This would mean that there would be insufficient revenues to pay the federal loan. This could result in a taxpayer loss approximately 10 times that of the Solyndra federal loan guarantee.

    5. The free use by the private Xpress West project of the Interstate 15 median could preclude cost effective expansion of this roadway. Even assuming the implausible Xpress West assumptions about the diversion of drivers to the train, the overwhelming majority of growth in the corridor would be on the highway, not on the train. This includes not only the heavy truck traffic, but also car traffic.

    Related: The Las Vegas Monorail

    Wendell Cox was also author of  "Analysis of the Proposed Las Vegas LLC Monorail," which indicated that ridership and revenue projections were extremely optimistic and that the project was likely to fail  financially. Subsequently the project filed bankruptcy and defaulted on bonds. The actual ridership on the Monorail was within the range predicted in "Analysis of the proposed Las Vegas LLC Monorail," and far below the level forecast by project consultant URS Greiner Woodward Clyde.

    Also see this letter from other consultants reviewing the project (Thomas A. Rubin, Jon Twichell Associates, Professor Bernard Malamud  and Wendell Cox).

    The Las Vegas Monorail case is described in the Reason Foundation report.

  • The Evolving Urban Form: Istanbul

    Istanbul is unique in straddling two continents. The historical city was concentrated on the European side of the Bosporus, the wide, more than 20 mile long strait linking the Sea of Marmara (Mediterranean Sea) in the south to the Black Sea in the north. Nearly all of the historic city was located on a peninsula to the south of the Golden Horn, an inlet off the Bosporus. By 1990, the urban area had expanded to occupy large areas on both sides of the Bosporus.

    The Urban Area

    Istanbul, like many other developing world urban areas, has grown rapidly since World War II. In 1950, the urban area contained a population of less than 1,000,000. That is similar to the present population of urban areas like Edmonton, Adelaide and Raleigh. By 2012, the urban area had   a population of nearly 12.7 million.

    Few of the world’s cities boast a more storied history than Istanbul. It started as the Greek colony of "Byzantium," in the 7th century, BCE. By the fourth century, CE, Byzantium , taking advantage of Rome’s decline, was designated capital of the Roman Empire by the Emperor Constantine. The city was subsequently renamed "Constantinople." The final name change, to "Istanbul," was finalized in the early years of the post-Ottoman Empire Republic in the 1920s.

    Constantinople became capital of the Eastern empire. Constantinople eventually emerged as the seat of Eastern Christianity (Easter Orthodoxy) and remains so today, despite more than 500 years of Islamic predominance under the Ottomans and later, the Republic of Turkey.

    Like many ancient cities, Constantinople experienced wide swings in population, reaching 400,000 in 500 C.E. then dropping to under 50,000 by the time of the Ottoman conquest (1453). But the conquest proved a boon to the city.

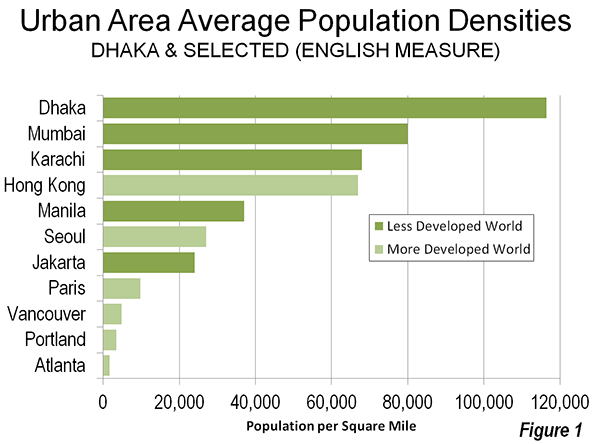
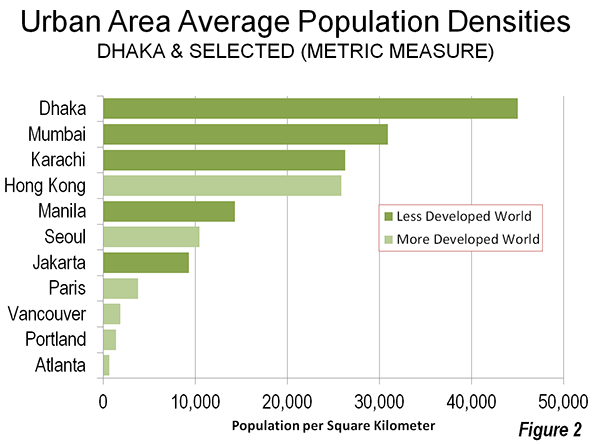
    By 1550, the population had risen to 660,000. At the time only Beijing was larger (690,000). At that point, the city walls (the present district municipality of Fatih) and urbanization north of the Golden Horn amounted to an estimated six square miles (15 square kilometers), for a population density of approximately 110,000 per square mile (42,500 per square kilometer). Such hyper-densities were typical of pre-1800 cities, when walking was the predominant mode of transport. Some older cities were even more dense:  17th century, Paris approached 175,000 per square mile (67,000 per square kilometer (Note: Walking Cities)


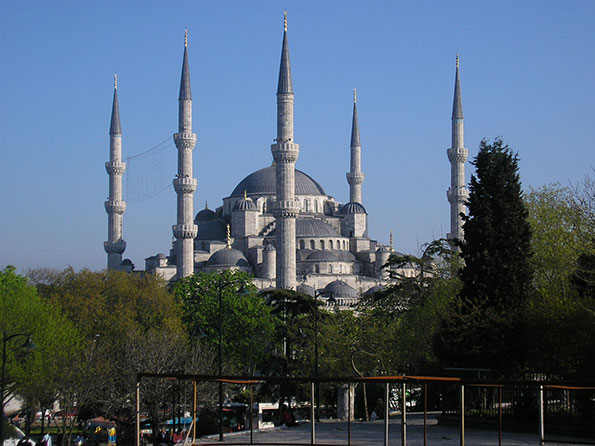
    Caption: Sultan Ahmed Mosque (Blue Mosque), 17th Century, CE

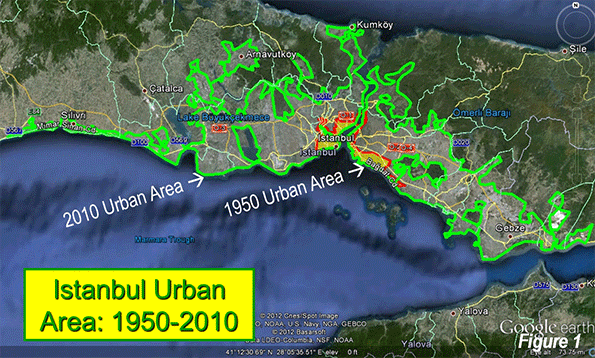
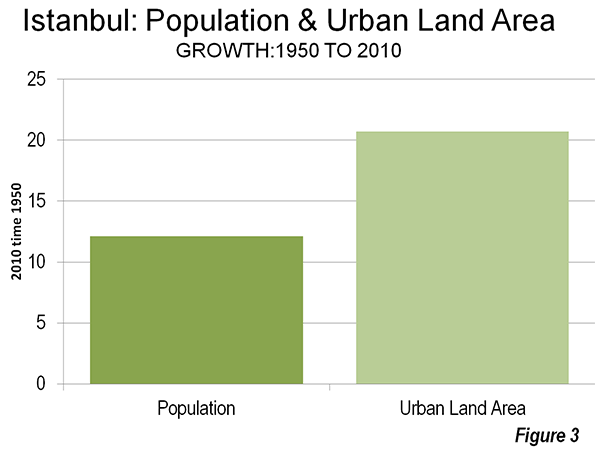
    In the ensuing centuries, the urban area grew modestly to less than 1,000,000 in 1950, when the urban population density fell to 40,400 per square mile (15,600 per square kilometer). Rapid growth was to follow to today’s more than 12 million, along with a further drop in urban density, to 24,300 per square mile or 9,400 per square kilometer (Note: The Density of Istanbul). The physical expansion of the urban area now stretches north all the way to the Black Sea (Figure 1 shows the present extent of the urban area and the 1950 urban area). Over the 60 years, the urban area population grew more than 12 times, but the urban land area grew nearly 21 times (Table 1). Istanbul demonstrates the near universal truth that as cities grow, they become less dense  (Figure 2).

    Table 1          
    Istanbul Urban Area: Population & Density from 1550    
    Year Population in Millions Land Area: Square Miles Land Area: Square Kilometers Density:Square Mile Density: Square Kilometer
    1550 0.66 6 16 110,000 42,500
    1950 0.97 24 62 40,400 15,600
    2012 12.66 520 1,347 24,300 9,400
               
    Change: 1550-1950 47% 288%   -63%  
    Change: 1950-2010 1205% 2073%   -40%  


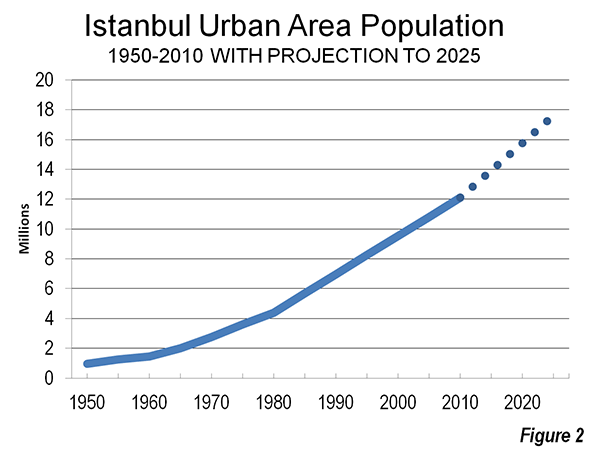
    At United Nations projected growth rates, the urban area should approach 18 million by 2025 (Figure 2). There are reports of increased migration to Istanbul from Asian Turkey, which if continued, could make the 2025 figure even higher.

    The Metropolitan Metropolis and Province

    Istanbul is a both a metropolitan municipality and a province and can be considered a metropolitan area (labor market area). The province, most of it rural, covers land area of more than 2,100 square miles (5,300 square kilometers) and had a population of approximately 13.5 million according to the 2011 census. The urban area (area of continuous urban development) is much smaller, at only 520 square miles (1,347 square kilometers). Nearly all the population is concentrated in the urban area.

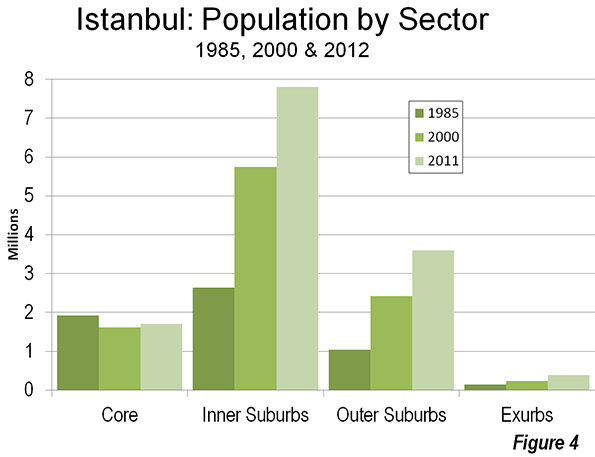
    Since 1985, the metropolitan area’s growth largely has been outside the core. The historic core, on the peninsula (Fatih), lost 27 percent of its population, while the balance of the core, district municipalities to the north of the Golden Horn and to the west, lost 5 percent. Such core area losses have frequently occurred in many  major metropolitan areas   (for example, Osaka, Seoul, Mumbai, Chicago, Milan, Buenos Aires, and Mexico City).

    The inner ring, including district municipalities further to the west and north of the core on the European side and municipalities on the Asian side have captured nearly all the growth. From 1985 to 2011, inner ring district municipalities added 5,000,000 residents. The outer ring of suburban district municipalities gained 2.5 million residents with the greatest percentage growth, at nearly 250 percent. There has also been growth in exurban district municipalities (beyond the urban area), though it has been much more modest (Figure 4 and Table 2).

    Table 2          
    Istanbul: Population Growth by Sector: 1985-2012  
               
        1985 2000 2011 Change: 1985-2011
     Historic Core: Fatih             591          459          429 -27%
     Balance of Core          1,336      2,175      1,270 -5%
     Inner Ring          2,635      5,747      7,800 196%
     Outer Ring          1,044      2,424      3,598 245%
     Exurbs               147          240          386 162%
     Total            5,753    11,045    13,483 134%
               
     Population in 000s         


    Ascendant Asia

    While European Istanbul has been dominant for millennia, it is perhaps fitting that Asian Istanbul is on the rise, with nearly 40 percent of the population, up from 31 percent in 1985. Asian Istanbul was made substantially more accessible by the first bridge over the Bosporus (1973).

    Linking Istanbul

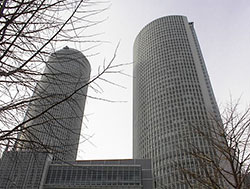
    Istanbul is served by two major east-west freeways. Each (the O-1 and O-2) both have their own crossings of the Bosporus. Other freeways feed these both in Europe and Asia. The development of the mass transit system is somewhat curious. The inner Fatih area and Beyoğlu contain the historically most important commercial centers. However, they are being fast replaced by new skyscraper developments in Levent and Maslak. This is similar to the emergence of newer commercial cores that have become more important the older cores, such as in Mexico City, Sao Paulo, Beijing, and Manila, where multiple, large cores have grown.

    Yet, Istanbul’s urban rail system keys on the old commercial centers. Both Levent and Maslak are located on a single Metro line, which makes them less convenient than if radial lines were being built to these centers instead. Both centers have good road access. Levent is located between the O-1 and the O-2 motorways, while Maslak is located just north of the O-2.

    A passenger rail tunnel between Asia and Europe, the first, is scheduled for opening to Fatih in 2015. Local authorities predict that this and other pending projects could increase the share of trips by rail in Istanbul from 3.6 percent to as much as 27.6 percent. No such market share increase has ever occurred in the world since automobiles have become widely available. Further, like Istanbul’s transit system in general, the project will not provide direct service to Levent or Maslak.

    Becoming Europe’s Largest Urban Area

    Istanbul has always been considered European and remains so even with its huge suburbs in Asia. Istanbul trails Moscow as Europe’s largest urban area, but by 2025 should be the largest. Indeed, it seems likely that Istanbul will be the only European urban area to reach a population of 20 million, as much of Europe faces stagnant or even declining population.

    Wendell Cox is a Visiting Professor, Conservatoire National des Arts et Metiers, Paris and the author of “War on the Dream: How Anti-Sprawl Policy Threatens the Quality of Life.”

    ——————–

    Note: Walking Cities: Walking constrained the physical expansion of cities, and thus the population. As result, few pre-1800 cities reached 1,000,000 population and most were not able to sustain that level. The great expansion of urban areas followed, as walking was replaced by the more efficient transport modes of transit and automobiles, both of which permitted a sizeable expansion of urban footprints and labor markets. The subsequent economic growth is legendary and accounts for having attracted so many people from the countryside. In 1800, estimates suggest that urban areas contained under 10 percent of the world population. Today, the figure is 52 percent, according to the United Nations. This includes all urbanization, from the largest cities to the smallest towns.

    Note: The Density of Istanbul. The province, most of it rural, covers land area of more than 2,100 square miles (5,300 square kilometers) and had a population of approximately 13.5 million according to the 2011 census. The urban area (area of continuous urban development) is much smaller, at only 520 square miles (1,347 square kilometers). This article highlights the urban density of Istanbul, which is the population per square mile or square kilometer. Other sources cite much lower figures, for the province/metropolitan municipality (metropolitan area). However, metropolitan area densities are not urban area densities. Metropolitan areas virtually always have more rural land than urban land, so their population cannot be included in calculations of urban density. The population and density noted above is based upon the 2011 census and will be reflected in the next edition of Demographia World Urban Areas.

    Photo: Hagia Sophia (Santa Sophia) Church (now museum) built by Justinian (6th Century CE). Photos by author.

  • Avoiding Expensive Municipal Mergers

    An article in The Wall Street Journal discussed attempts to merge local governments in Michigan. While efforts such as these gain wide support because of the belief that they will save money, there evidence shows the opposite.

    Government consolidations may seem to make all of the sense in the world academically. In practice, they cost more. There are no economies of scale in larger governments, except for spending interests. Voters have less influence in larger jurisdictions.

    A simple look at the evidence, rather than the theory, indicates this. Our analysis in five states shows it, and the differences are stark. Lower per capita spending and taxation at the local general government level is associated with smaller units of government.

    It is not therefore surprising that in Toronto, Hamilton and Ottawa there have been calls to "demerge" cities forcibly merged in the 1990s. In a debate in Toronto last October with a top transit official (a member of the left leaning National Democratic Party), we agreed on at least one thing — that Toronto’s amalgamation had been a mistake.

    Nor is it surprising that despite huge electoral barriers erected by the Charest government, a number of municipalities voted to demerge from the forcibly enlarged ville de Montreal in the early 2000s.

    For the most part, however, there is no going back. Mergers are forever. So are the higher taxes and higher spending.

    My commentary in Canada’s National Post  dealt with this issue on the 10th anniversary of the Toronto amalgamation.

  • Evolving Urban Form: Dhaka

    A few weeks ago, we suggested that Hong Kong was the "smart growth" ideal, for having the highest urban population density in the high income world. But, if you expand the universe to the poorer, developing countries, Hong Kong barely holds a candle to Dhaka. Dhaka’s 14.6 million people live in just 125 square miles (325 square kilometers). At more than 115,000 people per square mile (Figure 1), or 45,000 per square kilometer (Figure 2), the capital of Bangladesh is nearly 75 percent more dense than Hong Kong.

    The Ultimate in Average Urban Area Density

    None of the world’s megacities comes close to Dhaka’s population density. Mumbai is about one-third less dense, despite its reputation as crowded and congested. The only other megacity (minimum 10 million population) more than one-third as dense as Dhaka is Karachi. Twenty three other megacities fall at least two-thirds short of Dhaka’s density (such as Jakarta, Seoul and Paris). New York’s core, Manhattan, is 40 percent less dense, and the New York urban area does not reach 1/20th of Dhaka’s density


    No city in the world uses land so efficiently as Dhaka. But this comes at a price. With an urban area ranked among the 20 most populous in the world, Dhaka’s average income is so low that it does not even place in the top 100 metropolitan area economies as measured by the Brookings Institution. Thus, the world’s most dense urban area is among the least economically productive. Brookings rated the principally suburban and exurban Hartford metropolitan area number one, with an urban density approximately 1/100th that of Dhaka, Hartford includes the old core city; but as well as the much more substantial primarily suburban or even exurban areas.. Hartford is among the least dense urban areas in the world, at half as dense as Portland and one-fourth as dense as Los Angeles. So much for the illusion that urban density and productivity are joined at the hip.

    Despite Dhaka’s hyper-density, critics complain about Dhaka’s urban sprawl. If Dhaka is "urban sprawl," then the term is meaningless. Perhaps the critics would prefer the rural poor to live in even more crowded shantytowns, or maybe better yet, that they go back home to even more desperate rural poverty. Aspiration is not a bad thing, and if that means cities with more people, covering more land area, so be it.

    Not only does Dhaka have the highest average urban density, but it also has some of the highest neighborhood densities: some slum (shantytown) population densities reach 4,200 per acre, which converts to more than 2,500,000 per square mile or more than 1,000,000 per square kilometer. Estimates of the slum population vary, ranging from a quarter to 60 percent of the area population.

    Dhaka in the Neighborhood

    Dhaka is only 150 miles (250 kilometers) from Kolkata. Both cities were located in the province of Bengal for all but six years of the centuries long period of  British rule. After the division of India and Pakistan in 1947, Dhaka was located in East Pakistan. Kolkata became the capital of the Indian state of West Bengal. For most of their histories, Kolkata was larger than Dhaka. But the Dhaka urban area has just overtaken Kolkata in population. By 2025, the United Nations forecasts that Dhaka will reach 23 million, well ahead of Kolkata’s projected 19 million (Figure 3).

    Dhaka’s growth has been spectacular. In 1970, just before East Pakistan separated from Pakistan to become Bangladesh, the urban area had a population of 1.3 million. Its population grew by more than 10 times, Dhaka growth over four decades trails only Shenzhen among the megacities, which expanded by 30 times over the same period.

    The Metropolitan Area

    Dhaka’s metropolitan area (which includes the urban area and economically integrated rural environs) added approximately 5,000,000 new residents between 2001 and 2011. Dhaka added at least a 50 percent to its population, rising from just under 10 million population to just over 15 million during the decade (Note 1). Few, if any of the world’s largest metropolitan areas or urban areas have achieved such a large percentage population increase in a period of 10 years. Even so, Dhaka’s population added fewer people than some larger metropolitan areas over a similar period, such as Karachi, Jakarta and Shanghai (Figure 4).

    Spatial Expansion

    Consistent with the trend since cities escaped walls, Dhaka has been expanding spatially as its population has increased. Over the past decade, the core municipality, Dhaka, increased its population 45 percent. The suburban and exurban population increase was nearly twice as great, at 85 percent (Figure 5). The core city of Dhaka managed to capture just over one-half the population growth, but because of its larger size, the slower percentage growth rate still resulted in half the additional population being in the city (Figure 6). Dhaka thus further confirms the axiom that as cities become larger, they become less dense.


    River City

    Dhaka may be the worst situated urban area in the world. Dhaka is located in wetlands and virtually surrounded by rivers, some of the greatest in the world.

    • Dhaka is 20 miles (32 kilometers) east of the Padma River, which is the main course of the Ganges River.
    • Only a few miles north of this point, the Padma is joined by the Jamuna River, which is the main course of the Brahmaputra River.
    • The Meghna River, the secondary Brahmaputra River course is 15 miles (25 kilometers) to the east of Dhaka.
    • Little more than 30 miles (50 kilometers to the south is the confluence of the Padma River and the Meghna River, which flows the last few miles to the Bay of Bengal as the Meghna.

    Though Dhaka is 100 miles (160 kilometers) from the Bay of Bengal (the Indian Ocean), the lowest parts of the city are little more than five feet (two meters) above sea level. This means serious flooding. The risk is illustrated in Figure 7. The extent of the risk is illustrated by the fact that the areas not prone to flooding cover less land than the urban area. That means that the necessary urban expansion will be very expensive. With the understandable exodus from rural areas to the city, the problems of high density and, particularly slums could become more acute.

    A City Designed for a Metro?

    The river courses and wetlands have forced Dhaka into a generally north-south orientation. The urban area averages from three to seven miles east to west (five to 11 kilometers) and is nearly 30 miles (50 kilometers north to south. The more circular development that would be expected for an inland urban area is precluded by the rivers and wetlands.

    This unusual city form could serve the city well, however, as it builds its first Metro line. Stations on the planned north to south line will be within a long walk of a much of the urban area. It is hard to imagine an urban form and density more suited for a Metro. Construction is supposed to begin within the next two years.

    Not only is Dhaka the largest world urban area without an urban rail system, it is also the largest without a motorway (freeway). That too will soon change, as two should be under construction soon.

    Political Reform and the Future

    Meanwhile, in an attempt to improve city services, the national government has divided the city of Dhaka into two. The Dhaka City Corporation has now been replaced by the Dhaka North City Corporation and the Dhaka South City Corporation. There is an increasing body of literature suggesting that smaller municipalities perform better (and spend less) than larger municipalities. The Dhaka demerger may be the first significant such move since the 1986 breakup of the Greater London Council by the Thatcher government (Note 2).

    Dhaka begins the next decade undertaking significant challenges in infrastructure, economic growth and government reform. However, perhaps the biggest challenge will be to figure out where to put the additional five million people expected by the 2021 census.

    Wendell Cox is a Visiting Professor, Conservatoire National des Arts et Metiers, Paris and the author of “War on the Dream: How Anti-Sprawl Policy Threatens the Quality of Life.”

    —–

    Note 1: There was an undercount in the 2011 census, ranging from 3.8 percent in rural areas to 5.3 percent in urban areas. This complicates comparison between the 2001 and 2011 census data.

    Note 2: Even after the subsequent creation of the Greater London Council, by the Blair government, most local functions were not transferred, remaining in the 32 local boroughs. A forced amalgamation of Montréal with suburbs was partially reversed by voter referenda in the early 2000s.

    —-

    Photograph: Farmview Supermarket Transit Transfer Center, on one of the urban area’s few north-south arterial  roadways. (by author)