Author: Wendell Cox

  • Core Cities Growing: Available Data Indicates Domestic Migration Losses


    Redaction Notice: September 17, 2012

    Part of this article from June 28, 2012 has been redacted because of difficulties with the US Census Bureau’s 2011 sub-county population estimates. In fact, these were not genuine population estimates at all, but were largely "fair share" allocations of county population change rates based upon the share of population in each jurisdiction. This issue is further described at was revealed on newgeography.com by Chris Briem and our new URL.

    However, the fact remains that domestic migration trends continue to be from historical core cities to the suburbs, as the unredacted data below indicates.


    Just released United States Bureau of the Census estimates indicate that the urban cores of major metropolitan areas (over 1,000,000) grew slightly faster than their suburbs between July 2010 and July 2011. Overall, the historical core municipalities grew 1.03 percent, compared to the suburban growth of 0.93 percent. Among the 51 metropolitan areas, 26 urban cores grew at a faster percentage rate than their suburbs (Note 1). However, suburban areas continued to add many more people. Over suburban areas grew 1,150,000, compared to 462,000 for the urban cores, indicating that approximately 75 percent of new residents were in the suburbs. Suburban areas had greater population growth in 43 of the 51 metropolitan areas (Table 1).

    Table 1
    DELETED


    As was noted in Still Moving to the Suburbs and Exurbs, the core counties of US metropolitan areas, which contain the greatest portion of the historical core municipalities (Note 2) also grew faster than suburban counties between 2010 and 2011. However, that is not an indication of an exodus from the suburbs to urban cores.
    Migration Continues from Cores (County Data)
    There was net domestic migration (people moving between counties of the United States) of minus 67,000 in the core counties, while a net 121,000 domestic migrants moved into suburban areas between 2010 and 2011. The stronger core growth was driven by stronger international migration and a larger natural growth rate (births minus deaths).
    Limited City Data Confirms the Trend
    Migration data is not reported below the county level. As a result, historical core municipality migration data is not available, except where cities and counties are combined. A review of such cases confirms the finding from Still Moving to the Suburbs and Exurbs(Table 2). Among the 12 combined city/counties, there was a net domestic migration loss of 49,000 in the historical core municipalities, while there was a much smaller net domestic migration loss of 1,000 in the corresponding suburban areas.

    Note: Table 2 is retained since the Census Bureau produced genuine population estimates for counties. Table 2 includes only municipalities that are coterminous with counties, and thus were not subject to the "fair share" population growth allocation method inappropriately applied at the sub-county level.


    Table 2
    Historical Core Municipality Domestic Migration 2010-2011
    (Where Cities and Counties are Combined)
      Central City/County Suburban Counties
    PRE-1950 CITY/COUNTIES (55,441) (21,306)
    Baltmore (3,638) 2,297
    Denver 8,281 11,284
    New York (56,982) (41,993)
    Philadelphia (5,466) (7,667)
    San Francisco 416 5,464
    St. Louis (4,959) (5,301)
    Washington 6,907 14,610
     
    POST-1950 CITY/COUNTIES (4,119) 20,179
    Indianapolis (3,401) 5,341
    Jacksonville (1,485) 4,396
    Louisville 18 1,868
    Nashville 749 8,574
     
    NOT CLASSIFIED (Due to Hurricane Katrina)
    New Orleans 10,243 (90)
     
    TOTAL (49,317) (1,217)


    • Among the seven combined city/counties formed before 1950 (excluding New Orleans), the historical core municipalities had a net domestic migration loss of 55,000, while the suburban areas had a smaller net domestic loss of 21,000. In four cases, the historical core municipalities had domestic migration losses. In the three cases in which cities had domestic migration gains, there were also domestic migration gains in the suburbs. In this group, New York had a domestic migration loss of 57,000 despite having an overall population gain of 55,000 (the gain resulting from international migration and natural growth)
    • Among the four combined city/counties formed after 1950, the historical core municipalities had a net domestic migration loss of 4,000, while the suburban areas had a net domestic migration gain of 20,000. In two cases, the historical core municipalities had domestic migration losses. In the two cases in which cities had domestic migration gains, there were also domestic migration gains in the suburbs.
    • New Orleans is a special case, by virtue of the fact that it is "still rebounding from the effects of Hurricane Katrina," according to the Bureau of the Census and remains 20 percent below its 2005 population. New Orleans is the only case that meets the requirement of historical core net domestic migration gain and suburban net domestic migration loss to demonstrate the likelihood of movement from the suburbs to the city. The historical core municipality had a net gain of 10,000 domestic migrants, while the suburbs lost 90, which could indicate that a very small number of people moved to the city from the suburbs (Note 3).

    Moreover, the county data indicates that in 25 of the 49 metropolitan areas with suburban counties, core counties lost domestic migrants between 2010 and 2011.

    The Effect of "Staying Put"

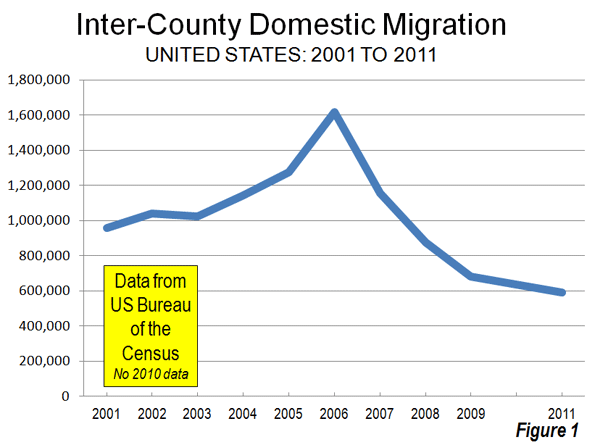
    As with the previously released county population estimates, the city data that is available indicates that Americans are staying put in the difficult economy. Domestic migration has fallen substantially. Over the past year, 590,000 people moved between the nation’s counties. This domestic migration compares to an annual average of 1,080,000 between the 2000 and 2009 (Figure 1). This reduction in domestic migration has made international migration and natural growth more prevalent, and as a result, core growth has been stronger.


    Note 1: An article in this morning’s Wall Street Journal contains information different from this article. The Wall Street Journal article classifies some cities as urban core that this article defines as suburbs (such as Fort Lauderdale [Miami], Aurora [Denver] and Arden-Arcade [Sacramento]). This article defines urban cores as historical core municipalities.

    Note 2: All historical core municipalities are principally in one county, except for New York (city), which is five counties.

    Note 3: The Bureau of the Census domestic migration data is limited to a net number for each county, so it is not possible to determine where people are moving to or moving from.

  • Questioning the Messianic Conception of Smart Growth

    A new analysis from the United Kingdom concludes that smart growth (compact city) policies are not inherently preferable to other urban land use policy regimes, despite the claims of proponents."The current planning policy strategies for land use and transport have virtually no impact on the major long-term increases in resource and energy consumption. They generally tend to increase costs and reduce economic competitiveness." The article goes on: "Claims that compaction will make cities more sustainable have been debated for some time, but they lack conclusive supporting evidence as to the environmental and, particularly, economic and social effects."

    These would not be surprising findings to Newgeography.com readers, who are accustomed to similar analyses rooted in economic, demographic, and environmental data. However, this article appeared in the Spring 2012 issue of the Journal of the American Planning Association, under the title, "Growing Cities Sustainably: Does Urban Form Really Matter?"

    Moreover, the authors are urban planning insiders, including Marcial H. Echenique, a land use and transport professor at Cambridge University, Anthony J. Hargreaves from the Martin Centre for Architectural Studies at Cambridge, Gordon Mitchell from the Faculty of the Environment at the University of Leeds and Anil Namdea of the School of Engineering at the University of Newcastle.

    Smart Growth Criticisms

    Many of the British critiques parallel those made by critics of smart growth for years. They focus particularly on the concern that smart growth generally has neglected economic and social costs. For example, smart growth policies lead to higher house prices by rationing land (such as with urban growth boundaries). Higher house prices lead to less discretionary income for households, so that there is less money for other goods and services, lowering employment levels. The resulting densification leads to more intense traffic congestion, with resulting economic losses and more intense air pollution, which is less healthful.

    The Research

    The authors modeled land use and travel behavior in three areas of England, subjecting them to three land use alternatives: compact development (smart growth), planned development (which I would label "smart growth light") and dispersal, the generally liberal approach common in United States, Canada, Australia and New Zealand for decades after World War II (and still in many US and some Canadian markets).

    Echenique et al analyzed the London metropolitan region (Greater London Authority, Southeast England and East England), which has a population of 20 million and the Newcastle (Tyne and Wear) metropolitan region, which has a population of 1,000,000. They also analyzed a sub-region within London metropolitan region, Cambridge, with a population of 500,000.

    Their model projected little difference in outcomes between the three land use regulatory regimes to 2031. Predictably, land consumption was less under the compact development, but the variation in land consumed varied no more than plus or minus one percent from the trend (base case) in the London area, where only 11 percent of the land is in urban or transport use. Other factors, such as the change in transport energy use, greenhouse gas (GHG) emissions from transport and residences and air pollution varied little between the three regulatory regimes.

    Economic costs in 2031 were projected to be the lowest (best) for the dispersed option and the highest for the compact development option, both in the London and Newcastle metropolitan regions. Planned development ranked second.

    The compact development option scored best in the Cambridge sub-region, while the planned development option was the highest cost. The dispersed option ranked second. The researchers attributed the better result for compact development in the Cambridge area to its uniqueness as a low-density, centrally oriented, high-tech, university community and further noted that densification could "reduce its attractiveness over the longer term."

    Smart Growth Claims: Setting the Record Straight

    Based upon their research and review of the literature, the authors proceed to undermine some of smart growth’s most sacred foundations.

    Smart Growth Claim: Smart growth has little or no impact on house prices:

    Echenique et al: "…restrictions on the supply of development land have led to property price increases, penalizing city dwellers by leading to less dwelling space…”

    Smart Growth Claim: Smart growth increases housing choice:

    Echenique et al: "One downside of this policy is a substantial reduction in choice of dwelling types, with new dwellings being mainly apartments."

    Smart Growth Claim: Smart growth does not increase traffic congestion:

    Echenique et al: The authors cite research indicating that high average density is the main cause of highway congestion in Los Angeles. They also cite Reid Ewing (University of Utah) and Robert Cervero (University of California) who reviewed studies of household travel behavior finding that a doubling of density would lead to only a 5 percent reduction per person, or an increase of 90 percent in travel (Note 1). The authors add: "The obvious conclusion is that an increase in density will increase traffic congestion."

    Smart Growth Claim: Smart growth reduces air pollution:

    Echenique et al: "It can also increase the overall respiratory disease burden as exposure to traffic emissions is increased.

    Smart Growth Claim: "Empty nesters" (aging households with no offspring at home) will seek smaller houses in the urban core: 

    Echenique et al: "There is, however, no substantial evidence that older couples leave their spacious houses and gardens…"

    Smart Growth Claim: Smart growth improves the jobs-housing balance.

    Echenique et al: "One of the main arguments for the dispersed city is that there is no longer a single center where most jobs and services occur. Urban areas, rather, exhibit a dispersed and often polycentric structure, bringing jobs and services closer to residents with a more complex movement pattern not readily served by public transport.

    The authors suggest the following "takeaway:"

    "Urban form policies can have important impacts on local environmental quality, economy, crowding, and social equity, but their influence on energy consumption and land use is very modest; compact development should not automatically be associated with the preferred spatial growth strategy."

    Thus, the Echenique et research contradicts the thesis that compact development or smart growth should replace (make illegal) other regulatory regimes, including the more liberal dispersed pattern.

    "Smart growth principles should not unquestioningly promote increasing levels of compaction on the basis of reducing energy consumption without also considering its potential negative consequences. In many cases, the potential socioeconomic consequences of less housing choice, crowding, and congestion may outweigh its very modest CO2 reduction benefits."

    The British research is an important step toward focusing urban policies on objectives, rather than means. Cities are economic organisms. They have increased their share of the population 10 fold in just two centuries and been pivotal to unprecedented economic growth and affluence. People moved to the cities for economic opportunity, not to sample particular urban forms. Cities best serve their principal purpose and their residents best when they encourage economic growth. The fundamental objective is to maximize the discretionary income of residents, and this can be done while reasonable environmental standards are maintained. Yet, as Echenique et al and others have shown, smart growth tends to retard economic growth. In an age of teetering national economies, failing pension funds and the most uncertain fiscal environment in at least 80 years, the world needs cities to be unleashed for the economic growth. Urban policies that ignore economics need to be replaced with wholistic approaches strongly focused on the key reason that cities exist: to enrich their citizens.

    Wendell Cox is a Visiting Professor, Conservatoire National des Arts et Metiers, Paris and the author of “War on the Dream: How Anti-Sprawl Policy Threatens the Quality of Life.”

    ——

    Photo: Letchworth Garden City, London metropolitan region (by author).

    Note 1: Calculation: According to the research, doubling the density of an area reduces vehicle travel per capita by 5 percent. With 200 percent of the previous population (double the density), vehicle travel would be increased 90 percent (200% [x] 95% [=] 190%).

  • Rio-20: Eradicating Poverty Takes Precedence Over “Green Economy”

    The world’s largest English language newspaper, The Times of India reports that the Rio 20 Summit has agreed with India that "eradicating poverty should be given the highest priority, overriding all other concerns to achieve sustainable development." 

    The Times continued: "After a bitter fight with the developed countries, who wanted the objective of poverty eradication be made subservient to creating a ‘green economy’, India’s demand to put the goal of removing poverty above all other objectives in the final Rio+20 declaration — called "The Future We Want" — was agreed to…"

    The "G77" group of developing nations sought to ensure that economic and social sustainable developed goals were not secondary to "more green themes — such as renewable energy targets." The United States is reported to have supported the G77 position.

  • The Evolving Urban Form: Tokyo

    Tokyo is the ultimate in urbanization, being nearly one-half larger than any other urban area in the world. Further, Tokyo has retained its position as the largest urban area in the world for longer than any period since London’s approximately 100 year run from the early 1800s to the early 1900s. During the 1920s, New York became the largest, but was displaced by Tokyo in 1955.

    Tokyo became the world’s largest urban area by adding more than 20 million people between 1955 and 2000, adding more people than lived in any other urban area in the world during that period. Even with its now slow growth, Tokyo seems likely to remain number one for two decades or more. However, if the breakneck growth of urban areas like Jakarta, Delhi and Manila continues, Tokyo could relinquish its position by 2030, especially if Tokyo begins losing population, joining Japan in that country’s accelerating rate of population decline as is projected (below). 

    The Tokyo region is much more than Tokyo proper (the "ku-area"). It includes Yokohama, which with 3.7 million people is larger than any suburb in the world except for Howrah in the Calcutta area. Kawasaki, between Tokyo and Yokohama has a population of 1.4 million, while Saitama, to the north has 1.2 million. Chiba, on the way to Narita International Airport, is home to nearly 1,000,000. There are multiple possible definitions of the Tokyo region. This article defines the Tokyo metropolitan area as Chiba, Kanagawa, Saitama and Tokyo prefectures (Note 1).

    Suburban Areas: Tokyo also has the largest suburban population of any metropolitan region in the world. Approximately 26.7 million, or 75 percent of the Tokyo region’s 35.4 million population lives in suburban areas. This is the largest expanse of suburbanization in the world. The suburban population increase since 1950 exceeds that of New York, Los Angeles, and Paris combined (Note 2).

    The Core

    Tokyo is unique in having abolished its core municipality. In 1943, the former city of Tokyo was combined with the prefecture of Tokyo. This area was also labeled the Tokyo "metropolis." (Note 3) The prefecture of Tokyo contained a number of additional municipalities, which were not impacted by the merger, while the former area of the city of Tokyo was directly administered by the prefecture. In the intervening decades, the former city has been reorganized into 23 wards (ku), which have obtained considerable self-government authority, emerging as the near equivalent of cities themselves.

    This "ku" area can be considered the historical core municipality. The 23 ku reached a peak population in 1965 of 8.893 million in 1965. In the next 30 years, the 23 ku sustained a population loss of more than 900,000, while the suburban areas were adding more than 20 million. The ku area exceeded its previous peak in the 2010 census, reaching 8.946 million, approximately 50,000 more than in 1965.

    Growth Trends:

    Census data indicates that in 1940, the core accounted for 53 percent of the region’s population. This dropped to 41 percent in 1950, with the largest share of war-time population losses in the ku area. The core gained back to 47 percent of the population in 1960. After that, nearly all growth was in the suburbs. Between 1950 and 2000, 87 percent of the population gain was in the suburbs. In the last decade, the suburbs share of growth dropped to 63 percent (Figure 1 and Table)

    Tokyo Metropolitan Region
    Population by Sector: 1920-2010
    Year Tokyo Region Former City of Tokyo Balance of Tokyo Prefecture Tokyo Prefecture Kanagawa Prefecture Saitama Prefecture Chiba Prefecture
    1920    7,678,000  2,173,000     1,526,000     3,699,000   1,323,000   1,320,000   1,336,000
    1930    9,958,000  1,995,000     3,414,000     5,409,000   1,620,000   1,459,000   1,470,000
    1940  12,740,000  6,779,000        576,000     7,355,000   2,189,000   1,608,000   1,588,000
    1950  13,051,000  5,385,000        893,000     6,278,000   2,488,000   2,146,000   2,139,000
    1955  15,424,000  6,969,000     1,068,000     8,037,000   2,919,000   2,263,000   2,205,000
    1960  17,864,000  8,310,000     1,374,000     9,684,000   3,443,000   2,431,000   2,306,000
    1965  21,017,000  8,893,000     1,976,000   10,869,000   4,431,000   3,015,000   2,702,000
    1970  24,113,000  8,787,000     2,621,000   11,408,000   5,472,000   3,866,000   3,367,000
    1975  27,042,000  8,647,000     3,027,000   11,674,000   6,398,000   4,821,000   4,149,000
    1980  28,697,000  8,349,000     3,269,000   11,618,000   6,924,000   5,420,000   4,735,000
    1985  30,273,000  8,354,000     3,475,000   11,829,000   7,432,000   5,864,000   5,148,000
    1990  31,796,000  8,164,000     3,692,000   11,856,000   7,980,000   6,405,000   5,555,000
    1995  32,577,000  7,968,000     3,806,000   11,774,000   8,246,000   6,759,000   5,798,000
    2000  33,413,000  8,130,408     3,928,592   12,059,000   8,490,000   6,938,000   5,926,000
    2005  34,472,000  8,490,000     4,081,000   12,571,000   8,791,000   7,054,000   6,056,000
    2010  35,618,000  8,946,000     4,213,000   13,159,000   9,048,000   7,195,000   6,216,000
    Data from Census of Japan


    Generally, however the last decade has been far better for the core than in any period since 1960. Over each of the last two five year census periods, the percentage growth in the core has been greater than that of the suburbs, which, examining data from Europe, United States, Canada, and elsewhere is quite unusual.

    Density Comparisons

    Tokyo is often portrayed as one of the world’s highest density urban areas. It is not. At a density of 11,300 per square mile (4,300 per square kilometer), Tokyo is less dense than London (13,700 & 5,300), one-sixth the density of Hong Kong (67,000 & 25,900) and one-tenth the density of Dhaka (115,000 & 44,400). There are two reasons for this:

    1. Tokyo does not have intensely dense central areas. The ku area has a density of 37,300 per square kilometer (14,400 per square kilometer). This is well below the densities of Manhattan (69,000 & 27,000) and the ville de Paris (51,000 & 21,000). Only one of the ku (Toshima) exceeds the density of Paris.
    2. Further, according to the Japan House and Land Survey of 2008, Tokyo has a large stock of detached houses, by definition lower density. Nearly 45 percent of the Tokyo region’s housing is detached. One-third of the dwellings within 30 kilometers (18 miles) of the core are detached. This figure rises to more than 60 percent outside 30 kilometers from the core and 85 percent between 60 and 70 kilometers (37-43 kilometers) from the core (Figure 2).

    Transport

    Tokyo is a transit oriented metropolis, with by far the highest transit usage in the world. In 2007, 65 percent of trips within a 50 mile radius were by mass transit. Overall transit usage is (passenger miles or kilometers) in the Tokyo region is approximately double that of all combined usage in the United States and nearly 10 times that of Paris, according to the Millennium Cities Data base. At the same time, one-way work trip travel times are reported to be the highest in the high income world, at a median of 45.9 minutes (Note 4) for main earners. Work trip travel times from residences are the shortest from the most remote residential locations (60-70 kilometers from the core) at a median of 26 minutes and at 29 minutes from residences between 50 and 60 kilometers from the core. Median travel times are 36 minutes one way within 10 kilometers of the core (Figure 3). The longest commutes are from residences located between 10 and 50 kilometers from the core (6 to 31 miles), which peak at 54.5 minutes each way between 20 and 30 kilometers (12 and 18 kilometers) from the core.

    Toward a City State?

    Japan has been centralizing for decades, principally as rural citizens have moved to the largest metropolitan areas. Since 1950, Tokyo has routinely attracted much more than its proportionate share of population growth. In the last two census periods, all Japan’s growth has been in the Tokyo metropolitan area as national population growth has stagnated. Between 2000 and 2005, the Tokyo region added 1.1 million new residents, while the rest of the nation lost 200,000 residents. The imbalance became even starker between 2005 and 2010, as Tokyo added 1.1 million new residents, while the rest of the nation lost 900,000. (Figure 4)

    Eventually, Japan’s imploding population will finally impact Tokyo. Population projections indicate that between 2010 and 2035, Tokyo will start losing population. But Tokyo’s loss, at 2.1 million, would be a small fraction of the 16.5 million loss projected for the rest of the nation (Figure 5). If that occurs, Tokyo will account for 30 percent of Japan’s population, compared to 16 percent in 1950. With Japan’s rock-bottom fertility rate, a declining Tokyo will dominate an even larger share of the country’s declining    population and economy in the coming decades.

    Wendell Cox is a Visiting Professor, Conservatoire National des Arts et Metiers, Paris and the author of “War on the Dream: How Anti-Sprawl Policy Threatens the Quality of Life.”

    Photo: Yamanote Loop Train, Tokyo Station (by author)

    Note 1: The government defines a Tokyo major metropolitan area, using smaller area data. However, insufficient data is readily available for this article.

    Note 2: These three urban areas have the largest suburban populations in the high income world outside Tokyo and Osaka-Kobe Kyoto.

    Note 3: The term "Tokyo metropolis," has misled any number of analysts to believe that it means the Tokyo metropolitan area. In fact, it means only the prefecture of Tokyo, which is only one of the from one of the from four to eight prefectures (part or all) that can be considered a part of the metropolitan area, depending on the definition. Thus any comparison of the "Tokyo metropolis" with anything else in metropolitan in the world is best dismissed out of hand.

    Note 4: Based on an analysis of the detailed data, it is estimated that the one-way average work trip travel time is more than 48 minutes.

  • The Evolving Urban Form: Cairo

    Cairo, Egypt’s capital, has long had some of the highest neighborhood population densities in the world. In the 1960s it was reported that one neighborhood had a density of 353,000 people per square mile (136,000 per square kilometer). The most recent data from the Egypt’s statistical authority (the Central Agency for Public Mobilisation and Statistics or CAPMAS) indicates that within the Cairo governate (the province in which the municipality of Cairo is located), the overall urban population density is 117,000 per square mile, or 45,000 per square kilometer. This means that urbanization in the Cairo governate is more than 1.5 times the population density of Manhattan (in New York city) and the ville de Paris.

    In recent decades, government officials have undertaken a program to encourage people to decentralize their living and work arrangements, and to move to several new towns in the area.

    Overall, the governates that comprise the Cairo metropolitan area have a population of approximately 20.5 million, according to a CAPMAS 2012 estimate. This is approximately the same size of metropolitan areas such as New York and Mexico City. The Cairo metropolitan area is comprised of three governates, which are principally urban, but which also contain millions living in rural areas:

    The governate of Cairo (Al Qāhirah) is the largest of these jurisdictions. Parts of the Cairo governate and the Giza government would be considered in the urban core, but the political jurisdictions in Cairo do not lend themselves well to conventional core versus suburban designations (Note 1). The Cairo governate is located on the east bank of the Nile River, and spreads many kilometers, especially to the East and South. This area includes the Cairo international airport and Heliopolis, one of the most affluent areas in the Cairo metropolitan area. The governate of Cairo also includes "New Cairo," an attractive new town located in the southeastern quadrant. This area includes a number of university campuses, multi-story condominium buildings and detached housing. Eventually, New Cairo is expected to have 4,000,000 residents, though the new town is little more than a decade old and still has a modest population of approximately 125,000.


    New Cairo: University

    The governate of Giza (Al Jīzah) is located on the west bank of the Nile River and, in reality, constitutes a continuation of the urban core. Giza is home the Great Pyramids, which rise on a hill from the western urban fringe. Giza is also home to considerable informal housing development   much different than generally found in other megacities. Much of the development is high rise, with concrete block buildings rising seven and more stories from the streets. Generally, the streets are so narrow and irregular that they are not shown on local maps. The governate of Giza also includes the "6th of October" new town, located on the west side of the hills on which the Great Pyramids stand. Eventually, 6th of October is expected to have a population of 3,000,000, though it appears to be less than 500,000 today. The governate of Giza also includes the Sheihk Zayed new town. These new towns have commercial activities, multi-story condominiums and detached housing.


    Sheikh Zayed: Detached Housing


    Giza: Informal Housing

    The governate of Kalyoubia (Al Qalyūbīyah) is located to the north of the Cairo and Giza governates. Unlike Cairo and Giza, Kalyoubia has a majority of its population living in rural areas. However, the continuous urbanization of Cairo stretches into the governate and includes more than 1.5 million people, much of it in the municipality of Shubrā al-Khaymah.

    Slowing Growth: Like many of the developing world’s megacities, Cairo has experienced its strongest growth in the half century after World War II. In 1937, the metropolitan area had a population of under 3 million. This more than doubled to 7 million by 1966, and again to 14 million by 1996.  From 1996 to 2012, the metropolitan area added 5.5 million people (Note 2). However, more recently, the growth rate has slowed considerably. Between 1996 and 2006, metropolitan Cairo added 28 percent to its population (an increase of more than 4,000,000). However the 2006 to 2012 rate would indicate that by 2016, Cairo is likely to add only 13 percent to its population (approximately 2,000,000 people).

    While the governates of the Cairo metropolitan area do not lend themselves well to urban versus suburban population analysis, Cairo clearly has expanded geographically as it has added population. The more central governates of Cairo and Giza have continued to grow, however much of the growth has been in peripheral areas, such as New Cairo, 6th of October and the Helwan area, south of Cairo on the Nile (in the Cairo governate).

    Where the Growth is Occurring: Even so, the governate of Cairo accounted for only 19 percent of the metropolitan area’s growth from 2006 to 2012, down from 34 percent in the 1996 to 2006 period. The governate of Giza had the greatest growth between 2006 and 2012, at 47 percent of metropolitan growth, an increase from the 39 percent of 1996 to 2016. The governate of Kalyoubia accounted for 34 percent of the growth from 2006 to 2012, an increase from 26 percent between 1996 and 2016 (Figure 1).

    Cairo’s Physical Expansion: Even though the suburban versus core analysis is difficult to gauge from governate data, a paper by Mootaz Farid and Hatam Al Shafie of Cairo University contains depictions of the urban footprint from 1943 to 1982. In each of the depicted years, the continuous urbanization of Cairo covers only a miniscule share of the present urban footprint. Figure 2 provides an estimate of the urban footprint in 1968 compared to the 2012 urban footprint, indicating that much of the growth was on the periphery.

    The Key to Decentralization: The key to making the new towns successful in attracting more residents lies with the dispersion of employment. There is a wealth of international experience to indicate that "self-sufficient" new towns really cannot be self sufficient if they are within commuting distance of the rest of the urban area. In the case of Cairo (as elsewhere) it will prove critical to ensure that there are substantial local employment opportunities for new town residents, although it is likely that a serious degree of self sufficiency may prove difficult to achieve.

    Wendell Cox is a Visiting Professor, Conservatoire National des Arts et Metiers, Paris and the author of “War on the Dream: How Anti-Sprawl Policy Threatens the Quality of Life.”

    Top Photograph: The Great Pyramid (Giza). All photos by author

    ——

    Note 1: In the past decade there  have been reorganizations of governates in the Cairo metropolitan area. This article uses three present governates for all years.

    Note 2: Earlier population data is from http://statoids.com/ueg.html.

  • The Atlanta Transportation Tax: Too Much for Too Little

    On July 31, voters in a 10 counties of the 28 county Atlanta metropolitan area will vote on whether to raise the sales tax by one cent for $8 billion in transit and highway projects over 10 years. The measure is highly tilted towards transit spending. Sadly, this would do virtually nothing to reduce Atlanta’s traffic or its travel times.

    In a metropolitan area in which barely one percent of travel (Figure 1) and less than five percent of work trip travel is by transit, the tax measure devotes more than 50 percent of the funding to transit (Figure 2).   Yet in reality, the focus of any transportation revenue issue should be on reducing travel times, whether by transit or highways. This is how transportation improves an urban economy. The reality is that with nearly all travel by highways and transit’s inherently slower travel times, much of the tax money would have virtually no impact on reducing travel times or traffic congestion.


    Atlanta’s Traffic Congestion: Promoters of the tax claim that the highway projects will reduce traffic congestion. Atlanta is well known for its serious traffic congestion. There are two reasons for this:

    1. Atlanta’s sparse freeway system is limited to little more than a belt route (I-275) and three radial freeways (I-20, I-75 and I-85) that converge into two in the one place more capacity is needed, the core. Trucks are not permitted on freeways inside the beltway, which concentrates the considerable interstate traffic on a single roadway, I-275. If Atlanta had the higher freeway density (freeway mileage per square mile) of Los Angeles or Minneapolis-St. Paul, traffic congestion would be far less of a problem.
    2. Atlanta’s regional arterial (high capacity streets) system is virtually non-existent. For this reason, I proposed (in 2000) development of a one-mile terrain constrained grid of arterials. The Atlanta Regional Council (ARC), the local metropolitan planning organization, has included a somewhat more modest (but useful) arterial grid in is regional plan.

    Yet despite its reputation, Atlanta’s traffic congestion could be worse. The latest INRIX National Scorecard rates the Atlanta metropolitan area as having the 15th worst traffic congestion in the nation, behind Portland, which is nearly 60 percent smaller and twice as dense, with its compact city policies. Among high-income world metropolitan areas with more than 5 million population, only Nagoya outside the United States may have a shorter work trip travel time (Note 1). Atlanta’s world-competitive work trip travel time of 29 minutes is faster than that of far more transit-dependent Toronto (33 minutes), smaller Sydney (34 minutes) and much smaller Vancouver (31 minutes), despite their compact city policies.

    The Transit Projects: So Much for So Little: The proposed transit projects have virtually no potential to reduce work trip travel times and traffic congestion. Approximately one-fifth of the transit funding would be used to rehabilitate and upgrade the MARTA subway system, a need that should have been legitimately funded from the existing MARTA sales tax. Another nearly 20 percent of the transit funding would be spent on the "Belt-Line" streetcar project in central Atlanta. The role of the Belt-Line is more "city building" (read "real estate speculation") than it is transportation. It will do nothing to reduce work trip travel times. Further, it is exceedingly costly. The extravagance of this project is illustrated by an annualized capital cost alone (principally construction) high enough to pay the lease on a new mid-sized car for each new regular passenger (Note 2). Moreover, that is before the likely capital cost escalation and the substantial operating subsidies (Note 3).

    Transit’s problem in Atlanta (and elsewhere) lies outside its core downtown job market (Note 4). Most destinations in a metropolitan area cannot be reached by transit in a way remotely competitive with the car. The transit tax would only modestly increase transit ridership. ARC projects the transit projects will boost daily transit ridership less than 10 percent. If all of the forecast new passengers were to be taken from cars (which is not likely), the net reduction in traffic volumes over ten years would be equal to less than three months of traffic growth. Put another way, at the best, the transit proposals would mean that the traffic congestion expected on January 1, 2025 would not occur until March of 2025. That’s less than 90 days of traffic relief for 10 years of taxation.

    The Road Projects: In a metropolitan area in which personal mobility predominates, roadway improvements, such as expansions, an arterial grid in Atlanta’s case and completion of the GA-DOT HOT (high occupancy toll) system provide far greater  potential for reducing travel times. There is another significant benefit to highway investments. As traffic speeds increase fuel efficiency improves and both air pollution and greenhouse gas emissions are reduced.

    Under the tax referendum, a significant opportunity to improve mobility would be missed, to the detriment of the vast majority of Atlantans; over 88 percent of all commuters in Atlanta travel by car, but the figure is only slightly less (83 percent) among low income commuters (Figure 3).

    What’s Right About Atlanta: For all its problems, Atlanta has much to be proud of. Former World Bank principal planner Alain Bertaud said of Atlanta in a 2002 study:

    While income and population were rising very fast, Atlanta managed to keep a very low cost of living. A worldwide cost of living survey conducted by the Economist Intelligence Unit in 2002 found that Atlanta had the lowest cost of living among major US cities and ranked 63rd among major cities around the world. This achievement is remarkable in view of the rapid rate of growth of the metropolitan area over the last 20 years. It shows that while demographic and economic growth has certainly contributed to generate pollution and congestion, the various actors responsible for the management of metropolitan Atlanta must have done a lot of things right. High income growth and high demographic growth combined with a low cost of living suggests that labor markets are functioning well and that housing does not encounter important supply bottlenecks (Note 5).

    As successful as local land use policies have been in making Atlanta livable by making it affordable (the first principle of livability is affordability), local leaders need to start over with a proposal primarily designed to reduce traffic congestion, reduce travel times and grow the economy.

    Politics Trumps Reducing Traffic Congestion: Traffic congestion is most effectively addressed by projects that reduce work trip travel times, since it is the concentration of work trips at peak hours that   causes the worst congestion. The long-suffering commuters of Atlanta would have been far better served by a program that selected projects based upon their effectiveness in reducing travel times. A simple cost per hour of delay measure would have been appropriate. Atlanta deserves a much better deal.

    Wendell Cox is a Visiting Professor, Conservatoire National des Arts et Metiers, Paris and the author of “War on the Dream: How Anti-Sprawl Policy Threatens the Quality of Life.”

    —————–

    Note 1: Based upon 109 metropolitan areas for which data is available. Japanese data is reported as median work trip travel time. Nagoya’s median work trip travel time (27 minutes) is less than Atlanta’s (29 minutes). The excessively long rail commute times of many Japanese commuters could make Nagoya’s average work trip travel time as great or greater than Atlanta’s. Dallas-Fort Worth has the shortest work trip travel time of any metropolitan area over 5 million population (and the lowest transit work trip market share)

    Note 2: A team led by Oxford University professor Bengt Flyvbjerg found that passenger rail systems typically have cost overruns of 45 percent. If the average increase is experienced, the Belt-Line cost could escalate to $1 billion.

    Note 3: The capital cost is discounted at 4 percent over 35 years, which equals more than $5,500 annually. A new Ford Fusion, Toyota Camry, Honda Accord or Nissan Altima could be leased for less than $5,000 annually, with no down payment, according to internet sources (such as http://www.leasecompare.com/)

    Note 4: More than 93 percent of metropolitan Atlanta’s employment is outside downtown (and Mid-Town). Downtown’s share of employment declined from 2000 to 2009 (latest data available from the US Census Bureau, County Business Patterns).

    Note 5: Atlanta was most affordable major metropolitan area in the US, UK, Canada, Australia, Ireland, New Zealand and Hong Kong in the 8th Annual Demographia International Housing Affordability Survey.

    ——

    Photo: Atlanta Freeway (by author)

  • China’s Top Growth Centers

    Hefei, the capital of historically poor Anhui province emerged as China’s top growth center among major metropolitan areas over the past 10 years. Metropolitan areas from the interior, the Yangtze Delta and the central and northern coast were the fastest growing, displacing Guangdong’s Pearl River Delta, long the growth center for the country.   (Figure 1).

    China’s Trends in Context: China’s growth rate has fallen substantially and the United Nations has projected that the nation will experience population decline starting between 2030 and 2035. However, China’s urban areas have grown strongly as people have continued to move to cities for better opportunities. According to World Bank research, China’s economic progress since 1981 has lifted more people out of poverty than ever before in the world.

    Never before in history have so many people moved to urban areas in such a short period of time.

    Since the reforms began in approximately 1980, all of China’s population growth has been urban. Rural areas lost approximately 110 million people between 1980 and 2010. That is approximately equal to the population of Mexico and more than each of the nations in the world except for 11. Over the same three decades, 470 million people were added to the urban areas. That is more than 1.5 times the population of the United States.

    China’s Metropolitan Areas: This article provides an analysis of the urban districts (qu) of Chinas urban regions (routinely mislabeled "cities"). These districts are designated by regional officials as urban for urban development. Since the peripheral urban districts are principally rural, the combination of urban districts (Shi Shixiaqu)in a region are akin to a metropolitan area (labor market area).

    Among the metropolitan areas that began the decade (2000) with more than 1,000,000 inhabitants, the slowest 10 year growth rate was 36 percent. In comparison, among the 51 US metropolitan areas with more than 1,000,000 population, only three (Las Vegas, Raleigh and Austin) would have placed in China’s top 20, and not higher than 14th (Table). As in the US, the most rapid urban growth is taking place in smaller metropolitan areas with less than 5 million in 2010.  

    Top 20 Metropolitan Growth Centers in China: 2000-2010
    Rank Metropolitan Area 2000 Population 2010 Population Change % Geography
    1  Hefei, AN        1,659,000    3,352,000       1,693,000 102.0%  I 
    2  Xiamen, FJ        2,053,000     3,531,000       1,478,000 72.0%  C 
    3  Zhengzhou, HEN        2,560,000     4,254,000       1,694,000 66.2%  I 
    4  Suzhou, JS        2,473,000     4,074,000       1,601,000 64.7%  Y 
    5  Wenzhou, ZJ        1,916,000     3,040,000       1,124,000 58.7%  Y 
    6  Ningbo, ZJ        2,201,000     3,492,000       1,291,000 58.7%  Y 
    7  Urumqi, XJ        1,753,000     2,744,000          991,000 56.5%  I 
    8  Weifang, SD        1,380,000     2,044,000          664,000 48.1%  N 
    9  Shenzhen, GD        7,009,000   10,358,000       3,349,000 47.8%  P 
    10  Hangzhou, ZJ        4,243,000     6,242,000       1,999,000 47.1%  Y 
    11  Beijing, BJ      12,874,000   18,827,000       5,953,000 46.2%  N 
    12  Changsha, HUN        2,123,000     3,094,000          971,000 45.7%  I 
    13  Chengdu, SC        5,268,000     7,677,000       2,409,000 45.7%  I 
    14  Shanghai, SH      15,758,000   22,315,000       6,557,000 41.6%  Y 
    15  Hohhot, NM        1,407,000     1,981,000          574,000 40.8%  I 
    16  Nanjing, JS        5,098,000     7,166,000       2,068,000 40.6%  Y 
    17  Shijiazhuang, HEB        1,970,000     2,767,000          797,000 40.5%  N 
    18  Fuzhou, FJ        2,124,000     2,922,000          798,000 37.6%  C 
    19  Qingdao, SD        2,721,000     3,719,000          998,000 36.7%  N 
    20  Tianjin, TJ        8,146,000   11,090,000       2,944,000 36.1%  N 
     Metropolitan areas with more than 1,000,000 population in 2000.  
     Metropolitan areas consist of urban districts (qu) 
    Geographical Codes
     C   Central Coast 
     I   Interior 
     N   Northern Coast 
     P   Pearl River Delta (Coast) 
     Y   Yangtze River Delta (Coast) 
     Data from National Bureau of Statistics of China 


    The Interior: Six of the top 20 gainers were in the interior, including fastest growing Hefei. This reflects the appeal of   lower labor costs and perhaps also that rural migrants often prefer to work in regions   closer to their homes and families in agricultural regions. These six metropolitan areas had an average growth rate of 71 percent, the largest rate of any geographical grouping.

    • The capital of Anhui province, Hefei (photo), had the largest gain, at 102 percent. Hefei grew from 1.659 million to 3.352 million. Hefei is developing one of the most dispersed urban forms among China’s metropolitan area and there continues to be considerable construction. Hefei’s population growth rate was nearly one-half more than of second place Xiamen. Anhui is one province removed from the coast and Hefei is only 115 miles (185 kilometers) from the Yangtze Delta’s Nanjing.
    • The third ranked metropolitan area was Zhengzhou (photo), the capital of Henan province (also separated from the coast by one province), which experienced a 66 percent population gain.
    • Urumqi, the capital of China’s large northwestern province of Xinjiang ranked 7th with a gain of 57 percent. Urumqi is by far the most remote from the East Coast of the large gainers (2,000 miles or 3,250 kilometers from Tianjin, near Beijing).
    • Other interior fast growers were Changsha, capital of Hunan (12th, with 46 percent growth), Chengdu, the capital of Sichuan ranked 13th, with 46 percent growth and Hohhot, capital of Nei Mongol (Inner Mongolia), ranked 15th, with a growth rate of 41 percent.


    Hefei


    Zhengzhou

    Central Coast: Xiamen (photo), one of the first special economic zones designated after Shenzhen and placing 2nd in growth, added 72 percent to its population. This metropolitan area is centered on an island in Fujian province on China’s central coast, less than 10 miles from to Jinmen (Quemoy), an island controlled by Taiwan. Fuzhou, the capital of Fujian province was another central coastal metropolitan area among the top 20 growth centers (18th, at 38 percent). The average growth rate of these metropolitan areas on the central coast was 55 percent.


    Xiamen

    Yangtze River Delta: Like the interior, the Yangtze River (Changjiang) Delta also placed six metropolitan areas among the top 20 growth centers. The average growth rate was 52 percent. The Yangtze River Delta is a large area with a population greater than that of the Pearl River Delta, but with urban regions that are separated from one another by considerable rural territory (unlike the Pearl River Delta). The exception is the Shanghai-Suzhou-Wuxi corridor (Note), where the urbanization is continuous in limited corridors.

    • Suzhou (Photo), part of which (Kunshan qu) abuts Shanghai ranked as the third fastest growing metropolitan area, with a growth rate of 65 percent. Suzhou added 1.6 million people and is nearing 4.1 million. As the growth of Shanghai continues to spill westward and northward, Suzhou is likely to continue its strong growth.
    • The other three top 10 metropolitan growth areas in the Yangtze River Delta were in the province of Zhejiang, including Wenzhou at 5th, growing 59 percent (Photo), Ningbo, one of the nation’s largest ports was 6th, at 59 percent and Hangzhou, the provincial capital, which Marco Polo claimed was the largest city in the world in his Travels was 10th, at 47 percent.
    • Shanghai, the nation’s largest metropolitan area, placed 14th in growth, at 42 percent. Shanghai had the largest numeric growth, adding 6.6 million to its population, more people than live in Toronto.
    • Nanjing, the capital of Jiangsu province ranked 16th in growth, at 41 percent.


    Suzhou


    Wenzhou

    Northern Coast: Five northern coastal metropolitan areas were among the top 20 metropolitan gainers, with an average growth rate of 42 percent.

    • Weifang, in the province of Shandong ranked 8th in growth, the highest rating among metropolitan areas in the northern coastal area. Weifang added 48 percent to its population.
    • Beijing ranked 12th in growth, at a 46 percent rate. Beijing’s numeric growth was second only to Shanghai, at 6 million.
    • The other northern coastal growth centers were Shijiazhuang, the capital of Hebei (17th, at 41 percent) and 175 miles (280 kilometers), south of Beijing. Qingdao, of brewing fame ("Tsingtao" beer) ranked 19th, with a growth rate of 37 percent, while Tianjin, which is close enough to be Beijing’s port, ranked 20th, with a growth rate of 36 percent.

    Pearl River Delta: In contrast the Pearl River Delta, the home of so much urban growth over the past 30 years, placed only one metropolitan area among the top 20 growth centers, Shenzhen. Shenzhen placed 9th, with a growth rate of 48 percent. This is in stark contrast to 1990 to, when Shenzhen and adjacent Dongguan both more than doubled in population.

    Missing Giants: Chongqing was not among the top growth centers. Chongqing has been routinely mischaracterized as China’s largest metropolitan area (because of semantic confusion over the word "city"). Chongqing’s metropolitan districts grew only 22 percent and the region (a provincial equivalent) lost population. Neighborhood rival Chengdu, capital of Sichuan province from which Chongqing was separated in 1996 more than doubled its growth rate. Manchuria, China’s "Dongbei" (Northeast) also failed to place any areas among the fastest growing. Shenyang, the center of China’s Rust Belt, grew less than 10 percent, though Harbin, capital of Helonjiang grew nearly 30 percent.

    More Growth to Come: Despite an overall population that is just peaking, urban population growth is expected to be substantial. In addition to the 470 million people that have moved to urban areas since 1980, the United Nations projects that another 340 million people will be added to the urban areas by 2045 (after which a modest decline is expected). Over the same 35 years, China’s rural population is expected to fall by 387 million (Figures 2 and 3). Where these new migrants move and how they make do will be among the most important urban stories of the next decade.


    Wendell Cox is a Visiting Professor, Conservatoire National des Arts et Metiers, Paris and the author of “War on the Dream: How Anti-Sprawl Policy Threatens the Quality of Life”.

    ——-

    Note: Includes Kunshan, part of the Suzhou metropolitan area, but a separate urban area (between the Suzhou urban area and the Shanghai urban area).

    Note: Corrected Hefei data on 6/3/2012.

    Top photo: Hefei: All photos by author.

  • The Evolving Urban Form: Shenzhen

    No urban area in history has become so large so quickly than Shenzhen (Note 1). A little more than a fishing village in 1979, by the 2010 census Shenzhen registered 10.4 million inhabitants. It is easily the youngest urban area to have become one of the world’s 26 megacities (Figure 1). Most other megacities were the largest urban areas in their nations for centuries (such as London and Paris) and a few for more than a millennium (such as Istanbul and Beijing). Shenzhen’s primitiveness can be seen in this 1980 internet photo, and shows the beginnings of construction. A 2006 photograph of one of Shenzhen’s principal streets (Binhe Avenue) is above.

    Pearl River Delta Location: Shenzhen is located in Guangdong Province adjacent to Hong Kong’s northern border. Shenzhen is China’s fourth largest urban area, following Shanghai, Beijing, and Guangzou-Foshan.

    Along with Dongguan, Guanzhou, Foshan and smaller neighbors, Shenzhen forms the Pearl River Delta,   the world’s largest manufacturing center. The Pearl River Delta, along with Hong Kong and Macau, constitutes the world’s largest populated extent of urbanization, with nearly 50 million people. They live in a land area of just over 3,000 square kilometers (7,800 square kilometers. By comparison the world’s largest urban area, Tokyo-Yokohama, has a population of 37 million and covers 3,300 square miles (8,500 square kilometers). I recall from a Hong Kong to Guangzhou trip on the Canton-Kowloon Railway in 1999 that there was plenty of rural territory on the 100 mile (170 kilometers) route. Today,   development takes place along virtually the entire route (Note 2).

    The Special Economic Zone: Shenzhen was established as China’s first special economic zone by Deng Xiaoping in the period of liberalization after the death of Mao Zedong. The special economic zones allowed for alternative, generally market oriented reforms, with the end of improving economic growth. The result was economic progress far greater than anyone expected. The special economic zone program was eventually extended to several other urban areas in the nation.

    Some governmental officials preferred the previous state dominated approach, despite its greater poverty and sought to roll back the reforms. This threat reached its peak in the early 1990s, after Deng Xiaoping had retired from his government positions. In response, Deng undertook his renown "southern tour" to Shenzhen, Guangzhou and other parts of Guangdong province to promote the new economic approach and the progress that had been made. During the southern tour, Deng is reputed to have said that "to be rich is glorious." Three decades before he had said “I don’t care if it’s a white cat or a black cat. It’s a good cat as long as it catches mice." He committed to results rather than to ideology, in a sense Shenzen and its environs are the engines of non-state owned prosperity. Eventually, the publicity from Deng’s southern tour overwhelmed the opposition and China accelerated its move toward a more open economy.

    Shenzhen’s Core: Unlike the fast growing, but much smaller new urban areas of the United States (for example Phoenix, which is largely a low rise, dispersed expanse of suburbanization), Shenzhen has developed a dense central business district. Even though Shenzhen started the decade of the 1990s with little more than 1,000,000 residents, by 1996 it had the fourth tallest building in the world, the Shun Hing Tower. Only the Sears Tower in Chicago and the two World Trade Center Towers in New York were taller.

    In 2011, the Shun Hing Tower lost its local tallest building title to the Kingkey Financial Tower, at 1,449 feet (447 meters) is the 10th tallest building in the world. Now, the world’s second tallest building is under construction in Shenzhen, the Ping An International Financial Center, which is reported to reach 2,125 feet or 655 meters, with 116 floors. Only the Burj Khalifa (2,717 feet, 828 meters, 163 floors) in Dubai would be higher. Like Shanghai and Chongqing (and unlike most Chinese urban areas), Shenzhen has a highly concentrated central business district. As a result deserio.com rates Shenzhen’s skyline as 9th in the world (Note 3).

    Outer Areas Growing Faster: The three central districts (the qu of Futian, Luohu and Nanshan) grew from 2.4 million to 3.3 million population between 2000 and 2010, a rate of 38 percent. However, as is natural for a growing urban area, most of the growth was in the outer districts (Photo: Suburban Shenzhen), which grew from 4.6 million to 7.0 million, a growth rate of 52 percent. Thus, nearly three-quarters of the growth was on the periphery (Figure 2). Population growth in the earlier 1990 and 2000 period was slightly less concentrated in the outer area (68 percent). But overall  population growth has begun to slow down, with Shenzhen added 3.3 million new residents, compared to 4.3 million between 1990 and 2000.  


    Photo: Suburban Shenzhen (Longgang)

    The Urban Area: Overall, it is estimated that the Shenzhen urban area (area of continuous development) has a 2012 population of 11.9 million, with a land area of 675 square miles (1,745 square kilometers). The urban area has now crossed the border into the Huiyang district of the Huizhou region, to the east. The population density is estimated at 17,600 per square mile, or 6,800 per square kilometer,  approximately 10 percent less dense than the average urban area in China. Shenzhen is about one quarter the density of Hong Kong and double the density of Paris.

    Rich and Poor in Shenzhen: Like all urban areas, Shenzhen is a mixture of rich and poor. Shenzhen is generally considered one of the most affluent urban areas in China, yet it also has a very large low income population. Approximately one-sixth of China’s residents are considered to be temporary migrants; many work in boomtowns like Shenzhen. Seven million of these 220 million migrants live in Shenzhen,  considered the largest migrant population of any region in the nation. Migrants are attracted to Shenzhen for the same reasons people have moved to cities from early on: to get ahead. At the same time, their remittances sent back home are contributing to improved living conditions far beyond Shenzhen. It is expected that reforms to the "hukou" system of residence permits will allow many of the temporary migrants in Shenzhen and elsewhere obtain permanent residence status. Many of the migrants live in factory housing, or older, very densely packed buildings. At the same time, Shenzhen has a large number of world-class condominium buildings.


    Photo: Older Housing: Central Business District


    Photo: Newer Housing: Central Business District

    The Future of Shenzhen: Much of Shenzhen’s future will depend upon the economy of the Pearl River Delta and the extent to which migrants are able to obtain permanent residency status. There is still land enough in the region for substantial population growth. The longer term integration of the Hong Kong and Shenzhen economies could produce an even larger economic dynamo than the two that are currently separate. One thing is certain, however. Shenzhen has led China into a new economic and urban reality.

    Wendell Cox is a Visiting Professor, Conservatoire National des Arts et Metiers, Paris and the author of “War on the Dream: How Anti-Sprawl Policy Threatens the Quality of Life”.

    —–

    Note 1: Shenzhen is one of China’s regions, often called "cities," as translated from "shi."  "Shi" more resemble regions than "cities" in the non-Chinese sense, this article refers to "shi" as regions. "Shi" were formerly referred to in English as prefectures. A province is usually composed of "shis" and other "shi" level jurisdictions.

    Note 2: These combined regions are not a metropolitan area, for two reasons. First; there is little daily commuting between them and thus they are not a single labor market, which is the definition of a metropolitan area. Second, one of the regions, Hong Kong, has a border with Shenzhen that has international style customs and immigrant controls, which further precludes the two adjacent regions from being a single metropolitan area. In the longer run, greater affluence, greater mobility between the regions and relaxation of border controls could merge some or all of the now separate metropolitan areas.

    Note 3: Desiro.com, unlike some other skyline rating systems, places a premium on the density of buildings, rather than simply amalgamating building heights from throughout an urban area.

    Photo: Shenzhen:  Binhe Avenue from the Shun Hing Tower (by author)

  • 84% of 18-to-34-Year-Olds Want To Own Homes

    A survey by TD Bank indicates that 84 percent of people 18 to 34 years old intend to buy homes in the future. This runs counter to thinking that has been expressed by some, indicating that renting would become more popular in the future. Much of the "home ownership is dead or dying” comes from short sighted trend analysis in which home ownership data begins with the start of the housing bubble in the late 1990s. The latest data from the Bureau of the Census indicates that the home ownership rate in the first quarter was 65.4 percent, the lowest rate since 1997. In fact, however, before the housing bubble, homeownership hovered generally at 65 percent or below, after having increased strongly from 44 percent in 1940 to 61 percent in 1960. The increase in homeownership during the bubble was the result of profligate lending policies that were not sustainable. The decline from the artificially high housing bubble peak in no way diminishes the successful expansion of homeownership in the nation during the decades that reason prevailed in home lending.

  • Sydney’s Long and Lengthening Commute Times

    The New South Wales Department of Transport Housing and Transportation Survey reports that the average one way work trip in the Sydney metropolitan area (statistical division) reached 34.3 minutes in 2010. As a result, Sydney now has the longest reported commute time in the New World (United States, Canada, Australia and New Zealand), except for the New York City metropolitan area (34.6 minutes).

    Longer Commutes than in Dallas-Fort Worth or Los Angeles: Sydney’s average work trip travel time has increased approximately 10 percent since 2002. The 34.3 minute one way travel time is approximately 30 percent higher than that of larger Dallas-Fort Worth, which about half as dense. Part of the reason for the longer commute time in Sydney is its far greater transit dependence. Approximately 24 percent of work trip travel is on transit (which is slower for most trips). This compares to approximately 2 percent of travel in Dallas-Fort Worth.

    Even Los Angeles, with its reputation for "gridlock" has a shorter average commute time, at 28.1 minutes. This is made possible by the extensive Los Angeles freeway system, greater use of automobiles and more dispersed employment patterns (despite the higher density of Los Angeles relative to Sydney). The average Sydney commuter spends nearly an hour longer traveling to work each week than the average Los Angeles commuter.

    Even Longer Commutes Ahead? Sydney’s densification policies (urban consolidation policies) seem likely to lengthen commute times even more in the future, given the association between higher densities and greater traffic congestion.