Author: Wendell Cox

  • The Evolving Urban Form: Osaka-Kobe-Kyoto

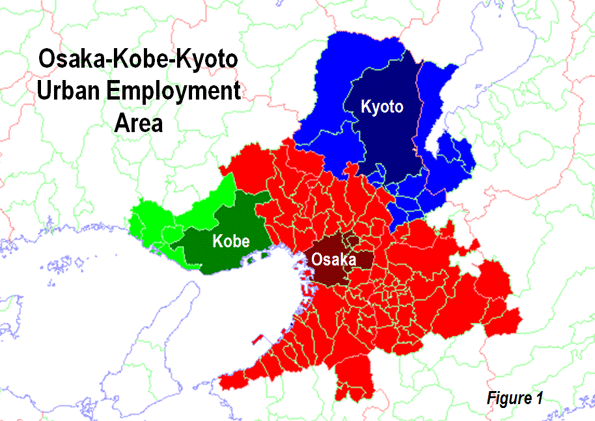
    Osaka-Kobe-Kyoto is Japan’s second largest urban area and ranks as the 12th largest urban area in the world. With a population of approximately 17,000,000 and a land area of 1240 square miles (3200 square kilometers), Osaka-Kobe-Kyoto has a population density of 13,700 per square mile (5,200 per square kilometer), making it the most dense major urban area in Japan and among the denser urban areas in the high income world. The larger metropolitan region includes four prefectures, Osaka, Kyoto, Kyoto and Nara (Figure 1).


    Adapted from WikiCommons user Kzaral

    World’s Largest Conurbation

    Osaka-Kobe-Kyoto is a conurbation, an urban area that has grown together from multiple cores (here, the urban areas of Osaka, Kobe and Kyoto). Most urban areas grow concentrically from a single core. In the process their suburban growth can engulf and incorporate smaller urban areas (such as Gifu in Nagoya, Bogor in Jakarta or Newark in New York), However, conurbations — such as  Rhine-Ruhr region in Germany (Essen, Dortmund, Duisburg, and Bochum), Katowice-Gliwice-Tychy (upper Silesia) in Poland, Dallas-Fort Worth and Minneapolis-St. Paul in the United States — develop when major urban areas grow together (or merge), forming a larger urban area.  

    The municipality of Osaka, the largest in the region, long had been Japan’s second municipality exceeded by Yokohama (in the Tokyo region) in 1980; in the 17th century it was the country’s commercial capital. Kobe, across Osaka Bay (20 miles or 32 kilometers), was one of the most cosmopolitan cities and was the site of the devastating 1995 earthquake, from which it has recovered remarkably. Kyoto is the former, historic, imperial capital as is 35 miles (55 kilometers) north of Osaka. The previous imperial capital, the historic municipality of Nara is also located in the region. Both cities are well known for its historic temples.

    Post-War Growth

    Between 1950 and 1970, the Osaka-Kobe-Kyoto region experienced extraordinary growth, adding nearly 5.7 million residents. The increase from 9.8 million to 15.5 million exceed that of all urban areas in the world except Mexico City (approximately 6 million) and Tokyo (11 million). Tokyo’s 20 year increase was the largest numerically in history for a metropolitan region. By comparison, Los Angeles, the Western world’s fastest growing metropolitan region between 1950 and 1970, added 5.0 million new residents. In 1970, only the Tokyo and New York urban areas were larger than Osaka-Kobe-Kyoto.

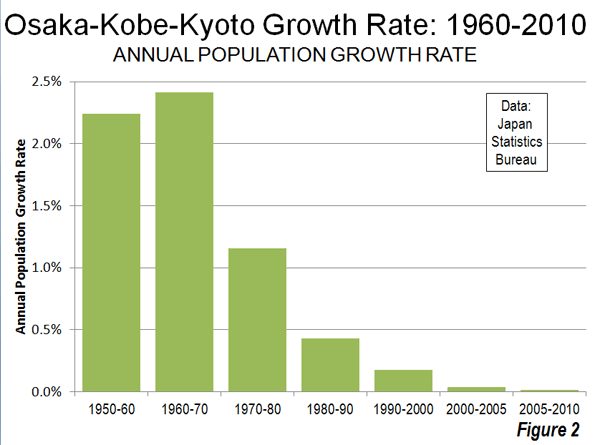
    The region grew quickly after the Second World War but experienced an even higher growth rate — well in excess of two percent during Japan’s great economic takeoff in the 1960s. During the 1970s, the annual growth rate dropped to 1.5%, still well above the current experience of most high income urban areas.

    Stagnating Growth, Presaging Decline

    As it turned out, the 1970s represented the conclusion of Osaka’s strong growth. From then on, growth fell quickly and   has since virtually stopped. It  appears likely that Osaka-Kobe-Kyoto will become the world’s first megacity (over 10 million population) to fall into population decline (see  end note).

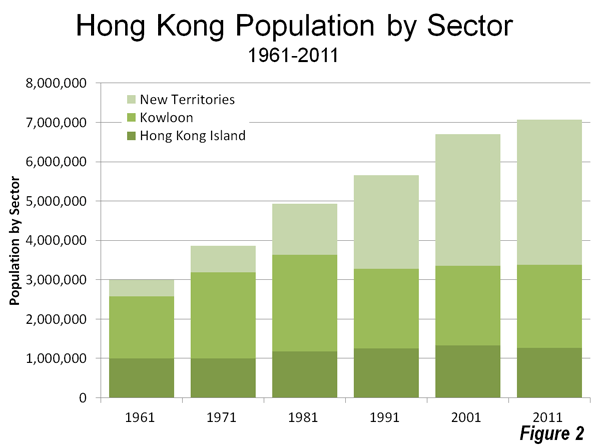
    According to the 2010 census, the metropolitan region’s population of approximately 18,500,000 barely grew, adding only 13,000 residents from 2005. This represents  an annual growth rate of 0.014%, a decline of 60% from its anemic  0.036% growth rate between 2000 and 2005 (Figure 2).

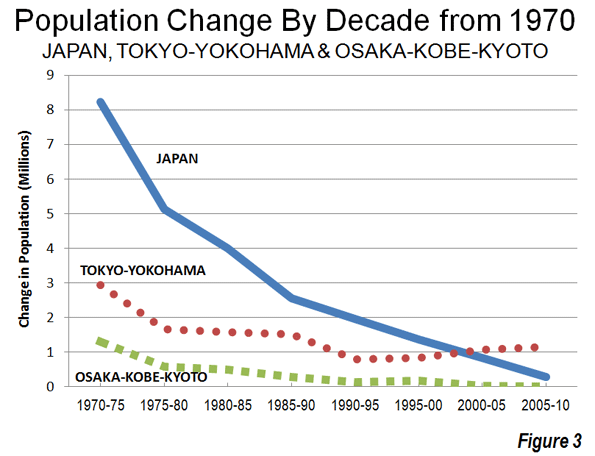
    Osaka-Kobe-Kyoto’s is falling behind even Japan’s slow growth pace, being 2005 to 2010 expanding by  less than one third of the national rate. One reason for this lies in continued concentration in the Tokyo metropolitan region (Figure 3). The Tokyo area captured 56% of the growth between 1970 and at 2010. Over the past five years Tokyo has added 1.1 million people, while the balance of the nation lost 1.4 million people. Japan’s population has stabilized and is expected to fall into decline in the years to come.

    Suburban Expansion

    As is typical of major metropolitan regions in the world virtually all of the growth in Osaka-Kobe-Kyoto since 1950 has been outside the historically core municipalities. Only 150,000 of the 6,250,000 population increase from 1950 to 2010 was in the municipalities of Osaka, Kobe or Kyoto. The suburbs accounted for nearly 98% of the region’s growth.

    As growth came to a virtual stop, however, the historical core municipalities have done better. Between 2000 and 2010, the municipalities of Osaka, Kobe and Kyoto had added 125,000 people, while suburban areas lost 79,000. The net result was a 46,000 population increase between 2000 and 2010 (Table).

    Osaka-Kobe-Kyoto Metropolitan Region
    Population Trend: 1920-2010
    Historical Core Municipalities
    Year Osaka Kobe Kyoto Total Suburban Region
    1920 1,253 609 591 2,453 4,289 6,742
    1930 2,114 765 788 3,667 4,668 8,335
    1940 3,252 1,090 967 5,309 5,056 10,365
    1950 1,956 765 1,102 3,823 5,941 9,764
    1960 3,012 1,114 1,285 5,411 6,774 12,185
    1970 2,980 1,289 1,419 5,688 9,780 15,468
    1980 2,648 1,367 1,473 5,488 11,866 17,354
    1990 2,623 1,477 1,461 5,561 12,556 18,117
    2000 2,599 1,494 1,468 5,560 12,883 18,443
    2005 2,629 1,525 1,475 5,629 12,847 18,476
    2010 2,666 1,545 1,474 5,685 12,804 18,489
    In 000s
    Data from Census of Japan


    Transport in Osaka-Kobe-Kyoto

    With its high density, Osaka-Kobe-Kyoto has a high level of traffic congestion. Osaka-Kobe-Kyoto ranks 19th highest road traffic density out of more than 90 urban areas for which data is available in the Millennium Cities database. This traffic density is despite the fact that Osaka-Kobe-Kyoto has the highest mass transit market share of any high-income world megacity outside Tokyo. In 2007, 57 percent of trips in the metropolitan region were by mass transit, compared to Tokyo’s 65 percent. By comparison, mass transit’s market share is approximately 30 percent in the Paris region and 10 percent in greater New York. The annual number of transit trips in Osaka-Kobe-Kyoto alone is more than one-half the total US ridership, despite having a population only 6% of the US.

    However, lest any conclude that Osaka-Kobe-Kyoto (or Tokyo) might be a model for US or European metropolitan areas, it must be noted that transit’s market share has dropped from 80 percent in the late 1980s.   Osaka-Kobe-Kyoto (as well as Tokyo and Nagoya) also demonstrate the "mass transit cannot be profitable" claim is a myth. In each of these three metropolitan areas, the vast majority of transit travel is on profitable private suburban railways.

    Osaka-Kobe-Kyoto: The Future?

    Very few large metropolitan areas have experienced population declines, and none with the vast scale and historic importance of Osaka-Kobe-Kyoto. Smaller metropolitan areas like Pittsburgh, Cleveland, Liverpool, Manchester and Genoa have stagnated and even experienced periods of population decline. But none have faced a future bleaker  than likely for Osaka-Kobe-Kyoto. United Nations population projections indicate that Japan will decline in population by 20 percent between 2010 and 2050. As the nation’s economic activity continues to centralize in Tokyo, this could be particularly be ominous for Osaka-Kobe-Kyoto. The trains could get less crowded.

    Wendell Cox is a Visiting Professor, Conservatoire National des Arts et Metiers, Paris and the author of “War on the Dream: How Anti-Sprawl Policy Threatens the Quality of Life

    —–

    Note: New York is reputed to have become the first megacity in the world in the 1920s. As late as 1980, there were only five urban areas in the world with more than 10 million residents. In 2010 there were 25 megacities.


    Photo: Himeji Castle, Kobe Prefecture. By Jean Love

  • New US Urban Area Data Released

    This morning the US Bureau of the Census released data for urban areas in the United States. The urban population of the US rose to 249.3 million in 2010, out of a total population of 308.7 million. Urbanization covered 106,000 square miles, representing 3.0 percent of the US land mass. Overall urban density was 2,342 per square mile (905 per square kilometer).

    The Los Angeles urban area was again the nation’s most dense, at 6,999 per square mile (2,702 per square kilometer), a slight reduction from the 7,068 figure (2,729 per square kilometer) in 2000. The most dense urban areas with more than 1,000,000 population were Los Angeles, San Francisco, San Jose, New York and Las Vegas (in that order).

    Overall, the 41 major urban areas had an average density of 3,245 per square mile (1,253 per square kilometer). The table below provides data for the major urban areas and overall data.

    United States Urban Area Data: 2010 Census
    Major Urban Areas  & Summary
    Rank Urban Area
    Population
    Land Area (Square Miles)
    Density
    Density per Square KM
    1 New York–Newark, NY–NJ–CT
    18,351,295
    3,450
    5,319
    2,054
    2 Los Angeles–Long Beach–Anaheim, CA
    12,150,996
    1,736
    6,999
    2,702
    3 Chicago, IL–IN
    8,608,208
    2,443
    3,524
    1,361
    4 Miami, FL
    5,502,379
    1,239
    4,442
    1,715
    5 Philadelphia, PA–NJ–DE–MD
    5,441,567
    1,981
    2,746
    1,060
    6 Dallas–Fort Worth–Arlington, TX
    5,121,892
    1,779
    2,879
    1,112
    7 Houston, TX
    4,944,332
    1,660
    2,979
    1,150
    8 Washington, DC–VA–MD
    4,586,770
    1,322
    3,470
    1,340
    9 Atlanta, GA
    4,515,419
    2,645
    1,707
    659
    10 Boston, MA–NH–RI
    4,181,019
    1,873
    2,232
    862
    11 Detroit, MI
    3,734,090
    1,337
    2,793
    1,078
    12 Phoenix–Mesa, AZ
    3,629,114
    1,147
    3,165
    1,222
    13 San Francisco–Oakland, CA
    3,281,212
    524
    6,266
    2,419
    14 Seattle, WA
    3,059,393
    1,010
    3,028
    1,169
    15 San Diego, CA
    2,956,746
    732
    4,037
    1,559
    16 Minneapolis–St. Paul, MN–WI
    2,650,890
    1,022
    2,594
    1,002
    17 Tampa–St. Petersburg, FL
    2,441,770
    957
    2,552
    985
    18 Denver–Aurora, CO
    2,374,203
    668
    3,554
    1,372
    19 Baltimore, MD
    2,203,663
    717
    3,073
    1,187
    20 St. Louis, MO–IL
    2,150,706
    924
    2,329
    899
    21 Riverside–San Bernardino, CA
    1,932,666
    545
    3,546
    1,369
    22 Las Vegas–Henderson, NV
    1,886,011
    417
    4,525
    1,747
    23 Portland, OR–WA
    1,849,898
    524
    3,528
    1,362
    24 Cleveland, OH
    1,780,673
    772
    2,307
    891
    25 San Antonio, TX
    1,758,210
    597
    2,945
    1,137
    26 Pittsburgh, PA
    1,733,853
    905
    1,916
    740
    27 Sacramento, CA
    1,723,634
    471
    3,660
    1,413
    28 San Jose, CA
    1,664,496
    286
    5,820
    2,247
    29 Cincinnati, OH–KY–IN
    1,624,827
    788
    2,063
    796
    30 Kansas City, MO–KS
    1,519,417
    678
    2,242
    865
    31 Orlando, FL
    1,510,516
    598
    2,527
    976
    32 Indianapolis, IN
    1,487,483
    706
    2,108
    814
    33 Virginia Beach, VA
    1,439,666
    515
    2,793
    1,078
    34 Milwaukee, WI
    1,376,476
    546
    2,523
    974
    35 Columbus, OH
    1,368,035
    510
    2,680
    1,035
    36 Austin, TX
    1,362,416
    523
    2,605
    1,006
    37 Charlotte, NC–SC
    1,249,442
    741
    1,685
    651
    38 Providence, RI–MA
    1,190,956
    545
    2,185
    844
    39 Jacksonville, FL
    1,065,219
    530
    2,009
    775
    40 Memphis, TN–MS–AR
    1,060,061
    497
    2,132
    823
    41 Salt Lake City–West Valley City, UT
    1,021,243
    278
    3,675
    1,419
    Total
    133,490,862
    41,139
    3,245
    1,253
    Other Urban Areas
    115,762,409
    65,247
    1,774
    685
    Total Urban
    249,253,271
    106,386
    2,343
    905
    Rural
    59,492,267
    3,431,052
    17
    7
    Total Population
    308,745,538
    3,537,439
    87
    34
    Share Urban
    80.7%
    3.0%
  • The Evolving Urban Form: Ho Chi Minh City (Saigon)

    Vietnam may be the next China. With a nominally communist government, Vietnam has liberalized its markets and is prospering from an increased reliance on exports. Vietnam’s gross domestic product per capita is still only about $3000, but has been among the faster growing economies over the past 10 years. Vietnam is well positioned to capture any growth that might be diverted from China’s east coast urban areas as labor costs there rise and concerns increase about the influence of that country’s powerful state-owned corporations.

    Political power in Vietnam may lie in Hanoi, but the economic heart of Vietnam is Ho Chi Minh City, the former Saigon. Ho Chi Minh City is the core of Viet Nam’s largest urban area, which is headed toward a population of 9 million, including exurban areas beyond the municipal boundaries.

    For planning purposes, the area has been divided into five subregions. The urban development trends in the Ho Chi Minh City area are similar to those of high income world urban areas. The core is experiencing little or no population growth, while peripheral areas are growing much more strongly (Photo: Core and Saigon River).


    Core and Saigon River

    Suburbanizing Ho Chi Minh City: Historical data for the districts of Ho Chi Minh City are difficult to obtain. However, the last five years provide a representative view of urban development trends, especially when combined with population projections through 2025 as reported in transportation planning documentation from the Ho Chi Minh City master plan.

    The inner core area has a population of approximately 1.4 million, with little growth expected, and is expected to decline in population by 2025. At the same time, the inner core is particularly dense, with more than 100,000 residents per square mile or 40,000 residents per square kilometer. This is approximately 1.5 times as dense as Manhattan or the ville de Paris. By 2025, the inner core will decline further to a population of 1.3 million. One unusual distinguishing characteristic of the core is very thin buildings, the result of taxation based upon building width (Photo: Tax induced thin buildings)


    Tax induced thin buildings

    Growth is stronger, but still limited in the outer core area (adjacent to the core, but differentiated because of its lower density). Over the past five years, the outer core grew from approximately 2.2 million to 2.5 million, which is strong growth in most high income world urban areas but not as notable for a rapidly growing urban area in the developing world. This growth is expected to moderate even further by 2025, when the population is expected to reach only 2.6 million. The population density in the outer core area is 60,000 per square mile or 23,000 per square kilometer.

    In contrast, almost all  the growth is expected outside the core, with both less formal development and very attractive housing (Photo: New suburban housing).


    New suburban housing

    The urban fringe areas, or the second ring of development beyond the inner core grew from 1.5 million in 2004 to 2.0 million in 2009, a 31% growth rate. By 2025, the urban fringe is projected in transportation planning documentation to grow to 3.0 million. The population density of the urban fringe is 14,500 per square mile or 5,500 per square kilometer, nearly as dense as the city (municipality) of San Francisco.

    The suburban areas within the municipality of Ho Chi Minh City grew from 1.0 million in 2004 to 1.3 million in 2009, again approximately a 30% growth rate. By 2025, the suburban areas are expected to experience the greatest growth, adding 1.6 million population, rising to 2.9 million residents.

    Comparable data for the exurban areas outside the Ho Chi Minh City municipality are not as readily available. However, it is projected that from 2007 to 2025 the population in these areas will rise from 2.6 million to 4.1 million.

    Overall, the municipality grew from 6.1 million population in 2004 7.2 million in 2009, for an 18% growth rate. Including the municipality and the exurbs, it is expected that there will be an increase from 9.1 million population in 2007 to 13.9 million in 2025. At least 95% of this growth is expected to be outside two core areas (Figure 1).

    Employment growth is also projected to be dominated by areas outside the two core areas. Between 2007 and 2025, it is expected that 80% of the new employment will be in peripheral areas.

    Building a Metro: Ho Chi Minh City may have the highest personal transportation market share outside North America. The personal vehicle (motorcycle and car) share of travel is 92%, leaving just 8% for transit (one estimate indicates an even lower 5%). Most of this travel by motorcycle, which sometimes carry three or more people.  As Ho Chi Minh City becomes more prosperous, the share of travel by automobile will likely increase. Automobile ownership is rising at 20 percent annually, more than twice the rate for motorcycle ownership.

    The government would like to change this pattern and has embarked on building a Metro in hopes of increasing transit’s market share to between 40% and 50% by 2025. This huge capital investment will be largely limited to feed and serve the core areas that will account for virtually none of the population increase and little of the new employment.

    There is no precedent for an increase in transit usage remotely of the magnitude that is sought in Ho Chi Minh City. In fact, consultants for the Asian Development Bank were so concerned that they provided an alternative projection for the system, indicating a 2025 transit market share of 22%, instead of the official goal of 40% to 50%. The consultants indicated:

    As noted earlier, the above demand models were adjusted to reflect the Government “policy” objective of achieving 40-50% PT mode share by 2025. This will entail a massive shift in travel behaviour and introduction of some very strong transport and policy initiatives. Clearly there is a risk that this may not happen as quickly or to the extent targeted. Therefore forecasts were developed for a “trend” scenario – still based on major PT transport improvements and strong policy initiatives, but with parameter values based on the consultants’ experience of what has been achieved in other cities.

    However, virtually tripling transit’s market share to 22% seems little less doubtful than increasing it to 40% to 50%. The consultant provided no examples to indicate that such an increase had "been achieved in other cities."

    Personal Mobility in Ho Chi Minh City: One of the challenges for a pedestrians in Ho Chi Minh City – like Hanoi – is dodging the swarm of motorcycles in crossing streets. Even with the Metro, more and more will buy motorcycles and cars. Traffic congestion is likely to worsen. This is principally because, even in congested urban areas, door to door travel tends to be more rapid by personal modes than by transit.

    Fortunately, the authorities are allowing the urbanization to expand, which will limit the growth of traffic congestion. They would do well to follow the advice of urban planners like Shlomo Angel (of New York University and Princeton University), who recommends building a grid of arterials streets to accommodate the growth on lower cost peripheral lands.   Strategies such as these provide Ho Chi Minh City the potential to suburbanize gracefully, maintain its high level of personal mobility and contribute substantially to its continued economic progress.

    Wendell Cox is a Visiting Professor, Conservatoire National des Arts et Metiers, Paris and the author of “War on the Dream: How Anti-Sprawl Policy Threatens the Quality of Life

    Top photo: Typical transport in Ho Chi Minh City

    All photos by author

  • Federal Transit Administration Weighs In on Honolulu Mayor’s Race

    The Federal Transit Administration (FTA) has intervened in the Honolulu Mayor’s race against challenger and former Hawaii Governor Ben Cayetano. Governor Cayetano and Mayor Peter Carlisle are locked in a bitter contest that could determine whether the proposed $5.1 billion rail line is built. Mayor Carlisle is a strong supporter of the rail line. Challenger Cayetano has promised to "pull the plug" on the rail system. Recent polls show that the project’s former thin majority support among Honolulu residents has now turned to opposition.

    At a 1:30 p.m. press conference yesterday (March 13), Governor Cayetano released e-mails from the FTA indicating concerns about the rail project. According to Cayetano, "Not only it is apparent that FTA officials share some of our concerns, but it’s also apparent that they warned the city about pending litigation if certain things were not done."

    One of the FTA emails, obtained from the administrative record said “I do not think the FTA should be associated with their lousy practices of public manipulation and we should call them on it.”

    Reflecting a surprising ability to "turn on a dime," FTA quickly responded in an apparent attempt to diffuse Governor Cayetano’s point. According to KITV, "In response to the press conference, a spokesman for the Honolulu Authority for Rapid Transportation issued the following statement on behalf of the FTA:"

    There is no question that this project has overcome early obstacles because of a much improved Federal partnership with the City of Honolulu and State of Hawaii over the last several years. The Federal Transit Administration believes that this project will bring much needed relief from the suffocating congestion on the H-1 Freeway and provide a real transportation alternative for the people of Oahu as gas prices rise.

    Curiously, the FTA’s statement contradicted its own previous position on the traffic impact of the rail line. In its January 2011 "record of decision" for the project, FTA indicated:  "Many commenters [on the Draft EIS] reiterated their concern that the Project will not relieve highway congestion in Honolulu. FTA agrees…" Further, it is unusual for federal agencies to take part in local election campaigns.

    The Honolulu rail project was covered in more detail in a recent newgeography.com commentary, Honolulu’s Money Train.

    Clarification (March 15). The complete quotation above was not used because it was not necessary to the point, which was FTA agreed that highway congestion would not be relieved by rail in its record of decision, but in its statement on Tuesday appears to have reversed that view. We are unaware of any change in the technical documentation that would have justified such a change.

    The complete quotation was "Many commenters [on the Draft EIS] reiterated their concern that the Project will not relieve highway congestion in Honolulu. FTA agrees, but the purpose of the project is to provide an alternative to the use of congested highways for many travelers.” The "provide an alternative" clause was omitted because it was unrelated to the apparent change in position on traffic congestion by FTA.

    "FTA agrees." in the article above, has been changed to "FTA agrees…"

  • Honolulu’s Money Train

    Honolulu is set to construct an ambitious urban rail project. It’s a $5.125 billion behemoth that this metropolitan area with less than a million residents may not be able to afford.

    Honolulu’s Beleaguered Residents

    Critically, there is plenty of competition for the scarce dollars that Honolulu residents have to spare. The city’s basic infrastructure is in bad shape.

    (Sewer) Water, Water Everywhere: A consent decree signed between local officials and the Environmental Protection Agency requires major upgrades to the sewer system. Sewer overflows are not unusual. Just a few days ago, 51,000 gallon raw sewage spilled into a local stream. The state issued a brown water alert for the entire island of Oahu (which is also the combined city and county of Honolulu), including Waikiki Beach and all other beaches. As of this writing, the brown water advisory has not been cancelled. Just in the last year, the state has reported 17 sewage spills and four brown water alerts. For this to happen in a highly tourist dependent economy is nothing short of astounding.

    More than Leaky Pipes: The city’s water system is in need of major upgrades. From 2004 to 2009, water main breaks were virtually a daily occurrence. In an effort to solve the problem, the city has raised water rates 60 percent in the last five years and plans another 70 percent increase over the next five years. How much more will be required after that is anyone’s guess. "How are people going to make it? I just don’t know" reacted City council Budget Chair Ann Kobayashi.

    Unfunded Government Employee Liabilities: In just three years, unfunded city and county employee pension and retiree benefits have risen from $15,000 to $21,000 per Honolulu household. The state’s actuarial consultant says things are going to get worse. The demographics are skewed against financial control, since people are living longer, and the number of retirees is rising relative to the workers who must pay (most of whom cannot even dream of such rich benefits).   All of this means higher tax bills for Honolulu households.

    High Cost of Housing, High Cost of Living: Honolulu residents already endure the most unaffordable housing  in the nation, with median house prices 8.7 times median household incomes. That is three times Dallas-Fort Worth.  Honolulu’s overall cost of living is also the highest in the nation, outside six metropolitan areas in the greater New York and San Francisco Bay Areas. Honolulu residents pay $1.41 to buy what $1.00 buys in St. Louis, 1.24 for each $1.00 in Austin and $1.21 for each $1.00 in Phoenix.

    Choices: This is not about easy choices. The sewer remediation, water system maintenance, government employee pension and government employee retiree health care benefits are mandatory. The rail expenditures are not.

    The Rickety Rail Project

    Yet the city of Honolulu would tax its residents even more to pay for a 20 mile rail line to empty farmland well beyond the urban fringe. This is a project not unlike the early 1900s land speculation schemes of Henry Huntington in Los Angeles and the Sweringens of Shaker Heights (Cleveland). There is, however, one important difference. The Huntington and the Swearingens bet their own money. Honolulu is betting the money of its taxpayers.


    End of the Honolulu Rail Line

    The city hopes to receive $1.55 billion from the federal government, with local residents left to pay a hefty 70 percent of the cost. This $3.575 billion local share would create the highest tax burden for any urban rail line ever built in the nation, at more than $10,000 per household. But residents should "thank their lucky stars" if that’s all they have to pay, given the history of cost overruns on such projects around the world.

    Stacking the Deck: The Federal Court Challenge: The planning process is being challenged in federal court. The plaintiffs argue that the rail selection process eliminated more cost effective options with biased analysis. This would not be the first time.

    Annie Weinstock, Walter Hook, Michael Replogle, and Ramon Cruz of the Institute for Transportation Development and Policy (with a foreword by Oregon Congressman Earl Blumenaur),  cited circuitous routing of a busway that biased ridership forecasts in favor of light rail for the suburban Washington Purple Line. Weinstock, Hook, Repogle and Cruz refer to a similar "deck stacking technique" that favored an expensive rail project over a busway in the suburban Washington Dulles corridor. They fault local officials more than federal:

    While there is no outright pro-rail bias at the FTA, there is indeed FTA complicity in the rail bias of city and state level mass transit project sponsors. The FTA, when evaluating New Starts and Small Starts project applications, tends to bow to political pressure to favor locally preferred alternatives and ignore certain forms of rail bias by the project sponsors

    Pulling the Plug on Rail? Former Governor Ben Cayatano has filed to run against Mayor Carlisle in the August 2012 election. In announcing his entry, Governor Cayatano said "I will pull the plug on rail." Polls show Mr. Cayetano ahead of both Mayor Carlisle and a third candidate.

    Capital Cost Escalation: A state report indicated that construction costs could rise well above forecast. Every penny above the $5.125 billion capital cost will be the responsibility of local taxpayers. Based upon the international experience, this could easily raise the per household cost from $15,000 to $20,000.

    Ridership Optimism Bias: Echoing general concerns raised by Weinstock, Hook, Repogle and Cruz (above), the state report indicated concern over an optimism bias in the ridership projections. For example, the city expects 60 percent of rail riders to use the bus to get to the train.  This is four times the rate of the largest new rail system built in the nation (Washington’s Metro).  Using the bus to connect to the train makes travel much slower and this factor has often been over-estimated by rail planners. This unrealistic assumption alone could qualify the Honolulu ridership forecast as among the most inaccurate in history.  Fewer riders. more money out of residents pockets.

    A Billion Here, A Billion There: As if all of this were not enough, a report for the Federal Transit Administration, obtained by the Star Advertiser through a freedom of information request, indicates that the operating costs of the transit system may be understated by as much as $1 billion over the next 20 years. That’s $3,000 per Honolulu household (Note 1).

    Federal Doubts: Federal Transit Administration Regional Administrator Leslie Rogers expressed concern about Honolulu’s ability to afford the project in a letter to local officials, noting that the funding program is insufficient. Local taxpayers likely will need to pony up more.

    Debt Limit Suspended: After having claimed it could afford the rail debt, the city suspended its debt limit — a fact discovered four months after the fact by the Star Advertiser.  Usually, breaches of trust like this become evident only much later in the rail construction process. A suspended debt limit means more money out of taxpayer pockets, or worse. Jefferson County, Alabama filed bankruptcy after not being able to afford payments on its sewer debt.

    How Would Rail Change Honolulu

    With rail, Honolulu there are two ways that Honolulu will be changed:

    What Will Change: Walling Off the Waterfront. The elevated design of the rail system is so intrusive that the local chapter of the American Association of Architects opposes the proposal. The elevated line would run directly in front of the waterfront. Its oppressive design would separate the rest of the historic Aloha Tower area from the rest of the city and could preclude future attractive "placemaking" development (see lead photo, courtesy of the Honolulu Chapter of the American Institute of Architects).

    No Traffic Relief: Despite being only the 52nd largest metropolitan area in the nation, Honolulu has the second worst traffic congestion in the nation (see figure), according to INRIX, the leading international reporting source. Honolulu and Los Angeles are the only US metropolitan areas ranked in the worst 25 out of 200 in Western Europe and the United States. Even with the rail system, local plans call for traffic congestion to get worse.

    Getting the Choices Right

    Incumbent Mayor Peter Carlisle recently returned from a Potemkin Village tour of Manila, raving about that city’s rail system. Governor Cayateno, whose familiarity with Manila extends well beyond a scripted tour, called Mayor Carlisle’s comparison with Manila "comedic," noting that most residents cannot afford a car or that Manila has more than 10 times as many people.  


    Manila Rail System: Part the Mayor Did not See

    The mayor may not have been aware that more than 4,000,000 – more than one-third – of Manila’s (National Capital Region) residents live in slums, shantytowns and informal settlements, where sewers are rare if not non-existent. Government projections indicate that the slum population will rise to 9,000,000 by 2050. More than one-half of Manila’s population will be in slums.


    Manila Slum

    In his recent "state of the city’" address, Mayor Carlisle mused "Manila without rail transit would be unthinkable." That may be the view of an itinerate visitor, but not of the majority who never ride it. For millions, a Manila with sewers is unimaginable. First world urban areas all have sewers. But many do not have rail systems. Honolulu could use some genuine prioritization and less contempt for the hard earned income of its residents.

    Wendell Cox is a Visiting Professor, Conservatoire National des Arts et Metiers, Paris and the author of “War on the Dream: How Anti-Sprawl Policy Threatens the Quality of Life

    —–

    Note 1: Illinois Senator Everett McKinley Dirksen, who was minority leader of the United States Senate in the 1960s is reported to have said: "A million here, a million there, pretty soon, you’re talking real money." The line has been often repeated, though the rise in government spending is indicated by the inflation from "millions" to "billions."

    Note 2: Manila’s rail system serves a very small market and represents a small share of transit ridership. The latest available data suggested that barely five percent of transit ridership was on rail.

    Top Photo: Visual of rail system in downtown Honolulu (courtesy of American Institute of Architects, Honolulu Chapter) 

    Photo credits: All others by author

  • Owen McShane: 1941-2012

    Newgeography.com lost a one of its first columnists, a regular contributor and good friend with the passing of Owen McShane.

    Owen McShane (Robert Ivan Owen McShane) was born in 1941 and died on March 6, 2012. His long and successful career in public policy was built on a strong academic foundation. He graduated from the University of Auckland, earning degrees in architecture and urban planning.  He continued on to be awarded a masters degree in city and regional planning at the University of California, Berkeley. There he studied under fabled Aaron Widavsky, chairman of the Political Science Department. His master’s thesis dealt with a US federal program intended to reduce unemployment and promote business development in central cities.

    He joined the new City Development Division of Auckland City Council after graduating from the University of Auckland. After returning from America, Owen held positions in both the public sector and government. He was a columnist for the National Business Review  and has been published in many magazines and newspapers.

    In recent years, Owen directed the Centre for Resource Management Studies in New Zealand. The Centre seeks to promote "a heightened awareness and understanding" of the environment and is committed to the "the promotion of scientifically robust, research-based and rational decision-making processes at all levels in matters concerning the environment." Owen was also a regular participant and presenter at the annual American Dream Coalition conferences.

    Owen developed an understanding of economics, which assisted him in avoiding the disconnected romanticism that sometimes characterizes architecture and urban planning. Combining economics with architecture and urban planning made his contributions more effective by adding the crucial human element.

    From Owen’s perspective, rational urban policy was not determined by remote or theoretical visions of the city that he was trained to plan. The success of a city was rather judged by the standard of living experienced by its residents. For example, his How Can Cities with Unaffordable Housing be Ranked Among the Most Livable Cities in the World? (newgeography.com, June 9, 2009) may have been the first to point out that popular indexes of the quality of life in international urban areas routinely ranked the most unaffordable at the top. This kind of analysis led Owen to postulate that " genuine sustainable development" had to work from middle class people and families too" in The Disappearance of the Next Middle Class (newgeography.com, August 24, 2010).  

    Owen McShane was an untiring advocate of ordinary people, championing individual aspirations in a world that has increasingly been captured by bureaucratic theories that take little or no account of their preferences or their economic advancement.

    Owen will be greatly missed both in New Zealand and far from its shores.


    Photo: Courtesy of the Heartland Institute

  • The Evolving Urban Form: Hong Kong

    Hong Kong has experienced its slowest decadal growth in at least 70 years, according to the results of the recently released 2011 census. Between 2001 and 2011, Hong Kong added only 5.4 percent to its population, a decline of more than two-thirds from its 1991-2001 rate. Hong Kong’s slowest growth rate since 1921-1931 was between 1981 and 1991, when 13.8 percent was added to its population. In previous decades growth had been much greater (Figure 1).

    Further, despite Hong Kong’s much larger population base today, the numeric growth from 2001 to 2011 was also the smallest since the 1921-1931 decade. Hong Kong added 363,000 residents for a total of 7,072,000 in 2011. The increase is barely one-third of the 1,034,000 residents added between 1991 and 2001. Much of Hong Kong’s population growth in the last 60 years had been driven by its better standard of living relative to mainland China. It seems likely that the growing prosperity of the past decade on the mainland has made Hong Kong less attractive for migrants.

    High Income World’s Most Dense Urban Area: Hong Kong continues to be the densest major urban area in the high-income world. The present density is estimated at 67,000 per square mile (26,000 per square kilometer). At least one small area of Hong Kong has a population density exceeding 1 million per square mile (400,000 per square kilometer), though the much more dense Kowloon Walled City (estimated at up to 5,000,000 per square mile or 2,000,000 per square kilometer) was demolished in the 1990s. Even so, there are now detached housing developments, as Hong Kongers who can afford it choose these much more expensive accommodations, as Witold Rybczynski relates in a recent commentary (detached housing photo).

    Detached Housing

    Subdivisions of Hong Kong: The Hong Kong Special Administrative Region (HKSAR) is a unified government, with no local jurisdictions (such as cities or towns).  However, there are four broad regions and within each there are districts, are designated for statistical purposes.

    Hong Kong’s growth — like that of most major metropolitan areas — has been shifting to the periphery for decades (Table 1). Between 1981 and 2011, all of the population growth was in the New Territories, the new (greenfield and high density) suburban areas beyond the Hong Kong Island-Kowloon core. While all of Hong Kong was adding 2.1 million residents in total between 1981 and 2011, the New Territories added 2.4 million (Table 2). This suburban dominance continued in the last census period, with 96 percent of growth in the New Territories. Before that, the bulk of the growth was in the outer areas of Kowloon, which were then the suburbs (Figure 2).

    Table 1
    Hong Kong Population by District: 1911-2011
    Year Total Hong Kong Kowloon New Territories Marine
    1911 456,700 244,300 69,400 81,200 61,800
    1921 625,200 347,400 123,400 83,200 71,200
    1931 840,500 409,200 263,000 98,200 70,100
    1941 1,600,000 Estimate: No complete census
    1951 2,013,000 Estimate: Census cancelled
    1961 3,129,600 1,004,900 1,578,000 409,900 136,800
    1971 3,936,600 996,200 2,194,800 665,700 79,900
    1981 4,986,600 1,183,600 2,449,100 1,304,100 49,700
    1991 5,674,100 1,251,000 2,030,700 2,374,800 17,600
    2001 6,708,400 1,335,500 2,024,000 3,343,000 5,900
    2011 7,071,600 1,270,900 2,108,400 3,691,100 1,200
    Sources:
    Government of Hong Kong
    www.cicred.org/Eng/Publications/pdf/c-c21.pdf
    Table 2
    Hong Kong Population by District: 1991-2011
    Region & District Population: 1991 Population: 2001 Population: 2011 % 2001-2011 Land Area KM2 Land Area MI2 Density KM2 Density MI2
    HONG KONG 5,674,114 6,708,389 7,071,576 5.4% 1,098 424 6,440 16,680
    HONG KONG ISLAND 1,250,993 1,335,469 1,270,876 -4.8% 80 31 15,827 40,991
      Central and Western 253,383 261,884 251,519 -4.0% 13 5 20,089 52,031
      Wan Chai 180,309 167,146 152,608 -8.7% 10 4 15,230 39,447
      Eastern 560,200 616,199 588,094 -4.6% 19 7 31,265 80,976
      Southern 257,101 290,240 278,655 -4.0% 39 15 7,154 18,529
    KOWLOON 2,030,683 2,023,979 2,108,419 4.2% 47 18 45,138 116,909
      Yau Tsim Mong 282,060 282,020 307,878 9.2% 7 3 44,946 116,409
      Sham Shui Po 380,615 353,550 380,855 7.7% 9 4 40,175 104,052
      Kowloon City 402,934 381,352 377,351 -1.0% 10 4 37,849 98,028
      Wong Tai Sin 386,572 444,630 420,183 -5.5% 9 4 44,891 116,268
      Kwun Tong 578,502 562,427 622,152 10.6% 11 4 56,303 145,826
    NEW TERRITORIES 2,374,818 3,343,046 3,691,093 10.4% 971 375 3,801 9,845
      Kwai Tsing 440,807 477,092 511,167 7.1% 22 8 23,427 60,675
      Tsuen Wan 271,576 275,527 304,637 10.6% 61 23 5,019 12,999
      Tuen Mun 380,683 488,831 487,546 -0.3% 84 33 5,773 14,953
      Yuen Long 229,724 449,070 578,529 28.8% 138 53 4,179 10,824
      North 165,666 298,657 304,134 1.8% 137 53 2,215 5,737
      Tai Po 202,117 310,879 296,853 -4.5% 147 57 2,014 5,215
      Sha Tin 506,368 628,634 630,273 0.3% 69 27 9,074 23,501
      Sai Kung 130,418 327,689 436,627 33.2% 136 53 3,201 8,291
      Islands 47,459 86,667 141,327 63.1% 175 68 807 2,091
    MARINE 17,620 5,895 1,188 -79.8% 0 0 0 0
    Data from Government of Hong Kong Special Administrative Region


    The Core: Hong Kong Island: Hong Kong Island, home to one of the world’s most dense central business districts (Central, Western and Wan Chai districts) lost 4.8 percent of its population. All five of the districts on Hong Kong Island lost population, with Wan Chi (of "The World of Suzy Wong" movie fame) suffering the greatest loss, at 8.7 percent).

    The Core: Kowloon: Across Hong Kong harbor (see Star Ferry photograph, top), Kowloon, also a part of the core, gained 4.2 percent, adding nearly 75,000 residents (photo). Even so, Kowloon’s population remains more than 10 percent below its 1981 population. Three of Kowloon’s  five districts gained population, including Yau Sim Mong and Sham Shui Po, which along with the north shore districts of Hong Kong Island are the most intensely developed in the HKSAR.

    Suburban: The New Territories: The New Territories added 10.4 percent to their population (348,000), with seven of the nine districts gaining. The largest gain (63 percent) was in the Islands district, which includes Hong Kong International Airport. Sia Kung, also grew strongly, at 33 percent (see photo). Sia Kung, like nearly built-out Sha-Tin, is conveniently located just over a narrow mountain range from Kowloon and contains considerable amounts of greenfield land for development.

    Kowloon

    Sia Kung

    Yuen Long, home of the new Shenzhen Bridge had the third highest growth rate, at 29 percent. The Islands, Sia Kung and Yuen Long all have all experienced much improved access from extensions to the Mass Transit Railway (MTR) and the former Kowloon-Canton Railway (KCR), which have now merged into the MTR.

    Transportation in Hong Kong: Hong Kong is the most transit dependent major metropolitan area in the high-income world. Mass transit carries 72 percent of motorized trips. Even with the high residential and employment density, the average work trip is approximately five miles each way. Moreover, despite having one of the most effective mass transit systems in the world and extraordinarily high densities, the average one-way work trip travel time is 46 minutes, 18 minutes longer than Los Angeles or Houston. With the highest transit market share in the world and an automobile market share only 1/70th that of Houston, Hong Kong’s density still  produces among the highest levels of traffic congestion in the world — 1.5 times the traffic density of Los Angeles and three times that of Houston (photo).

    Hong Kong Traffic Congestion

    Economic Growth: Hong Kong has experienced strong economic growth for  the last three decades. In 1981, Hong Kong’s gross domestic product (GDP) per capita was one-third below that of the United Kingdom, its then colonial master. Even by this time, Chinese leader Deng Xiao Ping had been so impressed by Hong Kong’s market based economic advance, that he had designated adjacent Shenzhen as a special economic zone. That area has since grown from a fishing village to a population exceeding 10 million, according to the 2010 census. In the intervening years, the Pearl River Delta has emerged as the most populous extent of urbanization in the world, stretching from Hong Kong, through Shenzhen, Dongguan, Guangzhou, Jiangmen, Zhongshan and Zhuhai to Macao. However, because of border controls and the low level of commuting, these remain separate metropolitan areas and  urban areas.

    Hong Kong’s economic growth continued strongly in the middle 1990s, when its GDP per capita exceeded that of the United Kingdom. Hong Kong fell behind in the late 1990s Asian economic crisis, but soon recovered. By 2010, Hong Kong’s GDP per capita had risen to 27 percent above that of the United Kingdom.

    Hong Kong’s economic performance relative to the United States may be even more impressive. In 1980, Hong Kong’s GDP per capital trailed that of the United States by 45 percent. As of 2010, Hong Kong trailed the US by only three percent and according to International Monetary Fund data should pass the United States early in the present decade. Between 2000 and 2010, Hong Kong’s per capita GDP (PPP-2010$) rose more than one-third — only South Korea and Singapore did better among high-income areas, according to International Monetary Fund data. China’s percentage growth rate was  nearly five times Hong Kong’s but in actual dollars Hong Kong’s GDP per capita rose at triple China’s rate. However, should China’s economy slow down, as some analysts suggest, it could be difficult for Hong Kong to sustain this strong growth rate (Figure 3).

    The People’s Republic of China has maintained Hong Kong’s free market economic system, helping assure strong growth. It seems unlikely that either Deng Xiao Ping or Margaret Thatcher imagined that such economic progress would be made when they signed the historic agreement to restore Hong Kong to China in 1984. Nor is it likely they imagined China’s meteoric rise.

    Unique Hong Kong: Hong Kong is the living model of compact development and transit dependence toward which urban planning wisdom strives. However, Hong Kong itself is the outlier of outliers. Hong Kong’s population density — double that of any other high-income world urban area of similar size or larger — would never have approached this level if it had not been separated from China itself by colonization and then the historical complexities of the post-World War II period. Even in its prosperity, the growing urban areas of mainland China are being built at densities averaging no more than one-quarter that of Hong Kong. Hong Kong may be more an accident of history than an exemplar.

    Wendell Cox is a Visiting Professor, Conservatoire National des Arts et Metiers, Paris and the author of “War on the Dream: How Anti-Sprawl Policy Threatens the Quality of Life

    —-

    Photo: Star Ferry, operating between Hong Kong Island (Central) and Kowloon (Yau Tsim Mong). All photos by author.

    Hong Kong district map by Wikipedia user Moddlyg.

  • Housing Affordability: St. Louis’ Competitive Advantage

    Things are looking better in St. Louis. For decades, St. Louis has been one of the slowest-growing metropolitan areas of the United States. Its historical core city has lost more than 60 percent of its population since 1950, a greater loss than any other major core municipality in the modern era.  Nonetheless, the metropolitan area, including the city, added nearly 50 percent to its population from 1950. The fate of St. Louis has been similar to that of Rust Belt metropolitan areas in the Midwest and East, as the nation has moved steadily West and South since World War II (Note).

    Expensive Housing and Driving People Away: During the past decade, high house prices have driven residents away from areas with better amenities, especially California’s coastal metropolitan areas and metropolitan New York. Between 2000 and 2009, Los Angeles exported 1.4 million domestic migrants, the San Francisco Bay Area 600,000 (San Francisco and San Jose) and San Diego 125,000. New York lost nearly 2,000,000. St. Louis did much better, losing less than 45,000 domestic migrants. On a per capita basis, St. Louis also performed better, losing 1.6 domestic residents per capita to migration, compared to 4.5 in San Diego, 10 in the San Francisco Bay Area and 11 in New York.   This may not sound like an accomplishment, but the St. Louis area has probably not outperformed California in terms of migration since it entered the Union in 1850.

    The big change between the 2000s and previous decades lies in housing price. It is in this period that America became effectively two nations in housing affordability. The major metropolitan areas that experienced that largest housing bubble lost 3.2 million domestic migrants, while those with lesser or no bubble gained 1.5 million. Demonstrating the preference of people for more dispersed surroundings, even more (1.7 million) moved to smaller metropolitan areas. Housing affordability has emerged as a principal competitive factor among metropolitan areas.

    Superior Housing Affordability: This is where St. Louis excels. As of the third quarter of 2011, the median house price was 2.6 times the median household income in St. Louis, according to the 8th Annual Demographia International Housing Affordability Survey, which covered seven nations (the United States, United Kingdom, Canada, Australia, Ireland, New Zealand and Hong Kong, in China). Dividing the median house price by the median household income gives St. Louis an affordability rating (Median Multiple) of 2.6. By comparison the Median Multiple was 4.2 in Portland (60 percent more expensive ), 4.5 in Seattle (75 percent more),  6.1 in San Diego (135 percent more) and 6.9 in San Jose (175 percent more. While other metropolitan areas were reeling from house price increases that still have not returned to normal, St. Louis (and other metropolitan areas, like Dallas-Fort Worth, Houston and Indianapolis) have continued to experience affordable and far more steady house prices (Figure 1).

    Lowest Cost of Living: Affordable house prices are associated with a lower cost of living. St. Louis does very well here. According to the latest data from the US Bureau of Economic Analysis regional price parity program, the cost of living in St. Louis is the lowest among major metropolitan areas (those with more than 1,000,000 population). In St. Louis, the cost of living is:

    • 29 percent less than in New York.
    • 31 percent less than in San Jose.
    • 23 percent less than in San Diego.
    • 19 percent less than in Seattle.
    • 12 percent less than in Portland.

    Things Could Get Better for St. Louis: Moreover, the gap could become larger, especially as governments in California try to outlaw new detached housing, under Senate Bill 375. None of this is good for young households or less affluent households who will have to leave to find housing that meets their desires. Many will need to leave to fulfill their dreams.

    Inevitably, the higher housing costs associated with these policies (called by various names, such as "livability," "smart growth" and "growth management") fall hardest on lower income households (often minorities), who have less to spend, are forced to move away or cannot afford to move in. The consequences were articulated by California’s Hispanic oriented Tomas Rivera Policy Institute (Figure 2):

    While there is little agreement on the magnitude of the effect of growth controls on home prices, an increase is always the result.

    The Secret: Just what did the St. Louis leadership do to improve its competitiveness so much? Nothing. They just stayed out of the way. Unlike their counterparts where house prices exploded, St. Louis officials did not prohibit people from living where they wanted on the urban fringe and they did not force new houses to be built on postage stamp lots. Nor did they adopt land use regulations that drive up the price of land (Figure 3) and, in consequence housing), just as an OPEC embargo would raise the price of gasoline. When the easy money came and lenders were begging households with insufficient resources to take mortgages, the planning embargoes drove up house prices and invited undue participation by speculators who know the difference between a competitive and a rigged market.

    There are positive signs as a result of this affordability advantage. St. Louis has been attracting more young residents. Recent data indicates that St. Louis ranked 15th in high tech job growth out of the 51 metropolitan areas with more than 1,000,000 over the past decade. It would be expected that St. Louis would trail fast growing Seattle, Raleigh and Charlotte and perennial tax consumer Washington. However, St. Louis can be placed better than perennial leaders San Jose, Boston, Portland, Austin and New York. Budding local efforts are aimed at encouraging entrepreneurship, even as California and New York search for new ways to say "no."

    Succeeding by Being St. Louis: The improving prospects of St. Louis are not the result of a taxpayer financed marketing campaign or a payoff from the usual "let’s copy Portland" strategies (or even Cleveland, as one analyst put it a couple of decades ago). St. Louis cannot compete with the weather in the Bay Area, does not have San Diego’s beaches, the mountains near Denver nor the natural beauty surrounding Seattle. But it does have an affordable life style.

    St. Louis can succeed only by being St. Louis. It is a metropolitan area with a great past, and many fine civic institutions, including great parks, sports teams and a world class orchestra. This long laggard Midwestern metropolitan area may face its best competitive prospects since Chicago passed it in population in 1870. Local and state leaders need to stay away from the policies that would dilute St. Louis’ principal competitive advantage, a low cost of living, due to a housing market left to operate without destructive distortion.

    Wendell Cox is a Visiting Professor, Conservatoire National des Arts et Metiers, Paris and the author of “War on the Dream: How Anti-Sprawl Policy Threatens the Quality of Life

    —-

    Photo: Cathedral Basilica of St. Louis (by author)

    Note: This is adapted from a policy study by the author for the Show Me Institute: Housing Affordability The St. Louis Competitive Advantage

  • China’s Expanding Motorways

    In some ways, it has been an "annus horribilis" for transport in China (Note). There was the tragic high-speed rail accident in Wenzhou (Zhejiang), the fastest trains were slowed, construction was slowed or, in some cases stopped, and a top railway official was removed for misappropriation of at least a billion Yuan (more than $150 million).

    However, China’s freeway (motorway) system has achieved a milestone even Deng Xiaoping might have dreamed. In 2011, The Beijing Review reports that China’s intercity freeway system became the longest in the world, longer that of the United States, which had been the undisputed leader for at least 50 years.

    China added 11,000 kilometers (7,000 miles) of freeway (grade separated and dual carriage expressway) to its national interstate expressway system (National Trunk Highway System) in 2011. With a length of 85,000 kilometers (53,000 miles), China’s intercity freeway system exceeds that of the US interstate highway system by 10,000 kilometers (6,000 miles). At the end of 2008, the US interstate highway system was 75,000 miles long.

    China has built 83,000 kilometers (52,000 miles) of interstate freeway in just 11 years. Much of the US interstate construction was completed over a period of 25 years, from 1956 to the early 1980s.

    It is unclear whether the total length of freeways in China is greater than that in the United States. In China, many urban freeways are not included in the National Trunk Highway System. There are also non-interstate freeways in the United States.  Complete data on these roadways is not available.

    —–

    Note: This characterization of a "horrible year" was made famous by Queen Elizabeth II in a major speech in 1992.

    See also: China Expressway System to Exceed US Interstates, January 21, 2011.

  • The Evolving Urban Form: Moscow’s Auto-Oriented Expansion

    Moscow is bursting at the seams. The core city covers more than 420 square miles (1,090 kilometers), and has a population of approximately 11.5 million people. With 27,300 residents per square mile (10,500 per square kilometer), Moscow is one percent more dense than the city of New York, though Moscow covers 30 percent more land. The 23 ward area of Tokyo (see Note) is at least a third more dense, though Moscow’s land area is at least half again as large as Tokyo.

    All three core areas rely significantly on transit. Muscovites use the Metro at about the same rate as New Yorkers use the subway, taking about 200 trips each year. Tokyo citizens use their two Metro systems at nearly 1.5 times the rate used in Moscow.

    But there are important differences. Moscow officials indicate that approximately two-thirds of Moscow’s employment is in the central area. This is a much higher figure than in the world’s two largest central business districts — Tokyo’s Yamanote Loop and Manhattan — each with quarter or less of their metropolitan employment. Both New York City and Tokyo’s 23 wards have extensive freeway lengths in their cores, which help to make their traffic congestion more tolerable.

    Moscow’s arterial street pattern was clearly designed with the assumption that the dominant travel pattern would be into the core. Major streets either radiate from the core, or form circles or partial circles at varying distances from it. In New York City and Tokyo’s  23 wards there are radial arterials, but,the major streets generally form a grid, which is more conducive to the cross-town traffic and the more random trip patterns that have emerged in the automobile age.

    Moscow has become much, more reliant on cars,  following the examples of metropolitan areas across Europe. The old outer circular road, which encloses nearly all of the central municipality, was long ago upgraded to the MKAD, a 10 lane freeway as long as Washington’s I-495 Capital Beltway (65 miles or 110 kilometers). The MKAD has become a primary commercial corridor, with large shopping centers and three nearby IKEAs.

    It is not surprising, therefore, that traffic congestion and air pollution became serious problems in Moscow. The road system that had been adequate when only the rich had cars was no longer sufficient. The "cookie-cutter" apartment blocks, which had served Iron Curtain poverty, had become obsolete. The continued densification of an already very dense core city led to an inevitable intensification of intensification of traffic congestion and air pollution.

    Transit-oriented Moscow was not working, nor could "walkability" make much difference. In such a large urban area, it is inevitable that average travel distances, especially to work, will be long. Geographically large employment markets are the very foundation of major metropolitan areas. If too many jobs are concentrated in one area, then the traffic becomes unbearable, as many become able to afford cars and use them. Traffic congestion was poised to make Moscow dysfunctional.

    Expanding Moscow

    The leadership of both the Russian Federation and the city of Moscow chose an unusual path, in light of currently fashionable urban planning dogma. Rather than making promises they could not keep about how higher densities or more transit could make the unworkable city more livable, they chose the practical, though in urban planning circles, the "politically incorrect" solution:  deconcentrating the city and its traffic.

    Last year, Russian President Dmitry Medvedev proposed that Moscow be expanded to a land area 2.3 times as large. Local officials and parliament were quickly brought on board. The expanded land area is nearly double that of New York’s suburban Nassau County, and is largely rural (Note 2). Virtually all of the expansion will be south of the MKAD.

    The plan is to create a much larger, automobile-oriented municipality, with large portions of the Russian government to be moved to the expanded area. Employment will be decentralized, given the hardening of the transport arterials that makes the monocentric employment pattern unsustainable. Early plans call for commercial construction more than four times that of Chicago’s loop.

    At the same time, the leadership does not intend to abandon the older, transit-oriented part of the municipality. Mayor Sergei Sobyanin has voiced plans to convert central area government buildings into residences and hotels, adding that there will be the opportunity to build underground parking facilities as refurbishments proceed. Moscow appears to be preparing to offer its citizens both an automobile-oriented lifestyle and a transit-oriented one. The reduced commercial traffic should also make central Moscow a more attractive environment for tourists, who spend too much time traveling between their hotels and historic sites, such as the Kremlin and St. Basil’s.

    Expanding the Family?

    As Moscow expands, the national leadership also wants the Russian family to expand. Russia has been losing population for more than 20 years. Since 1989, the population of the Russian Federation has dropped by 4.5 million residents. When the increase of 3.0 million in the Moscow area is considered, the rest of the nation has lost approximately 7.5 million since 1989. Between the 2002 and the 2010 censuses, Russia lost 2.2 million people and dropped into a population of 142.9 million. Russia’s population losses are pervasive. Out of the 83 federal regions, 66 lost population during the last census.

    Continued population losses could significantly impair national economic growth. The projected smaller number of working age residents will produce less income, while a growing elderly population will need more financial support. This is not just a Russian problem, but Russia is the first of the world’s largest nations to face the issue while undergoing a significant population loss.

    The government is planning strong measures to counter the demographic decline, increase the birth rate, and create a home ownership-based "Russian Dream". Families having three or more children will be granted land for building single-family houses across the nation., including plots of up to nearly one-third of an acre (1,500 square meters).  Many of these houses could be built in Moscow’s new automobile- oriented two-thirds, as well as in the extensive suburbs on the other three sides of the core municipality.

    Expanding Outside the Core

    While population decline is the rule across the Russian Federation, the Moscow urban area has experienced strong growth. Between 2002 and 2010, the Moscow urban area grew from 14.6 million to 16.1 million residents (Note 3). This 1.3 percent annual rate of increase  exceeds the recently the recently announced growth in Canada (1.2 percent). This rate of increase exceeds that of all but 8 of the 51 major metropolitan areas (Note 4) in the United States between 2000 and 2010.

    While the core district grew 6 percent  and added 41,000 residents, growth was strongest outside the core, which accommodated 97 percent of the new residents (See Table). Moscow’s outer districts grew by nearly 1.1 million residents, an 11 percent increase, and its suburbs continued to expand, adding 400,000 residents, an increase of 10  percent. These areas have much lower densities than the city, with many single-family houses.

    Table
    Moscow Urban Area Population
    2002 2010 Change % Change Share of Growth
    Inner Moscow 701,000 743,000 41,000 5.9% 2.7%
    Outer Moscow 9,681,000 10,772,000 1,090,000 11.3% 70.3%
    Suburban 4,198,000 4,617,000 420,000 10.0% 27.0%
    Total 14,581,000 16,132,000 1,551,000 10.6% 100.0%
    Note: Suburban population includes the total population of each district and city that is at least partially in the urban area.


    Moscow, like other international urban areas, is decentralizing, despite considerable barriers. The expansion will lead to even more decentralization, which is likely to lead to less time "stuck in traffic" and more comfortable lifestyles. Let’s hope that Russia’s urban development policies, along with its plans to restore population growth, will lead to higher household incomes and much improved economic performance.

    Wendell Cox is a Visiting Professor, Conservatoire National des Arts et Metiers, Paris and the author of “War on the Dream: How Anti-Sprawl Policy Threatens the Quality of Life

    —–

    Note 1: The 23 ward (ku) area of Tokyo is the geography of the former city of Tokyo, which was abolished in the 1940s. There is considerable confusion about the geography of Tokyo. For example, the 23 ward area is a part of the prefecture of Tokyo, which is also called the Tokyo Metropolis, which has led some analysts to think of it as the Tokyo metropolitan area (labor market area). In fact, the Tokyo metropolitan area, variously defined, includes, at a minimum the prefectures of Tokyo, Kanagawa, Chiba and Saitama with some municipalities in Gunma, Ibaraki and Tochigi. The metropolitan area contains nearly three times the population of the "Tokyo Metropolis."

    Note 2: The expansion area (556 square miles or 1,440 square kilometers) has a current population of 250,000.

    Note 3: Includes all residents in suburban districts with at least part of their population in the urban area.

    Note 4: Urban area data not yet available.

    Photo: St. Basil’s Cathedral (all photos by author)