Author: Wendell Cox

  • Bay Area Residents (Rightly) Expect Traffic to Get Worse

    In a just released poll by the Bay Area Council a majority of respondents indicated an expectation that traffic congestion in the Bay Area (the San Jose-San Francisco combined statistical area) is likely to get worse.

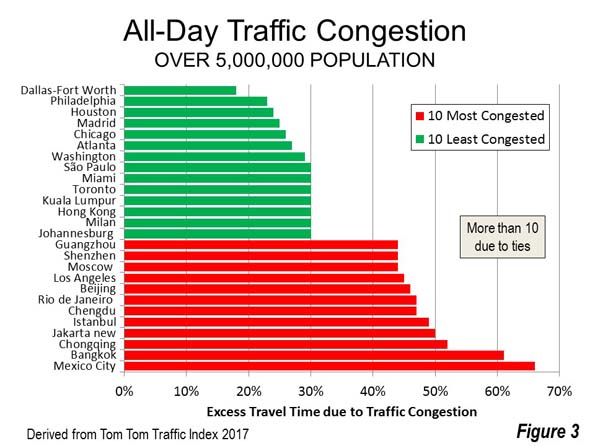
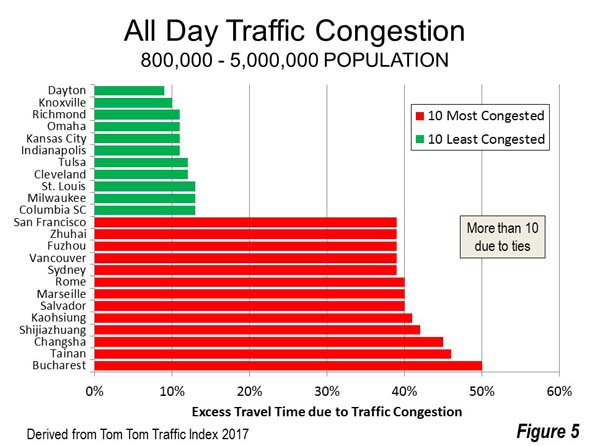
    It is already bad enough. The Bay Area includes two major urban areas (over 1,000,000 population), with San Francisco ranked second worst in traffic congestion in the United States, closely following Los Angeles. In San Francisco, the average travel time during peak travel hours was reported to be 41 percent worse due to traffic congestion, according to the 2015 Annual Mobility Report from the Texas A&M Transportation Institute. That means a trip that would normally take 30 minutes without congestion stretches to 42 minutes. Los Angeles is only slightly worse, where the travel time congestion penalty is 43 percent. In the adjacent and smaller San Jose urban area, congestion adds 38 percent to travel times, tying with Seattle as third worst in the nation.

    According to a Mercury News article by George Avalos, “The Bay Area’s traffic woes are so severe that more than two-thirds of the region’s residents surveyed in a new poll are demanding a major investment to fix the mess — even if that means stomaching higher taxes.” Residents perceive the problem as an “emergency that requires drastic solutions,” and 70 percent of those asked support a “major regional investment” to improve traffic.

    Those who expect traffic congestion to get worse are probably right. Public policies in California and the Bay Area virtually require it. For example, the state has proposed a “road diet” program that would place significant barriers in the way of highway capacity expansion. Without capacity expansion, traffic is likely to only get worse.

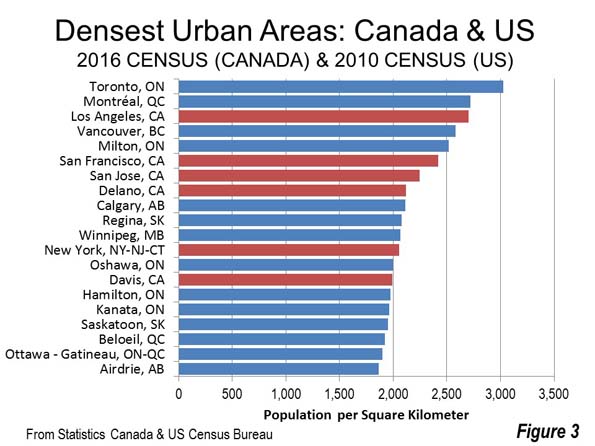
    The regional transportation plan (Plan Bay Area), adopted by the Association of Bay Area Governments and the Metropolitan Transportation Commission, seeks significant densification (called “pack and stack” by critics). Should the plan succeed, you can bank on traffic congestion getting even worse. It is no coincidence that Los Angeles, San Francisco and San Jose have the worst traffic congestion in the nation. They are also the nation’s three densest urban areas. Indeed, higher densities are associated with greater traffic congestion.

    There are, of course, things that can be done. But no one in the Bay Area should suspect that California, with its present policies, is up to the job.

    Take, for example, the newly announced plan by Governor Brown and legislative leaders to spend $52 billion over the next 10 years on transportation, much of it on roads. The program would require the largest increase in the state’s gasoline tax and vehicle fees in history. It will all go to repairs and maintenance, which are necessary, and to transit, walking and bike infrastructure. Yet, according to press reports, it contains nothing for the highway capacity expansions required for serious congestion relief.

    It is a sad commentary that the state has been deferring maintenance on the roads that carry more than 98 percent of the state’s surface (non-airline) travel, while continuing to pursue a mixed conventional-high- speed rail proposal that, at the moment, is set to cost $64 billion. If ever finished, it will probably cost much more and will be lucky to carry even one percent of California travel (See note).

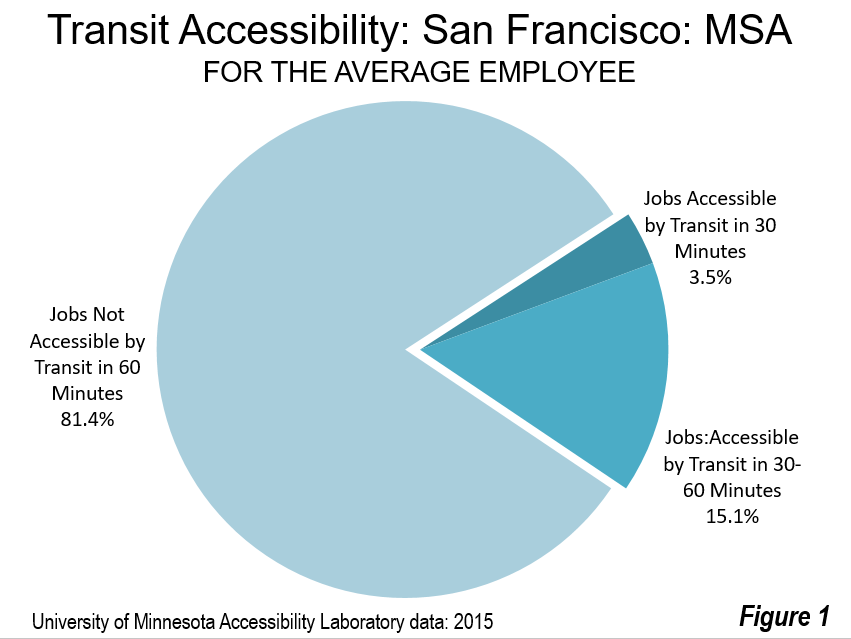
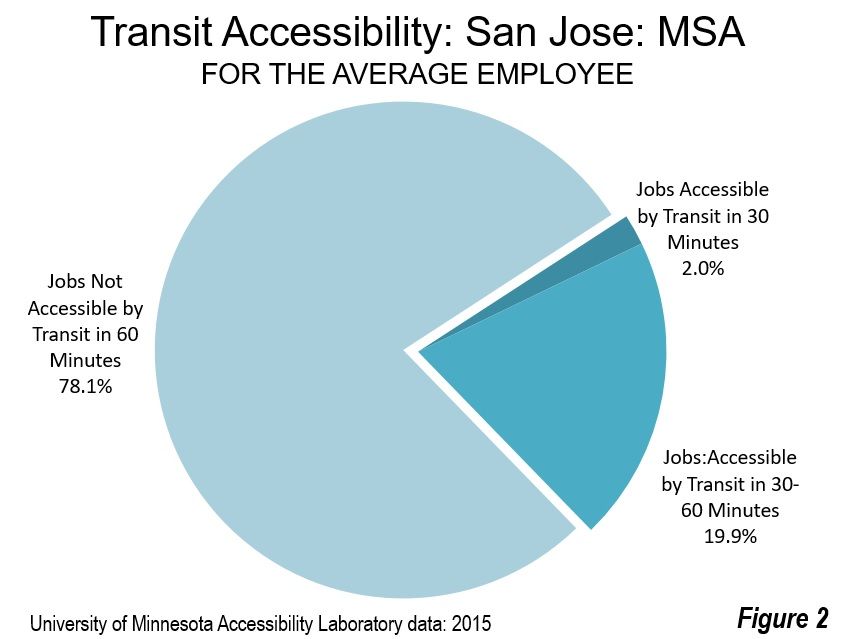
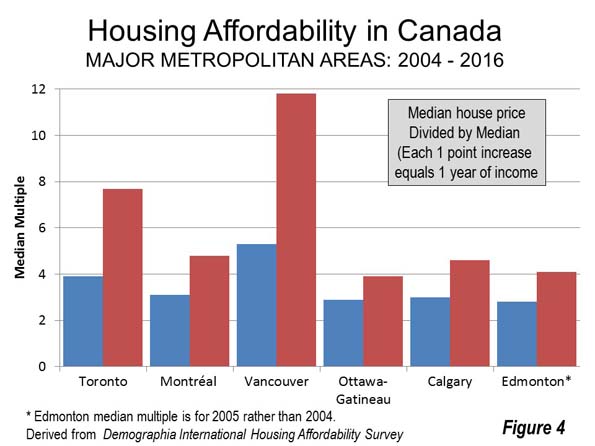
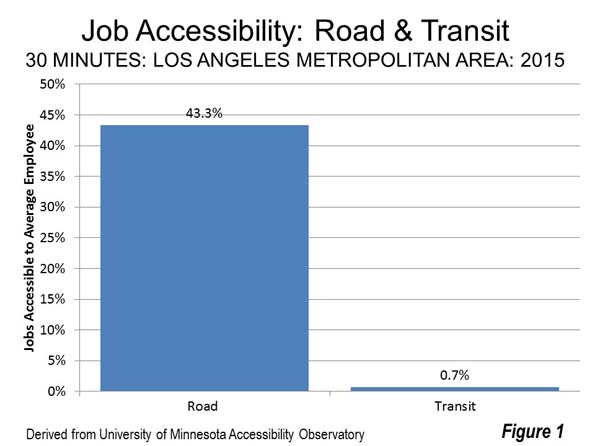
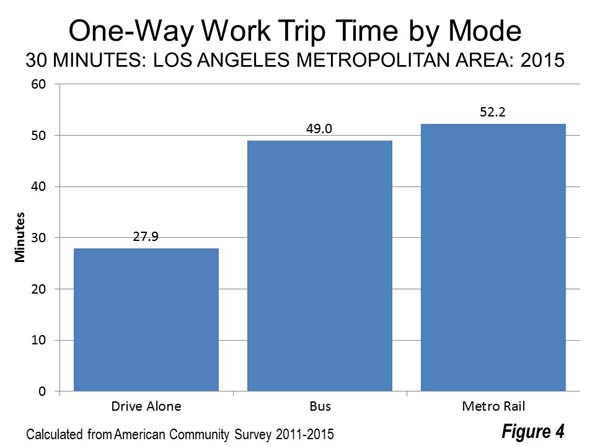
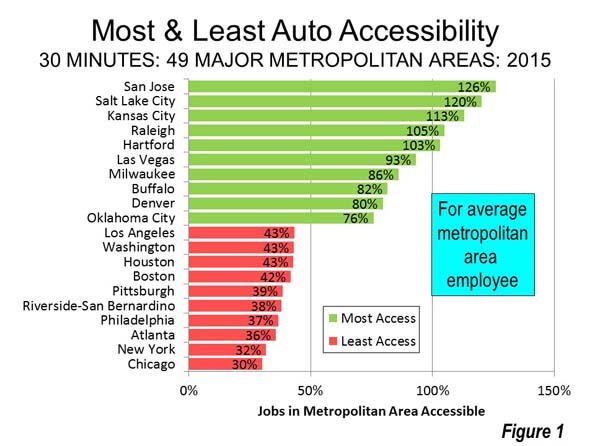
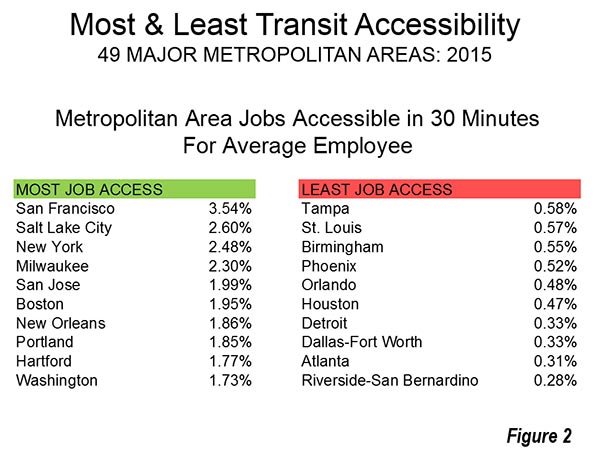
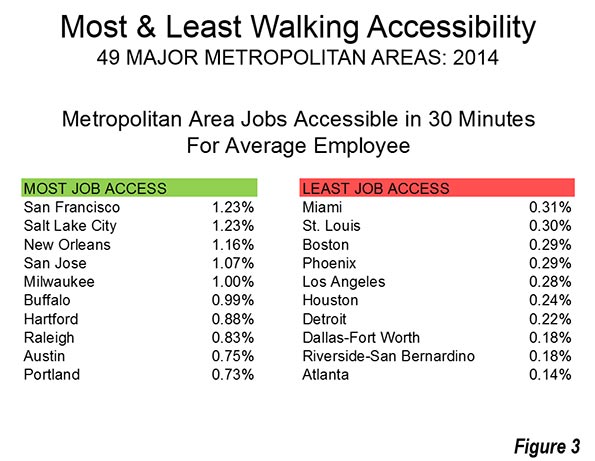
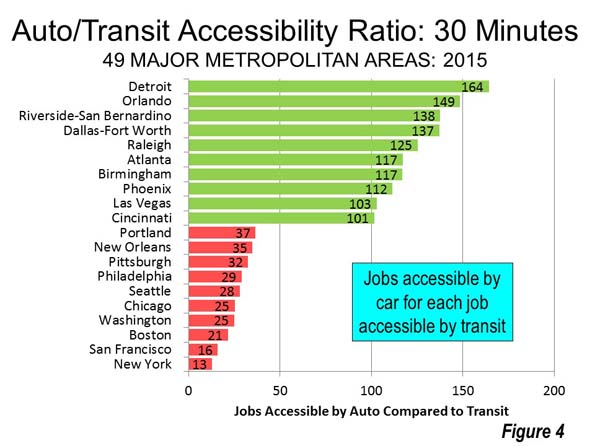
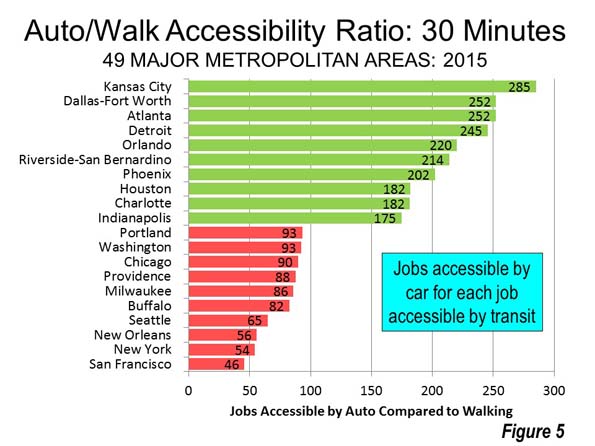
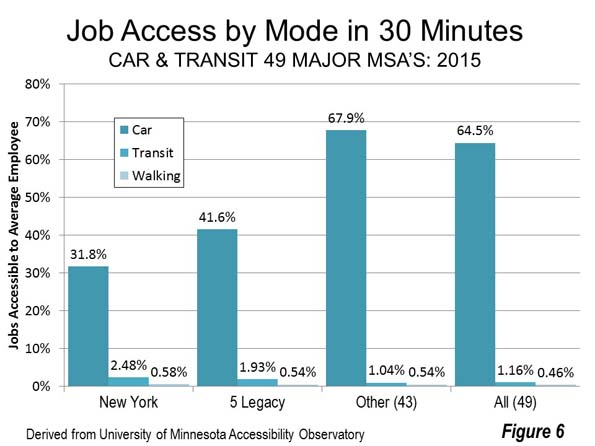
    Some may romantically anticipate that transit can substitute for the automobile and reduce traffic congestion. This is fantasy, as the US experience with urban rail proves. For the most part, transit cannot get you from here to there in the modern metropolitan area. In the Bay Area, the average commuter using transit can reach only 3.5 percent of the jobs in 30 minutes in the San Francisco metropolitan area and 2.0 percent of the jobs in the San Jose metropolitan area (according to the University of Minnesota Accessibility Laboratory). Even with a 60-minute commute, the share of jobs accessible in both areas is only about 20 percent. Even where transit is most intense in the San Francisco Bay Area, the average commuter can reach 16 times as many jobs in 30 minutes and eight times as many in 60 minutes (Figures 1 and 2). That is not to minimize the value of transit, which carries 50 percent of commuters to the nation’s six largest downtown areas (New York, Chicago, Philadelphia, San Francisco, Boston and Washington). But in each of these metropolitan areas the overwhelming percentage of jobs are outside downtowns, where the overwhelming share of commuting is by car.

    The hope of some planners that traffic will get so bad people will switch to transit requires service that takes people where they want to go. They must still be wondering why people persist in driving their cars that take them where they need to go instead of switching to transit that takes them where planners would like them to go. Of course, the reality is that transit provides little mobility beyond the urban core and cannot be made to do so at any reasonable cost.

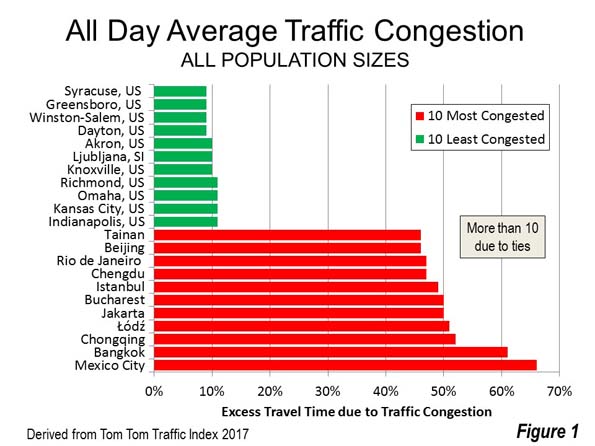
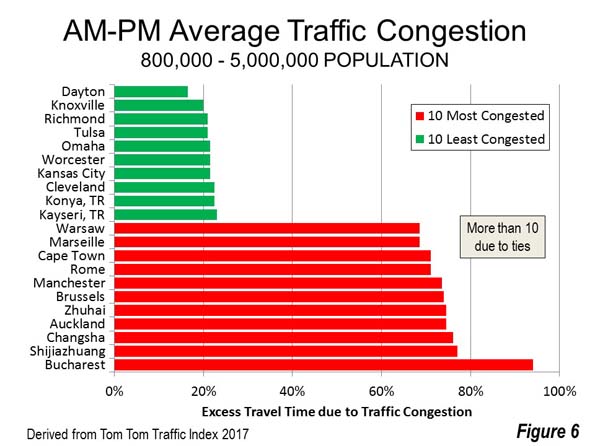
    The bottom line is that traffic congestion can get considerably worse. In Bangkok and Mexico City, traffic congestion is at least 70 percent worse than in the Bay Area, according to the Tom Tom Traffic Index. This is despite much lower automobile ownership rates.

    The survey indicated another alternative for those who really cannot stand the Bay Area’s unbearable and worsening traffic congestion. Move. The Bay Area Council found that 40 percent of respondents and 46 percent of Millennials are considering moving from the area in the next few years.

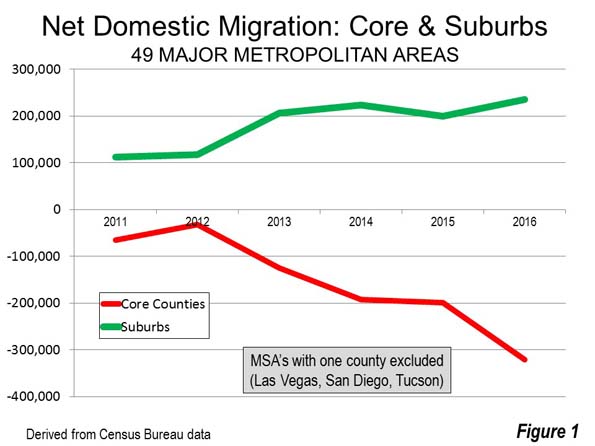
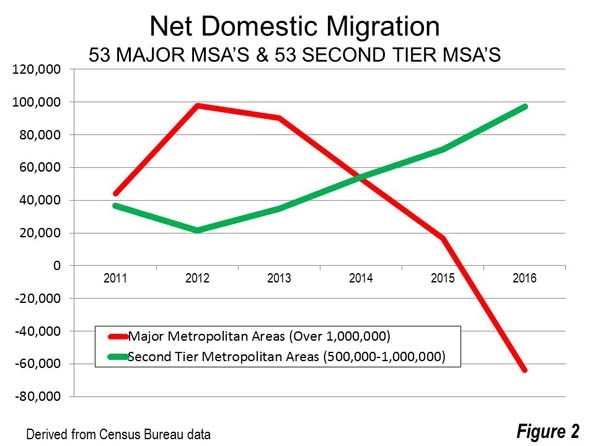
    Indeed, that is beginning to happen. After a five-year respite in the Bay Area’s substantial net domestic out-migration, 26,000 more people left than arrived in 2016. The big loser was Santa Clara County (a net loss of 21,000), while San Francisco County (city) lost 7,000. Between 2000 and 2009, the Bay Area had lost more than 500,000 net domestic migrants.

    For the millions who will remain in the Bay Area, however, moving is not a solution. Of course, a dawn of reason could occur among the leadership of California and the Bay Area, in which ideologically preferred solutions are replaced by practical strategies that work. Things will probably have to get much worse for the public to demand that.

    Note: See my co-authored reports with Joseph Vranich, The California High Speed Rail Proposal: A Due Diligence Report (2008), and California High Speed Rail: An Updated Due Diligence Report (2012).

    Wendell Cox is principal of Demographia, an international public policy and demographics firm. He is a Senior Fellow of the Center for Opportunity Urbanism (US), Senior Fellow for Housing Affordability and Municipal Policy for the Frontier Centre for Public Policy (Canada), and a member of the Board of Advisors of the Center for Demographics and Policy at Chapman University (California). He is co-author of the “Demographia International Housing Affordability Survey” and author of “Demographia World Urban Areas” and “War on the Dream: How Anti-Sprawl Policy Threatens the Quality of Life.” He was appointed to three terms on the Los Angeles County Transportation Commission, where he served with the leading city and county leadership as the only non-elected member. He served as a visiting professor at the Conservatoire National des Arts et Metiers, a national university in Paris.

    Photo: City of San Francisco (by author)

  • A Victory for Localism in Australia: Court Blocks Forced Amalgamation

    In a rare victory for grassroots activists, The New South Wales Supreme Court has blocked the forced local government amalgamation of northern suburban councils Ku-ring-gai and the Shire of Hornsby in Greater Sydney. The Ku-ring-gai Council had challenged the parliamentary order and lost at a lower court level , but as The Daily Telegraph put it “Ku-ring-gai Council has won its appeal against a forced merger with Hornsby Council this morning in a judgment that was highly critical of the State Government delegate and its process.” The Council was also awarded costs.

    This forced amalgamation is just one of a number of mergers ordered by the ruling Liberal-National Coalition government of Premier Gladys Berejiklian. This and other such orders have been challenged in court and, according to the Daily Telegraph: “The Berejiklian government’s remaining council merger plans have been thrown into upheaval after the NSW Supreme Court ruled the process used ahead of a proposed merger between Ku-ring-gai and Hornsby Councils did not accord with procedural fairness.”

    Statutory Duty, Disclosure, Public Participation and Procedural Fairness

    In particular, the court indicated concern about a failure of statutory duty, lack of public disclosure and insufficient opportunity for public participation.

    At issue was the recommendation of Delegate Garry West that the forced merger proceed (Delegate West was appointed by the government to make a finding on the government’s forced merger proposal). The Ku-rung-gai Council argued that Delegate West had relied on a merger analysis report by KPMG, a report that the government would not release in public.

    Writing in the opinion, Judge J. A. Basten said: “The Council was right to assert that the delegate could not properly carry out his function of examination without having access to that material…" and found that “that the financial advantages identified by KPMG for the government were a critical element in favour of the merger, but this analysis was not provided to the delegate or public.” Judge Basten concluded that Mr. West had "constructively failed" in his statutory duty of examining the government’s merger proposal, according to the Sydney Morning Herald.

    In addition, Judge Basten pointed out that "Release of the material was also necessary for public participation in the public inquiry to be meaningful." According to the opinion: “The appellant was denied procedural fairness as the delegate chose to rely on the KPMG analysis, rather than conducting his own assessment of the merger, when the appellant was not in possession of the document in which the analysis was contained.”

    No Amalgamation Based on a Secret Report

    Government News reported Greens Local Government spokesman David Shoebridge as saying “Today the Court of Appeal has said the obvious, that it is blatantly unfair to forcibly amalgamate a local council on the basis of a secret report.” (In parliamentary systems, opposition office holders are designated as spokespersons or shadow ministers, replicating the portfolios of the government ministers, who are also legislative members). He added that the decision could “dismantle every single outstanding amalgamation proposal.” He called the decision “an embarrassing blow” for the government’s forced amalgamation program, which he characterized as “unraveling.”

    The Labor Party Opposition Leader Luke Foley expressed similar sentiments, saying “Thank God we have an independent judiciary.”

    Tony Recsei, president of Save Our Suburbs (SOS) NSW, which has opposed the forced mergers, noted that:  “Rational justification for wholesale forced council amalgamations was never provided by the Government.” He added: “The amalgamation “consultation” process was laughable in its duplicity. It was glaringly obvious to anyone who participated that the results had been predetermined.” He characterized the court decision as “… a rare win for the community against a dictatorial government and represents a complete trouncing of underhand bureaucratic manipulation.” Demonstrations have been held to oppose the forced mergers (Photo).


    Photograph courtesy of FOKE (Friends of Ku-ring-gai Environment)

    Still a Threat

    Deputy Premier John Barilaro had demanded two months ago that the Coalition government abandon its forced amalgamation program. His National Party (the Liberal Party’s coalition partner) had recently lost the Legislative Assembly seat of Orange that it had held for 69 years running, a consequence, at least in part of the government’s forced amalgamation program. The National Party has traditionally been strong in the “bush,” including smaller urban areas (such as Orange), outside the major metropolitan areas of Australia. The National Party usually been the coalition partner of the Liberal Party in government at the federal and state level.

    A compromise was reached  such that “country councils” (outside the Greater Sydney area and where the National Party is strong) will not be required to amalgamate. However, a month ago, the government expressed its intention to continue with the Sydney area amalgamations.

    In fact, the government could resurrect the Ku-ring-gai Hornsby forced merger proposal. However, Ku-ring-gai Mayor Jennifer Anderson told the ABC (Australian Broadcasting Corporation) that she was “heartened.” She added that “We have had to go to court to get the Government to listen to us and I am seeking a change of heart from the Premier on this issue as a matter of urgency." She cautioned that "If they continue with the merger process, they will be flying in the face of our community and the court."

    Forced Amalgamation: “Fit for the Dustbin?”

    This initiative is the third local government reorganization since 2000 in New South Wales. Like the previous programs, the justification has been anticipated cost savings. Councils were examined for their fiscal sustainability in “Fit for the Future” reviews.

    Greens spokesman Shoebridge questions the justification for amalgamation. In a Greens of Hornsby website article entitled “Fit for the Future, Fit for the Dustbin,” Shoebridge notes that “When amalgamations have been forced on locals in other states like Victoria and Queensland, rates (taxes) have gone up, services have stagnated and residents end up less connected to the councilors who represent them. In Queensland a number of councils have even begun the expensive process of de-amalgamation, with the Queensland Government bearing the cost of this process.” In that state, the Liberal National government won power promising de-amalgamation votes, yet allowed only four referendums out of the 19 councils seeking relief. All four voted to de-amalgamate.

    Repeating History

    If the Ku-ring-gai amalgamation story sounds familiar, it is. In 2000, the government of Quebec undertook a wholesale program of local government amalgamations. Public reaction was so sharp that the government was defeated at the next election, as the opposition Liberal Party promised de-amalgamation votes. Despite its promises, the Liberals, once elected, required de-amalgamation “yes” votes to equal 35 percent of eligible voters, a prohibitive barrier given the typically low turnouts in local government elections. In the end 32 governments voted to de-amalgamate. In the United States, proposals to force local government amalgamations have not received legislative approval in Pennsylvania, New York, Illinois and Ohio.

    The Sydney area consultant savings report is also familiar. In 1997, the Ontario government announced a forced amalgamation of six local governments in the Toronto area. The “megacity” as it was called was, according to an accounting firm report commissioned by the government, to save $300 million annually, which was not achieved, according to University of Western Ontario local governance expert  Professor Andrew Sancton. Despite overwhelming referendum rejections in six of the cities, the government forced the amalgamation.

    Basic Democratic Values

    Ku-ring-gai Mayor Anderson also stressed basic democratic values, the ability of an electorate to control its government, noting that "This merger should not proceed because Ku-ring-gai ratepayers (taxpayers) will be robbed of the means to decide how and where our rates are spent and of any real say in how our local area is managed.

    These are powerful words. The fight for democracy has been waged for at least the 800 years since Magna Carta and progress has been hard won. Forced amalgamations are anti-democratic and a step backward. It would be one thing if the electorate of Ku-ring-gai had determined that it would be best to amalgamate with Hornsby. But there is a big difference between top-down forced amalgamations and amalgamations that arise from the people themselves. Voluntary amalgamations have a better chance of succeeding than those that are forced.

    However, forced amalgamations dilute the voice of voters, and without  their consent. Usually, as in New South Wales, it is argued that larger government units will be more efficient, exercising economies of scale. The reality is all too often that the economies of scale that are actually achieved are only for special interests, not for the people or their pocket books.

    Wendell Cox is principal of Demographia, an international public policy and demographics firm. He is a Senior Fellow of the Center for Opportunity Urbanism (US), Senior Fellow for Housing Affordability and Municipal Policy for the Frontier Centre for Public Policy (Canada), and a member of the Board of Advisors of the Center for Demographics and Policy at Chapman University (California). He is co-author of the “Demographia International Housing Affordability Survey” and author of “Demographia World Urban Areas” and “War on the Dream: How Anti-Sprawl Policy Threatens the Quality of Life.” He was appointed to three terms on the Los Angeles County Transportation Commission, where he served with the leading city and county leadership as the only non-elected member. He served as a visiting professor at the Conservatoire National des Arts et Metiers, a national university in Paris.

    Photograph: Ku-rin-gai anti-forced amalgamation campaign banner, Photography courtesy of Save Our Suburbs (SOS) NSW.

  • Flight from Urban Cores Accelerates: 2016 Census Metropolitan Area Estimates

    The flight from the nation’s major metropolitan area core counties increased 60 percent between 2015 and 2016, according to just-released estimates from the US Census Bureau (Note). A total of 321,000 more residents left the core counties than moved in, up from 199,000 in 2015. This is ten times the decade’s smallest domestic migration loss of 32,000 for the same counties which occurred in 2012.

    Suburban counties continued to attract net domestic migrants, at a somewhat higher rate than in recent years and much higher than in the early part of the decade. The suburban counties gained 235,000 domestic migrants in 2016, compared to 224,000 in 2014 and more than double the low point of 113,000 in 2011 (Figure 1).

    The 60 percent rise in net domestic migration out of the core counties converts to a 0.4 percent annual loss relative to last year’s population. This loss is more than one-half the annual growth rate of only 0.7 percent. This is a substantial deterioration from the net domestic migration loss in 2012 of 0. 04 percent, which was only 1/25th of the 1.1 percent growth rate for the core counties.

    At the same time, the suburbs had their best performance of the decade. Their minimum advantage was in 2012, when the suburbs attracted 150,000 new domestic migrations relative to the core counties (118,000 compared to negative 32,000). The 2016 advantage was 556,000 (235,000 compared to negati ve 321,000).

    The suburbs outperformed core county domestic migration in 40 of the 50 major metropolitan cases. The ten exceptions include three with strong urban cores (San Francisco, Boston and Washington) and seven with very small urban cores, indicating that much of the central county population is post-war suburban (see: Growth Concentrated in Most Suburbanized Core Cities).

    Overall Domestic Migration

    The deterioration in core county domestic migration led to overall negative domestic migration for the major metropolitan areas in 2016, the first time this has happened this decade. Overall, the 53 major metropolitan areas had a net domestic migration loss of 64,000, down from 17,000 in 2015 and 98,000 in 2012. Since the 2010 census, the major metropolitan areas have gained 222,000 net domestic migrants. This represents an overall net domestic migration rate of 0.13 percent relative to their 2010 population.

    The big, and perhaps surprising, news here is that the “second tier” of metropolitan areas   (between 500,000 and 1 million population) have begun to perform better than their larger counterparts, a result reminiscent of the last decade. These 53 metropolitan areas gained 97,000 net domestic migrants, topping the major metropolitan areas for the third year in a row (Figure 2). Since the 2010 census, second tier metropolitan areas have gained 334,000 domestic migrants. This is 0.92 percent of the 2010 census population, seven times the major metropolitan area figure of 0.13 percent.

    Where People Are Moving To and Away From

    As has become customary, the greatest rates of domestic migration among the major metropolitan areas are overwhelmingly in the South. Austin is again number one, gaining nearly 1.7 percent from domestic migration. Austin is followed by Tampa St. Petersburg, Raleigh and Jacksonville. Las Vegas is the only non-southern major metropolitan area among the top five in net domestic migration. The second five includes four southern metropolitan areas, Charlotte, Orlando and Nashville, ranking sixth through eighth and San Antonio ranking tenth. Phoenix placed ninth.

    The bottom 10 are a relatively familiar group of metropolitan areas, with San Jose placing last and being alone in having more than one percent (1.1 percent) of its population move away between 2015 and 2016. San Jose was also last in net domestic migration in the decade of the 2000s, if hurricane ravaged New Orleans is excluded. The bottom five also includes New York, Chicago, Hartford and Milwaukee. Los Angeles had the sixth worst net domestic migration, followed by Rochester, Virginia Beach-Norfolk, Washington and Buffalo (Figure 3).

    The net domestic migration leaders among the large metropolitan areas posted even stronger gains than Austin. All of the top five had greater net domestic migration rates, and all are in Florida. Leader Cape Coral added more than 2.5 percent to its population from domestic migration. Nearby Sarasota was near 2.5 percent in Daytona Beach was also over two percent. Melbourne and Lakeland were approximately 1.9 percent. The second five was led by Charleston, South Carolina, followed by Boise, Fayetteville AR-MO, Spokane and Provo, UT.

    The largest domestic migration loss was in Honolulu, at 1.1 percent and slightly worse than San Jose (minus 1.08 percent compared to 1.06 percent in San Jose). Two of New York’s commuter rail exurbs ranked second and fourth worst, Bridgeport-Stamford and New Haven, while Syracuse ranked third. El Paso had the fifth worst net domestic migration. The second five worst in net domestic migration were Springfield, Massachusetts, Youngstown, Bakersfield, Oxnard and McAllen, Texas (Figure 4).

    Population Rankings and Trends

    Again, New York, Los Angeles, Chicago, Dallas-Fort Worth and Houston were the largest. They were followed by Washington (which passed Philadelphia last year), Philadelphia, Miami, Atlanta and Boston. There was no change in the rankings of the top 22 major metropolitan areas. Portland dropped two notches, from 23rd to 25th largest, as both Orlando and San Antonio jumped ahead. Austin jumped 2 positions, passing both Cleveland and Columbus, becoming the 31st largest metropolitan area. Finally, Raleigh passed Louisville to become the 43rd largest metropolitan area. The table at the end of the article includes information on the 106 largest metropolitan areas.

    The population growth rates for both the major and second tier  metropolitan area leaders and trailers looks similar to the domestic migration rankings (Figures 5 and 6). Austin leads the majors and Cape Coral leads the large metropolitan areas. There are greater differences in the bottom ten, where some of the largest domestic migration losers (such as New York, Los Angeles and Chicago) attract strong international migration have been replaced by others that attract fewer, and tend to have lower population growth rates as a result.

    More Major Metropolitan Areas?

    Meanwhile, some metropolitan areas should soon pass the 1,000,000 mark. Honolulu has been at the top of the list for some time. If the annual growth rates from 2010 to 2013, 2014 or 2015 had been sustained, Honolulu would have reached a million by 2016. But, Honolulu’ growth rate has slowed substantially in each of the last years since 2012, culminating in a modest population loss in 2016, leaving Honolulu 7,000 short of a million. Current growth rates suggest that Tulsa and Fresno could get to a million before Honolulu.

    Reason For Concern

    While the domestic migration data has long since disproven any thesis of a general movement of people from the suburbs to the urban core, the escalation in core county domestic migration losses is cause for concern.

    The urban cores are far nicer places than they were before. But their recovery has been all too concentrated ; meanwhile the rings around trendy downtown residential areas continue, as before the micro-core renaissance, to suffer serious poverty levels and other social ills more intensely than elsewhere. We have been down a similar road before, and have never recovered from the serious costs.

    Note: Major metropolitan areas have more than 1,000,000 population. The domestic migration comparison between core and suburban counties is limited to 50 of the 53 metropolitan areas, because four have only one county (Las Vegas, San Diego and Tucson). The lowest geographical level at which domestic migration data is available is counties. The core counties are often so large that they include large suburban components. This makes for a more crude comparison than would be the case if more precise data were available.

    Metropolitan Areas Over 500,000:  Population Estimates: 2016
    Population (Millions) 2015-2016
    Rank Metropolitan Area 2010 2015 2016 Population Change Net Domestic Migration Rank: Domestic Migration
    1 New York, NY-NJ-PA     19.566    20.118    20.154 0.18% -0.99% 103
    2 Los Angeles, CA     12.829    13.269    13.310 0.31% -0.66% 95
    3 Chicago, IL-IN-WI       9.462      9.533      9.513 -0.21% -0.94% 101
    4 Dallas-Fort Worth, TX       6.426      7.090      7.233 2.02% 0.85% 25
    5 Houston, TX       5.920      6.647      6.772 1.88% 0.42% 38
    6 Washington, DC-VA-MD-WV       5.636      6.078      6.132 0.88% -0.51% 91
    7 Philadelphia, PA-NJ-DE-MD       5.966      6.062      6.071 0.14% -0.43% 84
    8 Miami, FL       5.566      6.002      6.066 1.08% -0.28% 72
    9 Atlanta, GA       5.287      5.699      5.790 1.59% 0.64% 30
    10 Boston, MA-NH       4.553      4.767      4.794 0.58% -0.35% 76
    11 San Francisco, CA       4.336      4.642      4.679 0.80% -0.26% 69
    12 Phoenix, AZ       4.193      4.568      4.662 2.05% 1.13% 20
    13 Riverside-San Bernardino, CA       4.225      4.475      4.528 1.17% 0.34% 43
    14 Detroit,  MI       4.296      4.298      4.298 0.00% -0.47% 86
    15 Seattle, WA       3.440      3.727      3.799 1.93% 0.83% 26
    16 Minneapolis-St. Paul, MN-WI       3.349      3.518      3.551 0.93% 0.01% 57
    17 San Diego, CA       3.095      3.290      3.318 0.84% -0.25% 68
    18 Tampa-St. Petersburg, FL       2.784      2.971      3.032 2.06% 1.57% 7
    19 Denver, CO       2.544      2.809      2.853 1.58% 0.72% 28
    20 St. Louis,, MO-IL       2.788      2.808      2.807 -0.05% -0.41% 83
    21 Baltimore, MD       2.711      2.794      2.799 0.18% -0.40% 81
    22 Charlotte, NC-SC       2.217      2.425      2.474 2.05% 1.31% 13
    23 Orlando, FL       2.134        2.38      2.441 2.48% 1.24% 15
    24 San Antonio, TX       2.143        2.38      2.430 2.01% 1.04% 21
    25 Portland, OR-WA       2.226      2.385      2.425 1.68% 1.01% 22
    26 Pittsburgh, PA       2.356      2.351      2.342 -0.38% -0.33% 73
    27 Sacramento, CA       2.149      2.268      2.296 1.27% 0.54% 34
    28 Cincinnati, OH-KY-IN       2.115      2.155      2.165 0.45% -0.06% 61
    29 Las Vegas, NV       1.951      2.109      2.156 2.20% 1.31% 12
    30 Kansas City, MO-KS       2.009      2.084      2.105 0.96% 0.32% 44
    31 Austin, TX       1.716      1.998      2.056 2.92% 1.67% 6
    32 Cleveland, OH       2.077      2.060      2.056 -0.21% -0.49% 89
    33 Columbus, OH       1.902      2.020      2.042 1.06% 0.22% 48
    34 Indianapolis. IN       1.888      1.987      2.004 0.89% 0.13% 51
    35 San Jose, CA       1.837      1.969      1.979 0.52% -1.06% 105
    36 Nashville, TN       1.671      1.829      1.865 1.99% 1.14% 19
    37 Virginia Beach-Norfolk, VA-NC       1.677      1.723      1.727 0.20% -0.55% 92
    38 Providence, RI-MA       1.601      1.613      1.615 0.13% -0.24% 66
    39 Milwaukee,WI       1.556      1.574      1.572 -0.12% -0.72% 98
    40 Jacksonville, FL       1.346      1.448      1.478 2.09% 1.36% 11
    41 Oklahoma City, OK       1.253      1.357      1.373 1.20% 0.40% 39
    42 Memphis, TN-MS-AR       1.325      1.342      1.343 0.07% -0.48% 88
    43 Raleigh, NC       1.130      1.271      1.303 2.48% 1.46% 10
    44 Louisville, KY-IN       1.236      1.278      1.283 0.46% -0.01% 58
    45 Richmond, VA       1.208      1.270      1.282 0.89% 0.26% 46
    46 New Orleans. LA       1.190      1.262      1.269 0.54% -0.07% 62
    47 Hartford, CT       1.212      1.210      1.207 -0.26% -0.80% 100
    48 Salt Lake City, UT       1.088      1.168      1.186 1.60% 0.32% 45
    49 Birmingham, AL       1.128      1.145      1.147 0.22% -0.05% 60
    50 Buffalo, NY       1.136      1.135      1.133 -0.24% -0.51% 90
    51 Rochester, NY       1.080      1.081      1.079 -0.22% -0.64% 94
    52 Grand Rapids, MI       0.989      1.038      1.047 0.84% 0.11% 53
    53 Tucson, AZ       0.980      1.008      1.016 0.79% 0.25% 47
    54 Honolulu, HI       0.953      0.993      0.993 -0.06% -1.08% 106
    55 Tulsa, OK       0.938      0.980      0.987 0.69% 0.17% 50
    56 Fresno, CA       0.930      0.972      0.980 0.80% -0.27% 71
    57 Bridgeport-Stamford, CT       0.917      0.945      0.944 -0.05% -1.04% 104
    58 Worcester, MA-CT       0.917      0.934      0.936 0.17% -0.39% 79
    59 Omaha, NE-IA       0.865      0.914      0.924 1.08% 0.12% 52
    60 Albuquerque, NM       0.887      0.905      0.910 0.52% 0.11% 54
    61 Greenville, SC       0.824      0.873      0.885 1.34% 0.88% 24
    62 Bakersfield, CA       0.840      0.879      0.885 0.60% -0.48% 87
    63 Albany, NY       0.871      0.881      0.882 0.12% -0.25% 67
    64 Knoxville, TN       0.838      0.861      0.869 0.86% 0.73% 27
    65 New Haven CT       0.862      0.859      0.857 -0.26% -0.79% 99
    66 McAllen, TX       0.775      0.839      0.850 1.25% -0.41% 82
    67 Oxnard, CA       0.823      0.848      0.850 0.24% -0.44% 85
    68 El Paso, TX       0.804      0.837      0.842 0.57% -0.69% 97
    69 Allentown, PA-NJ       0.821      0.833      0.836 0.31% -0.08% 63
    70 Baton Rouge, LA       0.803      0.830      0.835 0.65% 0.03% 56
    71 Columbia, SC       0.767      0.810      0.817 0.95% 0.48% 36
    72 Dayton, OH       0.799      0.800      0.801 0.11% -0.17% 65
    73 Sarasota, FL       0.702      0.768      0.788 2.66% 2.46% 2
    74 Charleston, SC       0.665      0.745      0.761 2.22% 1.54% 8
    75 Greensboro, NC       0.724      0.752      0.756 0.58% 0.17% 49
    76 Little Rock, AR       0.700      0.732      0.735 0.42% -0.10% 64
    77 Stockton, CA       0.685      0.723      0.734 1.41% 0.57% 32
    78 Cape Coral, FL       0.619      0.700      0.722 3.15% 2.54% 1
    79 Colorado Springs, CO       0.646      0.698      0.712 2.11% 1.16% 18
    80 Akron, OH       0.703      0.703      0.702 -0.16% -0.35% 75
    81 Boise, ID       0.617      0.676      0.691 2.32% 1.47% 9
    82 Lakeland, FL       0.602      0.649      0.666 2.58% 1.87% 5
    83 Winston-Salem, NC       0.641      0.658      0.662 0.64% 0.45% 37
    84 Syracuse, NY       0.663      0.660      0.657 -0.53% -0.99% 102
    85 Ogden, UT       0.597      0.642      0.654 1.88% 0.69% 29
    86 Madison, WI       0.605      0.641      0.649 1.30% 0.49% 35
    87 Wichita, KS       0.631      0.643      0.645 0.26% -0.35% 74
    88 Daytona Beach, FL       0.590      0.623      0.638 2.29% 2.24% 3
    89 Des Moines, IA       0.570      0.623      0.635 1.95% 0.95% 23
    90 Springfield, MA       0.622      0.630      0.630 0.02% -0.67% 96
    91 Toledo, OH       0.610      0.606      0.605 -0.06% -0.37% 77
    92 Provo, UT       0.527      0.585      0.603 3.07% 1.18% 17
    93 Augusta, GA-SC       0.565      0.590      0.595 0.83% 0.35% 42
    94 Jackson, MS       0.568      0.579      0.579 0.10% -0.37% 78
    95 Melbourne, FL       0.543      0.568      0.579 1.97% 1.91% 4
    96 Harrisburg, PA       0.549      0.565      0.568 0.52% -0.03% 59
    97 Durham, NC       0.507      0.551      0.560 1.51% 0.55% 33
    98 Spokane, WA       0.528      0.547      0.557 1.69% 1.23% 16
    99 Scranton, PA       0.564      0.558      0.555 -0.45% -0.40% 80
    100 Chattanooga, TN-GA       0.528      0.547      0.552 0.85% 0.64% 31
    101 Youngstown, OH-PA       0.566      0.549      0.545 -0.85% -0.59% 93
    102 Modesto, CA       0.514      0.535      0.542 1.15% 0.38% 40
    103 Lancaster, PA       0.519      0.536      0.539 0.40% -0.26% 70
    104 Portland, ME       0.514      0.527      0.530 0.54% 0.37% 41
    105 Fayetteville, AR-MO       0.463      0.513      0.525 2.26% 1.28% 14
    106 Santa Rosa, CA       0.484      0.501      0.503 0.32% 0.06% 55
    From: US Census Bureau Data

    Wendell Cox is principal of Demographia, an international public policy and demographics firm. He is a Senior Fellow of the Center for Opportunity Urbanism (US), Senior Fellow for Housing Affordability and Municipal Policy for the Frontier Centre for Public Policy (Canada), and a member of the Board of Advisors of the Center for Demographics and Policy at Chapman University (California). He is co-author of the "Demographia International Housing Affordability Survey" and author of "Demographia World Urban Areas" and "War on the Dream: How Anti-Sprawl Policy Threatens the Quality of Life." He was appointed to three terms on the Los Angeles County Transportation Commission, where he served with the leading city and county leadership as the only non-elected member. He served as a visiting professor at the Conservatoire National des Arts et Metiers, a national university in Paris.

    Photo: Coral Gables Florida (MSA), largest domestic migration and population gain of any metropolitan area over 500,000 population, 2015-2016 (by author)

  • Taxpayers Need Protection from Dallas-Houston High Speed Rail Bailout? New Report

    The proposed privately financed high-speed rail line from Houston to Dallas is projected to have a revenue shortfall of $21.5 billion in its first 40 years of operation. This is the conclusion of a Reason Foundation report by Baruch Feigenbaum, the Foundation’s assistant director of transportation policy (Texas High Speed Rail: Caution Ahead). This and other concerns lead the Reason Foundation to indicate: “… we cannot support Texas Central’s proposed Dallas to Houston project.” This is an important development, since the Reason Foundation has been a strong supporter of privately financed transport infrastructure for decades.

    “Optimism Bias and Demand Exaggeration”

    Feigenbaum explains: “Our analysis indicates that Texas Central is exhibiting the same ‘optimism bias; and ‘demand exaggeration’ that have plagued many public infrastructure projects —and especially high-speed rail projects—for decades. Simply put, Texas Central has exaggerated its ridership projections while underestimating costs.” Feigenbaum adds: “…private sector involvement is not a panacea. A wildly unsuccessful project is not going to become feasible with private financing.”

    To any who follow infrastructure finance, these are familiar terms. The sorry record of major infrastructure forecasts has been documented by Oxford University professor Bent Flyvbjerg, along with Nils Bruzelius (a Swedish transport consultant) and Werner Rottenberg (University of Karlsruhe and former president of the prestigious World Conference on Transport Research). They reviewed 80 years of infrastructure projects and found initial cost estimates to routinely be low and demand (ridership) to have been routinely over-estimated (Megaprojects and Risk: An Anatomy of Ambition). They found passenger rail project cost overruns to be among the worst, averaging 45 percent. They also found ridership projections to be two-thirds too high in two-thirds of cases.

    Reason Foundation and State DOT Estimates

    The Reason Foundation report suggests that the Texas project might perform even more poorly. Feigenbaum estimates that the Dallas to Houston line would carry 1.4 million passengers by 2035. He also cites a Texas Department of Transportation analysis estimating annual riders at between 0.7 and 2.7 million trips, by 2035. The Texas Central estimates a considerably higher five million riders by 2025, 10 years earlier.

    But the difficulties do not stop there. The costs of construction projected by the Texas Central Railway, at a maximum of $12 billion, may be significantly underestimated. Feigenbaum conservatively estimates costs that are nearly 50 percent higher ($17.8 billion) and suggest that the cost could exceed $20 billion. This is similar to a State Department of Transportation estimate of $18.7 billion, according to the report.

    Either of these eventualities, both of which are fairly routine for such projects, would mean that the Texas Central Railway might not have enough money to operate the service, or even to finish construction, unless bailed out. Of course, it is hard to find investors for failed projects, and there would be strong political pressure for government grants and subsidies.

    The California Boondoggle

    California’s high speed rail project, well into the planning stage and about to lay some track, has already exceeded the Oxford research cost overruns with a vengeance. By 2012, construction costs had risen more than 60 percent compared to those publicized to obtain voter approval of bonds for the project in 2008. Worse, that’s after officials scaled back the system from high speed rail to a blend between conventional (commuter rail) and high speed rail.

    As if that were not enough, the first short segment, already under construction, according to a federal report   could have a cost overrun of up to $3.5 billion. The segment is approximately two-thirds the Dallas to Houston route length and is similarly flat, in the largely agricultural San Joaquin Valley. The Wall Street Journal referred specifically to the California high speed rail project in a recent editorial characterizing Sacramento as “America’s western swamp.”

    The International Experience

    Out of all of the high speed rail lines built in the world, only  two have avoided commercial losses (“broken even”) until recently (Tokyo to Osaka and Paris to Lyon). Both had very low construction costs, which made it possible to repay , unlike the highly escalated costs that have developed in subsequent projects. These have depended on taxpayer subsidies for their survival.

    More recently, the Shanghai to Beijing high speed line became profitable, though its superlatives are well beyond replication by any other project (at least of any planet discovered so far). The line is slightly shorter than the distance between New York and Atlanta, but directly serves a market larger than the population of the European Union (more than 520 million residents) and 60 percent more than the United States. The stations on the exclusively high speed rail line itself serve municipalities with more than 160 million people, more people than live in Japan and 2.5 times as many as residents as in France. Another 360 million residents are served by trains that directly access the Shanghai to Beijing line from outside the corridor for part of their journey.

    Whence the Bailout?

    Feigenbaum suggests the likely source of a bailout for the Dallas to Houston high speed rail line: “While Texas Central may not be intending to take any public funding, we believe that if construction starts, the project will inevitably have to be bailed out by the taxpayers of Texas, which is unacceptable” (our emphasis).

    He also notes that the Texas Central Railway plans to seek Railroad Rehabilitation and Improvement Financing (RRIF) program loan from the US Department of Transportation (USDOT). These below market rate loans are guaranteed by federal taxpayers. Of course, taxpayers already know how this works. Just a few years ago, Solyndra defaulted on a $0.5 billion federal loan, leaving taxpayers to “holding the bag.”

    A genuine privately funded project would raise sufficient funds from private investors and from non-subsidized commercial financing sources. It would also attract ridership large enough to produce sufficient to pay the loans and repay the investors. The Reason Foundation and the Texas Department of Transportation findings suggest otherwise

    All of this is disappointing to Feigenbaum, and also to me. After years of warning of taxpayer risks from such projects (Note ), I had hoped this one would be a genuinely commercial project, as this article from more than four years ago indicates (see: “Texas High Speed Rail: On the Right Track). It looks like it’s too good to be true.

    Making it Work?

    However, there may be a way to deliver the Texas Central project, while removing all potential taxpayer risk. According to the Dallas Business Journal Texas Central officials indicated that the Central Japan Railway would be the “primary investor”. There is also a report that Japan’s Government Pension Investment Fund may invest in US infrastructure, including the Texas high speed rail project. These organizations are more than financially capable of ensuring that there is no taxpayer risk.

    The Japanese know high speed rail. They are likely to invest only if they are confident they can recover their money, with a commercial profit. Moreover, any such investment needs to include financial guarantees that ensure there is no potential for either US or Texas taxpayers to be called upon for subsidies to cover cost overruns, operations or anything else. Any other approach could be foolhardy.

    Note: These publications include authoring or co-authoring a number of taxpayer risk reports on proposed high-speed rail lines, such as on Florida high-speed rail proposals between the 1990s and 2010s, the Xpress West Victorville to Las Vegas high-speed rail line, the first and second diligence reports on the California high-speed rail line, and a greenhouse gas emissions analysis of the California high-speed rail line. Sponsors included the Reason Foundation, the Howard Jarvis Taxpayers Association, Citizens Against Government Waste and the James Madison Institute.

    Wendell Cox is principal of Demographia, an international public policy and demographics firm. He is a Senior Fellow of the Center for Opportunity Urbanism (US), Senior Fellow for Housing Affordability and Municipal Policy for the Frontier Centre for Public Policy (Canada), and a member of the Board of Advisors of the Center for Demographics and Policy at Chapman University (California). He is co-author of the "Demographia International Housing Affordability Survey" and author of "Demographia World Urban Areas" and "War on the Dream: How Anti-Sprawl Policy Threatens the Quality of Life." He was appointed to three terms on the Los Angeles County Transportation Commission, where he served with the leading city and county leadership as the only non-elected member. He served as a visiting professor at the Conservatoire National des Arts et Metiers, a national university in Paris.

    Photograph: Texas flag

  • Canada’s Urban Areas: Descent from Affordability

    Canada is a nation of wide open spaces, yet it has high urban area densities recently driven higher by a redefinition of urban area criteria (Note 1). Canada’s largest urban area (population centre) is Toronto, with a population of 5.4 million continues to be the densest of the 59 with more than 50,000 residents. Toronto has a population of 3,028 per square kilometer (7,843 per square mile), approximately five percent above the European Union average. Montréal (population of 3.5 million) has a density of 2,720 per square kilometer (7,045 per square mile), followed by third ranked Vancouver (2,584/6,693), which has a population of 2.2 million.  The top ten is rounded out by Milton, a fast growing Toronto exurb with a density of 2,520 per square kilometer or 6.527 per square mile, Calgary (2,112/5,470), Regina, the capital of Saskatchewan (2,082/5,391) and Winnipeg, which has seen renewed recent growth (2,070/5,360).

    Four other population centres have densities greater than 1,950 per square kilometer (5,000 per square mile , including  Oshawa and Hamilton, which are adjacent to Toronto, as well as Saskatoon, Saskatchewan and Kanata, an exurb of Ottawa (Figure 2).

    Comparisons to the United States

    The new, higher density figures are not surprising considering the especially compact suburbs in view when landing at Pearson Airport in Toronto, or even in Calgary or Edmonton. A combined Canada-US urban area density list illustrates the higher density of Canadian urban areas relative to those in the United States.  Among the five densest urban areas in Canada and the United States, four are in Canada. Los Angeles, the densest large urban area in the United States for the last three censuses, ranks third behind Toronto and Montréal. Vancouver and Milton rank fourth and fifth, just ahead of 6th ranked San Francisco. Immediately behind San Francisco is virtually all post-World War II suburban San Jose. Delano, California, an exurb of Bakersfield in the San Joaquin Valley has about 55,000 residents and ranks 8th on the combined list.

    Residents of Calgary, Regina and Winnipeg, where densification advocates repeatedly condemn their perceived local urban sprawl (a pejorative term for urban dispersion) will doubtless be surprised to know that their population density exceeds that of New York. Only one more US urban area makes the top 20, Sacramento exurb Davis, at 14th, with a population of 73,000 (Figure 3).

    Where’s Portland?

    To those inclined to venerate Portland’s internationally famous densification policies, this list may be disconcerting. Calgarians who bemoan the inferiority of their city in relation to Portland should be heartened to find out that Calgary’s density is more than 50 percent higher than Portland’s (Calgary’s transit market share is more than double Portland’s).

    Portland is not among the densest 20 urban areas , but ranks 72nd, just behind all-suburban Riverside-San Bernardino and a bit ahead of Halifax. If Portland were in Canada, it would rank 38th in population density out of the largest 59 urban areas.

    And Boston?

    Boston has a reputation as one of the densest cities in the United States. Yet, Boston’s huge urban area  is denser than only three of Canada’s urban areas on the list, Belleville, ON, North Bay, ON and Fredericton, NB. Each is smaller than Boston suburb Somerville, which has about 75,000 residents. Among the urban areas of  Canada and the US Boston is 218th in density. (Note 3).

    Urban Containment Not Density Associated with Unaffordability

    Canada’s urban areas illustrate that density does not have to mean unaffordable housing. There has been some densification since 2000, but Canada’s urban areas were nearly as dense even then. For example, in the last 15 years, the completely developed city of Toronto, with all its new residential towers, has added only 10 percent to its population. Five of Canada’s six major metropolitan areas Toronto, Montréal, Ottawa-Gatineau, Calgary and Edmonton were affordable at the beginning of the new century, hovering around a median multiple 3.0.

    All that has changed, however, with the imposition of urban growth boundaries and equivalent policies. Ailin He and I showed in a Frontier Centre study (Canada’s Middle Income Housing Affordability Crisis) that house prices had “exploded” relative to household incomes between 2000 and 2015. This cannot be attributed to the modestly higher densities. The big change took place in land use policy, with, for example, Toronto and Calgary adopting urban containment policy that has been strongly associated with the destruction of housing affordability. Residents of Vancouver  — an urban area widely praised among planners —  have been paying the price for urban containment for much longer (Figure 4).

    Canada’s experience up to the end of the 20th century proves that dense and affordable urban areas can be achieved. But since that time, as house prices have risen relative to incomes, Canada’s experience shows that all that can be reversed in an environment of binding urban containment policy.

    Note 1: Between 2011 and 2016, Canada’s urban areas increased more than 40 percent in population density, according to Statistics Canada data. This, however, was not a miracle of urban containment policy or smart growth, it was rather an improved method adopted by Statistics Canada for measuring urbanization. Urban areas are the "physical city," which unlike the metropolitan area has only urban land. Canada now calls its urban areas "population centres," having changed to the new label in 2011, when the United Kingdom labeled them "built up urban areas."

    In 2011 and before, the Census had used municipalities as building blocks for urban areas. Often, those municipalities included large swaths of rural land (as did Los Angeles until well into the 1950s). Now, the building blocks for urban areas in Canada are "blocks", the lowest enumeration geography of the Census (the same revision was implemented by the US Census in 2000). Under the old definition, Canada’s urban areas had a density of 1,180 per square kilometer (3,057 per square mile) in 2011. Now it is 1,698 per square kilometer (4,397 per square mile), a 44 percent increase.

    Note 2: The comparisons are between the 2016 Census of Canada data and the 2010 US Census data, since urban area (population centre) data is only developed in the censuses (the next US census will be in 2020). The list is developed from the 59 urban areas in Canada and the 499 in the United States with 50,000-plus residents in the last censuses.

    Note 3:  A recent article found Boston to be almost five times as dense as Houston. However, this was in municipal (inside the city limits) density. City limits are artificial, political constructs that have nothing to with the organic city (the physical city , also called urban area or the economic city, or the metropolitan area , which is the labor market).  The Houston urban area, with its reputation for "sprawl" is actually one-third denser (1150/2979 ) than Boston’s (856 /2,278). At the physical city level, the urban area is the best indication of urban density. Using metropolitan density as an indicator of urban density is nonsensical, since all metropolitan areas include substantial rural territory.

    Wendell Cox is principal of Demographia, an international public policy and demographics firm. He is a Senior Fellow of the Center for Opportunity Urbanism (US), Senior Fellow for Housing Affordability and Municipal Policy for the Frontier Centre for Public Policy (Canada), and a member of the Board of Advisors of the Center for Demographics and Policy at Chapman University (California). He is co-author of the “Demographia International Housing Affordability Survey” and author of “Demographia World Urban Areas” and “War on the Dream: How Anti-Sprawl Policy Threatens the Quality of Life.” He was appointed to three terms on the Los Angeles County Transportation Commission, where he served with the leading city and county leadership as the only non-elected member. He served as a visiting professor at the Conservatoire National des Arts et Metiers, a national university in Paris.

    Photo: Suburban density in Toronto (Markham) by IDuke – English Wikipedia, CC BY-SA 2.5

  • Los Angeles Traffic: Likely To Worsen with Higher Densities

    A few recent days driving the Los Angeles freeways impressed me with how different they are from in most other places in the country. The intensity of the traffic is astounding. Even on the weekend, travel over Sepulveda Pass on the San Diego Freeway (I-405) was highly congested. Traffic really never stopped, but frustratingly inched along for parts of the way and approached 60 miles per hour on other parts. A Saturday trip I feared might take an hour and a half was completed from Simi Valley in less than 60 minutes. Caltrans and the local officials do an admirable job of keeping the traffic moving, which was obvious from the only slight delay near Sherman Way caused by an incident that required a fire truck.

    Traffic Per Lane Mile

    The latest Federal Highway Administration data indicates that nearly 23,000 cars are handled by each freeway lane on the average day. Among the larger urban areas, only San Jose and close-by Riverside-San Bernardino have a volume of more than 20,000 daily.

    The freeway lane volume in Los Angeles is up from 16,500 cars per lane mile in the early 1980s,  a more 37 percent increase in traffic (Figure 1). This is not surprising, because the urban area, which stretches from the San Fernando Valley to Pomona and Orange County to San Clemente has added almost the same percentage of residents. The city of Los Angeles itself, which covers virtually the same area as it did more than three decades ago has become significantly more dense, also adding about one third to its population.

    At the same time, public policy in California is calling for significant urban densification that will put an even greater strain on the roadway network. Any assumption that a more dense Los Angeles will be anything less than an even more horrific traffic environment is simply folly.

    Billions Spent on Rail: Yet Traffic is Much Worse

    Some, including me while I was on the Los Angeles County Transportation Commission, believe (or in my case “believed”) that an expansion of transit — especially adding urban rail service, would relieve traffic congestion. Los Angeles has now had nearly three decades of experience with that strategy. Yet, traffic has only become more intense.

    Indeed, despite the addition of a substantial urban rail system in Los Angeles County has been accompanied by a general decline in transit ridership on the Metropolitan Transportation Authority services compared to predecessor services operated by the Southern California Rapid Transit District in 1985. In 2016, ridership was even lower than the year before, despite the extensions of rail service to Santa Monica on the Expo Line and to Azusa on the Gold Line.

    Even work trip ridership, which transit serves best, is down. In 1980, transit’s market share was 7.0 percent in Los Angeles County. By 2015, transit’s market share had fallen slightly to 6.8 percent. Meanwhile, driving alone expanded significantly from 68.7 percent in 1980 to 73.0 percent in 2015. Working at home increased from 1.5 percent in 1980 to 5.1 percent in 2015 (Figure 2).

    Why Rail has Not Attracted Drivers

    There are two principal reasons the transit has not been able to attract drivers out of their cars and reduce freeway volumes. The first is that, for the most part, you cannot get from here to there on transit. That is, most jobs and places people are traveling cannot be conveniently accessed by transit. The University of Minnesota Accessibility Laboratory has found that 43.3 percent of jobs in the Los Angeles metropolitan area can be reached by car within 30 minutes. By contrast. Only 0.7 percent of jobs can be reached by transit within 30 minutes. In other words, the accessibility provided by cars is much greater than that of transit. For every job that can be reached by transit within 30 minutes, nearly 60 times as many jobs can be reached by car (Figure 3).

    Even where jobs can be reached by transit, it takes far longer. According to the latest American Community Survey data, the average one way work trip travel time for people driving alone in the Los Angeles metropolitan area is 27.9 minutes. By contrast, the average Metro Rail rider takes 52.2 minutes to reach work (Figure 4). It is not hard to imagine why people have not traded in their faster car travel times for slower trips on transit. Excess travel time, regardless of how traveled, takes away from other necessary activities and recreation.

    Further, with all the talk about “urban villages,” with the expected improved jobs housing balance, it is well to recognize such an achievement would be unprecedented. As former principal planner of the World Bank Alain Bertaud put it: “…the urban village "model does not exist in the real world because it contradicts the economic justification of large cities: the efficiency of large labor markets." The cold water of reality is that "… the urban village model exists only in the mind of urban planners."

    Of course, talk of people living near where they work is dubious, particularly in a metropolitan area where housing affordability  is challenging both for the vast majority of renters and potential buyers. When does anyone think this will happen? In “this life” or maybe in the “life to come?”

    The bottom line, unfortunate and politically incorrect as it is, is that transit simply cannot reduce traffic congestion. Some other strategy needs to be deployed.

    Prognosis: More Density, More Traffic

    Los Angeles traffic is likely to get much worse, especially if the development becomes substantially denser. All of the 12 world urban areas in the recent Tom Tom Congestion Index that have worse traffic than Los Angeles are denser. This is consistent with the international evidence that shows a strong association between higher densities, greater traffic congestion and lengthened work trip travel times. The experience in Los Angeles shows the same thing.

    Wendell Cox is principal of Demographia, an international public policy and demographics firm. He is a Senior Fellow of the Center for Opportunity Urbanism (US), Senior Fellow for Housing Affordability and Municipal Policy for the Frontier Centre for Public Policy (Canada), and a member of the Board of Advisors of the Center for Demographics and Policy at Chapman University (California). He is co-author of the "Demographia International Housing Affordability Survey" and author of "Demographia World Urban Areas" and "War on the Dream: How Anti-Sprawl Policy Threatens the Quality of Life." He was appointed to three terms on the Los Angeles County Transportation Commission, where he served with the leading city and county leadership as the only non-elected member. He served as a visiting professor at the Conservatoire National des Arts et Metiers, a national university in Paris.

    Photo: North on the 110 Toward Downtown, AM Peak (by author)

  • Dallas-Fort Worth & Dayton: World Large City Least Congestion: 2017 Tom Tom Traffic Index

    Dallas-Fort Worth and Dayton Ohio have the least traffic congestion among larger cities (urban areas) in the world, according to the 2017 Tom Tom Traffic Index. Dallas-Fort Worth had the shortest average all day delay, at 18 percent of the 43 cities with more than 5 million population. Dallas-Fort Worth also had the least average peak period traffic delay. This is the second year in a row the Dallas Fort Worth has had the best all day traffic congestion. Dayton had the best all day and average peak hour congestion among the 146 cities with between 800,000 and 5,000,000 population and tied with three others for the best in among all cities the least all-day congestion.

    All City Rankings

    Among all city sizes, Syracuse (NY), Greensboro (NC), Winston-Salem (NC) and Dayton had the best all day traffic, with a nine percent average delay. Cadiz, Spain had the best average peak hour congestion, with an 11.5 percent delay.

    Mexico City had the most intense all day congestion, at 66 percent, followed closely by Bangkok at 61 percent. Other cities with the most congestion include, not surprisingly, Chongqing, Jakarta, Istanbul and Beijing. All have large populations, high densities and millions of cars. A real surprise, however is Lodz, Poland, with a population of less than 750,000, which has the fourth worst congestion (Figure 1)

    Bangkok ranked the most congested city, in the AM and PM peak periods, with an average traffic delay of 104.5 percent. This means that it takes twice as long in Bangkok to make a trip as it would if traffic flowed freely. Mexico City had the second largest delay at 98.5 percent, followed by Bucharest (Romania) at 94.0 percent. Bucharest   heavy traffic congestion surprises, since it has, at best, only one-fifth the population of the largest seven most congested cities. Even more surprising is that much smaller Belfast is the sixth most congested, while Dublin, smaller than Bucharest, ranks seventh (Figure 2).

    Cities Over 5,000,000 Population

    Out of the 43 cities with more than 5 million population, three US cities (Philadelphia, Houston and Chicago) and Madrid join Dallas-Fort Worth in having the least all-day traffic congestion. The five cities with the most traffic congestion are Mexico City, Chongqing, Jakarta and Istanbul (Figure 3).

    Three of the cities with the least average peak congestion are in the United States, including Dallas-Fort Worth, second-ranked Philadelphia and fourth-ranked Chicago. Madrid, again makes the top five in third position, while Sao Paulo ranks fifth (Figure 4). The Chinese cities of Quangzhou and Suzhou rank surprisingly well, in view of the national traffic congestion level (Table), at 6th and 9th least congested.


    Cities with 800,000 to 5,000,000 Population

    All 10 of the least congested cities between 800,000 and 5 million population all day are in the United States. The least congested are Dayton, Knoxville, Richmond, Omaha and Indianapolis, in a fifth-place tie with Kansas City.

    Bucharest had the most all day congestion, followed by Tiainan, Changsha, Shijazhuang and Kaohsiung  (Figure 5).

    The eight least congested cities between 800,000 and 5 million population during peak periods are located in the United States, led by Dayton, Knoxville, Richmond, Tulsa, Worcester and Kansas City.

    The greatest traffic congestion in this population category is in Bucharest, which is followed by Shijiazhuang, Changsha, Auckland and Zhuhai (Figure 6).

    Cities with Less than 800,000 Population

    The four cities with less than 800,000 population and the least all-day traffic congestion are in the United States, Winston-Salem (NC), Syracuse (NY), Greensboro (NC) and Akron (OH). The fifth best traffic congestion is in Ljubljiana, the capital of Slovenia.

    The worst all day traffic congestion in this category is in already cited Lodz and Dublin, as well as Palermo, Belfast, Lublin (Poland) and Edinburgh (Figure 7).

    Cadiz, Spain has the least peak period congestion in this population category, followed by four US cities, Syracuse, Greensboro, Akron and Winston-Salem.

    The greatest average peak period congestion in the below 800,000 population category was in Belfast, followed by Dublin, Lodz, Wellington (NZ) and Edinburgh.


    Traffic Congestion by Country and Geography

    Among the nations, the US has the overall least traffic congestion, with a delay rate of 19.3 percent in all day congestion, followed by the Netherlands and Spain. The US leads in two population categories, 800,000 to 5,000,000 and under 800,000. Spain has the least over 5,000,000 congestion, where Madrid exhibits the impacts of its strong motorway system.

    East Asian cities have the greatest all-day traffic congestion, at 41.1 percent, though among the largest cities Latin America has have most congestion.

    In average peak period congestion, Spain shows the best results, with a delay rate of 29.0 percent, followed by the United States and the Middle-East. Spain leads in the over 5,000,000 category, Turkey in the 800,000 to 5,000,000 category and the United States in the under 800,000 category.

    East Asian cities also have the greatest average peak period congestion, at  67.3 percent. Among the largest cities, congestion is greatest in the Eastern European cities outside Poland and Turkey (Table).

    The Importance of Traffic Indexes

    Cities are more productive if they facilitate greater access throughout their urbanization, especially for work trips, as Remy Prud’homme and Chang-Woon Lee at the University of Paris and David Hartgen and M. Gregory Fields of the University of North Carolina, Charlotte have shown. Traffic indexes provide important metrics to aid city officials in “keeping the traffic moving,” which is essential in the modern metropolitan area. Significantly, worldwide traffic indexes are covering more cities. This year’s Tom Tom Traffic Index added important cities like Jakarta, Hong Kong, Buenos Aires, Santiago de Chile, and Kuala Lumpur, bringing the total to 390. Today’s policy makers have far more information on which to evaluate transport investments than ever before.

    Table
    Summary of Traffic Congestion by Geography
    ALL DAY CONGESTION AVERAGE AM-PM CONGESTION  
    Country/Geography Over 5 Million 800,000-5 Million Under 800,000 All Over 5 Million 800,000-5 Million Under 800,000 All Count by Population Category
    ASIA                  
    China 39.7% 36.3%   38.5% 67.2% 66.6%   67.0% 15, 8, 0
    East Asia: Other 43.0% 38.8%   41.1% 75.5% 57.1%   67.3% 5, 4, 0
    Middle-East\   26.2%   26.2%   35.6%   35.6% 0, 5, 0
    EUROPE                  
    France 38.0% 30.3% 23.5% 24.9% 67.0% 57.0% 42.0% 44.8% 1, 3, 21
    Germany   28.3% 24.5% 25.6%   47.6% 39.9% 42.0% 0, 7, 18
    Italy 30.0% 32.7% 23.8% 25.1% 57.5% 56.5% 37.7% 40.8% 1, 3, 21
    Netherlands     19.5% 19.5%     37.2% 37.2% 0, 0, 16
    Spain 25.0% 27.0% 20.3% 21.0% 45.5% 41.5% 27.1% 29.0% 1, 2, 22
    United Kingdom 40.0% 30.2% 29.7% 30.2% 66.0% 55.7% 55.8% 56.2% 1, 6, 18
    Western Europe: Other   29.3% 24.2% 25.1%   52.8% 42.1% 44.1% 0, 9, 38
    Poland   27.0% 32.7% 31.8%   48.3% 53.0% 52.2% 0, 2, 10
    Turkey 49.0% 26.0%   28.3% 77.0% 34.0%   38.3% 1, 9, 0
    Eastern Europe: Other 42.5% 31.6% 21.1% 27.9% 80.0% 61.1% 43.9% 55.3% 2, 7, 8
    NORTH AMERICA                  
    Canada 30.0% 27.2% 21.3% 24.5% 56.0% 46.8% 38.1% 43.2% 1, 5, 6
    United States 28.6% 18.5% 15.0% 19.3% 52.7% 34.6% 24.2% 35.5% 9, 62, 9
    AUSTRALASIA                  
    Australia     24.2% 27.5%   50.7% 38.5% 44.6% 0, 5, 5
    New Zealand   38.0% 28.2% 29.8%   74.5% 47.9% 52.3% 0, 1, 5
    OTHER                  
    Latin America 44.6% 29.1%   35.6% 72.9% 51.1%   60.2% 5, 7, 0
    South Africa 30.0% 35.0% 23.8% 26.7% 61.0% 71.0% 44.9% 51.9% 1, 1, 4

    Wendell Cox is principal of Demographia, an international public policy and demographics firm. He is a Senior Fellow of the Center for Opportunity Urbanism (US), Senior Fellow for Housing Affordability and Municipal Policy for the Frontier Centre for Public Policy (Canada), and a member of the Board of Advisors of the Center for Demographics and Policy at Chapman University (California). He is co-author of the “Demographia International Housing Affordability Survey” and author of “Demographia World Urban Areas” and “War on the Dream: How Anti-Sprawl Policy Threatens the Quality of Life.” He was appointed to three terms on the Los Angeles County Transportation Commission, where he served with the leading city and county leadership as the only non-elected member. He served as a visiting professor at the Conservatoire National des Arts et Metiers, a national university in Paris.

    Photo: A Bangkok freeway, by author

  • Vancouverizing Seattle?

    A recent Wall Street Journal article (“For Chinese buyers, Seattle is the new Vancouver”) reported that Seattle was replacing Vancouver as the most popular destination for Chinese buyers in North America. For years, there has been considerable concern about foreign investment in the Vancouver housing market, especially Chinese investment. This   demand is widely believed to have driven Vancouver house prices “through the roof.” In response, the British Columbia government recently imposed a 15 percent foreign buyers tax that has had the impact of significantly reducing new foreign investment in Vancouver’s housing market.

    Yet the impact of the tax has still been muted. Houses remain just about as unaffordable as before. The Real Estate Board of Greater Vancouver benchmark price has dropped less than four percent from six months ago, before the foreign buyers tax was imposed. This compares to an 80 percent increase over the last 10 years and 47 percent increase over just the last three years (Figure).

    Clearly there is something other than Chinese investment driving up Vancouver house prices. Since 2004, Vancouver’s median multiple (median house price divided by median household income) has risen from 5.3 to 11.8. This means that that the median house has increased in price more than six times the annual median household income.

    The primary cause of Vancouver’s difficulties is a rigged housing market. For decades, Vancouver has had some of the strongest urban containment policy in the world. Regional land-use authorities have prohibited  housing development from being built on a large agricultural reserve. This land is hardly needed for such use in a nation that has increased its gross agricultural output more than 150 percent since 1961, while reducing its land in farms by three times as many acres as is occupied by all urban settlements combined, according to the 2016 Canadian census. Of course, urban containment restrictions on new housing have driven up house prices, just as Middle East oil supply reductions used to drive up gasoline prices, before the recent supply increases from Canadian and US oil production.

    Vancouver has literally become the third most unaffordable city (metropolitan area) in the nine nations covered by the Demographia International Housing Affordability Survey. This makes a mockery of the Vancouver’s frequent citation as one of the most livable cities in the world. The first principle of livability is affordability — you cannot live where you cannot afford. Most young families of normal economic means cannot hope to ever buy a modest detached house with a yard as their parents or grandparents did decades ago in the Vancouver area. Only Hong Kong and Sydney are less affordable.

    In a recent column (“Not much can or will be done to make Vancouver housing more affordable”) by Gordon Clark in The Province (Vancouver newspaper) describes how things have changed, in a story similar to what you will hear in Sydney, San Francisco and others of the world’s most unaffordable cities. In 1941, his postal supervisor grandfather purchased a house on Oak Street (a main central arterial leading toward downtown) for 1.5 years of income. In 1979 his teacher mother purchased a house in the city of Vancouver for 2.5 times her income. Now with houses costing nearly 12 times incomes, Clark regretfully concludes that nothing can be done: “because the solutions are unacceptable to most people.”

    This illustrates what is perhaps the most powerful characteristic of urban containment regulation — that it creates a strong lobby of support among those who have seen their house values irrationally escalate as a result of unwise government policy. In this environment, public officials simply wring their hands, decry the problem and implement nothing of substance to change the essentially flawed policies. 

    With this rigged market, it should not be surprising that people with money from outside Vancouver, and abroad, would seek to buy houses in Vancouver. After all, the policies all but guaranteed strong returns to anyone with enough capital to enter the market.   It is as if a “Speculators Welcome” banner has been hung from Lion’s Gate Bridge. Not so welcome are those middle-income households being driven out of the market

    Lessons for Seattle

    All of this is a cautionary tale for the Seattle metropolitan area, which also has urban containment policy, but of more recent vintage. Just 140 miles or 225 kilometers south of Vancouver, Seattle’s has housing affordability that already as bad as Vancouver’s  only 12 years ago.

    Seattle has a severely unaffordable median multiple of 5.5, slightly worse than Vancouver’s 5.3 in 2004. In the late 1980s, before Seattle imposed its metropolitan- urban containment policy, the median multiple was as low as 2.4 (Table). Today, a Seattle household with the median income must pay three additional years of income for the median priced house.

    Rising housing demand with severely constricted supply is associated with higher house prices compared to incomes. In this regard, Seattle has multiple risks, from households escaping California to escape from the even higher prices, Seattle is a bargain compared to the “dogs breakfast” of unaffordable housing associated with California where median multiples now exceed 8.0 in all of the major coastal metropolitan areas (Los Angeles, San Francisco, San Diego and San Jose). Prices are so high in California that a seller can buy a comparable house in Seattle for hundreds of thousands less. There may not be as much sun in Seattle, but there’s plenty of money left over for umbrellas and other goods and services.

    Now the pressure is likely to increase as foreign investors who shop the world for rigged housing markets promise quick profits now turn their attention to the Puget Sound. In this environment, it would not be surprising for additional serious house price escalation to be in the offing, and Seattle to indeed become the new Vancouver in the next decade or two.

    Given these forces, we can expect Seattle housing prices   will continue to increase disproportionately to incomes unless there is land use policy reform. Sufficient supply must be allowed on greenfield land to keep house prices from rising farther. And “building to the sky”— which is very expensive and not very family friendly —  is not likely to restore housing affordability in Seattle any more than it has anywhere else. For example, the Manhattanization of central Toronto, with its many new residential towers, has not prevented its median multiple from doubling from 3.9 to 7.7 in the last 12 years. Nor has it prevented a far less obvious (at least to the press) 80 percent share of population growth to be in the suburbs between 2011 and 2016.

    Lost in all of this are ordinary middle and working class people, who routinely take a back seat in public policy to planning obsessions over urban form, and a “sense of place.” Middle-income households are far more in need of a “decent place” to live at a reasonable price. Architectural marvels or sleek streetscapes are no substitute. The issue is not ideological, it is rather practical and human. Nor is it about property rights, or free markets. The issue is that people are being denied the housing they desire by urban containment policy and its distorted priorities. As Paul Cheshire, Max Nathan and Henry G. Overman of the London School of Economics have pointed out, “people rather than places” should be the focus of urban policy.

    It is ironic that progressive metropolitan areas, like Vancouver, where inclusionary zoning drip feeds housing to lower income households, have become, large exclusionary zones where average income households cannot afford houses. Seattle is headed down the same path.  Soon it may be time to hang a “Speculators Welcome” banner from the Space Needle.

    Photograph: Downtown Seattle (by author)            

    Wendell Cox is principal of Demographia, an international public policy and demographics firm. He is a Senior Fellow of the Center for Opportunity Urbanism (US), Senior Fellow for Housing Affordability and Municipal Policy for the Frontier Centre for Public Policy (Canada), and a member of the Board of Advisors of the Center for Demographics and Policy at Chapman University (California). He is co-author of the "Demographia International Housing Affordability Survey" and author of "Demographia World Urban Areas" and "War on the Dream: How Anti-Sprawl Policy Threatens the Quality of Life." He was appointed to three terms on the Los Angeles County Transportation Commission, where he served with the leading city and county leadership as the only non-elected member. He served as a visiting professor at the Conservatoire National des Arts et Metiers, a national university in Paris.

  • The 2016 Census of Canada: All About the Prairies

    Statistics Canada has just announced population counts from the 2016 census and the narrative is all about the Prairie Provinces. Alberta, Saskatchewan and Manitoba (yes, Manitoba) were the three fastest growing provinces. Metropolitan area growth was dominated by the Prairies, along with metropolitan areas outside the largest in Ontario and British Columbia.

    Provincial Results

    An analysis in the Globe and Mail indicates that Canada has been the fastest growing among the G7 nations. Since the last census (2011), Canada grew at a rate of 1.0 percent. This is above the 0.8 percent rate of the United States (which fell to 0.7 percent in 2015-2016). Canada’s growth rate was also well above that of the United Kingdom (0.7 percent) and five times the rate of the European Union (0.2 percent) and 10 times that of Germany (0.1 percent).

    Perhaps most astoundingly, British Columbia, which had shared growth leadership with Alberta since 1951 was pushed to fourth place in growth (5.6 percent).

    Leader Alberta grew 11.6 percent, while perennial slow growers Saskatchewan (6.3 percent) and Manitoba (5.8 percent), took the second and third positions. British Columbia grew only 5.6 percent, down from 7.0 percent between 2006 and 2011. The last time that Manitoba grew faster than British Columbia was in the 10 years before 1911, when Sir Wilfred Laurier was Prime Minister, William Howard Taft was President of the United States and eventual war leader H. H. Asquith was British Prime Minister.

    Usually strong growth Ontario, which accounts for nearly 40 percent of the national population, grew slower than Canada (5.0 percent), at 4.6 percent. This repeats the less than stellar performance of 2006 to 2011 and is the first time this has happened since World War II.

    Canada has three territories, all in the far north. Two grew rapidly, including Nunavut (12.7 percent) and Yukon (5.8 percent). Their populations, however, are very small, approximately 35,000 each. Nunavut covers a land area three times that of Texas, while Yukon is larger than California.

    Growth in Metropolitan Areas

    The same pattern can be seen in metropolitan areas (Table). Fastest growth among the 34 census metropolitan areas (CMA) was centered in the Prairie Provinces. Six of the fastest growing 10 metropolitan areas were in Alberta, Saskatchewan and Manitoba. Calgary grew the fastest, adding 14.6 percent to its population. Edmonton, Calgary’s neighbor to the north, and the capital of Alberta was the second fastest growing, at a 13.9 percent rate over the five years. These two metropolitan areas had seen some stalling of their prodigious growth due to oil industry reverses, however with petroleum prospects improving, could well see even greater growth in the years to come.

    More surprising has been the growth in the historically slow growing plains provinces just to the east. Saskatchewan’s two metropolitan areas were the next fastest growing. Saskatoon grew 12.5 percent. Regina, the provincial capital, grew 11.8 percent. These are strong growth rates for the Saskatchewan metropolitan areas, which until a decade ago had experienced a long period of slow growth.

    Lethbridge, Alberta’s third metropolitan area grew 10.8 percent, rounding out a top five in which all were from the Prairie Provinces.

    The next four positions were occupied by metropolitan areas near the largest (Toronto) and the third largest (Vancouver). Kelowna and Victoria, in British Columbia grew 8.4 percent and 6.7 percent respectively. In Ontario, Guelph and Oshawa grew 7.7 percent and 6.6 percent, respectively. This represented a shift in growth from the two larger metropolitan areas, which experienced an approximately one-third drop in their growth rates from the previous intercensal period (2006-2011), when they ranked in the top 10 in growth. Part of the reason for the greater growth in the metropolitan areas outside Vancouver and Toronto is their lower house prices. Vancouver’s housing affordability was the third worst out of 92 major metropolitan areas in the 2017 Demographia International Housing Affordability Survey, while Toronto was 14th worst.

    Winnipeg, the capital of Manitoba, was the 10th fastest growing, at 6.6 percent, and rounded out the six fast growing Prairie province metropolitan areas. Winnipeg’s growth over the last decade, like that of Saskatoon and Regina, is an important turnaround from its previous slower pace. Winnipeg grew faster than Toronto, Vancouver and Ottawa-Gatineau.

    The slowest growing metropolitan area was Saint John, New Brunswick lost 2.0 percent of its population. Six of the slowest growing (and losing) metropolitan areas were in Ontario. Brantford lost 1.0 percent of its population, while Thunder Bay had virtually no change. The other Ontario metropolitan areas in the bottom ten included Sudbury, Kingston, Peterborough and Windsor (just across the Detroit River from Detroit). Two Québec metropolitan areas were among the slowest growing, Saguenay and Trois-Rivières. Halifax, the capital of Nova Scotia was the 10th slowest growing, at 3.3 percent (Figure 2).

    As has been the case for the 45 years since it displaced Montréal, Toronto was Canada’s largest metropolitan area according to the 2016 Census, with a population of 5.9 million. Montréal held on to second place, with a population of 4.1 million. Vancouver was third, with a population nearing 2.5 million.

    Three metropolitan areas were bunched within a range of little more than 70,000. Calgary had a population of 1,393,000. The federal capital, Ottawa-Gatineau, which stretches across the Ottawa River, located on  the border between Quebec and Ontario, had a population of 1,324,000 and had led Calgary in 2011. Edmonton nearly duplicated the Ottawa-Gatineau number, at 1,321,000. Estimates in 2015 had placed Edmonton higher than Ottawa-Gatineau, but were not confirmed by the new Census numbers.

    The remaining four top ten gainers maintained their 2011 positions. Québec ranked 7th, followed by Winnipeg, Hamilton (in the greater Toronto area) and Kitchener-Waterloo, Canada’s Silicon Valley.

    Canada Metropolitan Areas: Population
    2011 to 2016 Census
    Rank Metropolitan Area 2011 2016 Change % % Rank
    1 Toronto   5,583,064   5,928,040   344,976 6.2% 12
    2 Montréal   3,934,078   4,098,927   164,849 4.2% 20
    3 Vancouver   2,313,328   2,463,431   150,103 6.5% 11
    4 Calgary   1,214,839   1,392,609   177,770 14.6% 1
    5 Ottawa – Gatineau   1,254,919   1,323,783     68,864 5.5% 15
    6 Edmonton   1,159,869   1,321,426   161,557 13.9% 2
    7 Québec      767,310      800,296     32,986 4.3% 19
    8 Winnipeg      730,018      778,489     48,471 6.6% 10
    9 Hamilton      721,053      747,545     26,492 3.7% 23
    10 Kitchener – Waterloo      496,383      523,894     27,511 5.5% 14
    11 London      474,786      494,069     19,283 4.1% 21
    12 St. Catharines – Niagara      392,184      406,074     13,890 3.5% 24
    13 Halifax      390,328      403,390     13,062 3.3% 25
    14 Oshawa      356,177      379,848     23,671 6.6% 9
    15 Victoria      344,580      367,770     23,190 6.7% 8
    16 Windsor      319,246      329,144       9,898 3.1% 26
    17 Saskatoon      262,215      295,095     32,880 12.5% 3
    18 Regina      211,519      236,481     24,962 11.8% 4
    19 Sherbrooke      202,261      212,105       9,844 4.9% 17
    20 St. John’s      196,954      205,955       9,001 4.6% 18
    21 Barrie      187,013      197,059     10,046 5.4% 16
    22 Kelowna      179,839      194,882     15,043 8.4% 6
    23 Abbotsford – Mission      170,191      180,518     10,327 6.1% 13
    24 Sudbury      163,067      164,689       1,622 1.0% 31
    25 Kingston      159,561      161,175       1,614 1.0% 30
    26 Saguenay      158,658      160,980       2,322 1.5% 29
    27 Trois-Rivières      151,773      156,042       4,269 2.8% 27
    28 Guelph      141,097      151,984     10,887 7.7% 7
    29 Moncton      139,287      144,810       5,523 4.0% 22
    30 Brantford      135,501      134,203     (1,298) -1.0% 33
    31 Saint John      129,057      126,202     (2,855) -2.2% 34
    32 Peterborough      118,975      121,721       2,746 2.3% 28
    33 Thunder Bay      121,596      121,621            25 0.0% 32
    34 Lethbridge      105,999      117,394     11,395 10.8% 5
    Source: Statistics Canada

    Photograph: Flag of Canada

    Wendell Cox is principal of Demographia, an international public policy and demographics firm. He is a Senior Fellow of the Center for Opportunity Urbanism (US), Senior Fellow for Housing Affordability and Municipal Policy for the Frontier Centre for Public Policy (Canada), and a member of the Board of Advisors of the Center for Demographics and Policy at Chapman University (California). He is co-author of the “Demographia International Housing Affordability Survey” and author of “Demographia World Urban Areas” and “War on the Dream: How Anti-Sprawl Policy Threatens the Quality of Life.” He was appointed to three terms on the Los Angeles County Transportation Commission, where he served with the leading city and county leadership as the only non-elected member. He served as a visiting professor at the Conservatoire National des Arts et Metiers, a national university in Paris.

  • Focusing on Mobility Not Travel Mode for Better Economic Growth

    The last article outlined research on job access by cars, transit and walking by the University of Minnesota Accessibility Observatory that assesses mobility by car, transit and walking in 49 of the nation’s largest metropolitan areas. Of course, it is to be expected that the metropolitan areas will have the largest number of jobs accessible to the average employee simply by virtue of their larger labor markets.

    Indeed, smaller, but important major labor markets, from Grand Rapids and Buffalo to Philadelphia and Washington seem unlikely to ever rival the job numbers in metropolitan areas like New York and Los Angeles.

    Researchers such as Remy Prud’homme and Chang-Woon Lee of the University of Paris, David Hartgen and M. Gregory Fields of the University of North Carolina, Charlotte have shown that a city (metropolitan area( is likely to experience better economic results if its transportation system provides better mobility. This includes greater job creation, greater economic growth and poverty reduction.

    Virtually any metropolitan area will do well to focus on maximizing mobility. This article describes the percentage of jobs in each of the 49 metropolitan areas that can be reached by the average employee in 30 minutes, a time slightly longer than the US one-way work trip average travel time of 26.4 minutes.

    Accessibility by Auto

    The leading metropolitan area in auto accessibility include is San Jose . Despite its reputation as an ultra-green area, 90 percent of San Jose commuters who do not work at home use cars to get to work. San Jose does warrant accolades for its 4.7 percent work at home share, the most environmentally friendly mode of work access. Transit has a 4.1 percent share. More than 100 percent of the metropolitan area’s jobs can be reached in 30 minutes, largely because the San Francisco metropolitan area is virtually across the street, providing additional employment opportunities.

    The balance of the top 10 is smaller, metropolitan areas, Salt Lake City, Kansas City, Raleigh and Hartford, where the average employee can reach jobs equaling more than 100 percent of the metropolitan total in 30 minutes. The second five include Las Vegas, Milwaukee, Buffalo, Denver and Oklahoma City. All but three of the 10 cities with best access has urban densities that are lower than the major metropolitan average.

    The least automobile accessibility is in larger metropolitan areas, where there is generally much greater traffic congestion. New York and Chicago have the lowest levels of 30 minute accessibility, followed by Atlanta, higher than would be expected, in large measure because of its sub-standard arterial street system, which in other cities provides effective alternatives to freeways (Figure 1).

    Transit

    Employees can reach the greatest share of metropolitan area jobs by transit in San Francisco (3.54 percent), Salt Lake City (2.60 percent), New York (2.48 percent), Milwaukee (2.30 percent) and San Jose (1.99 percent). The second five includes three cities with strong legacies of transit such as Boston, Portland and Washington, along with New Orleans and Hartford.

    The least transit access is in Orlando, Houston, Detroit, Dallas-Fort Worth, Atlanta and Riverside-San Bernardino, all below 0.50 percent (Figure 2).

    Walking

    Walking can get the average employee to the greatest share of metropolitan jobs in 30 minutes in San Francisco (1.23 percent), Salt Lake City (1.23 percent), New Orleans (1.16 percent), San Jose (1.07 percent) and Milwaukee (1.00 percent).

    Among the 10 cities with the least walking access, none reaches one-third of one-percent. These include one Northeastern city, Boston, St. Louis and Detroit in the Midwest and an expected array of western and southern cities, such as Los Angeles, Houston, Dallas-Fort Worth, Phoenix, Riverside-San Bernardino, Miami and ,in last place, Atlanta (Figure 3).

    The Automobile Access Advantage

    The data indicates that automobiles have far superior access to employment in every major metropolitan area. The cities that have the smallest automobile advantage are generally credited with having the best transit systems. But there is relatively little practical opportunity for commuting by transit to metropolitan jobs.   In the worst case, the average New York auto commuter can reach 13 times as many jobs as by transit in 30 minutes, 16 times in San Francisco, 21 times in Boston, 25 times in Chicago and Washington. In Seattle, Philadelphia, Pittsburgh, New Orleans and Portland the average employee can reach from 28 to 37 times as many jobs by car as by transit.

    The auto advantage is much greater in other cities. In Detroit the average commuter can reach 164 times as many jobs by car is by transit, 149 times as many in Orlando, 138 times and Riverside San Bernardino, 137 times in Dallas-Fort Worth and 125 times in Raleigh. Atlanta, Birmingham, Phoenix, Las Vegas and Cincinnati commuters can reach more than 100 times as many jobs by car in 30 minutes as by transit (Figure 4).

    Not surprisingly, the disparities are even greater between autos and walking. Walking does best compared to cars in San Francisco, where auto commuters can reach 46 times as many jobs by car as by walking. The least advantaged pedestrians are in Kansas City, where the average automobile commuter can reach 285 times as many jobs by car as by walking (Figure 5).

    New York in Context

    A colleague pointed out that the domination of transit statistics by New York would justify looking at how the nation’s largest metropolitan area compares to others. New York commuter access in 30 minutes of 2.48 percent of jobs by transit is about 1/5 higher than the 1.93 percent in the other five metropolitan areas with transit legacy core cities. New York’s commuters can reach nearly 2.5 times the percentage of metropolitan jobs accessible within 30 minutes as in the other 43 metropolitan areas (Figure 6). Transit is a lot more comprehensive in the New York metropolitan area, but cannot compete with automobile access by a long shot.

    Improving Mobility and the Economy

    For decades there has been an assumption that transit is an alternative to the automobile throughout the metropolitan area. The University of Minnesota Accessibility Observatory shows any such conception to be at best an exaggeration. Indeed, transit and walking provide only a small fraction of the access available by automobile. This is not likely to change at any practical level of public funding. As Professor Jean-Claude Ziv and I estimated that it could take all of an urban area’s gross domestic product each year just to provide the point to point access available by cars.

    There are places that transit is competitive with the automobile, notably the nation’s largest downtown areas (central business districts or CBDs), which are in the six transit legacy cities. However, travel times are far slower than the national average, due to higher levels of traffic congestion and greater reliance on transit, which tends to be slower than cars overall. For example, commuters to Manhattan—by far the nation’s largest CBD — have transit travel times of 52 minutes, while the travel time by car is 51 minutes, according to the American Community Survey. Either way, the average one-way travel time is about twice the national average. However, even in New York, there are far more jobs outside the CBD, traffic congestion is far less and the speedier access by car makes transit generally uncompetitive to these dispersed locations.

    In the past, it was not unreasonable to believe that transit could materially improve mobility in metropolitan areas. The new research undermines any such conception. Maximizing metropolitan mobility — minimizing work trip travel times — is an important strategy for jump-starting the economy, creating jobs and restoring economic growth to historic levels. Urban transportations strategies need to be selected based upon the outcome of superior access, without regard to mode.

    Photograph: Interstate 10, Houston by Socrate76 (Own work) [CC BY-SA 3.0 or GFDL], via Wikimedia Commons

    Wendell Cox is principal of Demographia, an international public policy and demographics firm. He is a Senior Fellow of the Center for Opportunity Urbanism (US), Senior Fellow for Housing Affordability and Municipal Policy for the Frontier Centre for Public Policy (Canada), and a member of the Board of Advisors of the Center for Demographics and Policy at Chapman University (California). He is co-author of the “Demographia International Housing Affordability Survey” and author of “Demographia World Urban Areas” and “War on the Dream: How Anti-Sprawl Policy Threatens the Quality of Life.” He was appointed to three terms on the Los Angeles County Transportation Commission, where he served with the leading city and county leadership as the only non-elected member. He served as a visiting professor at the Conservatoire National des Arts et Metiers, a national university in Paris.