Author: Wendell Cox

  • California’s Jobs Engine Broke Down Well Before the Financial Crisis

    Everybody knows that California’s economy has struggled mightily since the 2008 financial crisis and subsequent recession. The state’s current unemployment rate, 12.1 percent, is a full 3 percentage points above the national rate. Liberal pundits and politicians tend to blame this dismal performance entirely on the Great Recession; as Jerry Brown put it while campaigning (successfully) for governor last year, “I’ve seen recessions. They come, they go. California always comes back.”

    But a study commissioned by City Journal using the National Establishment Time Series database, which has tracked job creation and migration from 1992 through 2008 (so far) in a way that government statistics can’t, reveals the disturbing truth. California’s economy during the second half of that period—2000 through 2008—was far less vibrant and diverse than it had been during the first. Well before the crisis struck, then, the Golden State was setting itself up for a big fall.

    One of the starkest signs of California’s malaise during the first decade of the twenty-first century was its changing job dynamics. Even before the downturn, California had stopped attracting new business investment, whether from within the state or from without.

    Economists usually see business start-ups as the most important long-term source of job growth, and California has long had a reputation for nurturing new companies—most famously, in Silicon Valley. As Chart 1 shows, however, this dynamism utterly vanished in the 2000s. From 1992 to 2000, California saw a net gain of 776,500 jobs from start-ups and closures; that is, the state added that many more jobs from start-ups than it lost to closures. But during the first eight years of the new millennium, California had a net loss of 262,200 jobs from start-ups and closures. The difference between the two periods is an astounding 1 million net jobs.

    Between 2000 and 2008, California also suffered net job losses of 79,600 to the migration of businesses among states—worse than the net 73,800 jobs that it lost from 1992 through 2000. The leading destination was Texas, with Oregon and North Carolina running second and third (see Chart 2). California managed to add jobs only through the expansion of existing businesses, and even that was at a considerably lower rate than before.

    Graph by Alberto Mena

    Graph by Alberto Mena

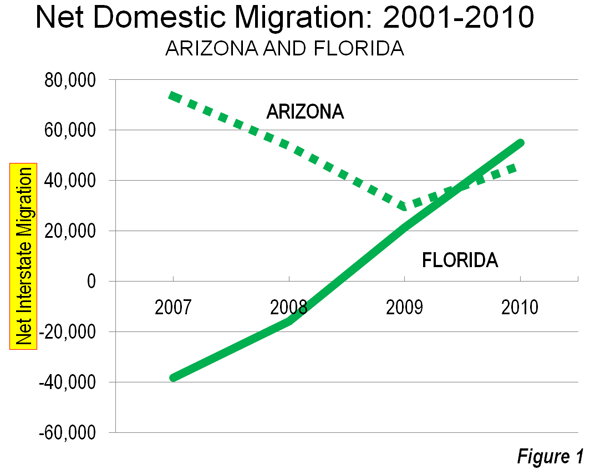
    Another dark sign, largely unnoticed at the time: California’s major cities became invalids in the 2000s. Los Angeles and the San Francisco Bay Area had been the engines of California’s economic growth for at least a century. Since World War II, the L.A. metropolitan area, which includes Orange County, has added more people than all but two states (apart from California): Florida and Texas. The Bay Area, which includes the San Francisco and the San Jose metro areas, has been the core of American job growth in information technology and financial services, with San Jose’s Silicon Valley serving as the world’s incubator of information-age technology. During the 1992–2000 period, the L.A. and San Francisco Bay areas added more than 1.1 million new jobs—about half the entire state total. But between 2000 and 2008, as Chart 3 indicates, California’s two big metro areas produced fewer than 70,000 new jobs—a nearly 95 percent drop and a mere 6 percent of job creation in the state. This was a collapse of historic proportions.

    Graph by Alberto Mena

    Not only did California in the 2000s suffer anemic job growth; the new jobs paid substantially less than before. Chart 4 reveals the sad reversal. From 2000 to 2008, California had a net job loss of more than 270,000 in industries with an average wage higher than the private-sector state average. That marked a turnaround of nearly 1.2 million net jobs from the 1992–2000 period, when 908,900 net jobs were created in above-average-wage industries. Further, during the earlier period, more than 707,000 net jobs were created in the very highest-wage industries—those paying over 150 percent of the private-sector average.

    Chart 5, which indicates job growth or decline in selected industries, again suggests that a lopsided amount of California’s economic growth in the 2000s was in below-average-wage fields. It included nearly 590,000 net jobs in “administration and support”—clerical and janitorial jobs, for example, as well as positions in temporary-help services, travel agencies, telemarketing and telephone call centers, and so on. The largest losses in the state during the 2000s were in manufacturing, which traditionally provided above-average wages. After adding a net 64,900 manufacturing jobs from 1992 to 2000, California hemorrhaged a net 403,800 from 2000 to 2008. But information jobs also went into negative territory, while professional, scientific, and technical-services employment experienced far lower growth than in the previous decade.

    The chart also shows that California’s growth in the 2000s, such as it was, took place disproportionately in sectors that rode the housing bubble. In fact, 35 percent of the net new jobs in the state were created in construction and real estate. All those jobs have vaporized since 2008, according to Bureau of Labor Statistics data. They are unlikely to come back any time soon.

    These are troubling numbers. Fewer jobs and lower wages do not a robust economy make. A continuation of this trend, even if California’s recession-battered condition improves, would result in a far more unequal economy, shrunken tax revenues, and a likely increase in state public assistance—all at a time when officials are struggling with massive deficits.

    Graph by Alberto Mena

    Graph by Alberto Mena

    A final indicator of California’s growing economic weakness during the 2000–2008 period is that the average size of firms headquartered in the state shrank dramatically. As Chart 6 shows, California had a huge increase over the 1992–2000 period in the number of jobs added by companies employing just a single person or between two and nine people, even as larger firms cut hundreds of thousands of jobs. Many of the single-employee companies may simply be struggling consultancies: if they were doing better, they’d likely have to start hiring at least a few people. While start-ups are indeed crucial to economic growth, small companies are especially vulnerable to economic downturns and often feel the brunt of taxes and regulations more acutely than larger firms do. The awful job numbers for the bigger companies—including a net loss of nearly 450,000 positions for firms with 500 or more employees—suggest the toxicity of California’s business climate. After all, bigger firms have the resources to settle and expand in other locales; in the 2000s, they clearly wanted nothing to do with the Golden State.

    Graph by Alberto Mena

    What is behind California’s shocking decline—its snuffed-out start-ups, unproductive big cities, poorer jobs, and tinier, weaker, or fleeing companies—during the 2000–2008 period? Steven Malanga’s “Cali to Business: Get Out!” identifies the major villains: suffocating regulations, inflated business taxes and fees, a lawsuit-friendly legal environment, and a political class uninterested in business concerns, if not downright hostile to them. One could add to this list the state’s extraordinarily high cost of living, with housing prices particularly onerous, having skyrocketed in the major metropolitan areas before the downturn—thanks, the research suggests, to overzealous land-use regulation.

    One thing is for sure: California will never regain its previous prosperity if it leaves these problems unaddressed. Its profound economic woes aren’t just the result of the Great Recession.

    This piece originally appeared in City Journal. City Journal thanks the Hertog/Simon Fund for Policy Analysis for its generous support of this issue’s California jobs package.

    Wendell Cox is a Visiting Professor, Conservatoire National des Arts et Metiers, Paris and the author of “War on the Dream: How Anti-Sprawl Policy Threatens the Quality of Life

    Photo by Altus via Flickr

  • Domestic Migration: Returning to Normalcy?

    Even as the troubled economy has continued to hobble along, there may be hints that the domestic migration patterns from before the Great Financial Crisis could be returning at least in some states. This is evident in the recent national interstate migration data from the American Community Survey. This analysis reviews annual interstate migration data from the beginning of the Great Financial Crisis to 2010, with broad comparisons to earlier (2001-2006) data from the Census Bureau population estimates program (Note 1). The big stories are that Florida and Arizona show signs of recovery, the trend has reverted to more negative in California and the steady states are North Carolina (a big gainer of domestic migrants) and Illinois (a big loser of domestic migrants).

    Moreover, none of the states that have been perennial domestic migration losers moved into the top ten between 2007 and 2010, even as fast growing states such as Florida and Arizona were hard hit by the real estate bubble and saw migration rates decline. Notably, however, Pennsylvania, which had sustained modest domestic migration losses, rose to the number 8 position in 2010 (Table 1).

    Table
    Top Domestic Migration States: 2001-2010
      Year and Source
      2001-6 2007-9 2010
    Rank Census Estimates ACS ACS
    1 Florida Texas Texas
    2 Arizona North Carolina North Carolina
    3 Texas Arizona Florida
    4 North Carolina South Carolina Arizona
    5 Georgia Georgia Colorado
    6 Nevada Oklahoma South Carolina
    7 South Carolina Washington Virginia
    8 Tennessee Colorado Pennsylvania
    9 Virginia Virginia Washington
    10 Washington Utah Kentucky


    The Largest Gaining States:Some of the states with the largest gains seem to be returning toward their previous domestic migration volumes.

    Florida: For the last few years, the big news in interstate domestic migration has been in Florida. This state, which has grown by more than 5.5 times since 1950, had been the domestic migration leader for some years. However, as one of the four "ground zero" states (along with California, Arizona and Nevada) for its huge house price losses, Florida bottomed out at a loss of 38,000 domestic migrants, falling to 44th in 2007. The state lost another 16,000 interstate migrants in 2008. These were the first domestic migration loss since the 1940s for Florida.

    However, in 2009, Florida returned to growth, adding 21,000 domestic migrants. An even stronger recovery occurred in 2010, with a net 55,000 domestic migrants. This remains well below the peak of 265,000 recorded in Census estimate figures in 2004 and 2005. Nonetheless, Florida ranked third in domestic migration in 2010, trailing North Carolina by only 1000 as well as number one Texas. Part of Florida’s success is likely related to its housing affordability, which has been restored in all of the state’s major metropolitan areas with the exception of Miami. The recent repeal of Florida’s land rationing "smart growth" law should position the state for even more affordable housing and net domestic migration gains.

    Arizona: Arizona is another state that was hit hard by the housing bubble. Much has been written on Arizona’s recent hard times. Yet, unlike Florida, Arizona did not experience domestic migration losses in any year of the past decade. The state has routinely been among the top five in domestic migration, even during the darkest years of the Great Financial Crisis. Like the nation in general, Arizona reached its lowest net domestic migration figure in 2009 at 29,000, but recovered to 46,000 in 2010. Interstate domestic migration remains somewhat below the early 2000s figures, but is trending upwards.

    Texas: Texas took the interstate domestic migration crown away from Florida in 2006 at has been the nation’s leader since that time. According to Census estimates, Texas peaked in 2006 at 233,000 net domestic migrants. This was an artificially high peak, location by the outflow of people from Louisiana who were driven out by Hurricanes Katrina and Rita and the failure of responsible governments to properly maintain flood control infrastructure. From 2007 to 2009, Texas was also aided by its liberal land use policies that helped it avoid the real estate bubble, retaining lower house prices that made it more attractive to domestic migrants. Texas added more than 125,000 domestic migrants annually. However in 2010, net domestic migration dropped to 75,000. Nonetheless, even Texas indicates a return toward normalcy. In the first five years of the decade, Census data placed net domestic migration in Texas at only 40,000, well short of the 2010 figure.

    North Carolina: Through good times and bad, North Carolina was has been a consistent performer among the larger gainers. North Carolina ranked fourth in net domestic migration from 2001 through 2006, according to Census data. Then the state moved up to number two in every year from 2007 to 2010.   In 2010 domestic migration was 56,000, slightly below the 2001 to 2006 Census reported average of approximately 63,000. Like Texas, North Carolina largely escaped the real estate bubble, with house prices rising far less severely than on the West Coast, the Northeast, Florida, Nevada and Arizona, which could be a principal reason for its consistent domestic migration gains.

    The Largest Losing States:There were also indications that people continue to be among the most significant exports of California and New York, which wrestled for the bottom position for the entire decade. While The New York Times characterized the 2008 to 2010 domestic outmigration from California and New York as having slowed to a "relative trickle," the ACS data indicates that the spigot is still on.

    New York:New York experienced a net loss of 94,000 domestic migrants in 2010, a figure nearly equal to the population of its state capital, Albany. Despite this large loss, New York is doing better than earlier in the decade, when domestic outmigration averaged more than 200,000 from 2001 to 2006.

    California: California, however, may have taken a turn to the south. After having experienced the largest losses in the nation in 2007 (175,000), net domestic outmigration fell to 87,000 in 2009 and California relinquished the bottom position to New York. However, in 2010, California’s net domestic outmigration rose to 129,000 and the state recovered its former bottom ranking.

    Illinois: Illinois has been the most consistent performer among the largest losing states. According to Census data, domestic migration losses averaged 77,000 from 2001 to 2006. ACS data indicates similar losses, averaging 73,000 from 2007 to 2010.

    Normalcy Again? It is premature to suggest any long-term judgments on these early data. However, it would not be surprising to see the states with the highest costs of living (driven by high housing costs) and the least friendly business climates to lose domestic migrants to states with lower costs of living and more friendly business environments. For example, the fact that median house prices today in Phoenix are more affordable compared to the large metropolitan areas of coastal California than they were at the peak of the housing bubble may be part of what drove Arizona’s improved net domestic migration in 2010.

    —-

    Note 1: The Census Bureau provides annual estimates of domestic migration, however does not do so in census years, such as 2010, which is why this analysis uses American Community Survey data. For the purposes of data compatibility, 2007, 2008, 2009 and 2010 data from the American Community Survey (also conducted by the Census Bureau) is the principal source for recent trends. This analysis is different from the one by Kenneth M. Johnson of the University of New Hampshire Carey Institute, which detailed domestic migration results from the three year American Community Survey (2008-2010), and which was covered by The New York Times.

    Note 2: Leith van Onselen has recently described developments in the Phoenix housing market (in How Phoenix Boomed and Busted) during the last decade.

    Wendell Cox is a Visiting Professor, Conservatoire National des Arts et Metiers, Paris and the author of “War on the Dream: How Anti-Sprawl Policy Threatens the Quality of Life

    Photograph: Cape Coral, Florida (by author)

  • If Wishes Were Iron Horses: Amtrak Gaining Airline Riders?

    Andy Kunz of the U.S. High Speed Rail Association commented to Fox Business News on the recently announced record ridership on Amtrak that, "At the very least, the increased demand offers another sign travelers are getting fed up with soaring airline fares and fight cancellations."  In the article, which read more like an Amtrak or high speed rail press release than a news story, reporter Jennifer Booton made what Gulliver, in The Economist, called "a fairly convincing argument that Americans are turning to trains as an alternative to driving and air travel." The Economist should have known better.

    Yes, Amtrak ridership is up and airline patronage has been up and down in recent years. But, trains as an alternative to air travel? In fact, Amtrak’s ridership is so small that distinguishing between the bottom of the graph below and the Amtrak ridership is difficult (see Figure). While Amtrak ridership rose five percent last year, the same number of new airline passengers would have constituted only 0.06 percent increase (or nearly 1/100th the impact on Amtrak). Amtrak’s ridership is so low that the monthly change (increase or decrease) in airline patronage has exceeded  total 2011 Amtrak ridership in 120 of the last 125 months.

    Booton and Gulliver may imagine business travelers abandoning frequent airline service to board trains slower than cars that run once daily. Or perhaps they imagine faux-high speed rail service that will still be too slow or too infrequent. Airline executives aren’t losing sleep over potential losses to trains.

  • More Americans Move to Detached Houses

    In defiance of the conventional wisdom in the national media and among most planning professionals, Americans continue not only to prefer, but to move into single family detached houses. Data from the 2010 American Community Survey indicates that such housing attracted 79.2% of the new households in the 51 major metropolitan areas (over 1,000,000 population) over the past decade.

    In contrast households in multi-unit buildings (apartments and condominiums) represented 11.8% of the new housing, while two-unit attached housing represented 11.3% of the increase. There was a 2.3% decline in the "other" category of new housing, which includes mobile homes and boats. A total of 4 million net new occupied detached houses were added in the largest metropolitan areas, while there were 590,000 additional apartments and condominiums and 570,000 attached houses (Figure 1).

    Detached Vacancy Rate Rises Less than Multi-Unit: Another conventional assumption is that single family homes have been disproportionately abandoned by their occupants, particularly since the collapse of the housing bubble. This is also not true. In 2010 detached housing enjoyed a 92.4% occupancy rate in 2010 which is higher than the 89.4% occupancy rate in attached housing and 84.2% occupancy rate in multi-unit buildings. Because a more of the multi-unit housing is rental, it is to be expected that the vacancies would be the highest in this category. However, at the national level, overall vacancy rates rose the most in multi-unit housing, with an increase of 61%, from 10.7% in 2000 to 17.1% in 2010. The vacancy rate in detached housing rose at a slower rate, from 7.3% in 2000 to 10.7% in 2010, an increase of 48%. Attached housing – such as townshouses – have the slowest rise in vacancy rate, from 8.4% in 2000 to 11.0% in 2010, an increase of 32% (Figure 2).

    Detached and Attached Up in Most Markets, Apartments and Condominiums Down in Most: The move to detached housing was pervasive at the major metropolitan area level. Among the 51 largest metropolitan areas, the share of detached housing rose in 44 and declined in seven. The share of attached housing rose in 32 of the metropolitan areas, while declining in 19. Multi-unit housing experienced an increase in its market share in only three markets, while declining in 48.

    Largest Metropolitan Areas: Detached housing also increased more than attached housing and multi-unit housing in each of the nation’s five largest metropolitan areas.

    • In the largest metropolitan area, New York, 51.9% of the new housing was detached. This is considerably more than the 36.9% detached market share in 2000. Multi-unit housing accounted for 24.1% of the increase in the market. This is a far smaller share than the 55.7% that multi-unit housing represented in 2000. Attached housing was 19.9% of the increase, nearly 3 times its 2000 share of 6.7%. This movement of New Yorkers to less dense housing forms is particularly significant, in view of the fact that New York has historically had the lowest share of lower density housing (detached and attached) and the highest share of multi-unit houses.
    • In the second largest metropolitan area, Los Angeles, 96.0% of the new housing was detached. This is nearly double the 49.7% that detached housing represented of the market in 2000. The balance of the new housing was split between a share of 18.6% for multi-unit housing and a loss of 11.8% in the attached housing. The share of new units represented by multi-unit houses was less one-half than its percentage of the market in 2000 (39.0%).
    • In the third largest metropolitan area, Chicago, 95.9% of the new housing was detached, well above the 52.5% share in 2000. There was a huge loss in apartment and condominium share, at 31% of the market, while attached housing captured 40.4% of the market.
    • In the fourth largest metropolitan area, Dallas Fort Worth, 84.3% of the new housing was detached, well above the 62.0% share in 2000. Multi-unit housing accounted for 13.5% of the increase, approximately one-half the 2000 market share. Attached housing represented 3.2% of the increase.
    • In the fifth largest metropolitan area, Philadelphia, 77.6% of new housing was detached, well above the 45.3% market share for detached housing in 2000. Apartments and condominiums accounted for 27.7% of the increase between 2000 and 2010, slightly more than the 2000 market share 23.7%. Attached housing represented a minus 4.3% of the new housing.

    Despite being only the fourth largest metropolitan area, Dallas-Fort Worth accounted for 46% of the new housing in the five largest metropolitan areas (Figure 3).

    The three largest metropolitan markets where there was an increase in multi-unit housing share were San Jose, New Orleans and Denver. In San Jose, 55.5% of new housing was multi-unit, while only 10.3 percent was detached. New Orleans had a similar 10.5% detached new housing share, while 65.8% of the new housing was multi unit. In Denver, 31.3% of the new housing was multi-unit, while 60.2% was detached.

    The share of detached housing also declined between 2000 and 2010 in Boston, Kansas City, Minneapolis-St. Paul and Portland. In each of these metropolitan areas, the share of attached housing increased, while the share of multi-unit housing decreased. Nonetheless, detached housing continued to attract a majority of new housing in Kansas City (70.8 percent) and Portland (56.6 percent). Despite Portland’s strong planning emphasis on high density housing, its share of multi-unit housing, and 26.8% between 2000 and 2010 was less than its 2000 market share of 27.5%, with a strong 20.6 percent share in attached housing. Attached housing also accounted for a comparatively large share of new housing in Boston (45.7 percent), Minneapolis-St. Paul (39.7 percent) and Kansas City (25.8 percent). The stronger densification policies that existed in Minneapolis-St. Paul until the middle of the decade may have artificially raised the share of attached new housing.

    Share by housing type data is provided for the major metropolitan areas in Tables 1 and 2.

    Table 1
    Occupied Housing by Major Metropolitan Area: 2000
    Metropolitan Area Detached Attached Multi-Unit Other
    Atlanta, GA 66.6% 3.5% 25.5% 4.4%
    Austin, TX 57.7% 3.7% 32.1% 6.6%
    Baltimore, MD 46.0% 28.5% 24.2% 1.3%
    Birmingham, AL 68.3% 2.6% 17.9% 11.2%
    Boston, MA-NH 48.9% 4.4% 45.4% 1.3%
    Buffalo, NY 60.0% 2.8% 35.1% 2.1%
    Charlotte, NC-SC 67.5% 3.4% 21.8% 7.3%
    Chicago, IL-IN-WI 52.5% 6.3% 40.1% 1.1%
    Cincinnati, OH-KY-IN 64.7% 3.6% 27.8% 3.9%
    Cleveland, OH 65.7% 5.5% 27.7% 1.2%
    Columbus, OH 62.8% 5.5% 29.1% 2.6%
    Dallas-Fort Worth, TX 62.0% 3.1% 30.3% 4.6%
    Denver, CO 60.9% 7.8% 29.0% 2.3%
    Detroit,  MI 70.5% 5.5% 20.7% 3.3%
    Hartford, CT 60.0% 5.2% 34.1% 0.8%
    Houston, TX 61.4% 3.6% 29.1% 6.0%
    Indianapolis. IN 68.4% 5.2% 23.2% 3.3%
    Jacksonville, FL 63.5% 3.9% 22.3% 10.3%
    Kansas City, MO-KS 71.3% 4.6% 21.4% 2.6%
    Las Vegas, NV 53.4% 6.0% 34.7% 5.9%
    Los Angeles, CA 49.7% 8.6% 39.6% 2.0%
    Louisville, KY-IN 70.7% 2.1% 22.2% 5.0%
    Memphis, TN-MS-AR 69.1% 3.8% 22.8% 4.2%
    Miami, FL 45.4% 9.9% 42.1% 2.6%
    Milwaukee,WI 55.7% 5.3% 38.3% 0.7%
    Minneapolis-St. Paul, MN-WI 62.8% 7.7% 27.4% 2.0%
    Nashville, TN 64.9% 4.4% 24.4% 6.2%
    New Orleans. LA 59.9% 7.7% 28.5% 3.9%
    New York, NY-NJ-PA 36.9% 6.5% 56.3% 0.4%
    Oklahoma City, OK 71.6% 3.1% 19.2% 6.0%
    Orlando, FL 61.5% 4.5% 25.1% 8.9%
    Philadelphia, PA-NJ-DE-MD 45.3% 29.8% 23.5% 1.4%
    Phoenix, AZ 61.6% 6.1% 24.9% 7.4%
    Pittsburgh, PA 68.8% 6.5% 20.4% 4.4%
    Portland, OR-WA 63.8% 3.3% 27.5% 5.5%
    Providence, RI-MA 54.3% 2.9% 41.6% 1.2%
    Raleigh, NC 63.6% 5.2% 21.5% 9.8%
    Richmond, VA 71.3% 4.9% 20.4% 3.4%
    Riverside-San Bernardino, CA 67.0% 5.1% 18.6% 9.3%
    Rochester, NY 65.7% 4.3% 26.5% 3.5%
    Sacramento, CA 66.1% 6.0% 24.0% 3.9%
    Salt Lake City, UT 67.0% 4.8% 25.4% 2.8%
    San Antonio, TX 67.4% 2.9% 22.2% 7.5%
    San Diego, CA 51.7% 9.4% 34.5% 4.4%
    San Francisco-Oakland, CA 50.3% 9.3% 39.1% 1.3%
    San Jose, CA 57.0% 9.1% 30.5% 3.4%
    Seattle, WA 60.2% 3.5% 31.6% 4.8%
    St. Louis,, MO-IL 70.2% 3.1% 21.9% 4.8%
    Tampa-St. Petersburg, FL 58.4% 4.6% 25.7% 11.4%
    Virginia Beach-Norfolk, VA-NC 61.4% 10.4% 25.2% 3.0%
    Washington, DC-VA-MD-WV 47.6% 19.4% 32.1% 0.8%
    Average (Weighted) 55.9% 7.5% 33.3% 3.3%
    Data from 2000 Census
    Metropolitan areas over 1,000,000 population as defined in 2010


    Table 2
    Occupied Housing by Major Metropolitan Area: 2010
    Metropolitan Area Detached Attached Multi-Unit Other
    Atlanta, GA 69.2% 5.3% 22.7% 2.7%
    Austin, TX 60.4% 2.6% 31.8% 5.1%
    Baltimore, MD 47.4% 27.3% 24.2% 1.1%
    Birmingham, AL 70.8% 2.4% 16.8% 10.0%
    Boston, MA-NH 48.7% 5.9% 44.2% 1.2%
    Buffalo, NY 62.3% 2.9% 33.0% 1.8%
    Charlotte, NC-SC 68.9% 5.1% 20.4% 5.6%
    Chicago, IL-IN-WI 54.2% 7.6% 37.1% 1.1%
    Cincinnati, OH-KY-IN 68.9% 4.8% 23.2% 3.1%
    Cleveland, OH 68.7% 5.1% 25.1% 1.1%
    Columbus, OH 64.1% 7.3% 26.6% 2.1%
    Dallas-Fort Worth, TX 65.9% 3.1% 27.4% 3.6%
    Denver, CO 60.8% 7.9% 29.4% 1.9%
    Detroit,  MI 71.6% 6.3% 19.1% 2.9%
    Hartford, CT 60.9% 5.3% 33.1% 0.7%
    Houston, TX 65.1% 3.5% 26.0% 5.3%
    Indianapolis. IN 71.3% 5.0% 21.1% 2.6%
    Jacksonville, FL 66.3% 4.8% 21.3% 7.6%
    Kansas City, MO-KS 71.3% 6.4% 20.1% 2.2%
    Las Vegas, NV 60.9% 5.4% 29.9% 3.8%
    Los Angeles, CA 51.0% 8.0% 39.0% 1.9%
    Louisville, KY-IN 71.6% 3.6% 20.9% 4.0%
    Memphis, TN-MS-AR 72.5% 3.3% 20.4% 3.7%
    Miami, FL 47.0% 10.8% 40.0% 2.1%
    Milwaukee,WI 56.2% 6.5% 36.5% 0.8%
    Minneapolis-St. Paul, MN-WI 61.5% 11.0% 25.9% 1.6%
    Nashville, TN 67.2% 5.6% 22.3% 4.9%
    New Orleans. LA 65.1% 6.1% 24.6% 4.2%
    New York, NY-NJ-PA 37.2% 6.7% 55.7% 0.4%
    Oklahoma City, OK 74.3% 3.0% 17.1% 5.6%
    Orlando, FL 64.1% 5.5% 23.4% 6.9%
    Philadelphia, PA-NJ-DE-MD 46.6% 28.5% 23.7% 1.3%
    Phoenix, AZ 67.2% 4.8% 22.2% 5.8%
    Pittsburgh, PA 69.4% 7.5% 19.1% 4.0%
    Portland, OR-WA 62.8% 5.5% 27.4% 4.3%
    Providence, RI-MA 55.7% 3.7% 39.6% 1.0%
    Raleigh, NC 65.4% 8.0% 20.5% 6.2%
    Richmond, VA 73.2% 4.9% 19.0% 3.0%
    Riverside-San Bernardino, CA 70.7% 4.3% 17.1% 7.9%
    Rochester, NY 66.9% 4.8% 25.3% 2.9%
    Sacramento, CA 68.8% 5.6% 22.6% 3.0%
    Salt Lake City, UT 67.8% 6.1% 23.9% 2.2%
    San Antonio, TX 70.8% 2.2% 21.1% 5.9%
    San Diego, CA 53.0% 9.0% 34.5% 3.5%
    San Francisco-Oakland, CA 50.7% 9.4% 38.8% 1.1%
    San Jose, CA 54.3% 10.7% 32.0% 3.0%
    Seattle, WA 60.5% 4.2% 31.5% 3.8%
    St. Louis,, MO-IL 70.8% 4.2% 21.1% 3.9%
    Tampa-St. Petersburg, FL 59.6% 5.6% 24.7% 10.1%
    Virginia Beach-Norfolk, VA-NC 62.5% 11.1% 24.0% 2.5%
    Washington, DC-VA-MD-WV 48.1% 19.6% 31.7% 0.7%
    Average (Weighted) 57.8% 7.9% 31.5% 2.8%
    Data from 2010 American Community Survey
    Metropolitan areas over 1,000,000 population as defined in 2010


    In Housing, Preference Trumps Policy: The trend of the last decade is evidence of a continued preference of American households for detached housing. The results are remarkable for at least two reasons:

    • The first is that there have been unprecedented policy initiatives to discourage, if not to prohibit the building of new detached houses. It seems likely that the miniscule new detached housing share in San Jose, for example, is a direct result of that metropolitan area’s virtual prohibition of new detached housing, rather than any evidence that households have begun to prefer higher density housing. A small detached housing share in the face of a strong public policy bias toward higher density housing says nothing about preferences.
    • Second; the media and wishful advocates of denser settlement patterns have continuously referred to detached housing as having been severely overbuilt during the housing bubble, while suggesting an imperative for households to move into multiunit, often rented housing. The new data, with the larger increase in multi-unit vacancy rates, indicates that there was at least as much overbuilding in more dense housing types as there was in detached housing.

    Despite the expressed preferences of planners, academics and even many builders, American households continue to make their own decisions about housing.

    Wendell Cox is a Visiting Professor, Conservatoire National des Arts et Metiers, Paris and the author of “War on the Dream: How Anti-Sprawl Policy Threatens the Quality of Life

    Lead photo: Houses in Los Angeles. Photograph by author.

  • Major Metropolitan Commuting Trends: 2000-2010

    As we indicated in the last article, solo automobile commuting reached an all time record in the United States in 2010, increasing by 7.8 million commuters. At the same time, huge losses were sustained by carpooling, while the largest gain was in working at home, which includes telecommuting. Transit and bicycling also added commuters.  This continues many of the basic trends toward more personalized employment access that we have seen since 1960.

    Solo Automobile Commuting: Among the nation’s 51 metropolitan areas with more than 1 million population, 38 experienced increases in solo automobile commuting between 2000 and 2010. More than 80% of commuting is by solo automobile in 25 of the 51 largest metropolitan areas, with the highest rates being in Birmingham, Detroit, Cincinnati, Indianapolis and Kansas City. Another 28 metropolitan areas have single automobile commute shares of between 70% and 80%, with Boston, Washington and San Francisco between 60% and 70%. As would be expected, the lowest solo automobile commute share was in New York at 51%.

    Car Pools: The national data also showed a nearly 2.4 million loss in carpool use. The losses were pervasive, occurring in all 51 metropolitan areas. Riverside-San Bernardino had the highest carpool market share at just under 15%, while all other major metropolitan areas were below 12%. Car pools have been losing market share for decades.

    Work at Home (Includes Telecommuting): In what we have previously labeled as The Decade of the Telecommute, the nation experienced a 1.7 million increase in working at home over the past decade. The market share gains in working at home were as pervasive as the losses in carpooling, with all 51 metropolitan areas registering increases. Austin had the strongest work-at-home market share, at 7.3%, followed by Portland at 6.5%, San Francisco and Denver at 6.2%, Phoenix at 6.0%, with San Diego, Raleigh and Atlanta above 5.5%. Overall, working at home exceeded transit commuting in 37 major metropolitan areas out of 51 in 2010, up from 27 in 2000. Three metropolitan areas had work at home market shares of less than 3%, including Memphis, New Orleans and last place Buffalo.

    Transit: As noted before, transit enjoyed its first 10 year gain since journey to work data was first collected by the Census Bureau 50 years ago. Overall, transit added 900,000 daily commuters, roughly half that for telecommuters. Transit’s market share increased in 25 of the top 51 metropolitan areas. It is also notable that in a number of the metropolitan areas with the largest expenditures for new rail systems, there were either losses or commuting gains were concentrated in the more flexible bus services.

    New York: As so often has been the case, transit was largely a "New York story." More than one half of the new transit commuters were in the New York metropolitan area, more than 450,000 of the 900,000 increase. New York boasts by far the most extensive transit system in the nation, which serves the second largest central business district in the world and by far the nation’s most important. In 2000, New York had a transit work trip market share of 27.4%. By 2010, New York’s transit work trip market share had risen to 30.7%, more than double that of any other metropolitan area. More than 70% of the new transit commuters in the New York area were on its subway (Metro), suburban rail and light rail systems.

    San Francisco: San Francisco retained its position as the second strongest transit metropolitan area, with a 14.6% work trip market share in 2010. This is up from 13.8% in 2000.

    Washington: Washington was the third strongest transit commuting market, with a 14.0% work trip market share in 2010. This modest increase from 13.4% nonetheless produced the second largest ridership increase in the nation, at more than 130,000. This reflects the strength of Washington’s job market over the decade. Rail ridership accounted for 53% of this increase, while buses accounted for the other 47%.

    Boston and Chicago: Boston passed Chicago to become the fourth strongest transit market, at 11.8% in 2010. This is an increase from 11.2% in 2000. Chicago ranked fifth at 11.2%, a small reduction from the 11.3% in 2000.

    Los Angeles: Los Angeles had the third largest increase in transit commuting, adding 60,000 daily transit commuters. Approximately 75% of these new commuters were attracted by the region’s extensive bus system as opposed to its very expensive but limited rail system. This increase placed Los Angeles in a virtual tie with Portland, with a work trip market share of 6.2%.

    Portland: Portland continued to experience its now 30 year transit market share erosion, despite having added three new light rail lines between 2000 and 2010. Portland’s transit work trip market share fell to 6.2% from 6.3% and now trails the work at home and telecommute market share of 6.5%.

    Seattle:Seattle added 29,000 new transit commuters for the fourth strongest growth in the nation. Approximately 75% of the new commuters were on the metropolitan area’s bus system.

    Atlanta: Atlanta, which is home to the third largest postwar Metro system in the nation (MARTA) gained nearly 9000 new transit commuters, all of them on the bus, while losing more than 3000 rail commuters.

    Miami:Miami added 16,000 new transit commuters, though more than 90% were attracted to the bus system, rather than the rail services.

    Rail and Bus in Texas: Other metropolitan areas with new and expanded rail systems did not fare as well. In Dallas-Fort Worth, the light rail system was more than doubled in length, yet there was a reduction of more than 3000 daily transit commuters. The transit work trip market share in Dallas-Fort Worth dropped from 1.8% to 1.4%, approximately one quarter lower than that of any other major metropolitan area with a new light rail or Metro system. Houston, which built its first light rail line during the period, lost nearly 3000 daily transit commuters, with its transit work trip market share dropping by nearly one-third, from 3.2% to 2.3%. By contrast, the third largest metropolitan area in Texas, San Antonio, lost no commuters from its bus only transit system.

    Other New Rail Metropolitan Areas: Other metropolitan areas with new rail systems experienced modest ridership increases, with 60 to 70 percent of the increase on the bus systems in Charlotte, Minneapolis-St. Paul and Phoenix. Salt Lake City experienced a small decline in transit commuting.

    Below 1 Percent: Four metropolitan areas had transit work trip market shares of less than 1%, including Indianapolis, Raleigh, Birmingham and last place Oklahoma City, with a market share of 0.4%.

    Bicycles: It was also a good decade for bicycle commuting, with the national increase of nearly 250,000. The bicycle commuting market share rose in 45 of the 51 largest metropolitan areas. Portland had the highest bicycle market share at 2.2%, with three other metropolitan areas at 1.5% or above, Sacramento, San Francisco and San Jose. The lowest bicycle commuting market shares were in San Antonio, Cincinnati, Birmingham and Memphis, all at 0.1 percent.

    Walking: There was little change in walking among the nations major metropolitan areas. The largest shares were in New York (5.9%) and Boston (5.4%), with the smallest shares in Raleigh (1.1%), Orlando (1.1%) and Birmingham (1.0%).

    Drifting Away from Shared Commuting: In some ways, the 2000s were different than previous decades, especially with the reversals in bicycle commuting and transit. However, overall, shared ride commuting (transit and car pools) lost share due to the precipitous decline in car pooling. Longer term share increase trends also continued in single-occupant automobile commuting and working at home. The bottom line: personal employment access (personal mobility plus working at home) continues to carve away at the smallish share still held by shared commuting.

    ————-

    Data: The 2000 and 2010 commuting market shares by mode are shown in Tables 1 and 2 (2010 metropolitan area boundaries).

    ————

    Table 1
    Work Trip Market Share: 2000
    Metropolitan Areas Over 1,000,000 Population in 2010
    Metropolitan Area Car, Truck or Van: Alone Car/Van Pool Transit Bicycle Walk Other Work at Home (Includes Telecommute)
    Atlanta 77.0% 13.7% 3.4% 0.1% 1.3% 1.1% 3.5%
    Austin 76.5% 13.7% 2.5% 0.6% 2.1% 1.1% 3.6%
    Baltimore 75.5% 11.5% 5.9% 0.2% 2.9% 0.9% 3.2%
    Birmingham 83.3% 12.0% 0.7% 0.1% 1.2% 0.7% 2.1%
    Boston 71.1% 8.6% 11.2% 0.5% 4.6% 0.8% 3.3%
    Buffalo 81.7% 9.4% 3.3% 0.2% 2.7% 0.5% 2.1%
    Charlotte 80.7% 12.8% 1.4% 0.1% 1.2% 0.8% 2.9%
    Chicago 70.4% 11.0% 11.3% 0.3% 3.1% 1.0% 2.9%
    Cincinnati 81.3% 10.1% 2.8% 0.1% 2.3% 0.6% 2.7%
    Cleveland 81.3% 8.8% 4.1% 0.2% 2.2% 0.6% 2.7%
    Columbus 82.1% 9.7% 2.1% 0.2% 2.3% 0.6% 3.0%
    Dallas-Fort Worth 78.7% 13.9% 1.8% 0.1% 1.5% 1.0% 3.0%
    Denver 76.0% 11.7% 4.4% 0.4% 2.1% 0.8% 4.6%
    Detroit 84.7% 9.2% 1.7% 0.1% 1.4% 0.6% 2.2%
    Hartford 82.6% 8.7% 2.8% 0.2% 2.5% 0.6% 2.6%
    Houston 77.0% 14.3% 3.2% 0.3% 1.6% 1.1% 2.5%
    Indianapolis 82.8% 10.4% 1.3% 0.2% 1.7% 0.7% 3.0%
    Jacksonville 80.3% 12.6% 1.3% 0.5% 1.7% 1.4% 2.3%
    Kansas City 82.6% 10.6% 1.2% 0.1% 1.4% 0.7% 3.5%
    Las Vegas 74.6% 14.7% 4.4% 0.5% 2.3% 1.3% 2.3%
    Los Angeles 71.9% 14.6% 5.6% 0.7% 2.7% 1.0% 3.5%
    Louisville 81.8% 11.2% 2.0% 0.2% 1.7% 0.7% 2.5%
    Memphis 80.7% 13.3% 1.6% 0.1% 1.3% 0.9% 2.2%
    Miami-West Palm Beach 77.3% 13.1% 3.2% 0.5% 1.7% 1.2% 3.1%
    Milwaukee 79.7% 9.9% 4.2% 0.2% 2.9% 0.6% 2.6%
    Minneapolis-St. Paul 78.3% 10.0% 4.4% 0.4% 2.4% 0.6% 3.8%
    Nashville 80.5% 13.1% 0.8% 0.1% 1.5% 0.8% 3.2%
    New Orleans 72.9% 14.6% 5.4% 0.6% 2.7% 1.3% 2.4%
    New York 52.7% 9.3% 27.4% 0.3% 6.0% 1.5% 2.9%
    Oklahoma City 81.6% 12.1% 0.5% 0.2% 1.7% 1.0% 2.9%
    Orlando 80.6% 12.1% 1.6% 0.4% 1.3% 1.1% 2.9%
    Philadelphia 73.1% 10.2% 8.9% 0.3% 3.9% 0.7% 2.9%
    Phoenix 74.6% 15.3% 1.9% 0.9% 2.1% 1.4% 3.7%
    Pittsburgh 77.5% 9.8% 5.9% 0.1% 3.6% 0.6% 2.5%
    Portland 73.1% 11.5% 6.3% 0.8% 2.9% 0.8% 4.6%
    Providence 80.7% 10.5% 2.4% 0.2% 3.3% 0.8% 2.2%
    Raleigh 80.8% 12.1% 0.9% 0.2% 1.6% 1.0% 3.5%
    Richmond 81.7% 10.9% 1.9% 0.2% 1.8% 0.8% 2.7%
    Riverside-San Bernardino 73.5% 17.6% 1.6% 0.5% 2.2% 1.2% 3.5%
    Rochester 81.7% 9.1% 2.0% 0.2% 3.5% 0.6% 2.9%
    Sacramento 75.3% 13.5% 2.7% 1.4% 2.2% 0.9% 4.0%
    Salt Lake City 76.0% 13.4% 3.3% 0.5% 2.1% 0.7% 4.0%
    San Antonio 76.2% 14.9% 2.7% 0.1% 2.4% 1.2% 2.6%
    San Diego 73.9% 13.0% 3.3% 0.6% 3.4% 1.4% 4.4%
    San Francisco-Oakland 62.8% 12.7% 13.8% 1.1% 3.9% 1.3% 4.3%
    San Jose 77.2% 12.4% 3.4% 1.2% 1.8% 0.9% 3.1%
    Seattle 71.6% 12.7% 7.0% 0.6% 3.1% 0.8% 4.2%
    St. Louis 82.5% 10.0% 2.2% 0.1% 1.7% 0.6% 2.9%
    Tampa-St. Petersburg 79.7% 12.4% 1.3% 0.6% 1.7% 1.2% 3.1%
    Virginia Beach-Norfolk 78.8% 12.1% 1.7% 0.3% 2.7% 1.6% 2.7%
    Washington 67.5% 13.4% 11.2% 0.3% 3.0% 0.9% 3.7%
    Top 51 Metropolitan Areas 73.2% 11.8% 7.5% 0.4% 2.9% 1.0% 3.2%
    Calculated from Census Bureau data
    Metropolitan areas as defined in 2010
    Table 2
    Work Trip Market Share: 2010
    Metropolitan Areas Over 1,000,000 Population in 2010
    Car, Truck or Van: Alone Car/Van Pool Transit Bicycle Walk Other Work at Home (Includes Telecommute)
    Atlanta 77.6% 10.3% 3.4% 0.2% 1.3% 1.5% 5.8%
    Austin 75.6% 10.5% 2.3% 0.6% 1.9% 1.8% 7.3%
    Baltimore 76.5% 9.6% 6.0% 0.2% 2.6% 1.0% 4.1%
    Birmingham 84.8% 10.0% 0.6% 0.1% 1.0% 0.5% 3.1%
    Boston 69.5% 7.5% 11.8% 0.7% 5.4% 0.8% 4.4%
    Buffalo 82.0% 7.5% 3.8% 0.3% 3.0% 1.1% 2.3%
    Charlotte 80.6% 10.0% 2.0% 0.2% 1.5% 0.6% 5.1%
    Chicago 71.0% 8.5% 11.2% 0.6% 3.1% 1.0% 4.5%
    Cincinnati 84.1% 7.9% 2.1% 0.1% 2.0% 0.4% 3.4%
    Cleveland 82.3% 7.2% 3.6% 0.3% 2.2% 0.7% 3.7%
    Columbus 82.4% 8.0% 1.7% 0.5% 2.3% 0.6% 4.6%
    Dallas-Fort Worth 81.3% 10.1% 1.4% 0.2% 1.2% 1.4% 4.6%
    Denver 76.3% 9.6% 4.1% 0.8% 1.9% 1.1% 6.2%
    Detroit 84.6% 8.5% 1.5% 0.2% 1.4% 0.8% 3.0%
    Hartford 81.5% 7.9% 3.1% 0.3% 3.0% 1.0% 3.2%
    Houston 79.4% 11.5% 2.3% 0.3% 1.4% 1.7% 3.4%
    Indianapolis 83.9% 8.2% 0.9% 0.3% 1.5% 0.8% 4.3%
    Jacksonville 82.5% 8.9% 1.0% 0.5% 1.4% 1.2% 4.5%
    Kansas City 83.7% 8.5% 1.2% 0.2% 1.4% 0.9% 4.1%
    Las Vegas 78.9% 10.5% 3.8% 0.6% 1.6% 1.3% 3.3%
    Los Angeles 73.5% 10.7% 6.2% 0.9% 2.6% 1.2% 5.0%
    Louisville 83.5% 9.2% 1.9% 0.2% 1.3% 0.9% 3.1%
    Memphis 83.6% 10.3% 1.0% 0.1% 1.5% 0.9% 2.7%
    Miami-West Palm Beach 78.8% 9.4% 3.5% 0.6% 2.0% 1.4% 4.4%
    Milwaukee 80.1% 9.3% 3.4% 0.5% 2.6% 0.7% 3.4%
    Minneapolis-St. Paul 78.3% 7.9% 4.8% 0.7% 2.4% 0.9% 4.9%
    Nashville 81.3% 10.7% 1.0% 0.2% 1.2% 1.0% 4.6%
    New Orleans 78.1% 11.0% 3.2% 0.7% 2.6% 1.9% 2.5%
    New York 50.5% 6.8% 30.7% 0.5% 5.9% 1.6% 3.9%
    Oklahoma City 82.7% 10.6% 0.5% 0.3% 1.6% 1.0% 3.4%
    Orlando 82.1% 9.2% 1.6% 0.3% 1.1% 1.4% 4.4%
    Philadelphia 73.9% 8.0% 9.6% 0.5% 3.5% 0.8% 3.8%
    Phoenix 76.7% 11.8% 2.0% 0.6% 1.5% 1.5% 6.0%
    Pittsburgh 77.0% 8.9% 5.6% 0.3% 3.7% 0.9% 3.5%
    Portland 72.1% 8.8% 6.2% 2.2% 3.3% 0.9% 6.5%
    Providence 81.3% 8.3% 2.6% 0.5% 3.2% 0.9% 3.2%
    Raleigh 82.0% 8.7% 0.9% 0.3% 1.1% 1.1% 5.9%
    Richmond 81.2% 10.1% 1.8% 0.4% 1.2% 0.7% 4.6%
    Riverside-San Bernardino 76.1% 14.8% 1.7% 0.4% 1.8% 1.4% 3.8%
    Rochester 82.6% 7.1% 1.8% 0.4% 3.9% 0.7% 3.6%
    Sacramento 75.6% 11.2% 2.9% 1.7% 1.9% 1.1% 5.5%
    Salt Lake City 77.7% 11.3% 2.9% 0.8% 2.3% 1.0% 4.0%
    San Antonio 79.5% 11.5% 2.1% 0.1% 2.0% 1.4% 3.3%
    San Diego 76.2% 10.1% 3.3% 0.8% 2.8% 1.0% 5.9%
    San Francisco-Oakland 61.5% 10.6% 14.6% 1.7% 4.2% 1.2% 6.2%
    San Jose 77.5% 10.3% 2.9% 1.6% 1.8% 0.9% 5.1%
    Seattle 70.5% 10.2% 8.2% 1.1% 3.5% 1.0% 5.5%
    St. Louis 83.0% 7.7% 2.6% 0.2% 1.9% 0.8% 3.7%
    Tampa-St. Petersburg 80.3% 9.5% 1.6% 0.8% 1.4% 1.4% 5.0%
    Virginia Beach-Norfolk 80.9% 9.4% 1.8% 0.5% 3.3% 0.9% 3.1%
    Washington 65.6% 10.6% 14.0% 0.5% 3.5% 1.0% 4.9%
    Top 51 Metropolitan Areas 73.7% 9.4% 7.9% 0.6% 2.8% 1.2% 4.4%
    Calculated from Census Bureau data
    Metropolitan areas as defined in 2010

    Wendell Cox is a Visiting Professor, Conservatoire National des Arts et Metiers, Paris and the author of “War on the Dream: How Anti-Sprawl Policy Threatens the Quality of Life

    Photo: Manhattan (New York), with the Woolworth Building in the distance (by author)

  • Development Plans for Old Hong Kong Airport Announced

    The government of the Hong Kong Special Administrative Region has outlined plans to create a "second central business district" at Kai Tak in eastern Kowloon, site of the now former international airport. Kai Tak airport was abandoned in 1998 when the new Hong Kong International Airport at Chep Lap Tok opened.

    Kai Tak is in the middle of the most dense urban development in the high income world. The government intends that the development will have 43 million square feet of office space (4 million square meters) and will cost HK$100 Billion (approximately $13 billion).

    The development would be served by a monorail, which would connect with MTR (metro) lines at Kwun Tong and to a proposed central link MTR line to the new town of Sha Tin.

    Photo: Kai Tak Airport and East Kowloon (by author)

  • Placing Amtrak Records in Context

    The state of Michigan recently announced record ridership on three routes supported by Michigan taxpayers. Records mean little when the numbers are insignificant.

    That, to say the least, is the situation with Amtrak in Michigan. For example, the additional passengers (this year versus last) on the Pere Marquette (between Chicago and Grand Rapids) was small enough to be carried in a once daily round trip by an airport shuttle van. The additional passengers on the Wolverine, which operates from Detroit to Chicago would not have filled a single intercity bus operating each way on a daily basis. The same is true of the Blue Water, which operates between Port Huron and Chicago.

    But there’s more. High quality bus service, featuring on-board high speed wireless internet (wi-fi), costs passengers less between Detroit and Chicago and takes about the same time. There is a big difference, however. Train riders are subsidized by taxpayers, while bus riders pay their full fare. Even so, the unsubsidized bus fares are lower than the subsidized train fares.

    In a nation that needs to cut spending, unnecessary transportation subsidies, such as for intercity rail services should be at the top of the list.

  • OECD Cites Shorter US Work Trip Travel Times

    Catherine Rampell of The New York Times describes a new Organization for Economic Cooperation and Development report concluding that Americans have among the shortest work trip travel times in the developed world (Link to chart in The New York Times).

    Out of 23 OECD nations, only three have shorter one way work trip travel times than in the United States. These are Sweden, Denmark and Ireland. These are nations without the larger metropolitan regions that characterize the United States and some other nations. For example, the largest metropolitan area in these three nations, Stockholm, with barely rate among the top 30 in the United States.

    The OECD report confirms similar earlier data, such as from Eurostat on the relative ease of commuting in the United States.

    The US average of 28 minutes to and from work was 10 minutes less than the OECD average and 9 minutes less than Canada. South Korea, with the highest urban densities in the high income world, had an average one-way commute time approximately double that of the United States.

    Among the nations in the survey, the United States has the lowest urban population densities. This reality is at odds with the contentions of some analysts who have associated longer travel times and greater traffic congestion with lower urban population densities.

    But shorter commute times are about more than density. This is illustrated by comparing the Los Angeles and Toronto urban areas. The two urban areas have almost identical population densities, at 7068 and 7040 persons per square mile respectively (2,729 and 2,718 per square kilometer). The density of the core areas is similar with proportions of land areas at above 10,000 persons per square mile (4,000 per square kilometer). The most important differences are that in Los Angeles, the transit commuting share is one third that of Toronto, and automobile commuting is more prevalent. Employment in Los Angeles is much more dispersed, with less than 5% of jobs being in the downtown area (central business district), compared to approximately 15% in Toronto.

    Each of these factors might be thought to contribute to longer commuter times for those in Los Angeles. However, one way commute times in Los Angeles are nearly one-third less than in Toronto. The latest data indicates that the work trip averages 28 minutes in Los Angeles and 40 minutes in Toronto.

    This illustrates important dynamics of commuting and mobility. The keys to shorter commutes in the US are adequate roads, personal mobility (the US has the highest share of travel by automobile) and decentralization (lower density) of both jobs and housing.

    ——
    Addendum:

    Commenting on the same report, the Washington Post’s Brad Plumer stumbled into fantasyland:

    The Department of Transportation found that, in 2009, commutes by private car took, on average, 23 minutes. Public transportation, by contrast, took an average of 53 minutes. You could read that as an argument that more people should drive so that their commutes are shorter or as an argument that we need to bolster public transportation.

    The idea of bolstering transit to equal car travel times is empty romanticism. Today, only 7 percent of metropolitan area workers can reach their jobs in 45 minutes by transit, according to the Brookings Institution (see Transit: The 4 Percent Solution). To cut transit travel times in half, and making it available to all of the metropolitan area is unrealistic.

  • Surprise: Higher Gas Prices, Data Shows More Solo Auto Commuting

    Despite higher prices and huge media hype over shifts to public transit, the big surprise out of the 2010 American Community Survey has been the continued growth over the last decade in driving alone to work. Between 2000 and 2010, driving alone to work increased by 7.8 million out of a total of 8.7 million increase in total jobs. As a result, this use of this mode reached 76.5% of the nation’s workers, up from 75.6% in 2000. This is the largest decadal share of commuting ever achieved for this mode of transport.

    In view of the much higher gasoline prices that prevailed in 2010, it might have been expected that driving alone would lose market share from 2000 (Figure 1). But this did not — despite many media and academic claims that would or was already taking place — occur.

    The Census Bureau began compiling data on commuting in the 1960 census. In each census through 2000, commuting data was obtained through the census "long form" questionnaire. During the last decade, however, the Census Bureau has begun an annual survey, the American Community Survey, which includes commuting data and a considerable amount of additional data, and the decennial census survey was discontinued.

    Cars Dominate: There have been substantial changes in how the nation travels since the first survey in 1960. In 1960, 64% of the nation’s workers traveled by car. Separate data was not obtained for driving alone and carpools until 1980. The 2010 data indicates that 86.2% of employees used cars for the work trip in 2010. This was a slight reduction from 87.9% in 2000. But the anti-automobile crowd should not celebrate; all of the loss was due to a substantial decline in carpooling. In 2000, 12.2% of workers traveled by car pool. This figure dropped to 9.7% in 2010. With the higher gas prices, it might have been expected that carpooling would have become more popular, because of the lower costs from sharing experiences with other workers. This simply did not occur.

    Working at Home: The big winner among the nation’s commuting modes was working at home, a large share of which is telecommuting. Working at home increased from 3.3% of the workforce in 2000 to 4.3% of the workforce in 2010, for a market share increase of 33%, Overall 1.7 million more people work at home in 2010 than in 2000. It seems likely that the high gas prices encouraged a more working at home as did the move by companies to offload work to freelancers to reduce their costs or boost efficiency. Over the decade, gas prices increased 46%, adjusted for inflation, while the work at home market share increased 33% (Figure 2).

    Further, working at home, as indicated in a previous article, is poised to become the third most popular method of accessing work before 2020, passing transit and trailing only driving alone and carpooling (see Decade of the Telecommute). Working at home might have been much more popular in 1960, when it accounted for 7.2% of employment. But as many home-based industries lost share to chains and malls,   this figure fell by more than one-half by 1970 and then fell to 2.2% in 1980. The doubling of the work at home market share since that time, on the other hand, is attributable to the advances in information technology.

    Transit: Transit experienced by far its best decade since the Census Bureau began tracking commuting. Transit’s long market share slide came to an end, rising from 4.6% in 2000 to 4.9% in 2010. Even so, it might have been expected that a more substantial increase in transit commuting would have occurred as a result of the high gasoline prices. However, only an 8% increase in the transit market share occurred at the same time as gasoline prices increased a real 46%, less in percentage terms than the shift to working at home (Figure 2).

    Part of the problem was revealed in a Brookings Institution report. The percentage of metropolitan area jobs that can be reached by transit for the average worker is very low, which seriously limits transit’s potential for commuting use. Brookings data indicates that less than 10% of the jobs in major metropolitan areas can be reached within 45 minutes by transit by the average worker in major metropolitan areas (see Transit: The 4 Percent Solution). This is not only because transit service is infrequent in many parts of metropolitan areas, but also because it operates so much more slowly, on average, than cars. By comparison, the median work trip travel time by people driving alone is 21 minutes.

    Transit carried 12.1% of the nation’s commuters in 1960 and had fallen to 5.3% by 1990. The results of the last three decades indicate that transit commuting may have stopped declining but has reached a plateau, with only small increase.

    Recent decades have seen establishment and substantial expansion of urban rail systems. A principal rationale for these systems has been reducing traffic congestion, especially during peak hours. The majority of commuting takes place during peak hour and is principally responsible for peak hour traffic congestion. Between 2000 and 2010, Metros (subways and elevated) accounted for 48% of the increase in transit commuting, while buses and a trolley buses accounted for 43%. Light rail (trolleys and streetcars) accounted for less than 2% of the additional transit commuting, despite the fact that light rail has been the dominant form of rail transit expansion (Figure 3).

    Bicycling: It was also a good decade for bicycle commuting. Bicycling added nearly 250,000 new commuters and rose from 0.4% of the market in 200 to 0.5% in 2010. The increase in bicycle commuting was 15 times that of light rail. Bicycling was first surveyed by the Census Bureau in the 1980s census, when its market share was also 0.5%.

    Walking: There was little change in walking as a form of commuting. In 2000, 2.9% of commuters walked to work, a figure that dropped to 2.8% in 2010. However, walking has suffered even greater losses than transit over the last 50 years. In 1960, 9.9% of commuters walked to work.

    The Future? One thing is clear from the data of the last decade. There has been no sea-change in commuting, even with the huge gasoline price increases. Few analysts would have predicted that single-occupant commuting would have increased at a time of both high gasoline prices and high joblessness. Further, as the shift to personal mobility continues, the largest percentage increases will like take place in telecommuting, arguably the most energy-efficient form of transport.

    Data from 1960: The table below summarizes work trip access market shares over the 50 years of data collection by the US Census Bureau.

    US Work Access by Mode: 1960-2010
    COMMUTERS 1960 1970 1980 1990 2000 2010
    Car, Truck or Van 41,368,062 59,722,550 81,258,496 99,592,932 112,736,101 118,123,873
    Drove Alone     62,193,449 84,215,298 97,102,050 104,857,517
    Car Pool     19,065,047 15,377,634 15,634,051 13,266,356
    Transit 7,806,932 6,514,012 6,007,728 5,890,155 5,867,559 6,768,661
    Bicycle     468,348 466,856 488,497 731,286
    Walk only 6,416,343 5,689,819 5,413,248 4,488,886 3,758,982 3,797,048
    Other or Unspecified 4401718 2240864 1289613 1225420 1243866 1,595,942
    Work at Home 4,662,750 2,685,144 2,179,863 3,406,025 4,184,223 5,924,200
    Total 64,655,805 76,852,389 96,617,296 115,070,274 128,279,228 136,941,010
               
    MARKET SHARE 1960 1970 1980 1990 2000 2010
    Car, Truck or Van 64.0% 77.7% 84.1% 86.5% 87.9% 86.3%
    Drove Alone     64.4% 73.2% 75.7% 76.6%
    Car Pool     19.7% 13.4% 12.2% 9.7%
    Transit 12.1% 8.5% 6.2% 5.1% 4.6% 4.9%
    Bicycle     0.5% 0.4% 0.4% 0.5%
    Walk only 9.9% 7.4% 5.6% 3.9% 2.9% 2.8%
    Other or Unspecified 6.8% 2.9% 1.3% 1.1% 1.0% 1.2%
    Work at Home 7.2% 3.5% 2.3% 3.0% 3.3% 4.3%
               
    Notes          
    Other includes taxicabs, motorcycles and other
    Blank cells indicate no data
    Taxicab included in transit in 1960
    Workers 14 and over, 1960 & 1970. Workers 16 & over, subsequent censuses
    US Census Bureau data


    Wendell Cox is a Visiting Professor, Conservatoire National des Arts et Metiers, Paris and the author of “War on the Dream: How Anti-Sprawl Policy Threatens the Quality of Life

    Photo: Junction of Interstates 110 (Harbor Freeway) and 105 (Glenn Anderson Freeway) in Los Angeles, which carry four varieties of passenger transport, cars, busway, high-occupancy vehicles and light rail (by author). 

  • How Cities Grow: Dispersion, not Densification

    Analysts occasionally note that urban areas ("cities") are becoming larger and denser. This is only half right. It is true that most of the world’s urban areas are becoming larger, with megacities like Delhi, Jakarta, Shanghai, Beijing and Manila adding more than five million people in the last decade and most other urban areas are growing, but not as fast.

    Understanding Urban Areas: However almost without exception, urban areas are getting less dense. Because there is so much confusion about city "definitions," a clarification is required. The only geography for which overall urban density can be measured is the urban area, which is the area of continuous development. The urban area is not constrained by municipal or other jurisdictional boundaries and does not include rural (undeveloped) territory, even if it is in a "central city" (such as Rome, Ho Chi Minh or Marseille, with their expansive boundaries). An urban area is also different from a metropolitan area, because metropolitan areas (as labor markets) always include rural territory, which is by definition not urban.

    1960-1990 Data: Historical urban population density is not readily available. Kenworthy and Laube were pioneers in this area, publishing estimates from 1960 to 1990 for a number of urban areas. That data indicates density losses in the more than urban areas for which they were able to develop comparable data. The world average decline was 20 percent, ranging from 15 percent in the United States to 29 percent in Europe and 33 percent in Australia. While Tokyo was doubling in population, its population density was dropping 17 percent between 1960 and 1990. While Zurich was adding 21 percent to its population, it was becoming 13 percent less dense.

    Recent Data: The dispersion continues, which is indicated by these high-income world cases:

    Today, the ville de Paris has 700,000 fewer people than at its peak, and inner London (generally the former London County Council area) has lost more than 1,500,000 people since its peak. All growth has been in lower density suburban areas in both the London and Paris urban areas.

    In the United States, urban areas with more than 1,000,000 population more than doubled in population from 1950 to 2000 (2010 data not yet available), while the population density dropped by nearly one-third. Detailed analysis indicates that this trend has continued over the past decade in New York, Los Angeles, Chicago, Dallas-Fort Worth, Seattle, St. Louis and other major US urban areas.

    The dense core city of Seoul has been losing population and all growth has been in the suburbs, which are lower density.

    The dense urban core of Milan has experience substantial population losses, while the less dense suburbs have captured all the growth.

    Dispersion is not limited to high income urban areas, with declining densities in evidence across lower and middle income nations as well. For example:

    Nearly all of the growth in Jakarta has been in the suburbs for the last 20 years, while the core has gained little in population. The net effect is a less dense, but much larger urban area, because the suburbs are not as dense.

    Nearly all of the growth for 30 years in Manila has been in the suburbs, while the core city. Again, the urban area has become much larger, but much less dense because the suburbs are much less dense.

    The dense core of Shanghai has lost population and all growth has been in the suburbs, which are lower density.

    The population in the dense core of Beijing has nearly stopped growing, with nearly all population in the suburbs, which are lower density.

    The core of Mumbai has lost population in two of the last three census periods, while all growth has been in the suburbs, which are lower density.

    The urban core of Mexico City has been declining in population since 1960 and all of the growth has been in the suburbs, which are less dense.

    The dense core city of Buenos Aires has fewer people today than in 1947, while at least 8 million people have been added to nearly 1,000 square miles of lower density suburbs.

    Urban growth continues to be overwhelmingly in less dense suburban areas, rather than in the more dense urban cores, and as a result even as urban areas grow, they become less dense. This is how cities grow.