Author: Wendell Cox

  • The Evolving Urban Form: Chicago

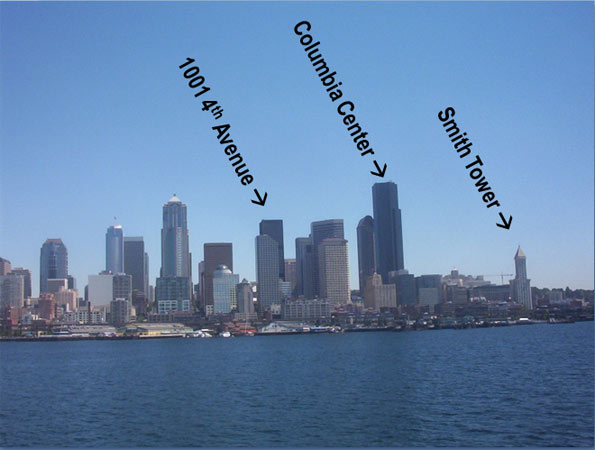
    Looks can be deceiving. No downtown area in the western world outside Manhattan is more visually impressive than Chicago. Both the historic Loop and the newer development north of the Chicago River, especially along North Michigan Avenue have some of the most iconic structures outside of emerging Asia. Yet these vertical monuments mask a less celebrated reality: that of dispersing, low density urban area.

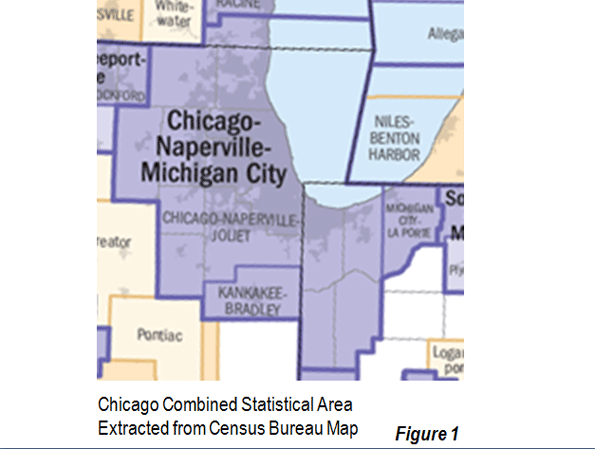
    Chicago Combined Statistical Area: Let’s take a close look at the 2010 census data. Overall, the combined statistical area, which includes the metropolitan area (Note 1) and two exurban counties added nearly 365,000 people, for a growth rate of 3.9 percent. This is well below the national growth rate of approximately 10 percent (Map, Figure 1). Chicago followed the general trend of with growth being greatest in the outer suburbs while declines took place both in the inner suburbs and the historical core municipality (Figure 2).

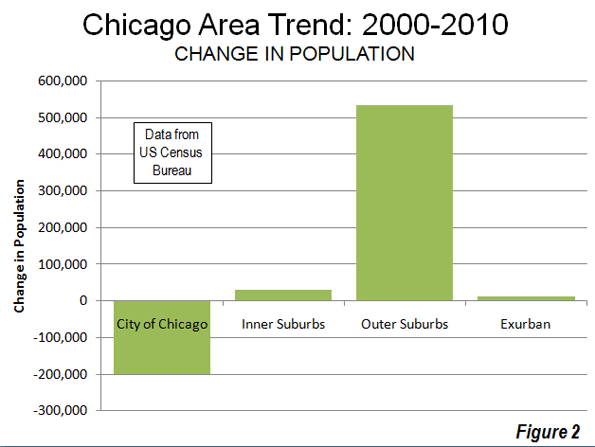
    Massive Core City Loss: The historical core city of Chicago lost but 200,000 people, and fell to a population of 2.7 million, the lowest count since the 1910 census. The population is down 925,000 from 1950 and at the current rate would drop at least 1 million from the 1950 peak by the 2020 census.  Chicago is at risk of joining London and Detroit as the only two historical core municipalities in modern times that have lost more than 1 million people.

    Inner Suburbs: As in New York and Seattle, Chicago’s inner suburbs grew slowly. The inner suburbs include the part of Cook County that is outside the city of Chicago as well as Lake County, Indiana (home of Gary), which shares the city of Chicago’s eastern border. The inner suburbs added fewer than 30,000 residents and grew only one percent.

    This suggests some limitations to the newly developing mantra that has inner suburbs will be the locus of future growth although there are scattered inner suburbs in other cities (such as Hoboken, New Jersey) that did see growth. Perhaps the old mantra, about people returning to the city from which they had never come was finally quashed by the realities of the 2010 census.   

    Outer Suburbs: The outer suburbs, which include the remaining counties of the metropolitan area, grew at a rate of 16.5 percent, actually grew faster than the national average of approximately 10 percent. The outer suburbs added more than 500,000 people. The largest growth, 175,000 was in Will County, to the south, one of the five “collar counties” that used to define the boundaries of the metropolitan area. McHenry County, the most distant of the collar counties added 100,000. The fastest growth was in far suburban and also southern Kendall County, which more than doubled in population.

    Chicago Metropolitan Area: Overall, the Chicago metropolitan area added approximately 360,000 people and grew 4.0 percent from 2000. This is well below the national average population growth rate, however was above that of the Los Angeles metropolitan area, once among the  nation’s of leading growth areas until the last decade.

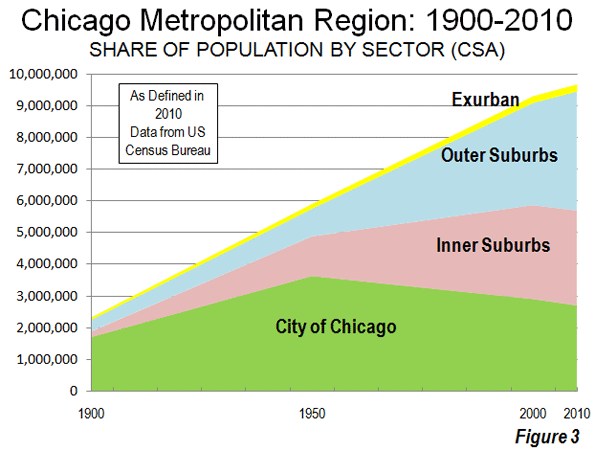
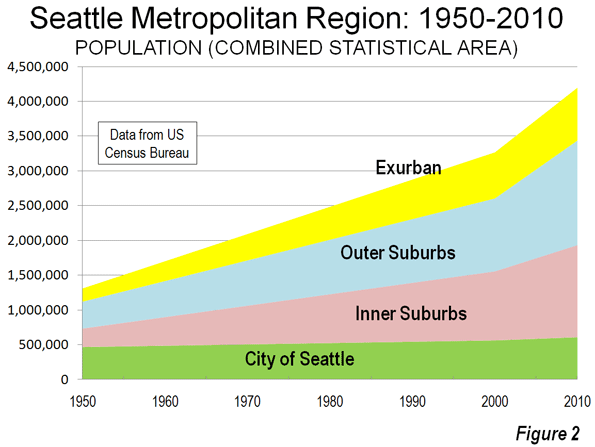
    Historical Trends: The city of Chicago, like other historical core cities, had previously been dominant in its metropolitan area. The earliest Census Bureau metropolitan area (“metropolitan district”) estimates from 1900 indicated that more than 90 percent of the region’s population was contained in the city of Chicago. By 1950, the city of Chicago had fallen to 66 percent of the metropolitan area as defined in that year.  The city of Chicago now has only 28 percent of the combined statistical area population of 9.7 million (Figure 3, Table and Note 2).

    CHICAGO METROPOLITAN AREA
    POPULATION TREND BY COUNTY: 2000 TO 2010
    1900 1950 2000 2010 Change: 2000-2010 % Change: 2000-2010
    HISTORIC CORE MUNICIPALITY
    Chicago   1,698,575   3,620,962   2,895,671 2,695,598 -200,073 -6.9%
    INNER SUBURBAN      178,052   1,255,982   2,965,634 2,995,082 29,448 1.0%
    Cook County, IL      140,160      887,830   2,481,070 2,499,077 18,007 0.7%
    Lake County, IN        37,892      368,152      484,564 496,005 11,441 2.4%
    OUTER SUBURBAN      378,896      884,980   3,237,011 3,770,425 533,414 16.5%
    DeKalb County, IL        31,756        40,781        88,969 105,160 16,191 18.2%
    DuPage County, IL        28,196      154,999      904,161 916,924 12,763 1.4%
    Grundy County, IL        24,136        19,217        37,535 50,063 12,528 33.4%
    Jasper County, IN        14,292        17,031        30,043 33,478 3,435 11.4%
    Kane County, IL        78,792      150,388      404,119 515,269 111,150 27.5%
    Kendall County, IL        11,467        12,155        54,544 114,736 60,192 110.4%
    Kenosha County, WI        21,707        75,238      149,577 166,426 16,849 11.3%
    Lake County, IL        34,504      179,097      644,356 703,462 59,106 9.2%
    McHenry County, IL        29,659        50,656      260,077 308,760 48,683 18.7%
    Newton County, IN        10,448        11,006        14,566 14,244 -322 -2.2%
    Porter County, IN        19,175        40,076      146,798 164,343 17,545 12.0%
    Will County, IL        74,764      134,336      502,266 677,560 175,294 34.9%
    CHICAGO METROPOLITAN AREA   2,255,523   5,761,924   9,098,316 9,461,105 362,789 4.0%
    EXURBAN METROPOLITAN COUNTIES        75,540      150,332      213,939 224,916 10,977 5.1%
    Kankakee Coiunty, IL        37,154        73,524      103,833 113,449 9,616 9.3%
    La Porte County, IN        38,386        76,808      110,106 111,467 1,361 1.2%
    CHICAGO COMBINED STATISTICAL AREA 2,331,063 5,912,256 9,312,255 9,686,021 364,150 3.9%
    Data from the US Census Bureau


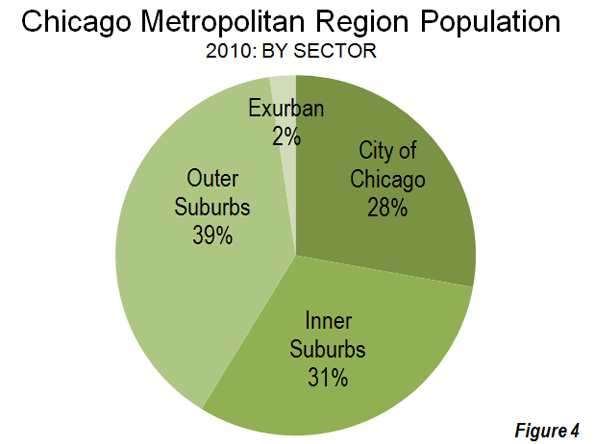
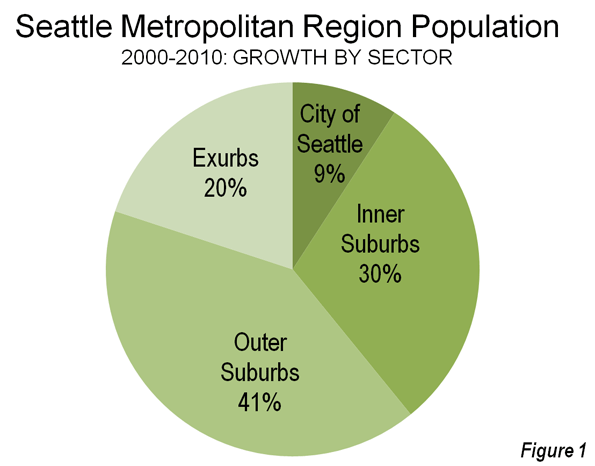
    Since 1950 (Note 3), all of the growth in the Chicago area has been in the suburbs. By 2000, both inner suburbs and the outer suburbs each had more people than the city of Chicago. Today the outer suburbs, with forty percent of the region’s population, represent the largest demographic force in Chicago (Figure 4).

    We do not usually associate Chicago with the dreaded term “sprawl” but Chicago now stands as the third largest urban agglomeration in the world in land area, trailing only New York and Tokyo. The Chicago urban area covers more land than Los Angeles, which has a far higher urban density.

    Dispersing Employment: Chicago’s dispersion extends to employment. Despite having the second strongest central business district in the nation (after Manhattan), jobs are rapidly decentralizing. Last year the Downtown Loop Alliance reported that private sector employment in the Loop fell 20 percent during the last decade. Overall, the downtown area of Chicago now represents approximately 10 percent of regional employment, barely half the percentage of Manhattan or Washington, DC.

    American community survey data from 2009 indicates the total employment in the North West corridor along Interstate 90 has at least as much employment as downtown Chicago. This corridor, anchored by the edge city (Note 4) of Schaumburg, is typical of emerging suburban centers around the nation. Only two percent of workers in this corridor use transit for commuting.

    Another corridor, along Interstate 88 (anchored by Lisle and Aurora) has at least two thirds the employment of downtown, with only one percent commuting by transit. The North Shore corridor encompassing parts of northern Cook County and Lake County is of similar size to the Interstate 88 corridor and has a larger transit work trip market share of five percent.

    Downtown, on the other hand, has the third largest transit work trip market share in the nation, following Manhattan and Brooklyn. In 2000, 55 percent of people working downtown (the larger downtown including the Loop, north of the River and adjacent areas to the west and south) commuted by transit. This illustrates the strength of transit for providing access to the largest, most dense downtown areas in contrast to dispersed suburban areas.

    Perhaps more telling, the number of jobs and resident workers (the “jobs-housing” balance) in the city of Chicago are converging toward equality. According to American community survey data, there are 1.1 jobs in the city of Chicago for each working resident. This is substantially less, for example, than Washington (2.6), Atlanta (2.0), Boston (1.7), San Francisco (1.4) and Baltimore (1.4).

    On the other hand, two of the three large suburban corridors have higher ratios of jobs to workers than the city of Chicago. The Interstate 88 corridor has 1.3 jobs per worker, while the North Shore has approximately 1.5 jobs per worker. The Interstate 90 corridor has slightly more jobs than workers. These data indicate that Chicago is well on the way to a more evenly distributed employment pattern that has become more common around the nation.

    Middle America’s Leviathan: The Chicago area has been very resilient through the years. After nearly a century as the nation’s “second city,” Aaron Renn points out the area could fall from its much cherished “global city” status. Still, Chicago remains the dominant urban area between the coasts. Virtually all of its Midwestern competition has fallen away (such as Detroit, St. Louis and Cleveland). However, in the longer run Chicago could be displaced by Dallas-Fort Worth and Houston. Nonetheless, the urban area’s visually arresting business district will retain its iconic status even if, overall, the region looks more and more like the rest of highly dispersed Middle America.

    ——

    Note 1: This article uses metropolitan area and combined statistical areas as defined by the authoritative US Office of Management and the Budget.

    Note 2: The 1950 references provided because the closest to the Post-War democratization of homeownership and car ownership and expansion of car oriented suburbanization. Before World War II, most US historical core cities were comparatively dense, while a far smaller share of the population lived in the suburbs.

    Note 3: Figure 3 and the Table show data for the 2010 geographical definition of the combined statistical area. Earlier metropolitan area definitions are also referred to in the text.

    Note 4: An “edge city” is a major employment center outside the central business district (downtown).  “Edge city” became a part of the language as a result of Joel Garreau’s 1991 book, Edge City: Life on the Urban Frontier.

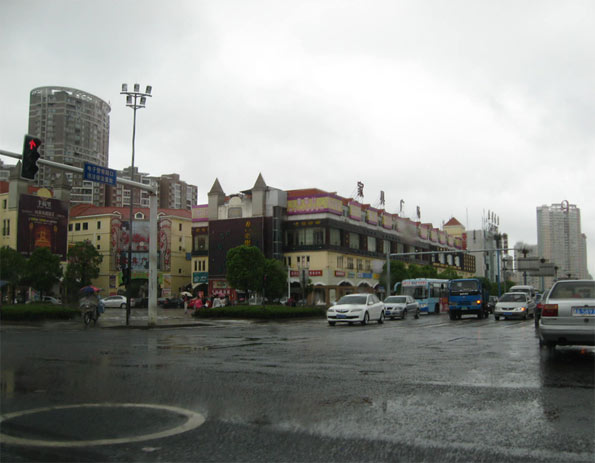
    Photograph: Downtown Chicago from the Air (by author)

  • Adelaide Land Prices Top Sydney

    The median price of serviced (improved) lots for new houses in Adelaide is reported to have risen above that of far larger Sydney by the Housing Industry Association of South Australia. Housing Industry Association of South Australian Executive Director Robert Harding attributed the high price of land to government policies that have limited the supply of land available for building. Nearly all thousands of square miles of land around Adelaide are off-limits to house building due to state government restrictions.

    Adelaide is the slowest growing major metropolitan area of Australia, yet has some of the worst housing affordability among larger metropolitan markets. The 7th Annual Demographia Housing Affordability Survey found median priced Adelaide housing to be 7.1 times median household incomes, ranking the metropolitan area eighth most unaffordable out of 82 with more than 1,000,000 population.

    Before the adoption of its strong smart growth (urban consolidation) land use restrictions, median house prices in Adelaide were one-half or less the present level (Figure). By comparison, new houses can be purchased in much of the United States for less than the median price of an empty lot in Adelaide ($180,000), though not in areas that have adopted smart growth restrictions.

  • Another Congressional Cut for High Speed Rail

    July 15: Today there was another indication that the newly constituted House of Representatives understands the “litmus test” imperative of zeroing out high speed rail appropriations, in light of potentially required cuts in essential programs like Medicare, Social Security and others. $1 billion was switched to Midwest flood relief in an approval today of the Energy and Water Appropriations bill for the 2012 budget.

    The bill may or may not pass the Senate and lobbying is underway to “obligate” the money before the rescission becomes law. Either way, this action and the previous action to reduce high speed rail funding by $2.5 billion in a previous budget deal with the White House indicates a very tough road ahead for the Administration’s high speed rail program, most of which is not genuine high speed rail.

    The rescission would block funding that has been promised by the US Department of Transportation to a number of projects around the nation, such in California, North Carolina, Michigan, Missouri and Illinois.

  • The Costs of Smart Growth Revisited: A 40 Year Perspective

    “Soaring” land and house prices “certainly represent the biggest single failure” of smart growth, which has contributed to an increase in prices that is unprecedented in history. This  finding could well have been from our new The Housing Crash and Smart Growth, but this observation was made by one of the world’s leading urbanologists, Sir Peter Hall, in a classic work 40 years ago. Hall led an evaluation of the effects of the British Town and Country Planning Act of 1947 (The Containment of Urban England) between 1966 and 1971. The principal purpose of the Act had been urban containment, using the land rationing strategies of today’s smart growth, such as urban growth boundaries and comprehensive plans that forbid development on large swaths of land that would otherwise be developable.

    The Economics of Urban Containment (Smart Growth): The findings of Hall and his colleagues were echoed later by a Labour Government report in the mid-2000s which showed housing affordability had suffered under this planning regime. Author Kate Barker was a member of the Monetary Policy Committee of the Bank of England, which like America’s Federal Reserve Board, is in charge of monetary policy. Among other things, the Barker Reports on housing and land use found that urban containment had driven the price of land with "planning permission" to many multiples (per acre) above that of comparable land where planning was prohibited. Under normal circumstances comparable land would have similar value.

    Whether coming from the left or right, economists have demonstrated that prices tend to rise when supply is restricted, all things being equal.  Certainly there can be no other reason for the price differentials virtually across the street that occur in smart growth areas. Dr. Arthur Grimes, Chairman of the Board of New Zealand’s central bank (the Reserve Bank of New Zealand), found the differential on either side of Auckland’s urban growth boundary at 10 times, while we found an 11 times difference in Portland across the urban growth boundary. 

    House Prices in America: The Historical Norm: Since World War II, median house prices in US metropolitan areas have generally been between 2.0 and 3.0 times median household incomes (a measure called the Median Multiple). This included California until 1970 (Figure 1). After that, housing became unaffordable in California, averaging nearly 1.5 times that of the rest of the nation during the 1980s and 1990s (adjusted for incomes). Even after the huge price declines from the peak of the bubble, house prices remain artificially high in Los Angeles, San Francisco, San Diego and San Jose, with median multiples of six or higher.

    William Fischel of Dartmouth University examined a variety of justifications for the disproportionate rise of California housing prices and dismissed all but more restrictive land use regulation. He noted that "growth controls (restrictive land use regulations) have the undesirable effect of raising housing prices." Throughout the rest of the nation, more restrictive land use regulations have been present in every market where house prices rose substantially above the historic Median Multiple norm, even during the housing bubble. No market without smart growth has ever reached these heights.

    Setting Up for the Fall: Excessive Cost Increases in Smart Growth Markets: The Housing Crash and Smart Growth, published by the National Center for Policy Analysis, examined the causes of house price increase during the housing bubble. The analysis included all metropolitan areas with more than 1,000,000 population. It focused on 11 metropolitan areas in which the greatest cost increases occurred (the "ground zero" markets), comparing them to cost increases in the 22 metropolitan areas with less restrictive land use regulation (Note 1).

    • Less Restrictively Regulated Markets: In the less restrictively regulated markets, the value of the housing stock rose approximately $560 billion, or 28 percent from 2000 to the peak of the bubble (Note 2). In nearly all of these markets, the Median Multiple remained within the historical range of 2.0 to 3.0 and none approached the high Median Multiples that occurred in the "ground zero" markets.
    • Ground Zero Markets The value of the housing stock rose $2.9 trillion from 2000 to the peak of the bubble in the "ground zero" markets, all of which have significant land use restrictions (Note 3). The 112 percent increase in the "ground zero" markets was four times that of the less restrictively regulated markets. The Median Multiple rose to unprecedented levels in each of the "ground zero" markets, peaking at from 5.0 to more than 11.0, four times the historic norm.

    The 28 percent increase in relative house value that occurred in the less restrictively regulated markets (those without smart growth) is attributed to the influence of loosened lending standards. The excess above 28 percent, which amounts to $2.2 in the "ground zero" markets is attributed to to the supply restricting strategies of smart growth (Figure 2).

    The Fall: Smart Growth Losses

    The largest house price drops occurred in the markets that had experienced the greatest cost escalation, both because prices were artificially higher but also because prices in smart growth markets are more volatile.  The "ground zero" markets, with only 28 percent of the owner occupied housing stock, accounted for 73 percent of the pre-crash losses ($1.8 trillion). Thus, much of the cause of the housing crash, which most analysts date from the Lehman Brothers bankruptcy (September 15, 2008), can be attributed to these 11 metropolitan areas.

    By contrast, the 22 less restrictively regulated markets accounted for only six percent ($0.16 trillion) of the pre-crash losses. These 22 markets represented 35 percent of the owned housing stock (Figure 3).

    If the losses in the ground zero markets had been limited to the rate in the less restrictively regulated markets (the estimated impact of cheap credit), losses would have been $1.6 trillion less (Note 4). The Great Recession might not have been so "Great."

    Economic Denial and Acknowledgement: In his writing forty years ago, Dr. Hall noted that English planners denied the connection between the unprecedented house price increases and urban containment. This same denial also informs smart growth advocates today. This is perhaps to be expected, because, as Hall noted 40 years ago, an understanding of the longer term consequences would have undermined support for these policies.

    To their credit, some advocates recognize that smart growth raises house prices. The Costs of Sprawl – 2000¸ a volume largely sympathetic to smart growth, also indicates that urban containment strategies can raise housing prices. The only question is how much smart growth raises house prices. The presence of urban containment policy is the distinguishing characteristic of metropolitan markets where prices have escalated well beyond the historic norm.

    The Social Costs of Smart Growth: Moreover, the social impacts of smart growth are by no means equitable. Peter Hall says that the "less affluent house-owner … has paid the greatest price for (urban) containment" (Note 5). He continues: "there can be little doubt about the identity of the group that has got the poorest bargain. It is the really depressed class in the housing market: the poorer members of the privately-rented housing sector." Finally, Hall laments as well the impact of these policies on the "ideal of a property owning democracy."

    Hall’s four decades old concern strikes a chord on this side of the Atlantic. Just last week, a New York Times/CBS News poll found that nine out of ten respondents associated home property ownership with the American Dream. Planning needs to facilitate people’s preferences, not get in their way.

    ——–

    Note 1: The housing stock value uses a 2000 base, which adjusts house prices based upon the change in household incomes to the peak.

    Note 2: The underlying demand for housing was substantial in some of the less restrictively markets, which is illustrated by the strong net domestic migration to metropolitan areas such as Atlanta, Austin, Dallas – Fort Worth, Houston, Raleigh and San Antonio. At the same time, some more restrictive markets (smart growth) that hit historically experienced strong demand were experiencing huge domestic outmigration, indicating little in underlying demand. This includes Los Angeles, San Francisco, San Diego and San Jose. Demand, however is driven upward in more restrictively metropolitan areas by speculation which, according to the Federal Reserve Bank of Dallas is attracted by supply constraints.

    Note 3: The 11 "ground zero" metropolitan markets were Los Angeles, San Francisco, San Diego, San Jose, Sacramento, Riverside-San Bernardino, Las Vegas, Phoenix, Tampa-St. Petersburg, Miami and the Washington, DC area.

    Note 4: The pre-crash losses in the 18 other restrictively regulated markets were $0.5 trillion. These markets accounted for 37 percent of owner occupied housing in the metropolitan areas of more than 1,000,000 population, compared to 35 percent in the less restrictively regulated markets, yet had losses three times as high.

    Note 5: The Containment of Urban England also indicates that new house sizes have been forced downward by the planning regulations (see photo at the top of the article).

    Photograph: New, smaller exurban housing in the London area (by author)

    Wendell Cox is a Visiting Professor, Conservatoire National des Arts et Metiers, Paris and the author of “War on the Dream: How Anti-Sprawl Policy Threatens the Quality of Life

  • The Evolving Urban Area: Seattle

    Lunching at Seattle’s Space Needle, the casual observer might imagine that one of the nation’s most dense urban areas is spread out below. To the immediate south of the Space Needle is one of the nation’s premier downtown areas. In 2000 downtown Seattle had the seventh largest employment base in the country and was one of the most dense. Its impressive, closely packed buildings witness a storied past. For more than 60 years, between 1914 and 1990, downtown Seattle has had the tallest building on the West Coast, Smith Tower, and was the fourth tallest building in the world when built. It held the title for an impressive 55 years, from 1914 to 1969, when another Seattle building briefly took the title (1001 4th Avenue). Later (1985), Seattle’s Columbia Center became the first building on the West Coast to exceed 75 floors, but by 1990 had been passed by the U.S. Bank Tower in Los Angeles (see Elliot Bay photograph and Note 1).

    However, looks can be deceiving.  In 2000, Seattle ranked last in urban population density out of the 11 urban areas in the 13 western states with more than 1 million population (just behind Portland, which ranked next-to-last).  The Seattle urban area’s density was approximately 60 percent below that of Los Angeles, the US’s  densest urban area. Even the Houston and Dallas-Fort Worth urban areas, famous for their great expanse, were denser than Seattle. Updated urban area density data from the 2010 census will not be available for at least a year.

    Nor is the historical core municipality of Seattle particularly closely packed. With a population density of 7,200 per square mile, the city of Seattle is considerably less dense than a number of Los Angeles suburbs such as Santa Ana (12,000) and Garden Grove (9,500). Even so, the city of Seattle is nearly two-thirds more dense than the city of Portland (4,400), despite the latter’s densification claims.

    The 2010 Census: The 2010 census indicates a continuing dispersion of population in the Seattle metropolitan region (Figure 1). The Seattle metropolitan region, formally the Seattle combined statistical area (Note 2) is composed of the core Seattle metropolitan area (King, Pierce and Snohomish counties) and five exurban statistical areas, Bremerton (Kitsap County), Olympia (Thurston County), Mount Vernon (Skagit County), Oak Harbor (Island County) and Shelton (Mason County).

    Seattle Combined Statistical Area: Population 2000-2010
    Area 2000 2010 Change % Share of Growth Share of Population
    City of Seattle        563,374        608,660           45,286 8.0% 9.2% 14.5%
    Balance: King County     1,173,660     1,322,589        148,929 12.7% 30.3% 31.5%
    Pierce & Snohomish Counties     1,306,844     1,508,560        201,716 15.4% 41.0% 35.9%
    Metropolitan Area Outside Seattle    2,480,504    2,831,149        350,645 14.1% 71.2% 67.4%
    Metropolitan Area     3,043,878    3,439,809        395,931 13.0% 80.4% 81.9%
    Exurban Metropolitan Areas        663,260        759,503           96,243 14.5% 19.6% 18.1%
    Combined Statistical Area    3,707,138    4,199,312        492,174 13.3% 100.0% 100.0%
    Calculated from US Census data


    City of Seattle (Historical Core Municipality): Overall, the historical core city of Seattle grew 8.0 percent, from 564,000 to 609,000 between 2000 and 2010, which was one of the healthiest increases among major cities. In adding 45,000, the city still only accounted for 9.2 percent of the Seattle metropolitan region population growth.  The city of Seattle now constitutes less than 15 percent of the metropolitan region population, down from 36 percent 1950 (same geographic area). In 1950, the city of Seattle had nearly two thirds of the population of King County. By 2010, the city of Seattle was less than one third of King County’s population, despite annexations. As the city has continued to decline in its share of the metropolitan region’s population, the impressive downtown area has also lost its dominance and by 2009 had fallen to 8 percent of the metropolitan region’s employment.

    Inner Suburbs: Areas outside the city of Seattle accounted for more than 90 percent of growth in the metropolitan region. The inner suburbs, which include the residential development to the south, north and east of Seattle in King County grew more than 50 percent faster than the city of Seattle, at 12.7 percent between 2000 and 2010. The inner suburbs grew from 1,170,000 to 1,320,000, adding nearly 150,000 new residents, more than three times the city of Seattle increase. King County outside Seattle also captured 30 percent of the metropolitan region’s growth and now has 32 percent of the metropolitan region’s population. The eastern suburbs of King County are home to one of the nation’s largest, most diverse and successful edge cities, Bellevue, as well as the Microsoft campus in neighboring Redmond.

    Outer Suburbs: The outer suburbs, which include Pierce County (Tacoma is the county seat) and Snohomish County grew 15.4 percent, nearly double the growth rate of the city of Seattle. The outer suburbs grew from 1.3 million to 1.5 million, adding 200,000 new residents, more than four times the city of Seattle’s increase. Pierce and Snohomish counties captured 41 percent of the metropolitan region’s growth and now account for 36 percent of the metropolitan region’s population.

    Exurban Areas:  The exurban statistical areas grew nearly as quickly as the outer suburbs. Between 2000 and 2010, the exurban areas increased their population by 14.5 percent.  The exurban statistical areas accounted for 20 percent of the metropolitan region’s population growth. These more distant areas grew from 660,000 to 760,000 people, adding nearly 100,000 new residents. This is more than double the increase in the city of Seattle population. Approximately 18 percent of the population in the metropolitan region lives in the exurban statistical areas, a larger number than residing in the city of Seattle.

    The Dispersion Continues: The dispersion of Seattle, like that of metropolitan regions around the nation and the world, has been going on for decades. The city of Seattle has accounted for only 5 percent of the metropolitan region’s population since 1950 (Figure 2) with suburbs and exurbs accounting for the vast majority of the nearly 3,000,000 increase.

    Despite the pre-2010 census media and academic drumbeat to the effect that metropolitan areas were no longer dispersing, the census revealed a totally different and even inconvenient truth. This does not mean that both residents of the entire metropolitan region, suburbs and core city, should not be proud of an attractive urban area in an incomparable natural setting. Yet, the vast majority of the region’s population and employment growth is taking place outside the core. Seattle is following the national and international pattern to ever greater dispersion.

    _________

    Note 1: Downtown Seattle is on a hill and the newer buildings are generally on higher ground than Smith Tower, which makes the difference in height look greater.

    Note 2: "Combined statistical areas" were formerly "consolidated metropolitan statistical areas."

    Top Photograph: Downtown Seattle from the Space Needle (by author)

    Wendell Cox is a Visiting Professor, Conservatoire National des Arts et Metiers, Paris and the author of “War on the Dream: How Anti-Sprawl Policy Threatens the Quality of Life

  • More Hyperbole on Ghost Cities in China

    The so-called Chinese "Ghost Cities" have been the subject of a number of articles in recent months. There appears to be some truth in the reports, such as in the building of a near empty new city in Inner Mongolia (Ordos). There is also a good deal of hyperbole.

    A recent article ran in the Business Insider, entitled "New Satellite Pictures of China’s Ghost Cities," which relied principally on satellite images, some quite old. Somewhat more proximate (as on-the-ground")  pictures are provided and linked in this article. They show that at least two of the Ghosts have risen from the dead (or they may never have been dead at all).

    Changsha, Hunan: Changsha is the rapidly growing capital of Hunan province, adding nearly 50 percent to its urban districts between 2000 and 2010 (even greater growth than in the US growth leaders, Las Vegas and Raleigh). The Business Insider article displays a satellite image showing huge areas of construction both to the northeast and to the west of the urban area.

    When planning a 2009 trip to China, I chose to visit Changsha because of the extensive construction shown in this very same satellite image. In my continuing satellite image research on urban areas, especially relating to  Demographia World Urban Areas, I noted that this appeared to be the most extensive construction in the nation. A number of photographs are included inour Changsha Rental Car Tour,  which were taken in September 2009.

    On a rainy and quiet Sunday afternoon I took a tour of the northeast construction area and found that much of the construction had been finished. Moreover it was obvious from both the traffic and the open shopping centers and shops that this was anything but a "ghost city" (see photograph, above).

    The next day I took a similar trip to the western construction area. As in the northeast, much of the construction was complete and the communities were alive.

    Zhengzhou, Henan: Zhengzhou is also rapidly growing even faster than Changsha (over 60 percent in 10 years) and is the capital of Henan province. The article displays multiple satellite images of the Zhengzhou New Area. Because of a previous article in the Daily Mail, I took the opportunity on a recent trip to visit the Zhengzhou New Area and file a report. The Zhengzhou New Area is alive.

    The Business Insider also indicates an unfamiliarity with Chinese geography.

    Outside Jiangsu? A couple of the photographs referred to empty developments as being "outside Jiangsu," as a Westerner might describe a development as being outside Phoenix or Omaha. However Jiangsu is not an urban area or city, it is a province. Thus, to refer to a development as being outside Jiangsu is akin to referring to a development as being outside Arizona or Nebraska.

    Changsha Already Twice as Large as Los Angeles? The Business Insider also advises us that Changsha is already twice as big as Los Angeles. In fact, there are no comparable geographies between Los Angeles and Changsha that could make such a statement even close to accurate. Regrettably, many writers and much of the press make comparisons between China and other nations without the remotest idea of the meaning of the geographical terms they are using. Here are a couple of ways that Los Angeles and Changsha can be compared.

    1. Central municipality: The central municipality or core city of the Los Angeles area is the city of Los Angeles. It has a population of approximately 3.8 million people, but accounts for less than one third of the population of either the metropolitan area (functional area or labor market area) or the urban area (physical area or area of continuous development). Strictly speaking, there are no central municipalities in China, because the regions or prefectures are themselves municipalities. It is as if the city of Los Angeles comprised both Los Angeles and Orange counties. Chinese municipalities are divided into districts and if a comparison were to be made at the central municipality level, Changsha’s central district would have to be used. This would be the district (qu) of Furong, which has a population of 500,000 people, about 1/8 that of the city of Los Angeles.

    Core city comparisons are fraught with difficulties. This is illustrated by Melbourne, which had little more than 70,000 people in the last Australian census, approximately two percent of the metropolitan population. The 2010 US Census showed Melbourne, Florida to be larger.

    2. Urban Area: The one level at which they valid comparison could be made is the urban area, or the area of continuous urban development. The latest data for Los Angeles (2000) indicates an urban area population of 11.7 million people. The 2010 US Census counts for the Los Angeles area suggest that the urban area total, once released will be little higher than the 2000 figure.

    Based upon the 2010 census data, the next edition of Demographia World Urban Areas will estimate the Changsha urban area at approximately 3,000,000 people. Thus, by the urban area metric, Changsha has a population approximately one-quarter that of Los Angeles.

    It is possible that Business Insider like others, compared the population of the central city of Los Angeles (3.8 million), which is only part of the urban area to that of the Changsha municipality (7 million), which has more than double the population of the Changsha urban area and covers at least 25 times as much land area (virtually all it rural). They are not the same thing.

    —–

    Photograph: In the northwestern Changsha "ghost city:" September 2009 (by author)

  • Outlawing New Houses in California

    UCLA’s most recent Anderson Forecast indicates that there has been a significant shift in demand in California toward condominiums and apartments. The Anderson Forecast concludes that this will cause problems, such as slower growth in construction employment because building multi-unit dwellings creates less employment than building the detached houses that predominate throughout California and most of the nation. The Anderson Forecast says that this will hurt inland areas (such as the Riverside-San Bernardino area and the San Joaquin Valley) because their economies are more dependent on construction than coastal areas, such as Los Angeles, the San Francisco Bay Area and San Diego.

    Detached Housing Permits Remain Strong in the Historic Context: The Anderson Forecast reports that multi-unit building permits have recovered more quickly than building permits for detached housing. However, any such shift is likely to be highly volatile. Since the peak of the bubble, the distribution of building permits between detached and multi-unit in California has been on a roller coaster. Indeed the Anderson Forecast characterizes the "2010 US Census" as "showing a significant shift in demand toward condominiums and apartments." Actually, the 2010 US Census asked no question from which such a conclusion about housing types or any question from which such a conclusion could be drawn.

    The trends in the building permit data are not completely clear. In 2005, the year before prices started to collapse, 75 percent of building permits in California were for detached housing. This trended downward, reaching a low of 52 percent in 2008. In 2009, the detached housing recovered to account for 73 percent of all housing building permits. Then the figure fell back to 59 percent in 2010.

    With these erratic trends, it is tricky to forecast longer term market trends and consumer demand.  Economic projections in 1934 would have suffered from a similar problem, as the Great Depression was continuing and no one could really tell when it would end. Today’s continuing housing depression may be similar.

    Moreover, as the Anderson Forecast notes, detached housing construction declined in the early 1980s, dropping to 42 percent in 1985. In fact, over the 25 years between 1960 and 1985, detached houses accounted for an average of only 54 percent of new housing construction in California, well below the 2010 figure of 59 percent (Figure 1).

    Equally important, the condominium market remains in a deep depression. In 2010, less than four percent of houses built for sale in the United States were multi-unit buildings, including condominiums (Figure 2), as an increasing majority of multi-unit buildings have been built as rentals (Figure 3). Comparable California data is not available, but from the peak of the bubble (2006/7) to 2009, there was a loss of more than 3,000 owner occupied  multi-unit dwellings with 10 or more units, while owner occupied detached houses increased by nearly 100,000 (Note 1).

    If there is an intrinsic pent-up preference for condominium living, it is not evident in the poor performance of high-density developments even in such theoretically desirable places as Santa Monica, San Francisco, Oakland, San Jose and North Hollywood. Condominium prices, for example, have fallen 52 percent in the major California metropolitan areas, compared to 48 percent for single-family houses (Figure 4). Naïve developers, relying too much on the much promoted notion that suburban empty-nesters were chomping at the bit to move to new housing in the core area, often watched their empty units liquidated at $0.50 or less on the dollar or turned into rentals.  Further, if people are moving to apartments, it’s not for love of density but more likely due weakening economic circumstances.

    Inland California Continues to Grow Faster: The Anderson Forecast also suggests that growth in interior California will suffer because "workers are less likely to move inland into an apartment and commute toward the coast." This assumption of slower inland growth reflects the conventional wisdom that areas outside the large coastal metropolitan areas have stopped growing since the burst of the housing bubble as people flock towards the coastal urban core (Note 2). The reality is different, as interior California and the peripheral metropolitan areas of the larger metropolitan regions (Note 3) continue to grow more strongly even in bad economic times. After the burst of the bubble, from 2008 to 2010 (Figure 5):

    • In the Los Angeles area, the adjacent Riverside-San Bernardino ("Inland Empire") and Oxnard metropolitan areas, combined, have grown at seven times the rate of the core Los Angeles metropolitan area.
    • In the San Francisco Bay area, the adjacent Napa, Santa Cruz, Santa Rosa and Vallejo metropolitan areas, combined, have grown nearly twice as quickly as the core San Francisco and San Jose metropolitan areas.
    • California’s deep interior, the San Joaquin Valley has grown even faster than the exurban areas of Los Angeles and San Francisco.

    One key reason: most people who move to interior areas do not commute toward the core.  For example, less than 10 percent of workers in the Riverside-San Bernardino metropolitan area commute into Los Angeles County, a market share that declined 15 percent between 2000 and 2007. Many also simply cannot afford the higher cost of living in the coastal metropolitan areas, which likely will continue to retard growth in the core metropolitan areas.

    The Policy Threat to New Houses : A survey by the Public Policy Institute of California suggests a vast preference (70%) for detached housing among the state’s consumers.  This continuing preference is demonstrated by detached housing prices that are generally two times historic norms relative to incomes in the coastal metropolitan areas (Los Angeles, San Francisco, San Diego and San Jose).

    Yet now, this choice is under a concerted assault by both the state and many local governments, cheered on by most media and the academic community.  For years, planning regulations have driven land prices so high that house prices have risen to well above the rest of the nation (Figure 5) under regulations referred to by terms such as "smart growth" and "urban containment." The regulations and the inevitably resulting speculation propelled a disproportionate rise (nearly $2 trillion) in California house prices compared to national norm. If California house prices had risen at the same rate relative to incomes as in more liberally regulated areas, the loss to financial markets could have been hundreds of billions of dollars less when the bubble burst (Figure 6).

    Planning for Crowding and Density: California’s assault on detached housing is taking on a distinctly religious fervor.  The state’s global warming law (Assembly Bill 32) and urban planning law (Senate Bill 375) is providing a new basis to impose draconian limits on the construction of detached housing. For example, in the San Francisco Bay area, it has been proposed that 97 percent of new housing be built within the existing urban footprint. That would mean an emphasis on multi-unit housing and little or no new housing on the urban fringe. The option of a single family home will be all but non-existent for   even solidly middle income Californians.

    Planning authorities in the Bay Area seem oblivious to the fact that destroying affordability also destroys growth, already evident by the state’s poor economic performance and ebbing demographic vigor.    Planners rosily project 2 million more people between 2010 and 2035 in the San Francisco Bay area. The growth rate over the past 10 years suggests a number less than half that (Figure 7) and given the rapid aging of the area, even this estimate may be too high. The planners also project more than 1.2 million   new jobs, something difficult to believe given the more than 300,000 job loss (Note 4) that occurred in the Bay Area between 2000 and 2010 (Figure 8).

    The Environmental "Fig Leaf:" The environmental justification for these policies is fragile . Research supporting higher density housing has routinely excluded the greater emissions from construction material extraction and production, building construction itself and common greenhouse gas emissions from energy consumption that does not appear on consumer bills. Further, higher densities are associated slower and more erratic speeds, which retards fuel efficiency and increases greenhouse gas emissions, a factor not sufficiently considered.

    The report seems to ignore any other options besides rapid densification, which as McKinsey Global Institute has pointed out is not at all necessary to reduce GHG emission reductions. They point to other factors as more fuel efficient cars.   

    Oddly, the San Francisco Bay Area proposal does not even mention working at home (much of it telecommuting), the most environmentally friendly way of accessing employment. Working at home has grown six times the rate of transit since 2000 in the Bay Area.

    Outlawing New Houses Detached housing remains the overwhelming choice of Californians. There is no indication that this preference is about to be replaced by a preference for high-density housing.  Current and future middle class Californians could be corralled into more crowded conditions, because questionable planning doctrines mandate that detached housing should be outlawed.

    —-

    Notes:

    1. Calculated from 2006, 2007 and 2009 American Community Survey data. The over ten unit category is used because is more generally reflective of the dense condominium development generally favored by densification advocates (Latest data available).

    2.  Another questionable tenet of conventional wisdom is that the price declines in the outer suburbs were greater than in the cores. When the price declines reached their nadir, core California markets were generally at least as depressed from their peak prices as suburban markets.

    3. Metropolitan region refers to combined statistical areas, which have a core metropolitan area, such as the Los Angeles MSA and include surrounding metropolitan areas, such as the Riverside-San Bernardino MSA and the Oxnard MSA.

    4. Annual, 2000 to 2010, calculated from California Economic Development Department data.

    Lead photo: Houses in Los Angeles. Photograph by author.

    Wendell Cox is a Visiting Professor, Conservatoire National des Arts et Metiers, Paris and the author of “War on the Dream: How Anti-Sprawl Policy Threatens the Quality of Life

  • Exaggerating in Orlando: Sunrail

    For decades taxpayers have paid billions to finance major transportation project cost overruns far exceeding the routinely low-ball forecasts available at approval time. This has been documented in a wide body of academic literature, the most important of which was conducted by Bent Flyvbjerg of Oxford University, Nils Bruzelius University of Stockholm and Werner Rothengatter of the University of Karlsruhe in Germany (Megaprojects and Risk: An Anatomy of Ambition).

    Major project advocacy, however, has descended to a new low of unprecedented and absurd exaggeration. This is evident in the current public policy debate about the Sunrail commuter rail project in Orlando. Two examples make the point

    Exaggeration #1: Job Creation: The Central Florida Partnership claims that Sunrail will create 10,000  jobs. "almost immediately." This would be quite an accomplishment. The Sunrail project is currently projected to cost approximately $850 million for just the first segment. Every cent of the likely cost overruns will be on a blank check drawn the account of Florida taxpayers.

    At Sunrail’s claimed rate of job creation,  the Obama Administration’s $800 million "shovel ready" stimulus program (enacted in 2009), would have "almost immediately" produced more than nine million jobs. By now, the unemployment rate would have been reduced to little above 2 percent, lower than at any point in the more than 60 years of available data. Of course, and predictably, the stimulus program did no such thing, not least because a job created by public spending is likely to destroy more than one sustainable job in the private sector.

    Exaggeration #2: Sunrail Will Make a Difference: The proponents imply that Sunrail will carry a significant number of trips in the Orlando area, claiming that the line will carry one lane of freeway traffic and that it will give central Florida residents an alternative to high gasoline prices. In fact, even if Sun Rail reaches its ridership projections, it would take a full day of train travel to remove less than an hour’s peak hour freeway volume. Needless to say, no one will notice any fewer cars on the freeway (Figure).

    Further, Sunrail will not provide an alternative to the overwhelming majority of central Floridians, since it will attract only 1,850 new round-trip riders per day by 2030 (Sunrail’s number). Spending $850 million on Sunrail is the same as the taxpayers giving each new rider a gift of $450,000.

    The Need to Set Rational Priorities: All of this is occurring in the face of an national fiscal crisis so severe that even the AARP has expressed its willingness to consider cuts to Social Security. As an AARP spokesperson put it "You have to look at all the tradeoffs." Indeed.

  • The Evolving Urban Form: Shanghai

    According to the results of the 2010 census, Shanghai’s population was nearly 1,000,000 people more than had been projected by local authorities. The provincial level of jurisdiction grew from a population of 16.4 million in 2000 to 23.0 million in 2010. Shanghai is one of the world’s fastest growing megacities (urban regions of more than 10 million population). Shanghai’s 6.6 million population growth equals the strong growth of the Manila urban region over the same period but trails the 7.4 million growth in the Jakarta urban region. Shanghai modestly extended its lead over Beijing as China’s largest urban region, where the growth over the same period was 5.8 million.

    As is typical of urban regions around the world, Shanghai’s population gain was concentrated outside the core, in suburban and exurban areas (see table at bottom). A map of Shanghai’s districts can be seen here.

    Suburban Growth: The nine suburban districts grew 69% between 2000 and 2010. The suburban areas grew from 9.5 million in 2000 to 16.0 million in 2010, adding the equivalent of the population of greater Toronto, Dallas-Fort Worth or the Rhine-Ruhr (Essen-Dusseldorf). The suburbs dominated growth, with 99.2% of the population gain

    Sonjiang, to the west of Honquiao airport grew the most, adding nearly 150% to its population. Pudong, a huge district that extends from the new edge city development across the Huangpu River from downtown all the way to Pudong Airport on the Yangtze River added 1.9 million people and now has a population exceeding 5 million (Note).


    Pudong Business District

    The Inner Core: The inner core is the all of the famous Bund, with its Western-style commercial architecture along the Huangpu River and Shanghai’s best known shopping street, Nanjing road. The three districts of the inner core all lost population. Overall, the inner core population dropped from 1.209 million to 926,000, a decline of 23%. This may seem surprising, in view of the large number of high-rise condominium buildings that have been constructed in this area. However, these buildings typically replaced higher density low rise development that was generally not up to modern standards. The inner core has a population density of 119,400 people per square mile (46,100 per square kilometer), down from 155,700 per square mile (60,100 per square kilometer) in 2000. Even so, the inner core retains a population density more than 50% above that of either Manhattan or the ville de Paris. 


    Toward Nanjing Road

    The Outer Core: The six districts of the outer core gained 6%, increasing from 5.723 million to 6.060 million people. Two districts sustained minor losses and another three made modest gains. The district of Putuo was the exception, gaining 23%. The outer core districts had a population density of approximately 60,100 per square mile, or 23,200 per square kilometer in 2010.

    Overall, the entire core grew 0.8% and accounted for 0.8% of the growth in the jurisdiction. The population density was approximately 64,000 per square mile or 25,000 per square kilometer.

    Urban and Rural Shanghai: Overall, Shanghai covers approximately 2,445 square miles (6,333 square kilometers), a land area somewhat more than that of the Statistics Canada defined Toronto metropolitan area (2,279 square miles or 5,901square kilometers). However, Shanghai’s population is nearly four times that of the Toronto area. Even so, Shanghai’s rural population remains at approximately 3,000,000 people.

    Based upon the new census count, it is estimated that the population of the urban area is approximately 20,000,000. The suburban areas, inside the urban area but outside the core are estimated to have a population density of 10,600 per square mile or 4,100 per square kilometer, well below the density of the core. Even so, this suburban density is well above that of all but a few of the urban areas of Western Europe. The suburban areas include a number of undeveloped areas that are completely surrounded by urbanization.

    Decentralized Employment: Shanghai has also developed a decentralized employment base, despite having one of the world’s largest central business districts, with 1.25 million jobs. By comparison, Manhattan has approximately 1,750,000 jobs south of 59th Street, while Tokyo has approximately 4,000,000 jobs inside the Yamanote Loop. The central business district has approximately 15% of Shanghai’s employment.

    Shanghai’s Urban Expansion: Shanghai continues to expand in virtually every direction. It is likely that Shanghai’s urbanization will mean that of Kunshan, an urban area of nearly 1.5 million people located in the Suzhou Prefecture of Jiangsu. In addition, the urbanization is also likely to soon meet that of Taicang, another urban area in Suzhou that has a population of approximately 500,000.  At least one of Shanghai’s Metro lines is planned to be extended to Taicang.

    Shanghai’s urbanization is also poised to spill across the border into the province of Zhejiang. Development is also spreading to the east and southeast in Pudong, including Lingang, which will eventually have 1 million residents. The ocean will prevent further expansion in this direction. Lingang is the point from which a 17 mile (28 kilometer) long bridge crosses one-half of Hangzhou Bay Bridge to Shanghai’s new island port, the largest in the world.

    Shanghai exhibits the same trends that are evident in other world megacities. Like Seoul and Mexico City, the inner core population density is falling. And like Jakarta, Mumbai, Manila and most other large urban areas in the world, the overall population density is declining even as population growth continues.

    Shanghai: Population by District & County (Qu & Xian)
    2010 Census
    POPULATION            
    Sector Area: Square Kilometers  Population: 2000  Population: 2010 Population: Change 2000-2010 % Change % of Growth
    INNER CORE 20.1     1,209,000       926,000      (283,000) -23.4% -4.3%
    Huangpu Qu 4.5        575,000        430,000       (145,000) -25.2% -2.2%
    Jing’an Qu 7.6        305,000        247,000         (58,000) -19.0% -0.9%
    Luwan Qu 8.0        329,000        249,000         (80,000) -24.3% -1.2%
    OUTER CORE 261.4     5,723,000     6,060,000       337,000 5.9% 5.1%
    Changning Qu 38.3        702,000        691,000         (11,000) -1.6% -0.2%
    Hongkou Qu 23.5        861,000        852,000           (9,000) -1.0% -0.1%
    Putuo Qu 54.8     1,052,000     1,289,000        237,000 22.5% 3.6%
    Xuhui Qu 54.8     1,065,000     1,085,000          20,000 1.9% 0.3%
    Yangpu Qu 60.7     1,244,000     1,313,000          69,000 5.5% 1.0%
    Zhabei Qu 29.3        799,000        830,000          31,000 3.9% 0.5%
       
    CORE DISTRICTS 281.5 6,932,000 6,986,000 54,000 0.8% 0.8%
       
    SUBURBAN 6,051.1     9,476,000   16,031,000     6,555,000 69.2% 99.2%
    Baoshan Qu 415.3     1,228,000     1,905,000        677,000 55.1% 10.2%
    Chongming Xian 1,041.2        650,000        704,000          54,000 8.3% 0.8%
    Fengxian Qu 687.4        624,000     1,083,000        459,000 73.6% 6.9%
    Jiading Qu 458.8        753,000     1,471,000        718,000 95.4% 10.9%
    Jinshan Qu 586.1        580,000        732,000        152,000 26.2% 2.3%
    Minhang Qu 371.7     1,217,000     2,429,000     1,212,000 99.6% 18.3%
    Pudong Xin   Qu 1,210.4     3,187,000     5,044,000     1,857,000 58.3% 28.1%
    Qingpu Qu 675.5        596,000     1,081,000        485,000 81.4% 7.3%
    Songjiang Qu 604.7        641,000     1,582,000        941,000 146.8% 14.2%
       
    TOTAL 6,332.6   16,408,000   23,019,000     6,611,000 40.3% 100.0%
       
       
    POPULATION DENSITY          
       
    Sector Area: Square Kilometers  Area: Square Miles  Population/ KM2: 2000 Population/ KM2: 2010 Population/ Mile2: 2000 Population/ Mile2: 2010
    INNER CORE 20.1              7.8         60,100         46,100       155,700       119,400
    Huangpu Qu 4.5               1.7        127,800          95,600        331,000        247,600
    Jing’an Qu 7.6               2.9          40,100          32,500        103,900          84,200
    Luwan Qu 8.0               3.1          41,100          31,100        106,400          80,500
    OUTER CORE 261.4           100.9         21,900         23,200         56,700         60,100
    Changning Qu 38.3             14.8          18,300          18,000          47,400          46,600
    Hongkou Qu 23.5               9.1          36,600          36,300          94,800          94,000
    Putuo Qu 54.8             21.2          19,200          23,500          49,700          60,900
    Xuhui Qu 54.8             21.2          19,400          19,800          50,200          51,300
    Yangpu Qu 60.7             23.4          20,500          21,600          53,100          55,900
    Zhabei Qu 29.3             11.3          27,300          28,300          70,700          73,300
    CORE DISTRICTS 281.5           108.7         24,600         24,800         63,700         64,200
    SUBURBAN 6,051.1        2,336.3           1,600           2,600           4,100           6,700
    Baoshan Qu 415.3            160.3            3,000            4,600            7,800          11,900
    Chongming Xian 1,041.2            402.0              600              700            1,600            1,800
    Fengxian Qu 687.4            265.4              900            1,600            2,300            4,100
    Jiading Qu 458.8            177.1            1,600            3,200            4,100            8,300
    Jinshan Qu 586.1            226.3            1,000            1,200            2,600            3,100
    Minhang Qu 371.7            143.5            3,300            6,500            8,500          16,800
    Pudong Xin   Qu 1,210.4            467.3            2,600            4,200            6,700          10,900
    Qingpu Qu 675.5            260.8              900            1,600            2,300            4,100
    Songjiang Qu 604.7            233.5            1,100            2,600            2,800            6,700
    TOTAL 6,332.6        2,445.0           2,600           3,600           6,700           9,300


    —-

    Lead Photograph: The Bund (all photos by author)

    Note: Pudong includes the large Pudong business district, which is directly across the Huangpu River from the Bund in the central business district. However, Pudong is a relatively new development and was not a part of the urban core. Moreover, Pudong extends far to the east and southeast.

    Wendell Cox is a Visiting Professor, Conservatoire National des Arts et Metiers, Paris and the author of “War on the Dream: How Anti-Sprawl Policy Threatens the Quality of Life

  • High Speed Rail Subsidies in Iowa: Nothing for Something

    The Federal government is again offering money it does not have to entice a state (Iowa) to spend money that it does not have on something it does not need. The state of Iowa is being asked to provide funds to match federal funding for a so-called "high speed rail" line from Chicago to Iowa City. The new rail line would simply duplicate service that is already available. Luxury intercity bus service is provided between Iowa City and Chicago twice daily. The luxury buses are equipped with plugs for laptop computers and with free wireless high-speed internet service. Perhaps most surprisingly, the luxury buses make the trip faster than the so-called high speed rail line, at 3:50 hours. The trains would take more than an hour longer (5:00 hours). No one would be able to get to Chicago quicker than now. Only in America does anyone call a train that averages 45 miles per hour "high speed rail."

    The state would be required to provide $20 million in subsidies to buy trains and then more to operate the trains, making up the substantial difference between costs and passenger fares. This is despite a fare much higher than the bus fare, likely to be at least $50 (based upon current fares for similar distances). By contrast, the luxury bus service charges a fare of $18.00, and does not require a penny of taxpayer subsidy. Because the luxury bus is commercially viable (read "sustainable"), service can readily be added and funded by passengers. Adding rail service would require even more in subsidies from Iowa. The bus is also more environmentally friendly than the train.

    Further, this funding would be just the first step of a faux-high speed rail plan that envisions new intercity trains from Chicago across Iowa to Omaha. In the long run, this could cost the state hundreds of millions, if not billions of dollars. Already, a similar line from St. Louis to Chicago has escalated in cost nearly 10 times, after adjustment for inflation, from under $400 million to $4 billion.

    Unplanned cost overruns are the rule, rather than the exception in rail projects. European researchers Bent Flyvbjerg, Nils Bruzelius and Werner Rottengather (Megaprojects and Risk: An Anatomy of Ambition) and others have shown that new rail projects routinely cost more than planned (Note 1).

    Flyvbjerg et al found that the average rail project cost 45 percent more than projected and that 80 percent cost overruns were not unusual. Cost overruns were found to occur in 9 of 10 projects. Further, they found that ridership and passenger fares also often fell short of projections, increasing the need for operating subsidies.

    Iowa legislators may well identify ways to spend their scarce tax funding on services that are actually needed.

    ______

    Note: Flyvbjerg is a professor at Oxford University in the United Kingdom. Bruzelius is an associate professor at the University of Stockholm. Rothengatter is head of the Institute of Economic Policy and Research at the University of Karlsruhe in Germany and has served as president of the World Conference on Transport Research Society (WCTRS), which is perhaps the largest and most prestigious international association of transport academics and professionals.