Author: Wendell Cox

  • Devastated St. Louis Airport: Up to the Challenge

    St. Louis: April 23, 2011 (9 a.m.) The St. Louis (Missouri-Illinois) metropolitan area is just beginning to dig out of the devastating tornadoes that struck on the evening of Good Friday. Miraculously, there appear to have been few, if any life-threatening injuries.

    The St. Louis tornadoes, however, impacted interstate travel like no other tornadoes in history. St. Louis Lambert international Airport sustained major damage. The main terminal, lost one half of its windows and had major damage in the ticketing area. Concourse C, which is the busiest at the airport lost part of its roof, had damaged jet ways and is reported to have lost all of its windows on the north side. The main terminal would be readily recognized by movie-goers who have seen it featured in Planes, Trains and Automobiles (with an artificial snow cover in the middle of the summer) and Up in the Air. The main terminal was one of the most notable early modern terminal designs and was a precursor of the TWA terminal at JFK airport in New York.

    At this point, local officials have even mentioned the possibility that the structure may have been compromised by the storm. Many cars in the adjacent parking structure were damaged by flying debris, which broke windows and produced body damage. Debris filled one of the major roadways between the main terminal and the parking structure (photograph). Needless to say, the airport has been closed indefinitely.

    As disruptive as the tornado was to the airport and the traveling public, the closure is likely to be shorter in duration than if it had happened at about any other major airport in the nation. This is because St. Louis airport probably has the largest amount of unused capacity of any major airport in the western world.

    The past decade has been characterized by serious reversals for St. Louis airport. The fate of the airport was significantly tied to Trans World Airlines (TWA) which established a hub at St. Louis airport in the early 1980s, shortly after the expansion of the air travel that occurred due to airline deregulation. St. Louis was one of the most convenient metropolitan areas in the nation from which to travel, with frequent nonstop service to all major markets in the nation, daily service to London and seasonal service to Paris. However, TWA filed bankruptcy more than once and was finally purchased by American Airlines. After the 911 terrorist attacks, when airline volumes dropped temporarily in the United States, American Airlines began scaling back operations at St. Louis airport. Now, the TWA – American hub is gone and the airport’s largest airline is Southwest.

    Over the past decade, the passenger volumes at St. Louis airport have dropped by nearly two-thirds. This has left much of the airport empty. Concourse A continues to be used near capacity. Concourse C, which used to be home to the TWA hub is probably the busiest, but is only partially used. There are two other concourses that are virtually empty including Concourse D, built when volumes were the highest and the older Concourse B. The damage to concourses appears largely to be limited to Concourse C, but it is serious. There is also a Concourse E, which is dedicated principally to Southwest Airlines. This concourse appears to have also escaped major damage.

    All of this spare capacity gives St. Louis airport the potential for a quicker recovery than would be possible if the airport were running close to capacity, as was the case at the turn-of-the-century. It seems likely that this provides the opportunity to transfer operations to the nearly empty Concourses B and D, while longer-term repairs are made to Concourse C.

    There is still the difficulty, however, of the damage to the main terminal, principally because it contains the ticketing and baggage facilities for Concourse A and Concourse B, which appear to still be usable. Access to these concourses could be expedited by prioritizing the repairs toward the west side of the ticketing lobby, which serves the Concourse A and Concourse B airlines and is closest to those concourses.

    There still remains, however, the difficulty of handling the Concourse C flights. Even here however there may be opportunities for an expeditious recovery. Concourse E, the Southwest terminal, has direct access to Concourse D, though that access has not been permitted in recent years. There may be ways to relocate the ticket facilities for the Concourse C airlines temporarily to Concourse E, and to transfer the flights to Concourse D. Should the main terminal repairs proceed fast enough, a simpler solution would be the transfer of Concourse C traffic to Concourse D.

    No final plan has been announced. It is also possible that the early damage reports are more pessimistic than will be revealed in the days and hours to come. However, even with its reduced volumes, the nation needs to have this unprecedented removal of one of its principal facilities quickly restored.

  • Downtown China

    In Downtown: It’s Rise and Fall, 1880-1950, Robert M Fogelson says that downtowns are a uniquely American phenomenon. He refers to downtown as the commercial cores with high building densities that form "canyons" that, in some smaller urban areas, might be only a block long to a mile or more long.  Fogelson demonstrates that downtowns in the United States are largely a creation of rail transit (subways or metros, street cars and their predecessor horse cars). American urban areas grew at the same time that this mode of transport was reached its zenith.    

    This pattern was also evident in the pre-automobile cores of large urban areas in Canada, Australia and New Zealand.

    Since then, the downtown has been losing its preeminence. As late as 1950 virtually all of the nearly 50 US urban areas with more than 250,000 people had concentrated downtown areas of varying sizes. The unifying factor was the access to this one point in the urban area by transit from most or all of the rest of the urban area.   Smaller urban areas, after transit’s golden age, never developed downtowns as well-developed as those which grew during the transit oriented urban areas of the pre-World War II era.

    China’s emerging commercial cores bear little resemblance to these older American downtowns. Generally, what might be termed as downtown in the urban areas of China is far more dispersed. The tallest buildings do not stand across narrow streets from one another. You see little of the often spectacular high-rise canyons seen in great American downtowns such as Chicago and New York or even smaller ones, such as Pittsburgh and Seattle and many others.   

    Dominant Pattern: The Dispersed Central Business District: The most pervasive form of downtown China is a larger central business district consisting of dispersed high-rise buildings superimposed on lower rise residential buildings, the latter often being five floors or less.

    Perhaps the best example is Guangzhou, capital of Guangdong (12 million population) that now engulfs adjacent Foshan. The skyscrapers of central Guangzhou, some among the tallest in the world, are spread around an area of between 10 and 15 square miles (26 to 39 square kilometers). The largest concentration is near the Guangzhou East Railway Station, where the trains of the former Kowloon – Canton Railway terminate. Even so, this concentration is more sparse than would be expected in even a smaller US Pre-World War II transit oriented downtown.   Other, smaller concentrations of tall commercial buildings or skyscrapers are virtually isolated. The Guangzhou International Finance Center, the tallest building in Guangzhou and 10th tallest in the world dominates its generally low rise surroundings, soon to be joined by an even taller 116 floor building that is under construction.

    The pattern of dispersed and large central area development is also obvious in nearby Shenzhen, Guangdong (population 15 million, see Note), which rose from being fishing village to megacity status in less than 30 years. The central core occupies at least as much space as central Guangzhou. However, unlike Guangzhou, part of the Shenzhen central area has relatively dense high-rise buildings. This eastern section has a number of very tall buildings, and of the world’s second tallest skyscraper (and China’s tallest) is now under construction in this area (the Pingan International Financial Center).

    Other Chinese urban areas with generally dispersed core commercial development include Chengdu, the capital of Sichuan (5 million), Changsha, capital of Hunan (2.5 million), Taiyuan, capital of Shanxi (3 million), Kunming, capital of Yunan (3.2 million) Guiyang, capital of Guizhou (2.3 million), Ningbo, Zhejiang (3.2 million) and Tianjin (7 million), a provincial level municipality.

    Changsha and Taiyuan are near duplicates, with the core development in a wide area extending from the main railway station over a mile westerly to north-south rivers that dissect each urban area.

    Dongguan, Guangdong (12 million, see Note), like Shenzhen became a megacity (from a rural area) in less than two decades. Dongguan is located between Guangzhou and Shenzhen, and may have the most dispersed central business district in China, with little concentration except for an "edge city" development with comparatively large distances between buildings. Dongguan is unique for being the largest urban area in the world without an international airport (Dongguan is served by the nearby Shenzhen and Guangzhou international airports).

    Dual Cores Superimposed on Dispersed Central Areas: There is also a variation on this dispersed pattern in which the core commercial area includes two unusually high concentrations of buildings.

    The best example of this is Beijing (14 million) where an older concentration of high-rise buildings is to the west of Tiananmen Square and the Forbidden City in a corridor along the Second Ring Road (one of Beijing’s five freeway rings or beltways), and a sixth is under discussion. The newer concentration is to the east, in a corridor along the Third Ring Road. This area includes the CCTV Headquarters and the tallest building in Beijing, the 74th floor China World Trade Center III, on the other side of the Third Ring Road. These concentrations along the ring roads resemble more the post-World War II corridor form of Central Avenue in Phoenix than Manhattan, Seattle or Pittsburgh.

    Shenyang, in Manchuria, capital of Liaoning (5 million) also has two cores in the midst of a less concentrated central area.  The larger and newer core is adjacent to Shenyang North Railway Station, while the smaller and older core is near Shenyang Railway Station.

    Suzhou, in Jiangsu (3.3 million) is well known for its canals, as the Venice of the Orient. Suzhou too has two comparatively concentrated cores on either side of the older smaller low rise core. The largest concentration is to the west, adjacent to the Grand Canal, built between 1,500 and 2,500 years ago to connect Hangzhou with Beijing (1,100 miles or 1,700 kilometers), The smaller concentration is to the east. Even so the pattern of dispersion is dominant. The urban area’s tallest building, the Henghe Tower (photo) is well away from any other buildings of significant height.

    In Xi’an (5 million), capital of Shaanxi (and a historic capital of China known as Chang’an), the two more concentrated areas sit along a north-south spine on either side of the historic walled city, which includes an older, even less concentrated business district.

    Wuhan, capital of Hubei (5 million) also fits the dual model, but this is partially due to the post-war amalgamation of three cities (Hankow, Wuchang and Hanyang), the first two of which have large and dispersed core areas, with some concentration.

    Hanghzou (capital of Zhejiang, 5 million) and Zhengzhou (capital of Henan, 2.3 million) exhibit a somewhat different pattern of the dual core superimposed upon the typical commercial dispersion. In Hangzhou, a new central business district is under development, well to the east of the older core area. A new central business district is also being developed, with major parts completed, on the periphery of Zhengzhou (the Zhengzhou "New Area"). This area was inaccurately characterized as China’s largest Ghost City by The Daily Mail (London).

    Shanghai: Shanghai (19 million) deserves special mention. A business center since the 1920s, Shanghai boasts one of China’s more concentrated central business districts, west of the Pu River (Puxi) as well as perhaps the world’s largest edge city development, across the river in Pudong. Puxi includes the famous Bund area along the river with its classic western architecture. The central business district continues westerly and to the south to beyond the north-south elevated freeway. This district has tall buildings widely dispersed throughout. Some of Shanghai’s tallest buildings are here, though few are close to one another. Pudong includes the Pearl of the Orient Tower (either loved or hated by architectural critics), the 101 story Shanghai International Financial Center and a number of other tall and unique skyscrapers (photo). This concentration, however, is separated by large streets and plazas and does not resemble the concentrated central business districts of the United States. Soon, this area will add a 128 story building, which will be the third tallest in the world (measured in feet or meters).

    Nanjing: Nanjing, the capital of Jiangsu (4 million) has a more American looking central business district, by virtue of a number of tall buildings located close together at or near the Xinjieko intersection. Yet, Nanjing’s tallest building and seventh the tallest in the world (Nanjing Greenland Financial Center) sits well to the north of Xinjieko, while the other tallest buildings are a subway stop to the east.

    Chongqing: Chongqing, a provincial level municipality, has an urban area population of 7 million. Chongqing breaks the mold, with a central business district that would be familiar to urbanites in the United States (photo). The core of Chongqing sits on a peninsula formed by the confluence of the Yangtze River and the Jailing River. It bears a resemblance to Pittsburgh, down to a plaza similar to the Golden Triangle. Close by and up a hill may be China’s only US style-central business district. Here, the streets are narrow, the buildings are tall, and there are canyons like those of pre-World War II Pittsburgh, Seattle or even Manhattan. Much of this anomaly is probably due to the constrained geography of the central area. At the same time, commercial development is crossing the Yangtze River and spread to formerly rural areas west, such as Daping and Shapingba . These areas are up to forty-five minutes from the core.

    None of this, of course, is surprising, since China, like America and elsewhere, is like nowhere else in the world.

    ———

    Note: The population figures shown for Shenzhen and Dongguan are based upon unofficial estimates that include the non-permanent (migrant) population. Official figures in these two prefectures generally include only permanent residents, who may represent 50 percent or less of the population.

    Wendell Cox is a Visiting Professor, Conservatoire National des Arts et Metiers, Paris and the author of “War on the Dream: How Anti-Sprawl Policy Threatens the Quality of Life

    Lead photo: Second Ring Road Corridor, Beijing (by Author)

    All photos by author.

  • Misunderstanding the Geography of Sydney, Paris, Mexico City, Etc.

    Sydney’s Daily Telegraph announced on April 20 that Sydney is more dense than Mexico City, London, Los Angeles and Paris. Of course, anyone who has been to Mexico City or London knows that this is untrue and it may surprise some that Sydney is not even as dense as Los Angeles.

    The article never indicates, quite for sure, what it means by Sydney, the Sydney city council area (the urban area’s core local government authority, or LGA) or the Sydney urban area. Nor does the article provide an overall density, instead only indicating that there are 8,800 persons per square kilometer in "Sydney’s east" and 7,900 per square kilometer in "Sydney City’s west."

    In fact, the figures are from the latest statistical local area estimates of the Australian Bureau of Statistics (ABS) for 2010, and dated March 31, 2011. A "statistical local area" is a part of an LGA (See map: Sydney Local Government Area). The statistical local areas cited by The Daily Telegraph are Sydney-East and Sydney-West, which have a combined density of 8,300 per square kilometer. The small size of the Sydney-East and Sydney-West statistical local areas is illustrated by the fact that each is about the same size as the Sydney Olympic Park.

    Comparing Urban Area Densities: The Daily Telegraph’s contention results from a profound misunderstanding of urban geography. The result was a comparison of urban geographies that are not comparable.

    The Daily Telegraph compares the density of these two small areas of the Sydney LGA, with the urban area densities of Mexico City (which the Daily Telegraph places at 8,400), London (5,100), Los Angeles (2,750) and Paris (3,250). These figures were taken from an earlier edition of Demographia World Urban Area. (Our latest Demographia World Urban Area data, including estimated population densities for all urban areas in the world of more than 500,000 population is here). Urban areas are areas of continuous urban development.

    The appropriate Sydney geography for comparison to the urban area populations of Mexico City, London, Los Angeles and Paris is the urban area (the international term), which is called the urban centre by ABS (See map: Sydney Urban Area).

    The Sydney urban centre covers an area extending south to Campbelltown, north to Palm Beach and well into the Blue Mountains on the Great Western Highway. According to the ABS, the Sydney urban area (urban centre) had a population of 3.641 million in 2006 (latest available data), and covered a land area of 1,788 square kilometers. This means that the population density of the Sydney urban area was 2,037 in 2006. Thus, the Sydney urban area has a lower density than all four international urban areas used in The Daily Telegraph comparison (Figure 1).

    If the Sydney urban center were as dense as the Los Angeles urban area, the population would be 5 million, instead of 3.6 million. If the Sydney urban centre were as dense as the Mexico City urban area, the population would be 15 million.

    Comparing Core Densities: The small area densities that The Daily Telegraph cites are also smaller than those that exist in the core areas of the cited international urban areas (Figure 2).

    • In Mexico City, the delegation (district) of Ixtacalco has a population density double that of the Sydney-East and Sydney West statistical local areas (approximately 17,000), in an area nearly twice as large.
    • The 2001 census placed the inner London borough of Kensington and Chelsea at 12,000 persons per square kilometer, in an area approximately the same size as Sydney-East and Sydney-West combined.
    • The ville de Paris has a population density of more than 24,000 per square kilometer, nearly three times that of the combined Sydney-East and Sydney-West statistical local areas. The ville de Paris covers approximately eight times as much land area and smaller area densities are even higher.
    • The 2000 census placed the adjacent Wilshire and Westlake Community Districts of Los Angeles at 9,000 per square kilometer. This is slightly higher than the density of the combined Sydney-East and Sydney-West statistical local areas, in an area nearly four times as large.

    The Sydney urban center and statistical local area data is summarized in the table.

    The Australian Population Debate: An important public policy debate is under way in Australia on the issue of population growth. As Ross Elliot indicated (Malthusian Delusions Grip Australia), some interests believe that the nation is running out of land. In fact, only 0.3 percent of Australia’s land area is urban, a figure one-tenth that of the United States. The starting point for these discussions needs to be valid data and an understanding of the terms involved.

    SYDNEY URBAN CENTER & DENSE STATISTICAL LOCAL AREAS
    Areas Cited by The Daily Telegraph
      2006 Population Land Area (Square Kilometers) Density 2010 Density
    Sydney-East Statistical Local Area         46,738                6.0       7,790          8,799
    Sydney-East Statistical Local Area         38,382                5.7       6,734          7,852
    Combined         85,120               11.7       7,275          8,338
    Share of Sydney Urban Area (Urban Centre) 2.3% 0.7%
    Balance of Urban Area (Urban Centre)     3,556,301          1,776.4       2,002 Not Available
    Total Sydney Urban Area (Urban Centre)     3,641,421          1,788.1       2,036 Not Available
    Notes: 
    Data from Australian Bureau of Statistics
    Urban centre data available only for census years
  • Shanghai: Torrid Population Growth

    The population of the provincial level municipality of Shanghai exceeded 22 million at the end of 2010, according to the Shanghai Population and Family Planning Commission. The population of 22.21 million exceeds the 2000 population of 16.41 million by 35 percent. This growth of nearly 6 million is more people than live in all but three Western European urban areas (Paris, London and Essen-Dusseldorf).

    Virtually all of the population gain was among migrant (non-permanent) residents who lack official Shanghai registration (Shanghai Hukou status). The migrant population rose from 5.9 million to 8.1 million, an increase of 153 percent (Estimates place the number of non-permanent urban residents of China as high as 200 million). There were 14.1 million permanent residents (with Shanghai Hukou status), a seven percent increase from the 2000 figure of 13.8 million (Figure).

    Non-permanent residents, who must have lived in Shanghai for six months to be counted, now account for 36.4 percent of the provincial level municipality’s population, nearly double the 19.4 share in 2000.

    Results are expected soon from the China national census, which began in November of 2010. Ding Jinhong, director of East China Normal University’s School of Social Development has suggested that the census may report a population as much as 23 million, with a non-permanent resident population of 9 million.

    It is estimated that the Shanghai urban area, which is wholly contained within the provincial level municipality, will have a mid-year 2011 population of 18.7 million, with a land area of 1,125 square miles (2,900 square kilometers). The Shanghai urban area, the 10th largest in the world, has a population density of 16,500 per square mile or 6,400 per square kilometer.

    This urban density is more than double that of Western European urban areas with more than 500,000, however it is less than one-fourth that of the Mumbai urban area. As in Mumbai, there has been substantial population dispersion from the core to suburban areas, with only 14 percent of growth in the urban core (generally inside the inner-ring expressway) between 1982 and 2000.

    The population density of the provincial municipality, which is analogous to a metropolitan area and includes considerable rural land, is much lower, at 9,100 per square mile (3,500 per square kilometer).

  • A Tough Week for High Speed Rail

    The week ended April 16 was particularly difficult for high speed rail, as the following events illustrate.

    1. High Speed Rail Zeroed Out of US Budget: The US federal budget deal, which cut $38 billion from spending ($76 billion annualized) zeroed out the $2.5 billion 2011 budget allocation for high speed rail and $400 million of prior spending authority from President Obama’s "stimulus" program, that had provided $8 billion for high speed rail in 2009. Approximately $2 billion of that authority remains and applications total $10 billion, mostly for conventional intercity rail services, rather than genuine high speed rail service.

    2.  Missouri Legislators Block High Speed Rail: Members of the Senate Transportation Committee in Missouri refused to place high speed rail in the annual state budget. Governor Jay Nixon is seeking more than $1 billion for intercity out of the remaining $2 billion from the original Obama Administration $8 billion program. Governor Nixon indicates that he will try to get the money placed in the budget should the US Department of Transportation award a grant. Missouri joins Florida, Wisconsin and Ohio in taking actions to block funding for high speed rail projects. This reluctance is principally the result of concerns that high speed rail will incur significant cost overruns and require operating subsidies, all of which would have to be paid for by the states, which generally face serious financial difficulties.

    3. China Slows Down Trains: Safety, energy conservation and fare equity issues led the Ministry of Railways to announce a slow-down of its fastest trains to a maximum speed of 300 kilometers per hour (186 miles per hour). This could add materially to travel times, especially in the longer corridors being developed, which traverse the greatest distance of any in the world (such as Shanghai-Kunming, Shanghai-Beijing and Beijing-Hong Kong).

    4. Opposition to Britain’s HS2 Line Intensifies: Opposition continues to mount against Britain’s HS2 line from London to Manchester and Leeds. Protesters showed up at a Department of Transport event at Northampton Station intended to obtain views on the government’s plans. Lizzy Williams, chair of "Stop HS2" expressed concern that the government’s "consultation" was not objective and told only one side of the story, ignoring the difficulties (A video of Ms. Williams at an anti-HS2 convention is here). Opposition groups also plan a rally on May 8. Finally, it was reported that projected time savings on the line have been exaggerated by the government.

  • China Slowing World’s Fastest High Speed Rail

    The Wall Street Journal reports that China will slow down its world’s fastest high speed rail trains. According to the Journal, Sheng Guangzu, head of China’s Ministry of Railways, told the People’s Daily that the decision will make tickets more affordable and improve energy efficiency on the country’s high-speed railways. The maximum speed will be 300 kilometers per hour (186 miles per hour), which is also the top speed for most high speed rail trains in Japan, France, Korea and Taiwan. The United Press reported that the 300 kph service would be limited to the four north-south (Beijing to Harbin, Beijing to Shanghai, Beijing to Hong Kong and Shanghai to Shenzhen) and east-west lines (Qingdao to Taiyuan, Lanzhou to Xuzhou, Shanghai to Chengdu and Shanghai to Kunming). Both sources were unclear as to whether the new speed limit would apply to the proposed 380 kph Beijing to Shanghai line, however that line is one of the four north-south trunk routes, all of which will operate at the slower speed according to the Ministry of Railways.

    Currently, the world’s fastest high speed rail trains operate on the Guangzhou (South Station) to Wuhan route, which reaches 350 kilometers per hour on its fastest service (which stops in Changsha, the non-stop service having been cancelled), completing the run in 3:16. This lower speed could increase travel time on the route to between 3:30 and 3:45.

    The Journal cited a high-speed rail official (not Chinese) who indicated that there are safety concerns with trains running at above 320 kph. In contrast, the proposed California high speed rail line would operate at top speeds of 355 kph.

    Photo: Nanjing high speed rail train, Shanghai Station (by author)

  • The Evolving Urban Form: Dallas-Fort Worth

    The Dallas-Fort Worth metropolitan area (Note 1), which corresponds to the Dallas-Fort Worth urban area, provides a casebook example of expanding urbanization. Dallas-Fort Worth has been one of the fastest growing major metropolitan areas in the nation for decades. Dallas-Fort Worth was among only three US metropolitan areas adding more than 1,000,000 residents between 2000 and 2010. Only Houston’s addition of 1,230,000 exceeded that of Dallas-Fort Worth, which grew by 1,210,000, a 23.4 percent growth rate. Atlanta was the third metropolitan area to add more than one million residents, at 1,021,000. During the 2000s, Dallas-Fort Worth passed Philadelphia to become the nation’s fourth largest urban area, with a population of 6,372,000. Only New York, Los Angeles and Chicago are larger.

    On an international scale, the United Nations estimates indicate that only Singapore, Houston and Atlanta had greater percentage growth between 2000 and 2010 among high-income world urban areas that exceed 4,000,000 in population.

    The Core: The core of the metropolitan area experienced the earliest growth and has since seen its share of growth and its growth rate decline significantly. Dallas County, which includes the historical core municipality of Dallas (Note 2), had a growth rate of 6.7 percent between 2000 and 2010, approximately one third less than the national growth rate of 9.7 percent. Nearly all of the growth in Dallas County was outside the city of Dallas, which added only 0.8 percent to its population, less than one-tenth of the national rate. The city of Dallas added 9,000 residents, while the suburbs within Dallas County added 140,000 residents.

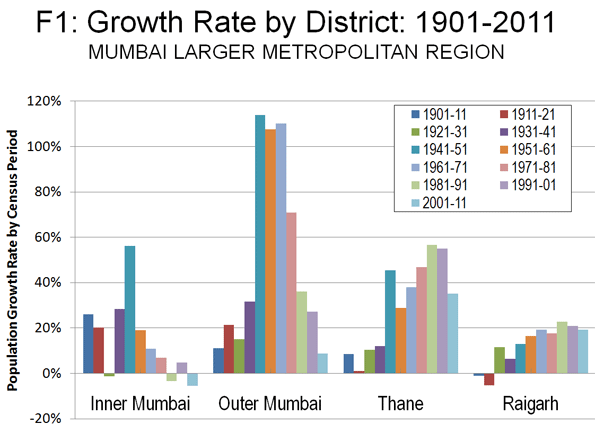
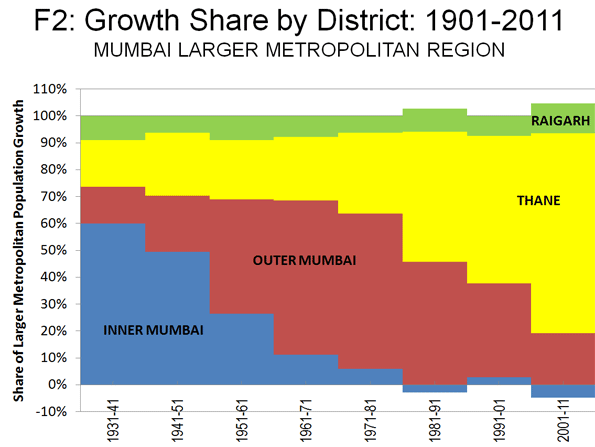
    Overall, Dallas County accounted for 12 percent of the metropolitan area’s growth between 2000 and 2010. This is down from 41 percent between 1950 and 2000. Between 1900 and 1950, Dallas County accounted for an even larger share (66 percent) of growth (Figure 1). Dallas County’s annual growth rate fell from 4.1 percent between 1900 and 1950 to 2.6 percent between 1950 and 2000 to 0.7 percent in the last decade (Figure 2).


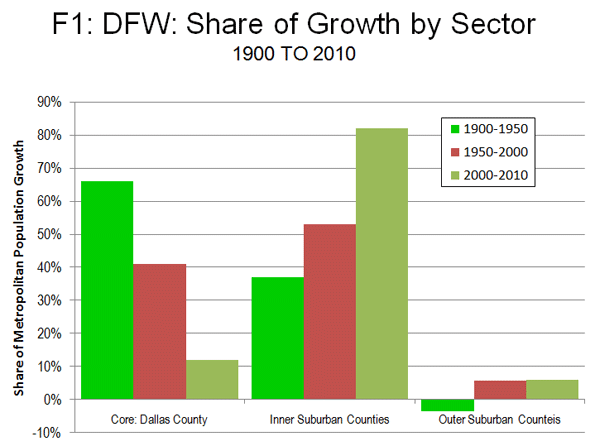
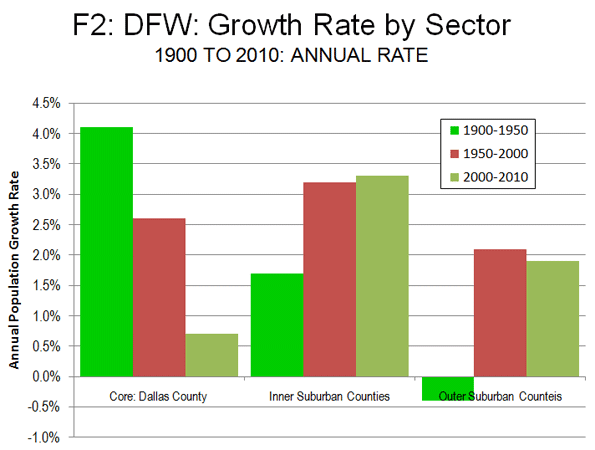
    Inner Suburban Counties: During the 2000s, the greatest growth was experienced in the inner suburban counties (those abutting the core county, Dallas). These six counties (Collin, Denton, Ellis, Kaufman, Rockwall and Tarrant, where Fort Worth is located) experienced a population gain of 38.9 percent. Inner suburban counties now contain 56 percent of the metropolitan area population. Between 2000 and 2010, the inner suburban counties captured 82 percent of the metropolitan area, up from 53 percent between 1950 and 2000 and 38 percent between 1900 and 1950. The inner suburban counties grew 1.7 percent annually from 1900 to 1950, increasing to 3.2 percent between 1950 and 2000 and 3.3 percent in the 2000s.

    Outer Suburban Counties: The outer suburban counties represent a comparatively small portion of the metropolitan area’s population. These five counties (Delta, Hunt, Jasper, Parker and Wise) accounted for only 7 percent of the metropolitan area population. The 2000 to 2010 growth rate was 20.9 percent, somewhat below the metropolitan area rate of 23.4 percent, and more than double the national population growth rate of 9.7 percent national growth rate.

    Between 2000 and 2010, the outer suburban counties captured 6 percent of the metropolitan area growth, the same share as between 1950 and 2000. However, perhaps surprisingly, their combined 1950 population was 19 percent below that of 1900. This illustrates the declining fortunes in the early part of the 20th century of counties that were dominated by agriculture, as the farm population and population of many small farm dependent communities declined. Of course, the 1900 to 1950 losses have since been compensated many times over by the post 1950 suburbanization. Nonetheless, one outer suburban county, Delta is unique in continuing to lose population through the 2010 census. Delta County’s 2010 population of 5,200 is approximately one third of its 1900 population of 15,200.

    The outer suburban counties lost 0.4 percent of their population annually from 1900 to 1950, but turned around to gain 2.1 percent from 1950 to 2000. Between 2000 and 2010, the growth rate fell back to 1.9 percent.

    The City of Dallas: The historical core municipality of Dallas illustrates of the dynamics of aggressive annexation policies. In 1910, Dallas covered only 16 square miles (41 square kilometers) and had a population of 92,000. Even at this early date, the city of Dallas was not very dense, with 5,700 residents per square mile (2,200 per square kilometer). The city reached its peak density of 7,300 (2,800 per square kilometer) in 1940, after having expanded to 41 square miles (106 square kilometers) and a population of 295,000.. Even at this peak density, the city of Dallas remained well below the densities of other core cities, especially in the East and Midwest, most of which had densities exceeding 10,000 per square mile (3,900 per square kilometer).

    By 1950, the city had expanded to 112 square miles (289 square kilometers) and with a population of 334,000, the population density had fallen to 3,900 (1,500 per square kilometer). Larger annexations were to follow, with the city reaching 343 square miles (885 square kilometers) by 2010. With a population of 1,198,000, the population density was 3,500 per square mile (1,350 per square kilometer), less than one-half the 1940 peak. Virtually all new owned housing was built consistent with the post-World War II suburban form, as occurred in metropolitan areas around the nation. The city’s addition of 9,000 residents between 2000 and 2010 was far less than the 182,000 gain between 1990 and 2000. By 2000, there was little greenfield land left to develop in the city and the population could be peaking. Indeed, the population could decline in future censuses, as has happened in geographically constrained urban cores around the world. Any such decline could, however, be counteracted by immigration, as has occurred in some urban cores.

    Ethic Trends in the Metropolitan Area: As would be expected in a state bordering Mexico, the Latino population of Dallas-Fort Worth grew substantially between 2000 and 2010, at a 43 percent rate. Overall, Latinos accounted for 42 percent of the metropolitan area’s growth. The Latino population increase was nearly 520,000, more people than live in the core city of Atlanta.

    However, unlike a number of other metropolitan areas, there was strong growth in the African-American population, which added 33 percent to its count. African-Americans accounted for 19 percent of the metropolitan area’s growth.

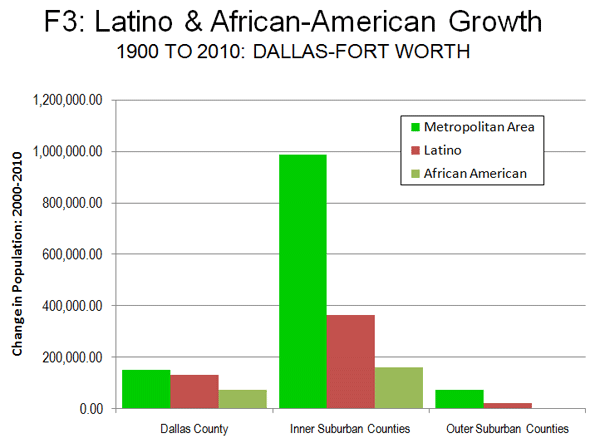
    This growth was strongest in the core county of Dallas, where Latino and African-American growth made up for a decline in the rest of the population.  In the inner suburban counties, 53 percent of the growth was Latino or African-America, while the lowest share of Latino and African American growth was in the outer suburban counties, at 30 percent.

    Overall, 75 percent of Latino growth and 69 percent of African-American growth took place in the suburban counties, which is a substantial change from the past (Figure 3).

    The Urban Area: Urban area data has not been released from the 2010 census. However, it is clear that Dallas-Fort Worth has become less dense since 1950. Between 1950 and 2000, the population density of the urban area declined approximately 10 percent.   Even so, it is surprising to some that the Dallas-Fort Worth urban area, with its low-density reputation, was only 12 percent less dense that Portland urban area in 2000, despite the aggressive densification strategies employed by Portland.

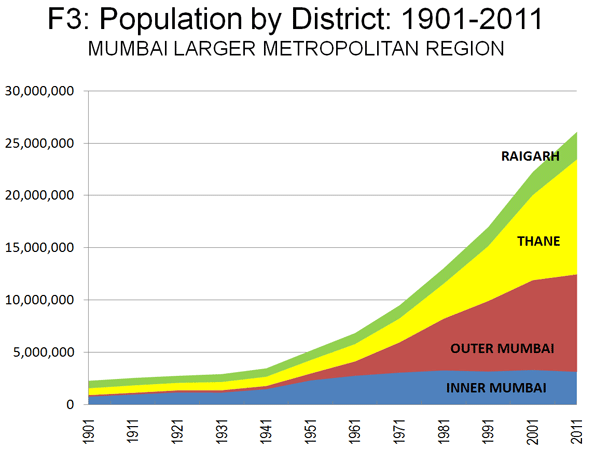
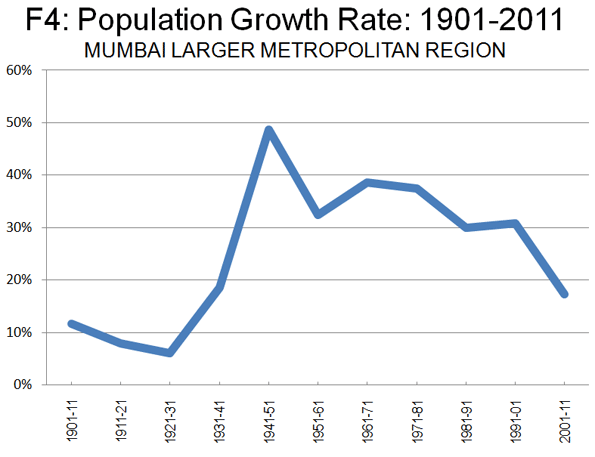
    The Expanding Metropolitan Area: The story in Dallas-Fort Worth is little different (Table) from what has emerged in metropolitan areas around the world, in places like Seoul, Mexico City and Mumbai. Dallas-Fort Worth also illustrates a trend only now becoming more obvious, that middle-sized and smaller metropolitan areas are generally growing faster than the megacities within their own countries (see the report by the McKinsey Global Institute). The United States has two megacities, the New York metropolitan area, which grew 3.1 percent from 2000 to 2010 and Los Angeles, which grew 3.7 percent. Dallas-Fort Worth’s far higher growth rate of 23.4 percent translated into an actual population increase of 175,000 more than the combined increase of the two megacities, despite their having five times the population.

    Dallas-Fort Worth: Population Trend by Sector and County 
    1900-2010
    1900 1950 2000 2010
    CORE COUNTY
    Dallas County       82,756    614,799  2,218,899  2,368,139
    INNER SUBURBAN COUNTIES    222,747    527,281  2,596,623  3,585,286
    Collin County       50,087      41,692    491,675    782,341
    Denton County       28,318      41,365    432,976    662,614
    Ellis County       50,059      45,645    111,360    149,610
    Kaufman County       33,376      31,170      71,313    103,350
    Rockwall County         8,531        6,156      43,080      78,337
    Tarrant County       52,376    361,253  1,446,219  1,809,034
    OUTER SUBURBAN COUNTIES    149,302    120,754    346,022    418,348
    Delta County       15,249        8,964        5,327        5,231
    Hunt County       47,295      42,731      76,596      86,129
    Johnson County       33,819      31,390    126,811    150,934
    Parker County       25,823      21,528      88,495    116,927
    Wise County       27,116      16,141      48,793      59,127
    METROPOLITAN STATISTICAL AREA    454,805  1,262,834  5,161,544  6,371,773

    The Future? It is an open question whether the rapid growth of Dallas-Fort Worth will continue. As it continues to grow, the stagnation that now afflicts the nation’s two megacities and its near-megacity, Chicago could spread to Dallas-Fort Worth. On the other hand, Dallas-Fort Worth has advantages that could permit its growth to continue for multiple decades into the future. Texas has a favorable business climate, low taxes and less heavy handed regulation than New York, California and Illinois. Dallas-Fort Worth has plenty of developable land as well as a political culture not cowed by development. The economic advance of its growing population, particularly the burgeoning Latino population, depends upon public policies that favor housing affordability and urban expansion. If it continues on its current course, Dallas-Fort Worth could pass the Chicago metropolitan area in population by 2050 and could even challenge Los Angeles later in the century.

    —-

    Note 1: As currently defined by the Census Bureau. Officially titled the Dallas-Fort Worth-Arlington metropolitan statistical area. Metropolitan areas are essentially labor markets and include a principal urban area and rural (non-urban) areas and may include smaller urban areas.

    Note 2: Fort Worth is not considered a historical core municipality, based upon the discussion in Perspectives on Urban Cores and Suburbs, though the Census Bureau considers Fort Worth and Arlington to be principal cities (which are a different thing). The "Dallas-Fort Worth" terminology is used because of its wide acceptance and to make the geographical expanse of the metropolitan area more clear.

    Wendell Cox is a Visiting Professor, Conservatoire National des Arts et Metiers, Paris and the author of “War on the Dream: How Anti-Sprawl Policy Threatens the Quality of Life

    Photo by Trey Ratcliff

  • The Evolving Urban Form: Mumbai

    The continuing dispersion of international metropolitan areas is illustrated by recently released 2011 Census of India preliminary data for the Mumbai "larger" metropolitan area. The historical core, the "island" district of Mumbai (Inner Mumbai) lost population between 2001 and 2011, while all growth was in suburban areas outside the historic core. Indeed, since 1981, Inner Mumbai lost 140,000 residents, while suburban areas gained 13.2 million.

    The larger metropolitan area is defined by district boundaries, the census division level below that of the state. The Mumbai Metropolitan Region Development Authority has a more "tight" definition, composed of smaller administrative units (municipalities), however that data is not yet available on the internet (Note). The larger metropolitan area includes four districts, two of which compose the city of Mumbai, Inner Mumbai (the historic core), and Outer Mumbai. The larger metropolitan area also includes the district of Thane, which is to the east and north of Mumbai and the district of Raigarh, which is to the south of Mumbai. The overwhelming majority of growth outside the city of Mumbai has been in Thane, which is accessible by land and bridge to Mumbai. Raigarh is less accessible from Mumbai and requires travel through Thane to reach.

    The historic population trends of these four districts are described below. The evolution of the Mumbai urban form is illustrated by the following:

    (1) The population growth rate peaked first in the core, Inner Mumbai, Outer Mumbai later and then fell substantially. Recent growth has been concentrated in the outlying districts of Thane and Raigarh. Figure 1 shows the population growth rate by district for each decade since the 1901 census.

    (2) Much of the population growth was in Inner Mumbai until 1961. From 1961 through 1981, the bulk of the population growth moved to Outer Mumbai. By the 1981 to 1991 period, Thane emerged to virtually equal Outer Mumbai in its share of growth and has been dominant since 1991. Figure 2 indicates the share of the larger metropolitan area growth by district since 1901.

    (3) The population of Inner Mumbai has risen comparatively little since 1961, with nearly all growth occurring first in Outer Mumbai and later in Thane. These two suburban areas now account for 90 percent of the larger metropolitan area population, double the 44 percent of 1961. Figure 3 illustrates the actual population, by district, of the larger metropolitan area from 1901 to 2011.

    Inner Mumbai: The historic core (Inner Mumbai) registered 3.146 million residents, down from 3.327 million in 2001. The historic core now contains only 12 percent of the larger metropolitan area population, down from 40 percent in 1961, adding approximately 375,000 residents during that forty year stretch. Overall, since 1960, the island district has captured only 2 percent of the larger metropolitan area growth. This contrast with the period before 1951; Inner Mumbai had captured approximately 60 percent of the larger metropolitan region population growth between 1931 and 1941, and 49 percent between 1941 and 1951. However, Inner Mumbai’s share dropped to a 26 percent share in 1951 to 1961 and an 11 percent share in 1961-1971. This is consistent with the overall trend in urban core population growth in metropolitan areas around the world, with population stalling or even declining once there is little greenfield land remaining for development. Inner Mumbai had lost population in the 1981-1991 census period, however recovered to reach its population peak in 2001. The 2011 population for Inner Mumbai was the lowest since the 1971 census. These population losses have occurred despite an unprecedented building boom of high-rise residential towers.

    Outer Mumbai: The Mumbai Suburban district (Outer Mumbai) became a part of the city of Mumbai through a 1950 consolidation. As Inner Mumbai became fully developed, population growth shifted sharply to Outer Mumbai. By 2011, Outer Mumbai grew to 9.33 million residents, an increase of 7.95 million from its 1961 total of 1.38 million. Outer Mumbai captured 41 percent of the larger metropolitan area growth from 1961 to 2011. However, as the supply of greenfield land has been reduced, Outer Mumbai’s growth has also slowed considerably. In each of the three decades from 1941 to 1971, Outer Mumbai grew by more than 100 percent. Outer Mumbai attracted only 19 percent of the larger metropolitan area growth, down from a 58 percent peak in the 1971-1981 period. The 2001-2011 increase of 744,000 (8.7 percent) was the lowest since the 1951-1961 census period, and was substantially below the 27.2 percent from rate from 1991 to 2001.

    Thane: During the last 10 years, Thane has become the largest district in the Mumbai larger metropolitan area, with a population of 11.1 million, passing Outer Mumbai. Thane is now the largest district in India. In 2001 Thane had 8.1 million residents in 2001 and grew 35 percent to 2011. This, however, is down from a 55 percent growth rate between 1991 and 2001, reflecting a decline in the overall growth rate of the larger metropolitan area (see below). Thane has steadily increased its share of growth in the larger metropolitan area, from 24 percent between 1961 and 1971 to 55 percent between 1991 and 2001. Thane reached a peak in the 2001-2011 census period, capturing 74 percent of the larger metropolitan area growth. Since 1961, Thane has captured 49 percent of the growth in the larger metropolitan area and added 9.4 million residents. In each of the last two census periods, Thane has added 2.9 million residents, equal nearly to the population of the urban core, Inner Mumbai.

    Raigarh: More remote from the core, Raigarh has experienced considerably slower growth than Thane, and until recently slower than Outer Mumbai. Raigarh grew 19 percent, from 2.21 million in 2001 to 2.64 million in 2011, an increase of 19 percent. This was the only census period since 1901 in which Raigarh grew more quickly than Outer Mumbai. Raigarh accounted for 11 percent of the larger metropolitan area growth between 2001 and 2011 and 8 percent since 1960. Raigarh added approximately 1.575 million residents from 1961 to 2001, more than four times that of larger Inner Mumbai (the urban core).

    Overall Population Growth: Consistent with the general population growth rate declines witnessed in less affluent nations, the Mumbai larger metropolitan area is growing less quickly than in previous decades. Between 2001 and 2011, the area grew 17.3 percent, which is down from 30.9 percent between 1991 and 2001.  The greatest growth had been between 1941 and 1951 (49 percent), with rates from 30 percent to 39 percent in each of the decades from 1951 to 1991 (Figure 4).

    Mumbai: Penultimate Density, Yet Representative: The core urban area (area of continuous urban development) of Mumbai represents approximately 80 percent of the larger metropolitan area population. Mumbai is the third most dense major urban area in the world at nearly 65,000 residents per square mile (25,000 per square kilometer), trailing Dhaka (Bangladesh) and Hong Kong. Yet even at this near penultimate density, Mumbai exhibits the general trends of dispersion and declining density that are occurring in urban areas around the world, from the most affluent to the least. In the two Mumbai city districts, as in other megacities, housing has become so expensive that population growth is being severely limited. Overall, the Mumbai larger metropolitan area may also be experiencing slower growth as smaller metropolitan areas outperform larger ones, a trend identified in a recent report by the McKinsey Global Institute. Finally, the over-crowded, slum conditions that prevail for more than one-half of the city’s residents could be instrumental in driving growth to more the distant suburbs of Thane and Raigarh.

    —-

    Note: This "larger metropolitan area" definition is consistent with the cruder US Bureau of the Census delineation for metropolitan areas, which is based upon counties (in 44 states), rather than tighter definitions, such as municipalities or census tracts.

    Photo: Chhatrapati Shivaji Terminus, formerly Victoria Terminus, Mumbai (by author)

    Wendell Cox is a Visiting Professor, Conservatoire National des Arts et Metiers, Paris and the author of “War on the Dream: How Anti-Sprawl Policy Threatens the Quality of Life

  • United States: Less Congestion than Europe per INRIX

    A new international report indicates that traffic congestion in the United States is far better than in Europe. The report was released by INRIX, an international provider of traffic information in 208 metropolitan areas in the United States and six European nations.

    The report shows that the added annual peak hour congestion delay in the United States is roughly one-third that of Europe. The rate of France was somewhat less than twice the rate of the US and rates in Luxembourg, the United Kingdom, Germany and the Netherlands were three times as high.

    In the United States, peak period traffic congestion adds 14.4 hours annually per driver. This compares to an average delay per year of 39.5 hours for the European nations. Luxembourg, the United Kingdom, the Netherlands and Germany had the greatest lost time, at from 42 to 47 hours. Again, France scored the best in Europe, at 24.1 hours of lost time in traffic per year (Figure).

    Among individual metropolitan areas. Los Angeles had the greatest peak hour delay, at 74.9 hours annually. Utrecht (Netherlands), Manchester (United Kingdom), Paris, Arhem (Netherlands) and Trier (Germany) second through sixth in the intensity of traffic congestion, all with 65 or more hours of delay per driver per year.

    These findings are consistent with international data indicating that traffic congestion tends to be more intense where there are higher urban population densities.

  • Zhengzhou Ghost City Alive!

    Zhengzhou, Henan, China (March 28, 2011): In December, London’s Daily Mail reported that the Zhengzhou New Area was China’s largest “Ghost City.” A visit to the Zhengzhou New Area indicates exactly the opposite. Chinese “Ghost Cities” are large areas of new development that are virtually unoccupied. The most famous example is Ordos, a new and reportedly empty city, built to replace an older city in Inner Mongolia.

    Zhenghou is an urban area of approximately 2.5 million population and is the capital of Henan province. The Zhengzhou New Area is located in the northeastern quadrant of Zhengzhou. It is circular in design, with two parallel roads, high-rise condominium buildings on the inner ring and commercial buildings on the outer ring. The interior of the circle includes the Henan Arts Center and a skyscraper that is under construction. A new high speed rail station is under construction to serve the new Guangzhou to Beijing line. The station is to be one of the largest in Asia.

    Our visit revealed anything but a Ghost City. Granted, no-one would mistake the traffic for Beijing Third Ring Road volumes, but virtually all of the parking spaces were taken and there was traffic on the streets (Figure 1). That ultimate indicator of Chinese urbanization, the availability of frequent taxicab service was well in evidence. Two of the city’s bus rapid transit lines serve the interior circle road, again indicating a substantial threshold of non-ghost urbanization.

    There were people on the sidewalks, though not the numbers typical of an older, more dense section of a Chinese urban area (Figure 2). It was clear from the laundry hanging in glass enclosed patios that many of the condominiums were occupied, though it is to be expected that many would not be, given the Chinese propensity to invest in multiple residential properties (a tendency the central government seeks to curb). Many of the commercial skyscrapers were occupied, and some were still under construction. There are also shopping centers, small stores and fast food restaurants.

    Zhengzhou New Area is intended by the developers to become the new central business district for Zhengzhou. There is much more planned than this first phase. Eventually, the Zhengzhou New Area is intended to cover 105 square kilometers (41 square miles), generally further to the northeast. City maps already show the planned street pattern, not unlike 19th century maps of some US cities.

    In short, the Zhengzhou New Area is alive and not a Ghost City. It may well be that it took longer than expected for the place to come alive. But it is clear that the life of the Zhengzhou New Area began more than four months ago.