Author: Wendell Cox

  • Pittsburgh: Metropolitan, Suburban and Core Losses

    Just released census data indicates that the Pittsburgh metropolitan area declined in population from 2,431,000 in 2000 to 2,356,000 in 2010, a loss of 3.1 percent. The loss reflects a continuing trend of regional declines. The present geographical area of the Pittsburgh metropolitan area has a population below that of 1930 and has lost 400,000 residents (at percent) since 1960. No other major metropolitan area has experienced a loss since 1960 (including Katrina ravaged New Orleans).

    Both the historical core municipality, the city of Pittsburgh and the suburbs declined. The suburbs experienced a loss of 2.2 percent, but accounted for 61 percent of the metropolitan area loss. All six suburban counties except Butler (5.6 percent) and more distant Washington (2.4 percent) experienced losses. The core county of Allegheny (which includes the city of Pittsburgh) lost 4.6 percent of its population and nearly 80 percent of the metropolitan area’s numeric population loss.

    The city of Pittsburgh continued its long decline, falling to 306,000 in 2010 from 335,000 in 2000, a loss of 8.6 percent. The city accounted for 39 percent of the metropolitan area population loss. Pittsburgh’s population peaked in 1950 at 677,000 and has fallen 55 percent since that time. Its 2010 population is lower than in any previous census since 1880 (based upon the combined population of Pittsburgh and Allegheny, which subsequently consolidated).

  • Columbus: Suburban and Core Gains

    The Columbus (Ohio) metropolitan area increased in population from 1,613,000 in 2000 to 1,837,000 in 2010 (13.9 percent). This growth rate is likely to have been among the strongest in the Midwest and is greater than the growth rate of Seattle, which had grown more quickly in recent decades.

    The historical core municipality, the city of Columbus, which is largely suburban in form, grew from 713,000 to 787,000, an increase of 10.4 percent. The city of Columbus captured 33 percent of the metropolitan area’s growth.

    The suburbs experienced a growth rate of 16.7 percent and captured 67 percent of the metropolitan area growth. Suburban Delaware County had a population increase of 58 percent, while more distant counties, Union (28 percent) and Fairfield (19 percent) also experienced strong growth. The core county of Franklin, which includes the city of Columbus, grew nine percent.

  • Cleveland: Huge Core Loss Overwhelms Suburban Gain

    The Cleveland metropolitan area population fell from 2,148,000 in 2000 to 2.077,000 in 2010, according to the just released 2010 census figures. All of the loss was attributable to the city of Cleveland. However, population growth in the suburbs was small.

    The 2010 census data indicates that the city of Cleveland lost 16.9 percent of its population between 2000 and 2010, the largest loss yet reported by a historical core municipality (excluding Hurricane Katrina ravaged New Orleans). Cleveland dropped from 477,000 in 2000 to 397,000 in 2010. The city of Cleveland reached its population peak of 914,000 in 1950 and has since fallen 57 percent.

    The suburbs added 10,000 residents, for a growth rate of 0.6 percent. This small gain was insufficient to offset the loss of 80,000 residents in the city of Cleveland and the metropolitan area suffered a population loss of 3.3 percent.

    The core county of Cuyahoga (which includes the city of Cleveland) declined 114,000 residents, for a loss of 8.2 percent. All of the four suburban counties gained, with by far the largest gain (14 percent) in Medina County.

  • City of Philadelphia Gains, Dispersion Continues

    For the first time since the 1950 census, the city of Philadelphia has registered a gain in population. In 2010, the city had 1,526,000 residents, up 8,000 from the 1,518,000 in 2000. The city had reached its population peak of 2,071,000 in 1950 and even with the increase since 2000 remains below its population as recorded in the 1910 census. The city (the historical core municipality) accounted for three percent of the metropolitan area growth.

    Overall, the Philadelphia (Pennsylvania, New Jersey, Delaware and Maryland) metropolitan area grew 4.9 percent, from 5,687,000 t o 5,946,000 residents. While this is modest growth relative to the national rate of 10 percent, the Philadelphia metropolitan area grew faster than the Los Angeles metropolitan area (3.7 percent), which had outgrown Philadelphia in every census period during the 20th century.

    The suburbs added 6.5 percent to their population and captured 97 percent of the population growth. Outer suburban Cecil County, Maryland grew the fastest, at 18 percent, while outer suburban Chester County added the most new residents (65,000) and grew 15 percent. Gloucester County, New Jersey also grew quickly, at 13 percent.

  • Los Angeles: Slowest Growth Since Late 1800s

    Just released 2010 Census data indicates that the city of Los Angeles and Los Angeles County experienced their smallest numeric population growth since the 1890 to 1900 census period.

    The city of Los Angeles had been expected to top 4,000,000 population by 2010 and the California State Department of Finance had placed the population at nearly 4,100,000 as of January 1, 2010. In fact, however the census count for April 1, 2000 was 3,793,000, up 98,000 from 3,695,000 in 2000. This means that the State Department of Finance estimated four new residents for every one actual new resident between 2000 and 2010 (We had previously questioned the aggressive population projections released by the State Department of Finance in an Orange County Register op-ed,  60 Million Californians: Don’t Bet on It). The lowest number of people added in a previous census period to the population of the city of Los Angeles was 52,000, between 1890 and 1900, with growth from 50,000 to 102,000.

    Los Angeles County, by far the largest in the nation, was expected to top 10,000,000 residents by 2010, and the State Department of Finance had estimated a population of 10,441,000. In fact, the census count for Los Angeles County was 9,819,000, up 300,000 from 2000. According to Bureau of the Census estimates, Los Angeles County grew much more strongly early in the decade, achieving more than three-quarters of its decadal growth by 2003. After that, the population dropped at did not recover to above the 2003 level until 2008. The population growth rate came to a near halt as housing prices escalated during the housing bubble. The State Department of Finance population estimate placed the population increase between 2000 and 2010 at more than double that counted by the Census Bureau. The lowest number of people added in a previous census period to the population of Los Angeles County was 69,000, between 1890 and 1900, with growth from 101,000 to 170,000.

    The other county in the Los Angeles metropolitan area, Orange, also experienced record low growth. Orange County grew from 2,846,000 to 3,010,000 residents, adding just 164,000 to its population. Not since the 1940 to 1950 period was growth so slow, when the population rose 75,000, from 131,000 to 216,000.

    Overall, the Los Angeles metropolitan area grew a lethargic 3.7 percent from 2000 to 2010. This is the slowest growth rate among the 26 metropolitan areas for which data has been reported (with the exception of New Orleans, which lost population due to Hurricane Katina). By comparison, Los Angeles metropolitan area growth between 1990 and 2000 was 9.7 percent. Both slow growing St. Louis (4.2 percent) and Chicago (3.9 percent) grew faster than Los Angeles.

    The historic core municipality of Los Angeles attracted 21 percent of the metropolitan area growth, while the suburbs attracted 79 percent of the growth. The suburbs grew 6.2 percent, while the city of Los Angeles grew 2.6 percent.

  • Population Dispersion Continues in Riverside-San Bernardino, San Diego and Sacramento

    Population growth continued the strongest in the suburban areas of Riverside-San Bernardino, San Diego and Sacramento, while unusually strong growth occurred in the historical core municipalities, all of which are dominated by a suburban urban form.

    Riverside-San Bernardino: Riverside-San Bernardino experienced by far the fastest growth of any metropolitan area in California, at 30 percent from 2000 to 2010. This growth rate placed the metropolitan area otherwise known locally as the "Inland Empire" fourth in growth rate among the 26 reporting major metropolitan areas, behind Raleigh, Las Vegas and Austin. The Riverside-San Bernardino metropolitan area grew from a population of 3,255,000 in 2000 to 4,225,000 in 2010. At the growth rates of the past decade, Riverside-San Bernardino would pass San Francisco, to become the state’s second largest metropolitan area by 2012.

    Riverside-San Bernardino is virtually an all suburban metropolitan area. The historical core municipality of San Bernardino grew 11.4 percent, from 188,000 in 2000 to 210,000 in 2010, capturing two percent of the metropolitan area growth. Suburban areas accounted for 98 percent of the growth.

    San Diego: The San Diego metropolitan area grew 10 percent from 2000 to 2010, rising from 2,814,000 to 3,095,000. This growth rate was nearly double or more than that of the other major coastal metropolitan areas in California (Los Angeles, San Francisco and San Jose). Even so, the actual population count was approximately 130,000 below the California State Department of Finance estimate. We had previously questioned the aggressive population projections released by the State Department of Finance in an Orange County Register op-ed, 60 Million Californians: Don’t Bet on It).

    The historical core municipality grew 6.9 percent from 1,223,000 to 1,307,000 and, as in 2000 is the nation’s eighth largest municipality (having been passed by San Antonio and having passed Dallas). The city of San Diego, with a largely suburban urban form, attracted 30 percent of the metropolitan area population growth. The California State Department of Finance estimate for the city was much higher, at 1,376,000, indicating an estimate of two new residents for every actual resident counted.

    Sacramento: The Sacramento metropolitan area grew strongly between 2000 and 2010, at 19.6 percent. The population rose from 1,797,000 to 2,149,000, adding more new residents than the much larger combined metropolitan areas of San Francisco and San Jose.

    The historical core municipality of Sacramento grew from 407,000 to 466,000 (a gain of 14.6 percent) and accounted for 17 percent of the metropolitan population growth. Suburban areas grew 21.1 percent and accounted for 83 percent of the metropolitan area growth.

  • Bay Area Growth Slowing

    New 2010 Census data indicates that the two major metropolitan areas in the San Francisco Bay Area, San Francisco and San Jose, have settled into a pattern of slow growth.

    San Francisco: The San Francisco metropolitan area grew 5.1 percent between 2000 and 2010, a more than one-half drop from the 1990 to 2000 rate of 11.9 percent, from 4,124,000 to 4,335,000, for a gain of 211,000. Only in one decade (1970 to 1980) have the five counties of the metropolitan area gained at such a slow percentage rate.

    The historical core municipalities of San Francisco and Oakland gained 20,000 residents, from 1,176,000 to 1,196,000. San Francisco reached a population of 805,000, up from 777,000 in 2000. As in the case of both the city of Los Angeles and Los Angeles County, the State Department of Finance estimate (857,000) was well above the Census Bureau population count (We had previously questioned the aggressive population projections released by the State Department of Finance in an Orange County Register op-ed,  60 Million Californians: Don’t Bet on It). Even with this increase, however, the city of San Francisco remains below its population peak of 827,000, recorded in a 1945 special census, according to the Census Bureau.

    The city of Oakland declined in population from 399,000 to 391,000. The historical core municipalities grew 1.7 percent, compared to the 6.5 percent growth rate of the suburbs. The historical core municipalities captured nine percent of the metropolitan area growth, with 91 percent of the growth going to the suburbs. The State Department of Finance estimate, at 430,000, was more than 10 percent above the actual Census Bureau count. The city of Oakland also reached its population peak of 401,000 in a 1945 special census.

    While San Francisco remains the second largest metropolitan area in the state (after Los Angeles), this distinction could soon be lost. Riverside-San Bernardino registered a population of 4,225,000 and at growth rates of the last decade, would pass San Francisco by 2012.

    San Jose: The San Jose metropolitan area grew 5.8 percent between 2000 and 2010, from 1,736,000 to 1,837,000. The historical core municipality of San Jose rose 5.0 percent, from 901,000 in 2000 to 946,000 in 2010. San Jose captured 44 percent of the metropolitan area growth, the highest figure among the reporting metropolitan areas except for the largely suburban historic municipality of Oklahoma City (47 percent). The State Department of Finance had estimated the city of San Jose population at 1,023,000 in 2010, indicating that its growth estimate for the decade was more than 2.5 times the increase indicated in the census count.

    The suburbs of the San Jose metropolitan area grew 6.7 percent and accounted for 56 percent of the population growth.

  • New Jersey: Still Suburbanizing

    The state of New Jersey virtually defines suburbanization in the United States.  New Jersey is not home to the core of any major metropolitan area but, major portions of the nation’s largest metropolitan area (New York) and the fifth largest metropolitan area (Philadelphia) are in the state (See map). These two metropolitan areas comprise 17 of the state’s 21 counties. Another county (Warren) is in the Allentown, Pennsylvania metropolitan area, while Atlantic (Atlantic City), Cumberland and Cape May are single-county metropolitan areas. No one, however, should make the mistake of imagining that New Jersey is wall to wall suburbanization. In the 2000 census, more than 60 percent of the state’s land area was rural, with urban areas (areas of continuous urban development) making up less than 40 percent of the state’s land area, while 94 percent of the 2000 population was urban (which includes suburban).

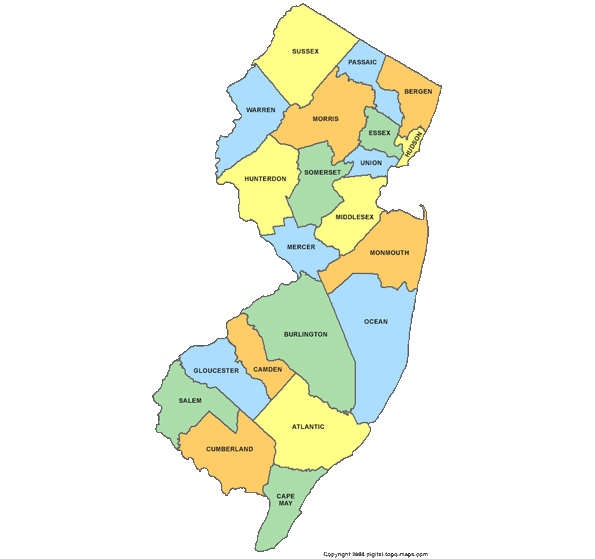
    Map courtesy of Passaic Public Library

    The recently released 2010 census data indicates that the dispersion of New Jersey population, which was underway by 1900 and continued apace in the last decade.

    New Jersey’s Larger Municipalities: This is not to suggest that it was a bad decade for the larger municipalities in the state. However, the 20th century was not kind to New Jersey’s largest municipalities. At some point during the century, six municipalities reached a population of 100,000 or more. Four of these municipalities were near the city of New York and were eventually engulfed by its suburbanization (Newark, Jersey City, Paterson and Elizabeth). Another, Camden, was engulfed by Philadelphia’s expansion and the last, the state capital Trenton, is midway between the cores of the two metropolitan areas and has more recently become a part of the New York metropolitan area.

    The new decade started out better for these municipalities. Newark, Jersey City, Elizabeth and Camden gained population between 2000 and 2010. However, even after the population gains, Newark’s population remains 165,000 (37 percent) below its 1930 peak. Jersey City remains 70,000 (22 percent) below its 1930 peak, despite the growth of a new financial district just across the Hudson River from lower Manhattan. Camden remains approximately 35,000 (37 percent) below its 1950 peak. Of the four municipalities gaining population, Camden did the best, adding 6.9 percent to its population, a full 50 percent above the statewide increase of 4.5 percent.

    Paterson and Trenton posted small population losses. Trenton remains nearly 45,000 (33 percent) below its 1950 peak (Table 1).

    Table 1
    New Jersey Municipalities Achieving 100,000 Population
    Census Population Peak
    Municipality 2000 2010 Change % Change Population Year
    Newark      273,946    277,140       3,194 1.2%     442,337 1930
    Jersey City      240,055    247,597       7,542 3.1%     316,715 1930
    Paterson      149,222    146,199      (3,023) -2.0%     149,227 2000
    Elizabeth      120,568    124,969       4,401 3.7%     124,969 2010
    Trenton        85,403      84,913         (490) -0.6%     128,009 1950
    Camden        78,672      84,136       5,464 6.9%     124,555 1950
    Total      947,866    964,954     17,088 1.8%   1,285,812
    Balance of State   7,466,484  7,826,940    360,456 4.8%
    New Jersey   8,414,350  8,791,894    377,544 4.5%   8,791,894 2010


    Elizabeth and Paterson however have been far more successful in retaining their population than other older municipalities, both in New Jersey and around the nation. Both Elizabeth and Paterson have become majority Hispanic and have a sizeable African American community. They also have a large immigrant community.  In Elizabeth, 45 percent of the population is foreign born, almost four times the national rate. Paterson has an immigrant population of 25 percent.  

    The Older Suburban Counties: Nonetheless, even with the modest population reversals in four of the five municipalities in the Philadelphia and New York metropolitan areas, their corresponding older suburban counties grew slower than the rest of the state in the 2000s. Combined, Camden, Essex, Hudson, Passaic and Union counties – fast growing suburbs of the early 1900s – grew at a rate of 1.6 percent, compared to the statewide growth rate of 4.5 percent, capturing 12 percent of the statewide growth.  (Table 2).

    Table 2
    New Jersey County Population Growth by Area
    Area 2000 2010 Change % Change Share of Growth
    5 Older Suburban Counties  2,923,130  2,969,617    46,487 1.6% 12.3%
    Balance of NY & Phila Metropolitan Counties  4,887,467  5,184,873  297,406 6.1% 78.8%
    Outside NY & Phila Metropolitan Area     603,753     637,404    33,651 5.6% 8.9%
    Total  8,414,350  8,791,894  377,544 4.5% 100.0%
    Note: 5 Older Suburban Counties Include Camden, Essex, Hudson, Passaic and Union


    The Newer Suburban Counties: The bulk of New Jersey’s growth has taken place, as in the rest of the country, in more newly suburbanizing counties of the Philadelphia and New York metropolitan areas (Note 1). The growth rate in these counties was 6.0 percent, well above the statewide growth rate of 4.5 percent. Overall, the outer suburban counties accounted for 73 percent of the state’s population growth during the 2000s. The strongest growth was in Ocean County, which is at the furthest distance (fifty to one hundred miles) from New York City.  Ocean County grew 13 percent, adding 66,000 people to its population, nearly one-fifth of the state population gain. Gloucester County, in the Philadelphia area also grew 13 percent, adding 33,000 to its population. Ocean and Gloucester accounted for more than one-quarter of New Jersey’s population growth. Only one other county added more than 50,000 people, Middlesex, which is adjacent to the New York City borough of Staten Island in New York, much of which is made up of postwar suburbanization.

    Counties Outside the Large Metropolitan Areas: The counties outside the New York and Philadelphia metropolitan area, Atlantic, Cape May, Cumberland and Warren added 5.6 percent to their population and nine percent of the state’s population gain. The largest growth was in Atlantic County (8.7 percent) and Cumberland County (6.1 percent), both adjacent to counties of the Philadelphia metropolitan area. Cape May County had the largest population loss in the state, at 4.9 percent (Essex County, where Newark is located, lost 1.2 percent, the only other county to lose population).

    Small Area Analysis: The dispersion of the population is also illustrated by "place" data, which includes incorporated municipalities (Note 2) and "census designated places."

    Generally, newer housing reflects the distance of suburbs from the urban core. Gaining a larger share of population growth, this demonstrates a primarily  suburban, rather than urban core oriented, expansion.  An analysis of the more than 500 places (municipalities and "census designated places") indicates that the greatest share of New Jersey’s growth is in new suburban areas.

    Among places in which housing has a median construction date of 1945 or earlier, there was a 0.8 percent reduction in population. The growth rate then rises with each 10 year increment, reaching 4.0 percent in places with a median construction date of 1976 to 1985 and 11.1 percent for places with a median construction date of later (though this is the smallest category).

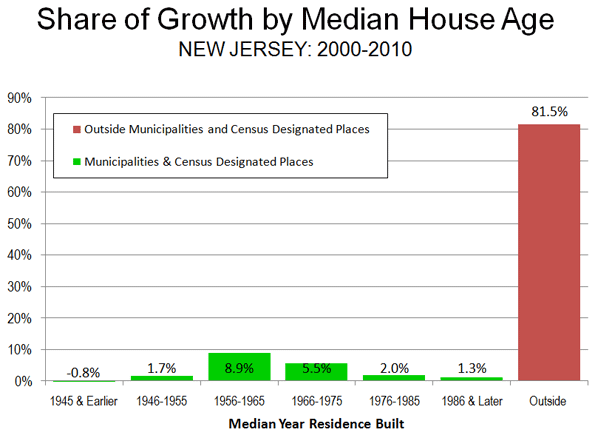
    However, the growth in these places accounts for only 18.5 percent of the state’s population gain. The other 81.5 percent was outside the incorporated municipalities and the census designated places. This population is generally in the state’s townships, some of which are older (such as North Bergen or Woodbridge), but most of which are much newer.  However, much of the growth in the townships was in newer areas, with 84 percent in areas with median construction dates of 1966 or later (Note 3)

    Thus, all-metropolitan New Jersey is becoming more suburban, while older, major municipalities such as Newark, Jersey City and Camden are enjoying a welcome respite from their generally steep declines.

    Note 1: These counties include Bergen, Burlington, Cumberland, Hunterdon, Mercer, Middlesex, Monmouth, Morris, Ocean, Salem, Somerset and Sussex.

    Note 2: New Jersey township officials have been engaged with the Census Bureau in a dispute over whether New Jersey townships should be considered incorporated. This analysis uses the "non-incorporated" status as defined by the Census Bureau, without taking a position on the nature of the disagreement.

    Note 3: The Census Bureau routinely makes changes to "census designated places" between censuses. As a result it is not possible to reconcile the township and place totals to the state total. There is a discrepancy of approximately 1.5 percent. This discrepancy is small enough to make the township figures generally reflective of the median construction dates.

    Wendell Cox is a Visiting Professor, Conservatoire National des Arts et Metiers, Paris and the author of “War on the Dream: How Anti-Sprawl Policy Threatens the Quality of Life

  • Major Metropolitan Areas: Summary of the First 20

    Data is now available for 20 of the nation’s 52 metropolitan areas with more than 1,000,000 population. The early results indicate a pattern of accelerating dispersion of the population to the suburbs as is indicated in the table below. Thus far, historic core municipality growth has been approximately one-half the 1990s rate. During the 2000s, the historic cores have accounted for 8.8 percent of metropolitan growth, down nearly one-half from the 1990s rate.

    Summary of 2010 Census Results
    Major Metropolitan Areas (Over 1,000,000 Population)
    Historical Core Municipalities
    Suburbs
    Metropolitan Areas
    2000-2010
    Population Gain 682,000 7,047,000 7,729,000
    Percentage Increase 6.7% 23.7% 17.7%
    Share of Growth 8.8% 91.2% 100.0%
    1990-2000
    Population Gain 1,229,000 6,718,000 7,948,000
    Percentage Increase 10.8% 30.5% 23.7%
    Share of Growth 15.5% 84.5% 100.0%
    Includes 20 of 52 metropolitan areas released by 3-3-2010

  • Kansas City MO-KS: Moving Toward Kansas?

    Results just announced for the 2010 Census show that the Kansas City metropolitan area grew 10.8 percent from 2010, from 1,836,000 to 2,035,000 persons. As in all of the major metropolitan areas (over 1,000,000 population) for which data has been reported, the bulk of the growth was in the suburbs, rather than in the historical core municipality (Kansas City).

    The suburbs captured 91 percent of the metropolitan area growth, with a growth rate of 13.0 percent. Nearly one-half of the metropolitan area growth was in Johnson County, Kansas. The Kansas City metropolitan area is unusual among bi-state metropolitan areas, because the population is relatively evenly split between Missouri (location of the historical core municipality) and Kansas, with 58 percent in Missouri and 42 percent in Kansas.

    The historical core municipality of Kansas City gained 4.1 percent, from 442,000 to 460,000. Based upon the 2009 Census estimates, this population was approximately 24,000 lower than expected. The 2010 population remains below the 1970 peak of 507,000 and is only marginally above the 1950 figure (457,000). However, in 1950, the density of the city was substantially higher, contained in a land area of 81 square miles. Kansas City now covers nearly four times as much land area, at 314 square miles. A large portion of Kansas City is actually rural and thus outside the urban area (See 2000 urban area map). This open land provides the city of Kansas City with greenfield land for new suburban development. The suburban development within Kansas City, however, has been substantially less than in other suburban areas of the metropolitan area.

    Kansas City, Kansas, which was also developed around a pre-World War II core, had a population decline from 147,000 to 146,000.

    The continuing dispersion of the Kansas City metropolitan area is indicated by the employment trends from 2001 to 2010 (June). Employment was down 22,000 in the metropolitan area. However, employment was down 42,000 in Jackson County, which includes the urban core of the region (the non-suburban portion of Kansas City). All employment growth has been in the suburbs (20,000).