Author: Wendell Cox

  • What’s in a (Metropolitan Area) Name?

    Only two of the world’s megacities (metropolitan areas or urban areas with more than 10 million people) have adopted names that are more reflective of their geographical reality than their former core-based names. It is likely that this will spread to other megacities and urban areas as the core jurisdictions that supplied the names for most become even less significant in the dispersing urban area.

    The first metropolitan area to make a change was Jakarta which became "Jabotabek," a title derived from the names of four major municipalities in the metropolitan area, Jakarta, Bogor, Tangerang and Bekasi. However, since that name did not include letters from the fifth largest municipality, Depok, the metropolitan area is sometimes called Jabodetabek. But adding a couple of letters for municipalities could lead to an exceedingly long name. For example, a new municipality of South Tangerang was recently created, representing the sixth municipality with nearly 1,000,000 people or more in Jabotabek. Presumably there will be those who will insist on calling the metropolitan area Jabodetabekst, a more Russian than Indonesian sounding name.

    Further, a large part of the metropolitan area is not in one of the six larger municipalities and instead is in one of the many smaller jurisdictions. There is thus the potential of the name even longer than the present world record holder, "Taumatawhakatangihangakoauauotamateahaumaitawhitiurehaeaturipuk-
    akapikimaungahoronukupokaiwhenuakitanatahu
    ," which is the 105 letter name of a hill in the Hawks Bay area of New Zealand.

    The second mega-city with a new name is the Mexico City area. Mexico’s national statistics bureau, the Instituto Nacional de Estadística y Geografía (INEGI) has designated the Mexico City metropolitan area as the "Zona Metropolitana del Valle de México," which translates to the Valley of Mexico metropolitan area.

    Alternate names for metropolitan areas or urban areas are not unusual. One of the earliest may have been the "Southland," a name apparently given to the Los Angeles area or Southern California many decades ago by the Los Angeles Times. There are Tri-State areas, such as New York and Cincinnati and Seattleites refer to the Puget Sound area. However all of these names have varying definitions depending upon who is using them and none directly corresponds to the boundaries of either an urban area or a metropolitan area.

    Perhaps better defined is the Randstad area of the Netherlands, which includes at least the urban areas of Amsterdam, Rotterdam and The Hague. However this area is too large to be considered a single metropolitan area or a single urban area.

    Similarly, there is the Pearl River Delta, made up of Hong Kong, Shenzhen, Dongguan, Guangzhou, Foshan, Jiangmen, Zhongshan, Zhuhai and Macau. This area of virtually continuous urbanization is by far the largest in the world, but does not qualify as a metropolitan area or an urban area because each one of the jurisdictions is essentially a separate labor market. Further, despite the fact that Hong Kong and Macau are a part of China, the border controls between Shenzhen and Hong Kong and Zhuhai and Macau make it structurally impossible for those areas to merge into single labor markets.

    The Yangtze River Delta is another accurate title for a large area of urbanization. This includes the city/province of Shanghai, and up to 14 city/prefectures, such as Nanjing, Suzhou, Ningbo, Yangzhou and Hangzhou. However, as in the case of the Pearl River Delta each of these represents a separate labor market and urban area.

  • Tampa to Orlando High Speed Rail: The Risk to Local Taxpayers

    No sooner had Florida Gov. Rick Scott rejected federal funding for the Tampa to Orlando high-speed rail line, than proponents both in Washington and Tallahassee set about to find ways to circumvent his decision. While an approach has not been finalized, a frequently suggested alternative is to grant the federal money to a local government, such as a city or county or even to a transit agency.

    Eliminating State Taxpayer Risks, Creating Local? In an announcing his decision, Governor Scott cited the substantial risks to Florida taxpayers from cost overruns, the ongoing obligation under the federal grant to subsidize operations and the fact that under certain circumstances Florida might even have to repay the $2.4 billion in federal grants. Any local government accepting the federal money would expose itself to the financial risks from which Florida taxpayers have been exempted by Governor Scott’s action.

    None of these risks is an idle threat.

    (1) Capital Cost Overruns: Based upon the international experience, the eventual construction cost overruns for the Tampa to Orlando high-speed rail line could easily run to $3 billion, more than doubling the price of the project (Note on Extent of Taxpayer Liability, below). In light of the recently reported 50 percent increase in California high-speed rail construction costs, even the $3 billion estimate could turn out to be conservative. The problem is that any local federal grant recipient (city, county or transit district) would be responsible for these cost overruns.

    (2) Ongoing Operating Subsidies: The ridership projections for the Tampa to Orlando high-speed rail line are exceedingly optimistic. This could well lead to a situation in which substantial subsidies are necessary to operate the trains, despite claims of proponents to the contrary. These subsidies would be the responsibility of any city, county or transit district that becomes a grant recipient.

    (3) Federal Pay-Back: If, for any reason, the eventual high-speed rail service levels are not sufficiently high because of lower than projected ridership or if service is canceled, any city, county or transit district could be required to return the $2.4 billion in federal grants. Florida is already paying millions annually for a similar "transgression." In 2009, service reductions on the Tri-Rail Commuter Rail System in the Miami area led the Obama Administration’s Department of Transportation to demand repayment of one quarter billion dollars in grants. Tri-Rail was saved from this obligation only by a multimillion dollar Tallahassee bailout. Proponents have claimed that this rail obligation could be negotiated away for high-speed rail. Why was the Tri-Rail obligation not negotiated away in 2009?

    By rejecting the federal funding, Gov. Scott has inoculated Florida taxpayers against these risks.

    However, there would be no inoculation for any local jurisdiction whose commissioners or city council accepted the expensive "gift" of federal funding for the high speed rail line. Their taxpayers would have to pay. The very financial viability of any such jurisdiction could be at risk.

    The Risk Could Revert to State Taxpayers: Eventually, the risk could be again be visited upon state taxpayers as a local government facing virtual bankruptcy would doubtless seek a bailout in Tallahassee, repeating the Tri-Rail experience, though much more expensively. Moreover, canceling a half built project, which might be tempting as costs escalate above projections, would simply not be viable. The political pressure to complete the project, at whatever cost, could prove to be overwhelming.

    Delusions About Private Responsibility for Cost Overruns: Some proponents claim that these huge obligations can be somehow transferred to the private builder/operator that is selected for the project. Nothing like this has ever happened in public-private partnerships around the world, and for good reason. Companies do not stash away billions of dollars for cost overruns.

    Further, the winning bidder will be a consortium of other companies, established with limited liability by larger companies. The consortium would abandon a project it could not afford sooner rather than later. Any bankruptcy of the builder/operator would be limited to the consortium and would not extend to the parent companies, leaving the local taxpayers to pay.

    There is no escaping the fact that the taxpayers of any city or county accepting the federal money would be providing financial guarantees to an international infrastructure industry that has left a "train" of huge and unanticipated financial obligations around the world in its wake (Note on Cost Escalation, below).

    Believing in Santa Claus? Public officials, and most recently Orlando Mayor Teresa Jacobs, have indicated support for high-speed rail if private and federal funds pay for it, and state and local taxpayers aren’t exposed to liability. This is a wise position, but untenable. Expect Santa Claus to arrive in the midst of a Florida summer before that, with a sleigh full of billions.

    —-

    Note on Extent of Taxpayer Liability: This $3 billion is in addition to the already committed $280 million of taxpayer funding. Proponents of the high-speed rail line have assumed that the $280 million would be the limit of taxpayer obligations. As this article shows, the $280 million could be a "drop in the bucket" compared to the likely eventual taxpayer liability.

    Note on Cost Escalation: An international team of researchers led by Oxford University Professor Bent Flyvbjerg has found in Megaprojects and Risks: An Anatomy of Ambitionthat similar projects routinely cost far more than taxpayers and other funders are told. They also attract fewer riders and generate less revenue (which can require operating subsidies). The Flyvbjerg team implies that these "lowball" (our term) projections are not accidental but all are the result of "strategic misrepresentation," (their term) which project promoters employ to increase the potential that projects will be approved. The researchers also refer to "strategic misrepresentation" as "lying," which is an exceedingly strong term for academic research and is reflective of the strength of the conclusions.

  • The Evolving Urban Form: Seoul

    Based upon the preliminary results of the South Korea 2010 census, Seoul has become the world’s third largest metropolitan area. The jurisdictions making out the metropolitan area, the provincial level municipality of Seoul (which is the national capital), the province of Gyeonggi and the provincial level municipality of Incheon now have a population of approximately 23.6 million people. This is third only to Tokyo – Yokohama, which has a population of approximately 40 million and Jabotabek (Jakarta), which is approaching 30 million. While international metropolitan area population estimates should be taken with a "grain of salt," (Note 1: Metropolitan Areas) the rise of Seoul is nearly unprecedented in the high-income world. Further, many more people are projected to move to the Seoul metropolitan area as the trend of rural and smaller area migration to larger urban areas continues.

    A Difficult History: However, any analysis of Seoul and its progress must begin in the context of the overall economic progress of South Korea and its difficult history.

    Seoul was a major battleground in the Korean War of 1950 to 1953. During 1950 alone, military control of the municipality of Seoul changed hands four times. Today, despite the precariousness of the political situation on the Korean Peninsula, the northern suburbs of Seoul are as close as four miles (seven kilometers) from the demilitarized zone, which forms the border with North Korea. 

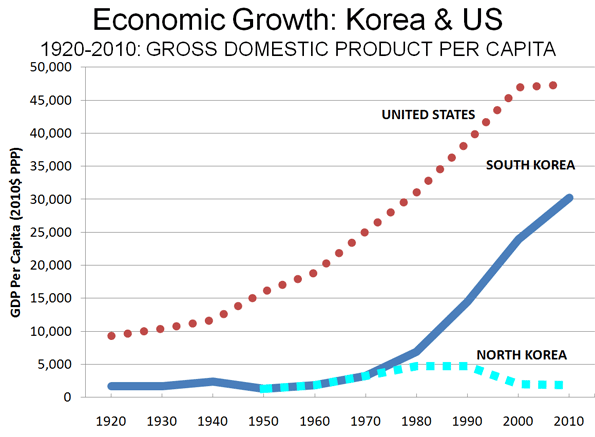
    Strong Economic Growth: A very poor country even before the war, South Korea has been an economic success story. Based upon data produced for the Organization for Economic Cooperation and Development by the late economist Angus Maddison, South Korea had a gross domestic product per capita (purchasing power parity) of less than $1300 (2010$) in 1950. It had peaked, as a Japanese colony, somewhat above that level before World War II, but never approached one quarter of the GDP per capita of the United States and averaged less than one third of then high income Argentina.

    After the Korean War, initial economic progress was slow. As late as 1965, South Korea’s GDP per capita was less than that of Mozambique. Since that time, South Korea’s GDP per capita has risen from approximately $2000 to $30,200 in 2010 It exceeded Argentina in the 1980s.  

    South Korea today has a higher GDP per capita than Spain and New Zealand and less than 10 percent behind the European Union, on which it is gaining quickly. As the capital, the Seoul is a prosperous metropolitan area in a prosperous country.

    South Korea’s prosperity is also considerable contrast to that of North Korea’s. South Korea’s GDP per capita is more than 15 times that of North Korea (Figure 1). This would make any future reunification far more expensive for South Korea then Germany’s unification was for West Germany, because the economic disparity, though substantial, was much less.

    The Urban Area: Growing and Dense: The Seoul urban area (area of continuous development) includes the municipality of Seoul and also includes the urbanization of Incheon, to the west and substantial suburban development in the province of Gyeonggi on the other three sides (Note 2: Urban Areas). Based upon an analysis of data from the 2010 census, we have estimated the Seoul urban area population at 22.5 million. The next edition of Demographia World Urban Areas: Population & Projections (current edition) will show Seoul to be the world’s third largest urban area, trailing only Tokyo-Yokohama and Delhi (which recently passed Mumbai to become India’s largest urban area). Jakarta, the second largest metropolitan area, ranks as the fourth largest urban area, though will soon pass Seoul, because of much stronger growth. Among high income world urban areas, Seoul’s population growth has been greater than that of any other since 1950 except for Tokyo-Yokohama. Seoul added more than 20 million people, while Tokyo-Yokohama added more than 25 million people. By comparison, New York added less than 10 million people and Paris added 4 million people.

    Seoul’s population density is among the highest of the world’s affluent urban areas. With population density of 27,000 people per square mile (10,400 per square kilometer), Seoul ranks second in the high income world among urban areas of more than 5 million people, trailing only Hong Kong, which is more than twice as dense. Thus, Seoul is more than twice as dense as Tokyo-Yokohama, three times as dense as Paris and four times as dense as Los Angeles or Toronto, the densest urban regions in North America.

    With the exception of Hong Kong, no first world urban area has the density of high rise condominium developments as are found in Seoul. While virtually all of the recent urban expansion in both population and geography has been in the suburbs, nearly all of the new residences are in high rise buildings.

    Seoul is also the home to massive city real estate developments. For example, Ilsan, in Gyeonggi is a very large planned high-rise community to the north of the Han River (which bisects the urban area), west of Seoul and north of Icheon. Most of Ilsan was developed by the early 2000s. The high rise development of Songdo, four miles (seven kilometers) south of the core of Incheon is intended to be home to 75,000 people and 50 million square feet of office space.

    Seoul’s Han River is crossed by multiple bridges, including architectural icons. A new international airport (Seoul-Incheon) was opened in 2005, 43 miles (70 kilometers) away from the Seoul central business district. This airport, on an island west of Incheon is most remote international Airport among the world’s megacities (urban areas over 10 million population), 8 miles further even than Narita International Airport from central Tokyo. Domestic flights continue to operate out of Gimpo Airport, which is halfway between the cores of Seoul and Incheon.

    Distribution of Population Growth: The municipality of Seoul – the capital district – is one of the largest municipalities in the world, with nearly 10 million people (Note 3: Municipalities). However, like many core municipalities that have not expanded their boundaries, Seoul is losing population. The 2000 census shows the population to have declined 900,000, or nearly 10 percent, from 1990. The population loss during the 2000s was a somewhat more modest 200,000.

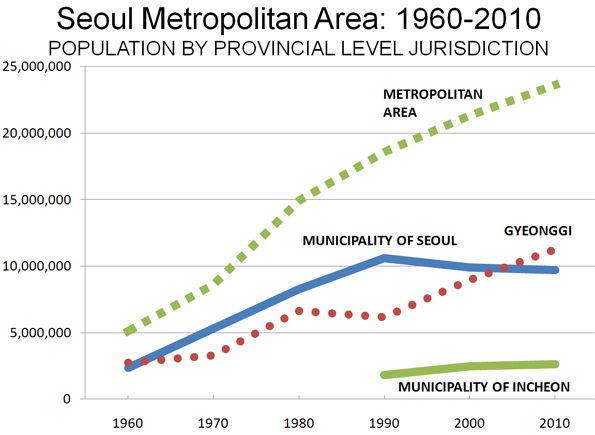
    Since 1990, all the population growth in the Seoul metropolitan area since has been in the suburbs. The province of Gyeonggi has gained more than 5 million residents, while the municipality of Incheon has added more than 800,000 residents.  During the 2000s, the province of Gyeonggi added enough population to exceed the municipality of Seoul as the largest provincial level jurisdiction in the metropolitan area (Table).

    Seoul Metropolitan Area Population: 1960-2010
    Year Metropolitan Area Provincial Level Jurisdiction
    Seoul Gyeonggi Incheon
    1960 5.1 2.4 2.7  
    1970 8.6 5.3 3.3  
    1980 14.9 8.3 6.6  
    1990 18.6 10.6 6.2 1.8
    2000 21.4 9.9 9.0 2.5
    2010 23.6 9.7 11.3 2.6
    In Millions
    Incheon created from Gyeonggi in 1981


    The Future? There is also some question about whether Seoul will remain the national capital. In 2004, the national government decided to move the capital to Gongju, 90 miles (150 kilometers) south of Seoul. The decision was both preceded and followed by considerable political jockeying and it appears that the government is backtracking on the capital move (though construction has begun).

    Regardless of the eventual fate of the new capital, Statistics Korea projections indicated that the Seoul metropolitan area will continue to expand. The population of the municipality of Seoul is expected to decline through 2030 while the suburban jurisdictions of Incheon and Gyeonggi are expected to continue their growth. Further, more rapid growth is anticipated in North Chungcheon and South Chungcheon provinces as the metropolitan area, and perhaps even the urban area spreads further to the south. This larger metropolitan area is projected to grow to more than 31 million people by 2030.

    —-

    Note 1: Metropolitan Areas: Metropolitan areas are the economic dimension of the urban form. They represent the labor markets (area from which people commute to the urban area) and thus include both the urban area and surrounding economically attached rural and exurban areas. There are no international standards for delineating metropolitan areas and most national statistical agencies have no such delineation. The nations that do giving me metropolitan areas have differing standards and even within nations there are substantial difficulties. The only serious attempt to define metropolitan areas based upon consistent standards was by urban expert Richard L. Forstall (who ran the Rand McNally "Ranally" international metropolitan area program), Richard P. Green and James B. Pick. The complexity of the research is indicated by the fact that their list is limited to the top 15 in the world. Other attempts to delineate metropolitan areas generally rely on complete second or third level jurisdictional boundaries, such as counties, states or provinces. This can lead to specious comparisons of densities, because the jurisdictions that are used vary so much in size. This is perhaps best illustrated by comparing Portland and Riverside – San Bernardino. In 2000 (latest available data), the Riverside – San Bernardino urban area had a densities slightly higher than that of Portland. Yet the metropolitan areas vary greatly in size, due simply to the size of the counties that comprise them. The two counties of the Riverside – San Bernardino metropolitan area cover four times as much land area as the seven county Portland metropolitan area.

    Note 2: Urban Areas: urban areas are the structural dimension of the urban form (the "urban footprint"). Urban areas are the area of continuous urban development. They may also be called urbanized areas (such as United States, United Kingdom, France, India and Canada); urban centers (Australia) or urban agglomerations (United Nations). Canada will switch its terminology for urban areas to "population centres" in the 2011 census. The distinction between urban areas and metropolitan areas can be confusing and has led some internet – based lists to somewhat indiscriminately mix the two. Moreover, the term "urban area" has even been used to denote an area well beyond the continuous urbanization (more akin to a metropolitan area), such as in its definition by statistics New Zealand.

    Note 3: Municipalities: international comparisons of municipalities (often called "cities," which is a term that can also be used for two substantially different concepts, metropolitan areas and urban areas) are generally invalid, because there is no geographic or population criteria between or even within nations by which municipalities are defined. This is illustrated by the fact that the world’s largest municipality, Chongqing is largely rural, not urban, and covers an area approximately the size of Austria or Indiana. While the municipality of Chongqing (and virtually all other Chinese "cities") is larger than its metropolitan area, municipalities may be far smaller than their metropolitan areas. For example, the municipality of Melbourne ("city of Melbourne") has less than 2 percent of the metropolitan area population, while the municipality of Atlanta has less than 10 percent of the metropolitan area.

    Note 4: The United Nations population estimates show the Seoul urban area to be limited to the municipality of Seoul which produces a far smaller estimate of less than 10 million people.

    —–

    Photo: Suburban Seoul (by author)

    Wendell Cox is a Visiting Professor, Conservatoire National des Arts et Metiers, Paris and the author of “War on the Dream: How Anti-Sprawl Policy Threatens the Quality of Life

  • City of Chicago Falls to 1910 Population Level.

    The Bureau of the Census has just reported that the city of Chicago lost more than 200,000 people between 2000 and 2010. At 2,696,000, this takes Chicago to its lowest population since 1910, and nearly 1,000,000 fewer than its census population peak of 3,621,000 in 1950. In 1910, the city had a population of 2,185,000, and increased in 1920 to 2,702,000.

    The Bureau of the Census had estimated Chicago’s population at 2,851,000 in 2009, down from the 2000 census count of 2,897,000. Chicago is the seat of Cook County, which lost 180,000 between 2000 and 2010, though outside the city of Chicago, Cook County gained approximately 20,000 residents.

  • A More Objective Attitude Toward the Suburbs (Almost)

    It is always encouraging to see greater objectivity in the treatment of the suburbs. In fact, the urban form includes not only the urban core, but also the suburbs and economically connected rural areas and exurban areas that are beyond the urban footprint. This fact has often been missed by some urbanologists who imagine no city extends beyond the view on the foggiest day from a central city office tower.

    William Upski Wimsatt, author of Bomb the Suburbs, has now published an update called Please Don’t Bomb the Suburbs. The title of Wimsatt’s original book, focusing on grafitti and hip-hop culture, has a ring reflective of the irrational and ideological condemnation that has been far too typical of some of the urban planning community.

    Wimsatt cites five myths about suburbs in a Washington Post opinion piece. To be charitable, he gets as many as four of them right. These include his discovery that suburbs are not white middle-class enclaves, that they can be "cool," that they are not necessarily politically conservative, and that suburbanites care about the environment.

    However, Wimsatt still has some distance to go. His last myth suggests that suburbs are not the result of the free market. This general proposition is tenable, for example, given large lot zoning requirements, which have caused many urban areas to consume far more land than they would have if the market had been allowed to operate. The problem with Wimsatt’s free-market analysis is his acceptance of three additional myths.

    Myth 1: Smart Growth Reduced Property Taxes in Portland: Wimsatt cites an analysis indicating that property taxes in Portland dropped between the mid-1980s and the mid-1990s while property taxes in Atlanta increased. He uses this "factoid" to imply that Portland’s more restrictive land use planning regime ("compact development" or "smart growth") is superior to the more liberal Atlanta approach. Wimsatt does not note that during this period the voters of Oregon implemented their own Proposition 13 type property tax reduction (Measure 5), which lowered property taxes even as per capita revenue rose at a greater rate in Oregon than in Georgia. To be fair, Wimsatt cannot be blamed for this oversight, since the Sierra Club source he cited omitted this detail. We refuted a larger analysis by Arthur C. (Chris) Nelson that included this claim 10 years ago, in a paper for the Georgia Public Policy Foundation entitled American Dream Boundaries: Urban Containment and its Consequences.

    Myth 2: Suburban Infrastructure is More Costly: Wimsatt claims that the cost of infrastructure and public services is higher in suburbs than in the urban core. Joshua Utt and I put this myth to rest in research covering all of the reporting municipalities in the US government database, which indicated no such higher costs (The Costs of Sprawl: What the Data Really Show). The claims of higher infrastructure and service costs in the suburbs are largely based on theoretical studies, which invariably suffer from the "length of pipe" fallacy, which fails to take into consideration the substantial differences in the costs of infrastructure construction in already developed areas versus greenfield areas. In fact, labor costs tend to be less in suburban areas. Moreover, much of the cost of suburban development is paid for by home owners, who reimburse developers who have already paid much of the sewer, water and street construction costs. These are not costs to the public or to society, they are costs that buyers voluntarily pay for what they consider to be a better lifestyle. Finally, Core city infrastructure is often obsolete and not able to adequately serve the higher demand that would occur from substantial population increases.

    Myth 3: Consolidating Local Government Saves Money: Wimsatt presumes that consolidation of local governments is a way to reduce public expenditures. He cites the case of towns in New Jersey, which he would prefer to see combined. Despite the fact that ivory tower before-the-fact analysis routinely concludes that larger, consolidated local governments are spend less per capita than smaller governments, the record says exactly the opposite. Our research, using US government, New York, Pennsylvania and Illinois state databases shows a consistent relationship between larger local governments and higher expenditures per capita and higher debt per capita.

    This should not really be so surprising, since larger governments tend to be further from the people and by definition more remote from their control. Where voters are less important, as is the case with larger local governments, special interests fill the vacuum, generally to the detriment of taxpayers.

    With this diluted control by voters, larger governments tend to get into financial difficulty, and a vicious cycle of excessive spending and debt can follow. Often unable to say no to spending interests, they raise taxes. When the electorate loses tolerance for higher taxes, larger governments tend to borrow, which increases expenditures even more. Finally, when they reach high debt levels, it is not unusual for there to be proposals to consolidate these governments with their smaller neighbors, which have been more fiscally prudent. If consolidation is implemented, the new larger local government is granted a new lease on fiscal irresponsibility, and per capita expenditures and debt is likely to rise even higher.

    As if that were not enough, labor contracts and service levels are routinely "harmonized" at the highest cost, since employees will not be forced to take pay or benefit cuts and service levels will generally not be reduced for residents. This was cited by the Toronto Business Alliance after a theoretical $300 million in promised cost savings were transformed into substantially higher spending in the newly consolidated city.

    Welcome: Wimsatt graciously ends his commentary by saying "Everyone with a prejudice against the suburbs will have to get over it. Even me." Welcome, Mr. Wimsatt.

  • “Patchwork” High Speed Rail System Unraveling?

    The widely dispersed opposition to proposals for high speed rail (genuine and faux) led Secretary of Transportation Ray LaHood to say that the Administration would press forward in a patchwork fashion if necessary.

    "Patchwork" may be an overstatement. House Appropriations Committee Chairman Hal Rogers (R., Ky.) has plans to eliminate high speed rail funding in the current fiscal year. Already, holes have appeared in the high-speed rail plans with the cancellation of the Milwaukee to Madison line by Gov. Scott Walker and the cancellation of the Cincinnati to Cleveland line by Gov. John Kasich.

    Should the Republican congressional high speed rail defunding proposal survive, it will could put an end to such proposals as the Miami to Orlando high-speed rail line, which has been advertised as an $8 billion project but which international experience suggests could easily reach $16 billion.

    Further, the proposed defunding could render California’s presently planned San Joaquin Valley "train to nowhere" (Corcoran to Borden, with stops in Hanford and Fresno) as less than patchwork. The California line was already on life support, with the newest estimates indicating a 50 percent cost increase over two years (to $65 billion), bringing overall per mile cost escalation since the initial 1999 estimate to approximately 100 percent (adjusted for inflation). As these difficulties were not enough, the Community Coalition on High Speed Rail reports that agricultural interests are now raising concerns about the impact of construct in the San Joaquin Valley. Strong citizen opposition has already developed on the San Francisco peninsula and in the Los Angeles area, which may have been part of the reason that the California High Speed Rail Authority chose the "train to nowhere" route as its first segment.

    This could also make it unlikely that there will be any new funding for the Chicago to St. Louis high-speed rail line, which requires at least another $2 billion to complete the trip in four hours (at an average speed of 75 miles per hour). In fact, four hour service was promised in the US Department of Transportation documentation that accompanied the previous $1 billion grant.

    It will probably also be the end of the $12 billion (more likely $25 billion) proposal to scrap the 75 mile per hour Chicago to St. Louis system after it is completed and replace it with a completely new, faster line that would travel twice as fast.

    A number of commentators (including this author) have suggested that zeroing out high-speed rail is a litmus test of the resolve of Congress to control spending. The first steps may have been taken.

  • Petrol a Green Fuel? The Volkswagen 261 Mile per Gallon Car

    There have been reports for some years about the Volkswagen 1-litre car, so called because it would travel 100 kilometers on one litre of fuel. That is the equivalent of 235 miles per gallon. Earlier reports were that the car would be marketed by now.

    Now Volkswagen indicates that the car will be produced "within the next few years." The car will be called the XL1. However, rather than being a 1 L car it will be a 0.9 L car, achieving 261 miles per gallon. The improvement is the result of adding an electric motor that will make the car a plug-in hybrid.

    This is just further indication of reality that technological improvements can materially reduce greenhouse gas emissions. Indeed, if the entire automobile fleet could obtain this fuel efficiency by 2050, greenhouse gas emissions from cars would be reduced more than 80 percent, despite substantial increases in driving. This development may mean that petroleum itself could emerge as a "green fuel."

    Moreover, this advance is consistent with finding by McKinsey & Company and the Conference Board, in a report sponsored by the Environmental Defense Fund, the Natural Resources Defense Council (NRDC), Shell, National Grid, DTE Energy and Honeywell that "….no change in thermostat settings or appliance use, no downsizing of vehicles, home or commercial space and traveling the same mileage” and no “shift to denser urban housing" would be necessary to achieve substantial greenhouse gas emission reductions in the United States.

    Volkswagen L1 (2009) photo by RudolfSimon

  • Confirming International Research: Hudson Tunnel Costs Explode

    Governor Chris Christie of New Jersey is looking like a prophet now. In late October, the Governor cancelled a new tunnel across the Hudson River between New Jersey and New York City, because of the potential for cost overruns, which would be the responsibility of New Jersey taxpayers. By that point, the cost of the tunnel had escalated at least $1 billion to $9.7 billion. The tunnel was to have doubled New Jersey Transit and Amtrak capacity into Penn Station from New Jersey.

    Now Amtrak proposes to build the tunnel itself, a scaled down version of the previous tunnel. The new tunnel would increase capacity for New Jersey Transit and Amtrak trains by 65 percent.

    However, the cost is not scaled down. For one-third less the capacity, initial estimates place the cost of the new tunnel at 40 percent more ($13.5 billion) than the already escalated cost of the cancelled tunnel.

    Of course, it is likely that if planning and construction proceed, the cost of the tunnel could increase substantially beyond initial estimate. This virtual inevitability is indicated in international research by Oxford University professor Bengt Flyvbjerg and others.

  • Australia’s Housing Affordability “Outrage”

    There is mounting concern in Australia about the nature and extent of country’s housing affordability crisis. Expressions of distress are not limited to the middle income households who are locked out of the Great Australian Dream of home ownership. There is heightened interest from advocates of low income households and an opposition political party. Moreover, Australia’s overvalued housing is receiving renewed attention in international circles.

    Part of this attention is attributable to the 7th Annual Demographia International Housing Affordability Survey, which was released in late January. The Demographia Survey, which I co-author with Hugh Pavletich of Performance Urban Planning in Christchurch (New Zealand) covered 325 Metropolitan markets in seven nations (United States, United Kingdom, Canada, Australia, Ireland, New Zealand and Hong Kong, in China). The Survey assesses housing affordability using the United Nations and World Bank recommended measure of median house price divided by median household income (the Median Multiple). The data shows housing to be severely unaffordable in Australia, which was the most unaffordable nation included in the survey.

    In response, Michael Perusco of Melbourne’s Sacred Heart Mission and chairman of the Council to Homeless Persons called the affordability statistics "alarming.“ He added he was not surprised by the housing affordability data, noting the stress on the people he serves caused by inflated prices.

    Kirsten Moore recently reported in these pages on the statement by the Australian Green party. Senator Scott Ludlam, the party’s shadow minister (spokesperson) for housing called Australia’s housing affordability a "world-class outrage." He went on to say "When a family or an individual has to spend so much of their income on paying their mortgage, it has a seriously adverse affect on their education and training opportunities, on their investment opportunities and on their ability to pay for services like health care and child care."

    The real estate industry also expressed concern. David Airey, president of the Real Estate Industry Association of Australia issued a statement in response to the Demographia Survey, saying that: "for the majority of Australian families the difference between household income and loan payments is narrowing quickly."

    Various measures indicate that households with mortgage payments equaling 30 to 35 percent or more of their gross annual income on mortgage suffer from “mortgage stress." Mortgage stress has been spreading around Australia like invasive species. Last year’s Demographia Survey showed that the median income household in Sydney would pay 57 percent of its income for a mortgage if it bought a median priced house in the current market. In Adelaide, the figure would have been 47 percent. Over the last year things have only gotten worse.

    This is not merely a response to growth, or economic vitality. The median income household in the vibrant Dallas-Fort Worth region, for example, (larger than Sydney) would pay approximately 17 percent of their incomes for a mortgage on the median priced house. This is despite the fact that population growth and the demand for housing has been much greater in Dallas-Fort Worth than in Sydney (Figure 1).


    In Indianapolis, similarly sized to Adelaide and growing faster, the median income household would pay 14 percent of their income for a mortgage on the median priced house. House prices have risen more than 130 percent relative to incomes over the last three decades in Australia’s major metropolitan areas (Figure 2). By comparison, the increase has been only one-eighth as much (16 percent) in the United States.

    The extent of the house price increases is starkly illustrated by comparing the value of the own housing stock to the gross domestic products of Australia and the United States since 1988 (the first year for which Australian house value data is readily available).

    According to data from the United States Federal Reserve Board, the value of the US stock of owned housing in 2010 was approximately the same in relation to the Gross Domestic Product as it was in 1990. On the other hand data from the Reserve Bank of Australia indicates that the value of the own housing stock in Australia was 85 percent higher relative to the Gross Domestic Product than in 1990. Thus, the value of the owned housing stock in Australia is today at least $1.9 trillion greater than it would have been if the 1990 ratio had been retained (Figure 3).

    Of course, part, although far from all of the United States experienced a severe housing bubble that burst in 2007. Even so, the increase in gross house values relative to the gross domestic product in the United States  never approached the massive increase in valuation that has occurred in Australia.

    The Green Party statement rightly blamed "Government’s actions that provide incentives designed to benefit investors and speculators and to keep house prices going up." The price rises have been principally the result of state government policies banning most development on the urban fringe and created a severe shortage of competitively priced land for development. It is an established economic fact of life that, all things being equal, the prices of goods and services tend to rise where there are serious limitations on supply, whether land, petroleum or bananas (as in the case of Typhoon Larry in Queensland in 2006).

    The effects of such policies is to telegraph to investors both in Australia and around the world the potential for speculative gain in a housing market.   The biggest losers come largely from the ranks of younger middle income Australians, including many immigrants, who would like to own their own homes. It is astounding that in egalitarian Australia, which has an enviable historic record of concern for lower and middle income households, is being transformed into a country where   inheritance or access to foreign capital will be a prerequisite for home ownership for middle income people.   

    The Organization for Economic Cooperation and Development (OECD) has raised concerns about the role of restrictive land use regulations in Australia (as well as the United Kingdom, which is also covered in the Demographia Survey).  OECD has recommended that Australia ease land supply constraints by streamlining planning and zoning regulations.

    The experience of Australia, along with a number of other markets covered in the Demographia Survey demonstrates that severe restrictions on the supply of land for development remain fundamentally incompatible with both housing affordability and the aspirations of lower and middle income citizens.

    Photograph: New "detached" housing in Perth (by author).

    Wendell Cox is a Visiting Professor, Conservatoire National des Arts et Metiers, Paris and the author of “War on the Dream: How Anti-Sprawl Policy Threatens the Quality of Life

  • California High Speed Rail Costs Escalate 50 Percent in 2 Years

    The highly respected Californians for Responsible Rail Design (CARRD) has released a new cost estimate for the phase 1 Los Angeles to San Francisco high-speed rail line. Based upon an analysis of California high-speed rail Authority documentation, including stimulus grant applications and other internal sources, CARRD estimates that the line will now cost $65 billion, rather than the current estimate of $43 billion.

    The CARRD release indicated:

    Our analysis, based solely on official and publicly available Authority documents, determines the
    current project costs are approximately $65 billion. The $43 billion figure was inaccurate, even at the time it was made.

    CARRD also pointed out that there has been no recent update to the official cost estimates and that the planned October 1, 2011 update, required by state legislation, may not be released on time because of contract negotiation difficulties with Price Waterhouse Coopers.

    Even as environmental and planning work has advanced, no update to the official capital cost estimate has been made. This is true even when the only alternatives in most segments still being studied are significantly more expensive than those used to calculate the $43 billion number

    However, CARRD cautioned even this 50% increase in just two years may understate the eventual costs:

    …we have received some feedback that these numbers may actually be too conservative since there still is very little engineering information about some of the most technically challenging parts of the project (like the mountain passes).

    The new CARRD cost estimate is consistent with the perennial cost escalation that has been noted in such projects by Oxford University professor Bengt Flyvbjerg and others, who found that passenger rail systems typically have cost overruns of 45 percent.