Author: Wendell Cox

  • The Myth of the Sustainable Public Budget

    Nobel Laureate economist Paul Krugman caused a stir on ABC’s This Week, expressing the following view to Christina Amanpour on the recommendations by the leadership of the US Debt Reduction Commission:

    “Some years down the pike, we’re going to get the real solution, which is going to be a combination of death panels and sales taxes. It’s going to be that we’re actually going to take Medicare under control, and we’re going to have to get some additional revenue, probably from a VAT.”

    He later clarified his statement to be less provocative, noting that health care costs had to be better controlled and that there is a need for “several percent” more revenue, which might “most plausibly” come from a value added tax.

    He went on to say that “And if we do those two things, we’re most of the way toward a sustainable budget.” That is a very tall order. Any serious examination of government costs makes it clear that there is no such thing as a sustainable budget. The unit costs of government services routinely rise, frankly because in government competitive influences are largely absent. When government encounters financial difficulty, it looks for ways to cut services and raise taxes — that is, ways to reduce customer service or to charge more for what it does. Regrettably, in government, the answer to every question seems to be “more money.”

    On the other hand, when companies in competitive markets run into fiscal difficulties, their survival requires that they find ways to attract customers and look for ways to lower their prices without cutting service.

    Sustainability and government budgets are more often than not an oxymoron, except perhaps for the special interests who live off them (whether of the Right or the Left).

  • Miami Condo Price Implosion Continues

    The National Association of Realtors has just published its quarterly median house prices and the trend continues downward in Miami. At the end of the third quarter, the median condominium price had dropped to $82,900 in Miami, about the same as the list price for a BMW-7 sedan. This places condominium prices at 77 percent below the 2007 second quarter median of $367,000.

    While Miami has experienced perhaps the most substantial condominium bust in the nation, other metropolitan areas, such as Atlanta, Seattle, Los Angeles, San Diego, Chicago and Portland (Oregon) have seen huge decreases and a spate of spate of distress auctions and conversion of units to rentals.

    A recent article in The Wall Street Journal noted that condominiums have experienced an even greater market decline than detached housing. The over-building of condominiums may have been spurred by rose predictions from urban planners about the demand for central city housing being far greater than the supply. For example, the developer of City Center Las Vegas indicated that they built too many condominium units, at least in part in response to information received an urban planning symposium.

    Photograph: Condominium Conversion to Rentals in Portland (by author).

  • The Two Worlds of Buenos Aires

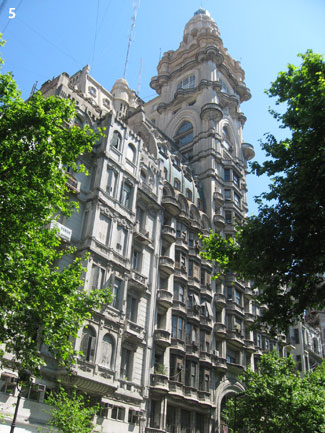
    Central Buenos Aires is undoubtedly one of the world’s great tourist destinations. Days could be spent walking among its narrow streets admiring the plentiful art noveau, art-deco, beaux-arts and other architectural styles. The triumphal Avenida 9 de Julio is one of the world’s widest boulevards with two interior roadways of up to seven lanes and two service roads of two lanes, with a Washington Monument type obelisk at Avenida Corrientes (Top photo). Avenida 9 de Julio is bordered by buildings that are both ordinary and impressive, such as the Colon Opera House.

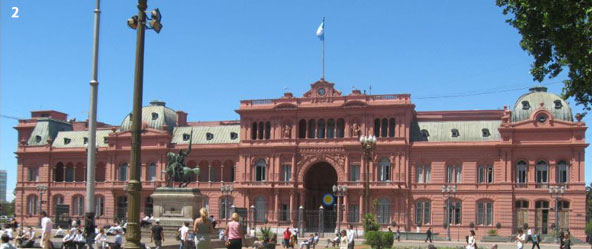
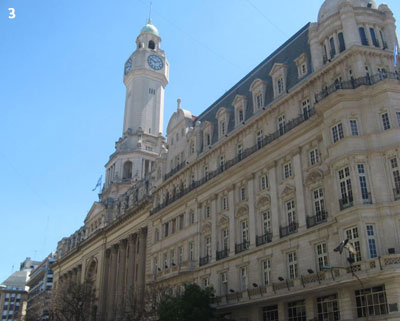
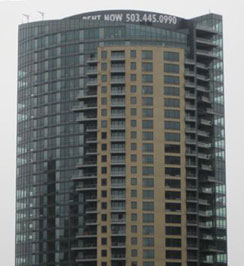
    There is also an attractive area of redevelopment adjacent to the core in the former dock area, Puerto Madero. The old port buildings have been converted to commercial uses, especially restaurants. A number of high-rise condominium buildings have been constructed beyond the old port basins. Government buildings more than match the commercial architecture, with the National Congress and the Casa Rosada, or “Pink House,” with its balconies from which President Peron and his wife Eva used to address the public (Photo 2). Not more than two weeks ago, former President Nestor Kirchner lay in state to be visited by in an emotional outpouring by hundreds of thousands of Argentineans. The city of Buenos Aires also has a distinctive legislative building (Photo 3).

    These older romantic styles make Buenos Aires a wonderful walking environment. Most were erected in the first three decades of the 20th century. This was Buenos Aires at its zenith. Then, Buenos Aires was capital of one of the world’s acknowledged economic powers. Argentina generally ranked around10th in gross domestic product (GDP) per capita during that period (Note 1). Thus, today, the tourist can enjoy the product of that prosperous time.

    Economic Stagnation: More recent years have not been good to the Buenos Aires area and Argentina. The nation has seen decades of ups and downs – but mostly downs. The nation has been buffeted between constitutional governments and military dictatorships. Too often, even the constitutional governments have placed too little emphasis on creating wealth and too much on redistributing it. A failed currency policy in the 1990s destroyed the savings of millions. All of this has led to Argentina’s migration from the top 10 economies to near the bottom of the top 100, now ranked at 82nd in the world in GDP per capita. No top ten nation from early in the 20th century has fallen so far. New Zealand managed to drop from 1st in the world in 1920 to 51st now, but still has a GDP per capita double that of Argentina.

    Argentina suffered the largest sovereign debt default in world history, at $100 billion in 2002. The nation’s former colonial master, Spain, trailed Argentina in GDP per capita throughout the 20th century to the 1980s, yet is now more than twice as prosperous (Figure 1)

    This economic decline is not so evident in the autonomous city of Buenos Aires, which is also called Capital Federal, analogous to the District of Columbia (DC) in the United States. This is the Buenos Aires of tourists, an area only slightly larger than Washington, DC, but with five times the population. The municipality of Buenos Aires is by far the most affluent urbanization in the nation. Even so, there are informal settlements within the city, such as Villa 31. Overall, approximately three percent of the city’s population is in these kinds of informal settlements.
    BA3-bencich
    Population and Distribution: According to the last census (2001), the city of Buenos Aires had fewer people than in 1947, having fallen from 3.0 million residents to 2.8 million. The city is also very dense, at 35,600 persons per square mile (13,700 per square kilometer), which is about one-half the density of Manhattan or the ville de Paris and double the density of the city of San Francisco.

    Most of the population lives in peripheral areas. This dominant suburban growth pattern is typical of world urbanization, as can be seen in such high-income nation capitals as London, Washington, Brussels, Copenhagen has been in the suburbs. Indeed, all growth in Paris has been in the suburbs since 1881. Like the ville de Paris, the city of Buenos Aires now accounts for less than 25 percent of its metropolitan area population (Figure 2).

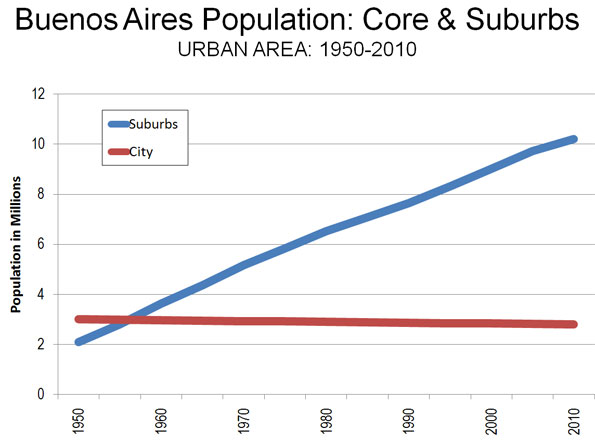
    Overall, the urban area (area of continuous development) has nearly 13 million people and covers more than 1,000 square miles (2,600 square kilometers) for a population density of 12,100 per square mile (4,700 per square kilometer). This is 70 percent more dense than Los Angeles and one-third more than Paris but less than one-eighth that of Dhaka (Bangladesh).

    Suburban Buenos Aires: The suburbs of Buenos Aires differ from those in high-income national capitals. Generally, the suburbs are far poorer than the city and reflect the more recently less affluent Argentina that has emerged in recent decades just as the central area testified to the nation’s former relative wealth. All of suburban Buenos Aires is in the adjacent Buenos Aires province, which has the largest population in the nation.

    Some of the suburbs are affluent, especially to the northwest, where suburban municipalities like Pilar and Tigre contain housing that could easily fit in upper middle income suburbs of the United States or Europe. However, even in these areas, there are close-by developments of low-quality and even informal housing, mostly housing domestic employees to the higher income population.

    The suburban poverty is far more pervasive to the southwest and the southeast. Many neighborhoods look similar to modest suburbs in Mexico City, though without the pervasive informal settlements. More people live in informal settlements in the suburbs than in the city, with estimates putting the number at above 500,000.

    More than the Core: Any thought, however, of Buenos Aires being a “compact city” is dispelled by the vast sea of lights visible on an evening flight out of Ezeiza International Airport. The urbanization stretches 30 to 40 miles in all possible directions, to the northwest, southwest and southeast (with the Rio de la Plata being to the northeast).

    However, probably no urban area illustrates the general rule that urban cores tend to be substantially different from their suburbs. Not only is suburban Buenos Aires far less dense, but it is far less affluent. Any who visits the city alone will have missed more than three-quarters of the reality.

    ————

    Note: GDP per Capita data based upon Angus Maddison’s work for the Organization for Economic Cooperation and Development.

    Photos (by the author):
    Top: Avenida 9 de Julio
    2: Casa Rosada
    3: City of Buenos Aires Legislative & Office Buildings
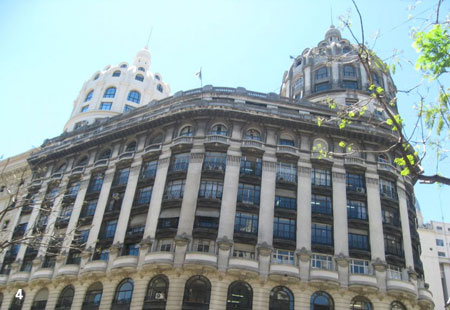
    4: Bencich Building
    5: Casa Borolo

    ————

    Wendell Cox is a Visiting Professor, Conservatoire National des Arts et Metiers, Paris and the author of “War on the Dream: How Anti-Sprawl Policy Threatens the Quality of Life

  • New Index Estimates New House Cost Impact of Land Regulation

    In recent decades, an unprecedented variation has developed in the price of new tract housing on the fringe of US metropolitan markets. Nearly all of this difference is in costs other than site preparation and construction, which indicates rising land and regulation costs.

    Our first annual Demographia Residential Land & Regulation Cost Index estimates the price of land and regulation for new entry level houses compared to the historic norm in 11 metropolitan regions (Note 1). Metropolitan regions in which land and regulation costs remain at or below normal have an Index of 1.0 while those with land and regulation costs above normal will have an Index above 1.0 (Figure 1).

    More restrictive land use regulation is variously referred to as “smart growth,” “growth management” and other terms. More restrictive land use regulation is estimated to have added from nearly $30,000 (in Minneapolis-St. Paul) to more than $220,000 (In San Diego) to the price of a new home.

    Economic research has associated rising residential land costs with more restrictive land use regulations. The table indicates some of the more important price increasing impacts of more restrictive land use regulation.


    More Restrictive Land Use Regulation:

    Factors that Can Drive House Prices Higher

    1.. Increases underlying land costs

    2.. Increases planning and development costs

    3.. Raises financing costs

    4.. Encourages more expensive houses.

    5.. Increases construction costs

    6.. Encourages concentration of market power and land banking

    7.. Encourages land and housing speculation

    The Land and Regulation Ratio

    For decades, construction costs of tract house on the urban fringe in the United States have represented 80% or more of the advertised house price. The balance of 20% or less has been for land and regulation costs and will be referred to as the “land and regulation cost ratio.” In metropolitan markets with less restrictive land use regulation, the historic 20% or less land price ratio remains in place. The Demographia Residential Land & Regulation Cost Index assumes a 20% expected land and regulation ratio.

    In some metropolitan markets, however, house prices have increased far more rapidly than in the rest of the nation. The greater increase in house prices and escalation of land costs above the historic 20% land and regulation cost ratio has occurred in metropolitan markets burdened by more restrictive land use regulations. Urban growth boundaries, limits on the number of houses that can be built, large lot zoning and excessive development impact fees and the like are regulation strategies that increase the cost of land for building houses. These land cost increases are not the result of more rapidly rising construction costs or underlying market forces such as consumer demand.

    More restrictive land use land use regulation also creates obstacles to people buying houses, requiring them to devote more money to housing than necessary and increases their vulnerability to losses in the event of a financial downturn. This exposes mortgage lenders to increased risks of loan defaults. Finally, more restrictive land use regulation makes residential land development more dependent on politics, with the potential for greater influence through campaign contributions.

    The first annual Demographia Residential Land & Regulation Cost Index estimates cost of land and regulation for new entry level houses compared to the historic norm in 11 metropolitan markets. Each of the metropolitan regions in which house prices have risen above normal have adopted more restrictive land use regulations. Conversely, in each of the metropolitan regions in which house prices have not risen above normal levels, there is less restrictive land use regulation. During much of the Post-World War II era, all metropolitan markets had less restrictive land use regulations.

    Results

    The overwhelming majority of new housing in the United States continues to be detached and is built near or on the urban fringe (Note 2). For new detached homes, the Index is 1.0 in six metropolitan markets (Atlanta, Dallas-Fort Worth, Houston, Indianapolis, Raleigh-Durham and St. Louis). This indicates that land use regulation is less restrictive and does not add more than normal to the price of new homes (Note 3).

    In the other five metropolitan markets, the land and regulation cost ratio has risen above 20%, resulting in a higher Index. The Index is 2.4 in Minneapolis-St. Paul, 3.9 in Seattle, 4.5 in Portland, 5.7 in Washington-Baltimore and 13.2 in San Diego. It is estimated that more restrictive land use regulation raises the price of the least expensive detached houses from nearly $30,000 (in Minneapolis-St. Paul) to more than $220,000 (in San Diego) than would be expected if these metropolitan markets had retained less restrictive land use regulation (Figure 2).

    The metropolitan markets with more restrictive regulation have an average Demographia Residential Land & Regulation Cost Index of 5.9 for detached housing, while the metropolitan markets with less restrictive regulation average 1.0.

    Housing Affordability: Through the Bubble and Bust

    There is increasing concern about declining housing affordability across the nation. Even after the deflation of the housing bubble, house prices in some metropolitan markets remain well above pre-bubble prices and historic affordability standards. The housing affordability of the included metropolitan markets is illustrated by land use regulatory category in Figure 3. The Figure indicates the National Association of Home Builders-Wells Fargo Housing Opportunity Index for 1995, the peak of the bubble and early 2010, showing the percentage of households able to afford the median priced house. Similar affordability measures can be reviewed in the Annual Demographia International Housing Affordability Survey.

    Future Editions

    The 11 metropolitan regions included in the initial Demographia Residential Land & Regulation Cost Index were selected to provide a geographical and regulatory balance and because they had sufficient data from which to develop the Index. Additional areas will be added in future editions, with the intention of including all metropolitan regions with more than 1,000,000 population.

    ——-

    Note 1: The Index was derived from a database developed of new house offerings by national, regional and local builders, using internet sites and published metropolitan home guides. The period covered is January through June 2010.

    Note 2: In 2006, more than 85% of new single family houses sold in the United States were detached, according to Bureau of the Census data. Detached housing represents approximately 62% of all US housing units (including multi-unit dwellings).

    Note 3: In each of the metropolitan markets with less restrictive regulation, the estimated construction costs were more than 80% of the house price. By using a 20% land and regulation ratio, the house construction cost was capped at 80% of the house price. In each of the metropolitan markets with more restrictive regulation, the estimated construction cost was less than 80% of the house price.

    Wendell Cox is a Visiting Professor, Conservatoire National des Arts et Metiers, Paris and the author of “War on the Dream: How Anti-Sprawl Policy Threatens the Quality of Life

    Photo: Will County, Chicago urban fringe (By author)

  • Governor Christie Cancels Under-Construction Tunnel in Unprecedented Move

    New Jersey governor Chris Christie reaffirmed his decision to cancel the “access to the regional core” tunnel across the Hudson River from New Jersey to New York. Christie had suspended his previous decision pending discussion of alternatives with the US Department of Transportation.

    In the final analysis, according to Christie, none of the alternatives would have capped New Jersey’s liability at its present level, which assumed a project cost of $8.7 billion. Christie told the Moorestown Community House, “No more blank checks from the taxpayers of New Jersey, not on my watch.”

    Current estimates for the project have range from $9.8 billion to more than $12 billion, which would require New Jersey to pay an additional $1.1 billion to $3.3 billion, since under the funding agreement approved by former governor John Corzine, New Jersey was responsible for any cost overruns. In fact, based upon the experience with other projects (such as Boston’s Big Dig), New Jersey could have seen its bill run to another $10 billion or more.

    Christie’s decision is unprecedented. This may be the first time in decades that a major infrastructure project already under construction has been cancelled because its costs had spiraled out of control. Such cost performance has been the rule, rather than the exception. Major research by Oxford University professor Bent Flyvbjerg, Nils Bruzelius (a Swedish transport consultant) and Werner Rottenberg (University of Karlsruhe and former president of the World Conference on Transport Research) covering 80 years of infrastructure projects found routine under-estimation of costs and over-estimation of ridership and revenue (Megaprojects and Risk: An Anatomy of Ambition ).

  • Portland’s Runaway Debt Train

    Tri-Met, the operator of Portland’s (Oregon) bus and light rail system has been in the news lately, and in less than auspicious ways. For decades, the Portland area’s media – as well as much of the national press – has been filled with stories about the national model that Tri-Met has created, especially with its five light rail lines.

    The reality is less impressive. After spending an extra $5 billion over the past quarter century, public transit’s share of work trip travel in Portland is less than it was before. Moreover, the Portland has now become the 38th of the major metropolitan areas (over 1,000,000 population) in which more people work at home (such as telecommuting) than ride transit to work.

    Tri-Met’s more recent notoriety also reveals some serious concerns about financial management . Auditors recently finished their annual report, and it indicates that that Tri-Met has run up some rather large bills that it may be hard-pressed to pay.

    Unfunded Pension Liabilities: Unfunded liabilities on Tri-met’s employee pension funds have grown to more than $260 million. This deficit has developed because Tri-Met can not meet its obligation to pay into the pension funds on a current basis. Indeed, at the rate Tri-Met paid the pension funds for fiscal year 2010 (ended June 30), they would be more than eight years delinquent. Overall, the pension funds are nearly 50 percent under funded.

    Other Post-Employee Benefits: “Other Post-Employee Benefits” (OPEB), made up principally of retiree health care, pose a much bigger problem. As of the end of the fiscal year, the unfunded liability for these benefits was $817 million, up $185 million in just one year. Underfunding is an even greater problem. The retiree benefits are 100 percent under funded. Tri-Met has simply put no money aside for these benefits. Tri-Met has achieved world class status in underfunding its OPEB. The Los Angeles MTA, which carries nearly five times as much travel volume as Tri-Met had unfunded OPEB liabilities of only $730 million (still a huge figure) in 2009, which is the last data available.

    When challenged on the huge unfunded liability and its growth, Tri-Met General Manager Neil McFarlane responded to KATU-TV: “That’s adding apples, oranges and grapefruits together to get a completely unreasonable number.” One wonders what kind of complications the chief executive office of a publicly traded Fortune 500 company would face for similarly dismissing inconvenient data in its annual report (whether from the Securities and Exchange Commission, the board of directors or the stockholders).

    The auditor, Moss-Adams, LLP appended a standard opinion, to the effect that “… the financial statements … present fairly, in all material respects, the financial position of the District as of June 30, 2010…” At another point the auditors note their obligation to perform the audit to “obtain reasonable assurance about whether the financial statements are free of material misstatement.” As far as McFarlane is concerned, there may be some disagreement on whether the financial statements are “free of material misstatement, “given that they include a “completely unreasonable number.”

    A Train of Debt: Other Tri-Met woes come from its frequent bonds issues, which to date have been approved with little oppostion. The present bonded indebtedness is more than $250 million. The agency is asking the electorate for approval of another $125 million in bonds at the November 2 election. The Oregonian, which has been a friend to nearly everything Tri-Met has done, is recommending a “no” vote on the bonds, pointing out that they would not be necessary if Tri-Met had saved sufficiently for vehicle replacement. Further, Tri-Met is searching hard for more money to fund a deficit in its proposed light rail line to suburban Milwaukie in Clackamas County, which seems a questionable project given the agency’s inability to keep fares under control and maintain service levels.

    Bloated Benefits: John Charles, President of the Cascade Policy Institute raised eyebrows when he noted that Tri-Met’s employee benefits expense is by far the highest in the nation. Charles looked at 20 large transit agencies and found that employee benefits were equal to 152 percent of the wage bill, approaching double that of the next highest, San Francisco’s Bay Area Rapid Transit District and Washington’s Metropolitan Transit Authority. With their above 80 percent employer-paid benefits ratios, albeit lower than Tri-Met’s 152 percent, these agencies have nothing to be proud of. In the private sector, employer-paid benefits tend to be less than 25 percent of wages. Tri-Met’s 152 percent is six times that.

    Bloated Compensation: With a benefits ratio of 152 percent, payroll expense per employee is a stratospheric $115,000 annually (assumes the 2008 staffing ratio, later data not identified). In contrast, the average private sector employee in the Portland metropolitan area is compensated at approximately $55,000 annually, which includes wages and a 22 percent extra for benefits (Figure 1).

    Employees Ahead of Customers: Tri-Met implemented a fare increase in September and reduced bus service by 5.8 percent and light rail service by 3.5 percent. In the last 10 years, the basic bus fare has risen 71 percent, well above the 27 percent inflation rate (Figure 2). The fare increases and service cuts are imposing substantial hardship on many Tri-Met riders, who have limited incomes and no access to cars. The above inflationary fare increases represent a financial management failure of fundamental proportions.

    Yet while it was raising fares, Tri-Met also increased union employee compensation by three percent and covered increases of 7.5 percent to 22.5 percent on two employee health care programs. Tri-Met has admitted that these increases were not legal obligations (could this be a gift of public funds?). The cost of the non-obligatory wage increase was more than double the amount Tri-Met expects to raise from the September fare increase. Some discontinued service could have been financed with the rest of the wage increase money and the non-obligatory health care premium increases.

    Rising Costs: The question for Portland and Tri-Met remains whether this financial house of cards is sustainable. Operating and capital costs have, not surprisingly, skyrocketed. In fiscal year 2010, it is estimated that costs per passenger mile rose to more than $1.35. This is a full 40 percent above the the national transit average. This is more than five times the per passenger mile – full cost of cars and sport utility vehicles including all user costs and the portion of road expenditures (principally local streets) paid for by taxes – of less than $0.25.

    Fiscal Imprudence: Past and Future: There is some too-little, too-late good news for riders. Tri-Met has told the union that it will not cover health care benefits increases in 2011, nor will there be another non-obligatory wage increase. In its editorial opposing approval of the bond issue The Oregonian spoke of “past fiscal imprudence.” In appears that the mecca of transit is becoming less a role model and more a cautionary tale.

    Wendell Cox is a Visiting Professor, Conservatoire National des Arts et Metiers, Paris and the author of “War on the Dream: How Anti-Sprawl Policy Threatens the Quality of Life

    Photo: Mount Hood in exurban Portland (by author)

  • New York Political Leadership Forces Another Fare Hike

    The New York Post editorialized (October 8) against what it called “Another TWU Fare Hike,” blaming the union for the fares that will now rise to $2.50 for a ride. The editorial writer goes on to say of MTA chief Jay Walder, “It’s not his fault that straphangers get whacked while the MTA’s unionized workers — whose blue collars come with fur trim — don’t have to make a single sacrifice to meet the MTA’s shortfall.”

    In response, I posted the following comment to the New York Post site:

    Not his fault? Well, perhaps not personally. But surely it is the responsibility of the MTA and those in Albany who have skewed law labor and regulation to create this untenable situation. It is about time that public officials, such as those who run the MTA, be held account for what they have given away to the unions. The unions could not have taken it without the agreement of the MTA and other local and state political officials.

    The way the Post tells it, you might think that the Transport Workers Union (TWU) had engineered a coup and had forcibly taken control of the Metropolitan Transit Authority. It fact, it was all quite legal. Interests such as the TWU have used their political influence to obtain the expensive contracts that place the riders a distant second, after the employees and the taxpayers an even more distant third. The MTA was not compelled to sign overly expensive labor contracts. Albany was not compelled to insulate transit unions from the economic reality faced by everyone else, including private sector union members. Washington was not compelled to give transit labor unions job protections that would be the envy of European public sector unions. These protections are a considerable factor in driving expenditures up 100% (inflation adjusted) over the past 25 years, while ridership has risen only 40%. The appointed and elected representatives did so willingly, and to the detriment of the people, whom they were supposed to represent.

    The Post rightly complains about this, but places the blame in the wrong place. If the MTA, state and federal officials who have so skewed transit economics in favor of unions, had instead served the riders and taxpayers first, then New York and the nation would have much more transit services, its fares would be lower and there would be much more ridership.

    The Post also errs in saying “Only in New York could such a perverse equation come to be.” In fact, the situation is no different in most metropolitan areas of the nation. Transit agencies have routinely avoided efficiency measures that would have increased transit ridership and reduced costs (such as competitive contracting or competitive tendering of services), raised fares and cut services.

    As the process has unfolded over decades, the TWU and other local transit unions simply responded to the incentives that were established by the elected and appointed officials. This has contributed, along with extravagant and in rail transit expansions, to rendering transit financially unsustainable. The problem is that the public interest in transit has been hijacked by special interests.

    A more appropriate headline for the editorial would have been “New York Political Leadership Forces Another Fare Hike.”

  • Satellite Cities for Beijing? Yes, But….

    China Daily ran an article on the continuing urbanization of Beijing. In Build upward or outward: City’s growth dilemma, Daniel Garst notes that Beijing is not as centralized as other urban areas, with its multiple business districts and comparatively low density in its inner areas. He indicates a preference for the urbanization of Shanghai, with its stronger center (both Pudong and Puxi), but suggests that it would be a mistake to replace the historic low density development with the high rises that would be necessary to change Beijing’s urban form.

    Actually, Beijing’s form is not that unusual for Asian urban areas. Tokyo has multiple office centers rather than a single dominant center and has comparatively low residential densities, even within the Yamanote Loop. Bangkok, Manila and Jakarta are similarly multi-centric. Chinese urban areas like Shenyang, Xi’an, Wuhan, Suzhou and Changsha are closer (but smaller) replicas of Beijing than Shanghai. Garst also misunderstands the dynamics of traffic congestion in his belief that roads and metros (subways) would be less congested with a more centralized form. In fact, higher densities routinely produce more intense congestion, not only on the roads but also on the rails and buses, a point recently made by Michael Matusik on this site.

    However, Garst may be onto something with respect to a suggestion that Beijing’s growth should be directed to new satellite towns, in which residents work rather than commuting to Beijing. This is good theory, but there is an important caveat, which we outlined in a comment at China Daily on the article.

    Satellite cities are not a reasonable answer unless they are so far from the Beijing urban area that commuting to Beijing is not possible. The idea of self-contained satellite cities, where people live and work in them has not worked anywhere. There are good examples of failure in London, Cairo, Stockholm, etc. So long as the large urban area can be reached, people will commute there.

    Cairo provides a useful example. Egyptian planners have long decried the continuing commute pattern into the urban area from the new towns of 6th of October and 10th of Ramadan, which are within commuting distance. On the other hand, the new town of Anwar Sadat, more remote from the urban area, has been more successful in keeping its residents in its labor market.

    Locating new satellite towns far enough to make commuting infeasible will be a real problem for Beijing. There just is not enough territory in the provincial level municipality. That means the new towns would have to be in the province Hebei, which along with the province level municipality of Tianjin surrounds Beijing.

    Short of remote new towns and forcing population and economic growth away from Beijing, the key to minimizing traffic congestion will be to minimize work trip distances by achieving a dispersion of comparatively lower density employment to match the lower density suburban dispersion. Economists Peter Gordon and Harry W. Richardson have found that “suburbanization has been the dominant and successful mechanism for reducing congestion.” in the United States. This applies no less to Beijing.

    Photograph: Forbidden City, Beijing (by author)

  • Property Values 11 Times Higher Across Portland’s Urban Growth Boundary

    One of the starkest impacts of smart growth policies is the huge differentials in property prices that occur on virtually adjacent properties on either side of an urban growth boundary.

    The extent to which regulatory restrictions can drive up prices is illustrated by the differences between the values of undeveloped lands just a few steps from each other, but across the urban growth boundary. Research from more than a decade ago in Portland indicated that land on which development is permitted inside the urban growth boundary tended to be 10 times as valuable per acre as land immediately outside the urban growth boundary, on which development was not permitted. In Auckland, New Zealand, recent research found virtually adjoining undeveloped land value differences at 10 times or more as well. Research in the London area by Dr. Timothy Leunig of the London School of Economics indicates that this difference can be as much as 500 times.

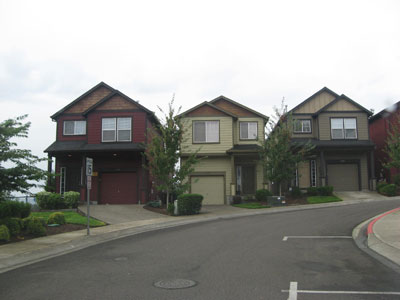
    Recently (February), I examined tax assessment records for all parcels in Portland’s Washington County that abut the urban growth boundary to see if value differences exist. The properties had to be 5 or more acres and be undeveloped. Research was conducted based upon Internet information in February 2010. Property along 25 miles of the urban growth boundary from Cedar Hills to Hillsboro to southwest Beaverton was included in the analysis.

    • The land adjacent to, but outside the urban growth boundary (on which development is prohibited) was assessed at approximately $16,000 per acre.
    • The land adjacent to, but inside the urban growth boundary (on which development is permitted) was assessed at approximately $180,000 per acre, approximately 11 times the price of land that is virtually across the street (across the urban growth boundary)

    A sample was also taken of more remote developable parcels of more than 5 acres, on which development would not be permitted. These parcels, which were from one to five miles outside the urban growth boundary, had a value of approximately $8,500. Thus, the developable land inside the urban growth boundary was 21 times as expensive as the more remote land.

    These data indicate the impact of urban growth boundaries on the price of raw land, which is inevitably passed on to buyers of new housing. Without an urban growth boundary, it would be expected that land on both sides of an urban growth boundary would have similar values. Further, land would be expected to drop in value beyond the urban fringe, but not by the drastic amounts indicated in Portland, Auckland and London.

    —-

    Photograph: (By Author)

  • Soccer Moms Against Rail Transit in Tampa

    On election day, the voters of Hillsborough County, Florida (Tampa) will vote on a one-cent sales tax that would fund transit (75%) and roads (25%). Part of the funding would be used to build a new light rail line, which is the focus of campaigns on both sides.

    The proponents are the usual well financed coalition of business, rail construction companies and consulting engineers, who could well profit from the program going forward.

    The opposition, however, is unusual. It is a direct outgrowth of the growing citizen involvement from the TEA Party and 912 Project. These groups have broken new ground in raising general issues of government waste and public expenditure policy. This could be an important step toward balancing the spending proclivities of special interest groups with taxpayer interests in spending no more than is necessary to provide essential public services.

    In Tampa, the rail opposition goes by multiple names, including “No Tax for Tracks” and Smartmoms. The more interesting of the terms is Smartmoms, or “Suburban Moms Against the Rail Tax.” They might have just as accurately called themselves “Soccer Moms Against the Rail Tax,” reflecting the demographic that has been so important in recent elections.

    I recall being told by a disappointed former federal official that one of his greatest disappointments was to learn that there was no constituency for economic efficiency. This may be changing, if the developments in Tampa are any indicator.

    I had the privilege of speaking at one of their rallies recently and wonder whether Tampa might represent a new birth of citizen questioning of large spending projects. Their revulsion at the “if we don’t take the federal money, Baltimore will” line of thinking was refreshing. One key to restoring a more prosperous America will be to minimize this mutual plunder, by which Washington seduces local areas to buy things they never would with their own money. A new day could be dawning.

    —-

    Photo: Downtown Tampa (by the author)