Author: Wendell Cox

  • Unlivable Vancouver

    Just in time for the winter Olympics, The Economist has rated Vancouver as the world’s most livable city. The Economist rates cities (presumably metropolitan areas or urban areas) “over 30 qualitative and quantitative factors across five broad categories: stability, healthcare, culture and environment, education and infrastructure.” There is no doubt that Vancouver is in a setting that is among the most attractive in the world. It is also clear that the quality of life is good in Vancouver.

    Vancouver won another honor in the last month, that of most unaffordable housing market in the six nations surveyed by the Demographia International Housing Affordability Survey (United States, United Kingdom, Canada, Australia, Ireland and New Zealand). In Vancouver, housing costs 9.3 times annual gross household incomes and is rated severely unaffordable. This measure, the Median Multiple, would be 3.0 or less in a properly functioning urban market. The second most expensive major “city” in Canada was Toronto, far behind Vancouver, but still severely unaffordable at a Median Multiple of 5.2.

    Meanwhile, Pittsburgh, the ranked highest city in the United States (yes, higher than Portland, Seattle or San Diego) shows that affordability and livability are not incompatible. Pittsburgh has a Median Multiple of 2.6.

    Vancouver’s high ranking, however, makes it clear that the cost of housing (and by extension, the cost of living), has little to do with The Economist ratings. As Owen McShane wrote here to commemorate the last release of The Economist ratings, the cities are ranked based upon their attractiveness to expatriate executives. These are not ordinary Canadians. At historic credit underwriting standards, 85% of Canadians households could not qualify for a mortgage on the median priced house in Vancouver.

    Vancouver is doubtless among the most livable cities in the world for those for whom money is no object. But for ordinary Canadians, affordability is a prerequisite to livability. This makes Vancouver Canada’s least livable city.

  • Atlanta: Ground Zero for the American Dream

    The Atlanta area has much to be proud of, though it might not be obvious from the attitudes exhibited by many of its most prominent citizens. For years, local planners and business leaders have regularly trekked to planning’s Holy City (Portland) in hopes of replicating its principles in Atlanta. They would be better saving their air fares.

    Money Better Spent by Government than People? Most recently, Jay Bookman of the Atlanta Journal Constitution wonders whether taxes are high enough in Georgia and seems envious of the fact that Oregon’s voters approved tax increases in a recession, despite months of having one of the highest unemployment rates in the nation. Perhaps they were naïve enough to believe that the higher taxes would not stand in the way of attracting new business to the state. Or, perhaps the voters believed that, as a neighbor to basket case California, Golden State businesses might still flee to Oregon as an expensive but less congested environment (Note 1).

    Portland Transit: Nothing to Emulate: Bookman is also envious of Portland’s transit system with its light rail and commuter rail. Perhaps he is unaware of the “pecking order” of transit. Atlanta’s MARTA is superior to Portland’s MAX light rail in virtually every respect. MARTA a world class Metro. It is fully grade separated and averages about 70% faster than MAX, which is a revival of abandoned streetcar technology. It is thus not surprising that MARTA carries three times as much passenger demand as MAX, despite a total route length approximately the same as in Portland. Despite MARTA’s superiority to MAX, both the Atlanta and Portland transit systems share the transit curse of excessive costs. Atlantans are paying far less to subsidize their transit system than if they had unwisely, like Portland, extended it and taxed residents throughout the suburbs.

    Portland’s Embarrassing Commuter Rail Line: And, commuter rail does not appear to be a matter of pride in Portland at this point. Portland’s one commuter rail line celebrated its first year anniversary recently. Before the line opened, Tri-Met transit officials estimated that the line would “have 2,400 riders a day as soon as service begins.” The Wilsonville to Beaverton WES commuter rail line, however, never came close to that number. Daily ridership has been under 1,200. But the relative paucity of riders did not interfere with the transit agency’s spin and the media’s general sheepish agreement. At the one year anniversary a Tri-Met spokeswoman commented that “When you think about having 55,000 jobs lost in the region, that translates into fewer transit riders throughout the system and particularly during rush hour.” However, nowhere near the half of riders that failed to show for WES cannot be blamed on Portland’s high unemployment rate. If Portland were to return to unemployment levels of a year ago, WES would likely add no more than 50 daily riders.

    So, recession-ravaged Portland has built a commuter rail line that carries, at best, 0.5% of the capacity of adjacent freeways when it operates. Moreover, it has been costly. The line costs about $60 per passenger, only $2.50 of which is collected in fares. This means that the annual subsidy per passenger is nearly $15,000, almost enough to pay the annual mortgage cost on two median priced Atlanta homes.

    Portland Traffic Congestion Worse than Atlanta: Atlanta is renowned for its traffic congestion, which is a direct result of its failure to invest in the type of arterial grid that could provide substantial relief for its less than robust freeway system. Yet, based upon the latest Inrix National Traffic Scorecard, (GPS collected data for 2009), there is less peak period travel delay (as measured by the Travel Time Index) in Atlanta than in Portland, which is a reversal from data earlier in the decade (see note).

    Atlanta: Adding a New Zealand: Atlanta has no reason to look to Portland as a model, or anywhere else, for that matter. Coming out of World War II, the Portland metropolitan area was larger than the Atlanta metropolitan area (1950). Since that time, Portland has grown strongly, adding 1.5 million people. Atlanta has added more than three times as many people. The result is an economy that produces at least $150 billion more in wealth every year than Portland. Thus, the difference between Atlanta and Portland is more than the gross domestic product of New Zealand. For at least the last two decades, Atlanta has been the fastest growing large metropolitan area in the high-income world.

    Atlanta: Land of Opportunity: But perhaps the biggest draw about Portland for Atlanta leaders is its “growth management” (so-called “smart growth”) land use policies. Portland has drawn an urban growth boundary around its urbanization. Its land regulators commission “sun rises in the West” studies to deny the fact that this rationing of land increases house prices. There is, however, no question of the impact of more restrictive land use policies, from the World Bank to members of central bank boards to decorated economists such as Kat Barker of the Bank of England and Donald Brash, former governor of the Reserve Bank of New Zealand.

    The result is superior housing affordability. Late in the year, the median house price in Atlanta was 2.1 times median household incomes (the Median Multiple). By comparison, the Median Multiple in Portland was 4.2, indicating that house prices are twice as high relatively speaking in Portland. In 1990, before Portland implemented its more stringent smart growth policies, housing affordability in Portland was about equal to Atlanta.

    But there is more to the story. Portland’s heavy handed planning policies are distorting product offerings so much that only the richest can afford more than a miniature back yard. This is illustrated by the images of new housing developments below in the suburbs of Portland and Atlanta (below). Both pictures are taken from approximately 1,500 feet above the ground.

    In the Portland example, virtually on the fringe of the urban area (the next urbanization is at least 10 miles away); houses are stacked in at more than 15 to the acre, with just a few feet between the roof-lines – vaguely reminiscent of third world shantytowns (Note 2). The more traditional suburban development that characterizes most of Portland is also shown on three sides of the overly dense new development.

    In the Atlanta example, houses have been recently built at about 4 to the acre, which has been the American suburban norm (except where land use regulations have required larger lots). The emerging sameness of Portland’s housing gives new meaning to the “ticky tack” criticism of suburbanization.

    Our 6th Annual Demographia International Housing Affordability Survey found Atlanta to be the second most affordable metropolitan area with more than 1,000,000 residents and the 17th most affordable metropolitan area out of 272 markets in six nations. Portland ranked 180th. Atlanta is truly a land of opportunity for young households and lower middle income households that can never hope of owning their own home in Portland’s pricey, growth management driven market.

    Rather than being a shameful example of metropolitan disaster, Atlanta remains one of the diminishing number of American urban areas where the American Dream can still be offered at a price that middle income households can afford. Atlanta has also emerged as one of the world’s best examples of ethnic diversity, not only in the core but also in the suburbs. More than half of the new residents in the suburbs have been non-Anglo since 1990 in Atlanta, about which it can proud. Atlanta is inferior only in the quality of is public relations and self-understanding. It should be a required stop for planners from Portland and beyond, for remedial education on injecting humanity and aspiration back into urbanization.


    Note 1: Bookman also notes in his column that Portland’s traffic congestion has not worsened at the rate I predicted in a 1999 Atlanta Constitution oped. I had not anticipated the huge gasoline price increases, which have materially reduced the rate of traffic growth virtually everywhere and made previous congestion increase rates unreliable as predictors of future growth.

    Note 2: For example, see the similar rooflines in a Dhaka shantytown near Gulshan at 23:47 North and 90:24 East in Google Earth. The principal difference in roof lines is the Dhaka slum’s lack of streets and cars, both of which seem consistent with the anti-mobility stance of “smart growth” planning.

    Wendell Cox is a Visiting Professor, Conservatoire National des Arts et Metiers, Paris. He was born in Los Angeles and was appointed to three terms on the Los Angeles County Transportation Commission by Mayor Tom Bradley. He is the author of “War on the Dream: How Anti-Sprawl Policy Threatens the Quality of Life.

    Photo: hyku

  • Australian Treasurer Calls for Reasonable Land Regulation

    Australia’s Treasurer Wayne Swan called for reducing restrictions on building houses, to improve housing affordability. The Treasurer’s comments came amid growing concern about housing cost escalation that has been highlighted by recent reports, including the 6th Annual Demographia International Housing Affordability Survey (which identified Australia as the most expensive nation surveyed).

    Treasurer Swan told the Herald Sun in Melbourne “Unless constraints to the supply side of the market are addressed, our cities will not adapt to meet the needs of a growing population and we will see continued problems of affordability for ordinary Australians.” He continued: “We are not building enough houses and if this continues then we will all be paying increasingly more and more for our housing whether it be in terms of repayments or in terms of rent.”

    Australia’s housing affordability crisis, has been the result of overly restrictive land use policies (called “urban consolidation” or “smart growth”), which by intensively controlling the land supply, raise its price and that of housing. This association between prescriptive land use regulations and the loss of housing affordability has been documented by a number of the world’s most eminent economists, such as Kate Barker, a member of the Monetary Policy Committee of the Bank of England and Donald Brash, former Governor of the Reserve Bank of New Zealand. Brash has said that “the affordability of housing is overwhelmingly a function of just one thing, the extent to which governments place artificial restrictions on the supply of residential land.

    Indicating the “can do” attitude so typical of Australia, the Treasurer said: “We can and must do better than this.”

  • Housing Affordability in Darwin, Australia: Still Dreadful

    Darwin, capital of Australia’s Northern Territory is located next to the sea, across from the Indonesian archipelago. Darwin is also located next to a sea of developable land in one of the world’s least developed nations. Only 0.3% of Australia’s land is developed, approximately 1/10th the rate of the United States or Canada (in the agricultural belt) and even less compared to European nations.

    Local Officials Report Erroneous Data: Yet, Darwin has severely unaffordable housing in our 6th Annual Demographia International Housing Affordability Survey. Upon initial publication of this year’s report, local officials identified a mistake in the median house price figure that they had made available to the press (and that we had used). Rather than a median house price of $607,000 (US$510,000), they announced that the median house price in September 2009 was $499,000 (US$425,000). Officials also corrected the median house price figure for the previous quarter.

    Housing Affordability: Still Dreadful” The result was that the Median Multiple (median house price divided by median household income) fell from 8.6 to 7.1. Affordable markets have a Median Multiple of 3.0 or below. As originally reported Darwin was the 4th least affordable market out of 272. We have revised our report to reflect the newly revised data. Darwin is now rated as 13th least affordable market, which is only marginally less dreadful.

    Still As Unaffordable as New York or London: This was cause for celebration by the Chief Minister (Premier) of the Northern Territory, Paul Henderson, who noted that housing was less expensive in Darwin than in Tokyo. We do not know the Median Multiple for the Tokyo metropolitan area, because data is not readily available. However, Darwin is as expensive relative to incomes as New York and London.

    Darwin: A Metropolitan Area in Housing Stress: At the median house price, the median household will pay half its income for the mortgage. This is well above the “mortgage stress” level of 30% as defined by government agencies. The overwhelming majority of Darwin’s future households will be faced with housing stress or could be life-long renters. The price for most residential building lots (blocks) in the new suburb of Johnston is approximately the same as the US median house price, even after adjusting for currency differences.

    High Demand Markets are More Affordable: Atlanta and Dallas-Fort Worth each have added the equivalent of Darwin’s population annually during the 2000s and have exhibited far higher underlying demand for housing. Yet housing is affordable (Median Multiples under 3.0). If Darwin had the same price to income ratio as Atlanta, the median house price would be little more than $150,000.

    Extinguishing the “Great Australian Dream:” It was not always this way. Before the widespread adoption of “urban consolidation” policies (also called growth management, smart growth or compact city policies), sufficient land was always available to build on across Australia. In the last two decades, however, urban consolidation policies have ravaged Australia’s household wealth, driving prices to the highest levels in the English speaking world.

    Few places in the world are more unaffordable than Darwin. Few places have more land to grow. Heavy handed and stingy planning has extinguished the Great Australian Dream in Darwin.

  • Opposition to High Speed Rail Grows

    The St. Louis Post Dispatch characterizes high speed rail as a “bridge to the 19th century,” in noting its opposition.

    I couldn’t have said it better, though I tried in my Wall Street Journal Oped (“Runaway Subsidy Train”). As usual, some of the best lines in this article fell on the “cutting room floor,” as editors can allow only so many words. The two most important points were:

    • Significant community opposition is developing. Within the last 10 days there have been community and neighborhood protests against new high speed rail lines in France, Italy, Spain and Hong Kong. Further, opposition to the greenhouse gas belching Mag Lev (magnetic levitation) extension from Shanghai to Hangzhou (China) has blocked that project. There is a burgeoning opposition to the swath that high speed rail will cut through the communities on the peninsula south of San Francisco.
    • A traveler using high speed rail from Orlando to Tampa who gets caught at a rental car counter line might not save any time over driving even if the train reached the speed of light.

    The biggest problem with high speed rail is that it requires huge expenditures of public funding in a market (intercity passenger transport) that does not require subsidies. Much of the impetus comes from generous donations to political campaigns by vendors who live off public funding and by a naive cadre of virtual sheep who believe anything that runs on rails walks on water.

  • The Fed: Reappoint Captain Smith?

    The debate surrounding the re-appointment of Ben Bernanke as Chairman of the Board of Governors of the Federal Reserve (the Fed) is not without historical parallel.

    Just recall the RMS Titanic: It was April 14, 1912, when White Star’s “unsinkable” RMS Titanic, the largest and newest passenger liner in the world, was steaming from Southampton and Ireland to New York. The ship was traveling through a part of the North Atlantic where icebergs had been reported. The highly decorated Captain Edward J. Smith had rerouted the Titanic a bit to the south, but was aware that there were icebergs in the area. Urgent reports were radioed to the Titanic from other ships in the vicinity. These reports were not delivered to Captain Smith.

    Nonetheless, Captain Smith was confident enough that he ordered the ship to continue at its normal speed and apparently saw no reason to be on the bridge through the evening. The story is familiar to everyone. Just before midnight, lookouts spotted an iceberg dead ahead. The ship could not be steered away in time to avoid a collision that fatally wounded the Titanic.

    Unsinkable Economy: In the middle of the decade, the American economy, too, was steaming into dangerous waters. Yet the Fed, the nation’s financial watchdog, missed it big and makes one wonder if its website’s claim that it provides the nation with a safe, flexible and stable monetary and financial system is a line they borrowed from Conan O’Brien.

    The country thrust at near full speed into an abyss of phony mortgage debt in late 2008, which plunged the nation and the world into the worst economic downturn since the Great Depression.

    Ben Bernanke had taken over as Chairman of the Board of Governors of the Federal Reserve Bank in early 2006, but his late arrival does not excuse his role, or that of the Fed. Bernanke had long been involved in leading economic roles, immediately before as Chairman of President Bush’s Council of Economic Advisors and before that as a member of the Board of Governors of the Federal Reserve (from 2002 to 2005). There is no indication that Bernanke did anything to sound a serious alarm while in these positions.

    Signs of Trouble: Yet the signs were clear. How could it be that the urgent radio reports were not forwarded to Captain Smith? It might have been expected that he or a deputy might be checking frequently with the radio operators. Perhaps the failure resulted from the belief that the Titanic was unsinkable.

    Similarly, the warnings of the housing bubble were clear, if only someone had been looking. There is no indication that Ben Bernanke, in any of his capacities, understood the extreme threat that the housing bubble had to the economy or its perverse nature. Many of the nation’s leading economists, Bernanke included, continued to look only at national averages, completely missing the point that a dangerous concentration of far greater intensity plagued many specific markets. These far more severe bubbles represented a far greater threat to financial stability than would have been the case if the national averages had been representative.

    Captain Smith was well aware of the dangers of icebergs and knew that they were in the area. Presumably, Ben Bernanke knew – or should have known – of the dangers of an unprecedented housing bubble and of the dangers it could create for the economy. Perhaps he thought the US economy was unsinkable.

    How Bad It Was: It’s not like this was a bubble without precedent. Bernanke and the Fed should have been alarmed that the American housing bubble was equal in its overvaluation to the fabled housing bubble in Japan that hobbled that economy for many years (Figure 1).

    But the problem was even bigger. During the housing bubble, the economic community, Bernanke and the Fed were afflicted with a myopia that prevented looking beyond national average house prices. But those few willing to “dirty their hands” and look further found even more troubling developments.

    In 2005, eventual Nobel Prize winner Paul Krugman pointed out that the housing bubble was limited to only part of the market; what he called the “zoned zone.” The “zoned zone” refers to what I have been calling the areas with “more prescriptive” land use regulation (also called “growth management” or “smart growth”). These are the types of intensive interventions that reduce the supply of land for development, raise its costs and provide an open invitation to speculators seeking short term, but occasionally enormous profits. It is important to note that not all land regulation produces such results, but that the regulation typical of the bubble markets did exactly that.

    This was missed by Bernanke and the Fed. In the more prescriptively regulated markets house prices had risen at double the national rate and double the Japanese bubble rate. In other areas (what Krugman called “flatland” and I call “more responsively regulated” markets), house prices rose at one-third the average rate (Figure 2).

    This concentration meant that the bubble in the more prescriptive markets was far more unstable and threatening. In the end, at least 85% of the gross value increase occurred in the more prescriptive markets, with particular concentrations in California, Florida, Phoenix and Las Vegas. When the bubbles in these markets burst, it ravaged the national mortgage finance industry even in the face of far more reasonable prices elsewhere in the country.

    Wandering in the Wilderness: That Chairman Bernanke still does not understand this dynamic was amply illustrated by his recent Atlanta speech to the American Economic Association, in which he claimed that the easy money policies of the Fed had little to do with the Great Recession. Instead he blamed lax regulation that permitted “exotic mortgages.” Moreover, it is clear that neither he nor the Fed have managed to scratch below the surface of the bubble in specific markets and its ability to create enormous havoc on the national and world economy.

    A Bully Pulpit: What could Bernanke and the Fed have done? First of all, they could have sounded the alarm about the profligate lending that has reduced this nation’s “soundness of banks” rating to 108th out of 133, just behind Tanzania, and seven places behind Bangladesh and 21 behind Nigeria. Second, Bernanke and the Fed could have bothered to suggest corrective actions to prevent development of the unsustainable values in the “zoned-zone.” At a minimum, Bernanke and the Fed could have used their bully pulpit in hopes of sparing the nation and the world an unnecessary financial catastrophe.

    The Rescuer: Of course, Chairman Bernanke has earned high marks for his work to avoid a depression. If Captain Smith had somehow survived the ordeal caused by his misjudgments, however, White Star probably would not have awarded him another command.

    Wendell Cox is a Visiting Professor, Conservatoire National des Arts et Metiers, Paris. He was born in Los Angeles and was appointed to three terms on the Los Angeles County Transportation Commission by Mayor Tom Bradley. He is the author of “War on the Dream: How Anti-Sprawl Policy Threatens the Quality of Life.

  • Housing Unaffordability as Public Policy: The New Demographia International Housing Affordability Survey

    The just released 6th Annual Demographia International Housing Affordability Survey shows some improvement in housing affordability, especially in the United States and Ireland but a continuing loss of housing affordability, especially in Australia.

    The Survey, co-authored by Hugh Pavletich of Performance Urban Planning, covers 272 metropolitan markets in 6 nations (the United States, the United Kingdom, Canada, Australia, Ireland and New Zealand). The Survey estimates housing affordability using the “Median Multiple,” which is the median house price divided by the median household income. As recently as the late 1980s, the Median Multiple virtually everywhere was 3.0 or below. Over the past 10 to 20 years, however, the Median Multiple has risen worryingly in all major markets of the United Kingdom, Australia, New Zealand and Ireland and in some markets in the United States and Canada.

    Housing affordability is rated on a four category scale, from “affordable” to “severely unaffordable” (Table 1).

    Table 1
    Demographia Housing Affordability Rating Categories

    Housing Affordability Rating

    Median Multiple

    Severely Unaffordable

    5.1 & Over

    Seriously Unaffordable

    4.1 to 5.0

    Moderately Unaffordable

    3.1 to 4.0

    Affordable

    3.0 or Less

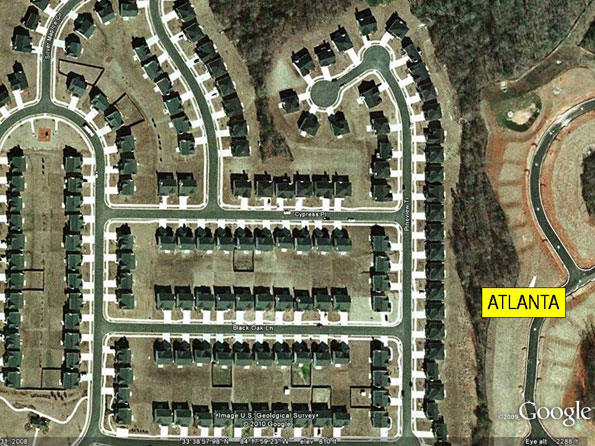
    Affordable Markets: The Survey found affordable markets in both the United States and Canada. This included fast-growing markets, such as Atlanta, Dallas-Fort Worth and Houston, which have had the highest underlying demand of any metropolitan areas with more than 5,000,000 population in the high-income world. It also includes the “Rust Belt” metropolitan areas, such as Detroit, which has experienced severe declines in demand in the Great Recession. There were also a number of additional metropolitan areas that are neither fast growing nor in dire economic straits, such as Indianapolis, Kansas City and Cincinnati (Table 2).

    Table 2
    Affordable Major Markets: 2009: Third Quarter
    Affordability Rank Nation Market Median Multiple
    1 United States Detroit, MI 1.6
    2 United States Atlanta, GA 2.1
    3 United States Indianapolis, IN 2.2
    4 United States Rochester, NY 2.3
    5 United States Cincinnati, OH-KY-IN 2.4
    5 United States Cleveland, OH 2.4
    5 United States Las Vegas, NV 2.4
    8 United States Buffalo, NY 2.5
    9 United States Columbus, OH 2.6
    9 United States Kansas City, MO-KS 2.6
    9 United States Phoenix, AZ 2.6
    9 United States Pittsburgh, PA 2.6
    9 United States St. Louis, MO-IL 2.6
    14 United States Dallas-Fort Worth, TX 2.7
    14 United States Jacksonville, FL 2.7
    16 United States Memphis, TN-AR-MS 2.8
    16 United States Minneapolis-St. Paul, MN-WI 2.8
    16 United States Louisville, KY-IN 2.8
    19 United States Houston, TX 2.9
    20 United States Oklahoma City, OK 3.0
    20 United States Riverside-San Bernardino, CA 3.0
    20 United States Tampa-St. Petersburg, FL 3.0

    Severely Unaffordable Markets: There were also 18 severely unaffordable markets, in five nations. The least unaffordable market was Vancouver (Canada), with a Median Multiple of 9.3. Sydney (Australia) was the second least affordable market (9.1), followed by Melbourne (8.0) and Adelaide (7.4). The most unaffordable markets also London (GLA or inside the greenbelt), with a Median Multiple of 7.1, San Francisco (7.0), New York (7.0), Perth, Australia (6.9), Brisbane, Australia (6.7), Auckland, New Zealand (6.7) and the London Exurbs (outside the greenbelt), at 6.7. Los Angeles-Orange County, which was the most unaffordable metropolitan area in the first four Surveys, remained severely unaffordable, at 5.7 (Table 3).

    Table 3
    Severely Unffordable Major Markets: Third Quarter: 2009
    Unaffordability Rank Nation Market Median Multiple
    1 Canada Vancouver 9.3
    2 Australia Sydney 9.1
    3 Australia Melbourne 8.0
    4 Australia Adelaide 7.4
    5 United Kingdom London (GLA) 7.1
    6 United States New York, NY-NJ,-CT-PA 7.0
    6 United States San Francisco, CA 7.0
    8 Australia Perth 6.9
    9 Australia Brisbane 6.7
    9 New Zealand Auckland 6.7
    9 United Kingdom London Exurbs 6.7
    12 United States San Jose, CA 6.4
    13 United Kingdom Bristol-Bath 6.1
    14 United States San Diego, CA 6.0
    15 United States Los Angeles-Orange County, CA 5.7
    16 United Kingdom Stoke on Trent & Staffordshire 5.3
    17 Canada Toronto 5.2
    18 United Kingdom Newcastle & Tyneside 5.1

    Severely Unaffordable Markets: There were also 18 severely unaffordable markets, in five nations. The least unaffordable market was Vancouver (Canada), with a Median Multiple of 9.3. Sydney (Australia) was the second least affordable market (9.1), followed by Melbourne (8.0) and Adelaide (7.4). The most unaffordable markets also London (GLA or inside the greenbelt), with a Median Multiple of 7.1, San Francisco (7.0), New York (7.0), Perth, Australia (6.9), Brisbane, Australia (6.7), Auckland, New Zealand (6.7) and the London Exurbs (outside the greenbelt), at 6.7. Los Angeles-Orange County, which was the most unaffordable metropolitan area in the first four Surveys, remained severely unaffordable, at 5.7 (Table 3).

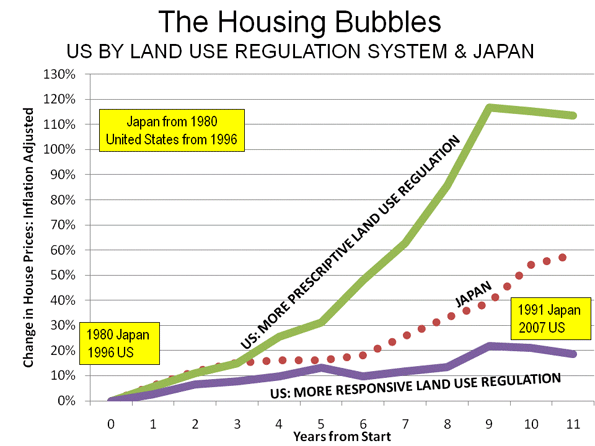
    Summary by Nation: As in the five previous Surveys, there is a close relationship between housing unaffordability and categories of land use regulation. Virtually all severely unaffordable markets are characterized by “more prescriptive” land use regulation policies (also called “compact city,” “urban consolidation,” “growth management,” or “smart growth”). At the same time, the affordable markets overwhelmingly have “more responsive” land use regulation, in which new residential development is demand driven.

    Australia: The most extreme housing unaffordability has evolved in Australia. Australia’s overall Median Multiple was 6.8, with a housing affordability rating of severely unaffordable. A recent Bank West report also noted the deteriorating housing affordability and indicated housing affordability was a thing of the past for “key workers.” This is a dramatic turnaround; housing had been affordable widely in Australia in the late 1980s, with a Median Multiple of under 3.0 and remained under 3.5 until the late 1990s. All but one of Australia’s 23 markets were severely unaffordable, with one being seriously unaffordable. All of Australia’s major markets (over 1,000,000 population) have strong “urban consolidation” policies that have resulted in unaffordable land on the urban fringe and a substantial decline in house construction, despite the highest national population growth rate among the surveyed nations.

    Canada: Canada has an overall Median Multiple of 3.7 and is thus rated moderately unaffordable. Housing had been affordable in Canada in the late 1990s, with a Median Multiple of 3.0. Canada has 5 affordable markets and 4 severely unaffordable markets. Thirteen markets were rated moderately unaffordable, while 6 were rated seriously unaffordable. Like the United States, land use regulation is under the control of sub-national governments and thus ranges from demand driven to plan driven regimes.

    Ireland: Ireland has experienced a substantial improvement in its housing affordability. Ireland has a Median Multiple of 3.7, and is rated moderately unaffordable. Housing had been affordable as late as the middle 1990s, with a Median Multiple below 3.0.

    New Zealand: New Zealand’s overall Median Multiple was 5.7, for a severely unaffordable rating. Housing had been affordable in the early 1990s, with a Median Multiple of under 3.0. Five of the 8 markets were rated severely unaffordable, while 3 markets were seriously unaffordable. As in Australia, more prescriptive land use regulation is pervasive.

    United Kingdom: The overall Median Multiple in the United Kingdom was 5.1, for a severely unaffordable rating. Housing had been affordable in the late 1990s, with a Median Multiple of under 3.0. Despite the recent house price declines, 19 of the 33 surveyed markets were rated severely unaffordable and 14 were rated seriously unaffordable. The connection between the UK’s housing unaffordability and its plan-driven regulation has been documented in Labour government commissioned report by Kate Barker, a member of the Monetary Policy Committee of the Bank of England.

    United States: The United States is the first nation in Survey history to have achieved an overall affordable rating, with a Median Multiple of 2.9. The recent house price declines have restored national housing affordability to the below 3.0 historic norm (last achieved in the early 2000s), as the price bubble burst in many markets. There were 98 affordable markets, most of which experienced an increase in demand. There were also 58 moderately affordable markets. Even with the price decreases, however, house prices remain far above historic norms in some markets. Eight of the markets were seriously unaffordable, while 11 were severely unaffordable. Plan-driven land use regulation is in place in all of the major markets with severely unaffordable housing affordability.

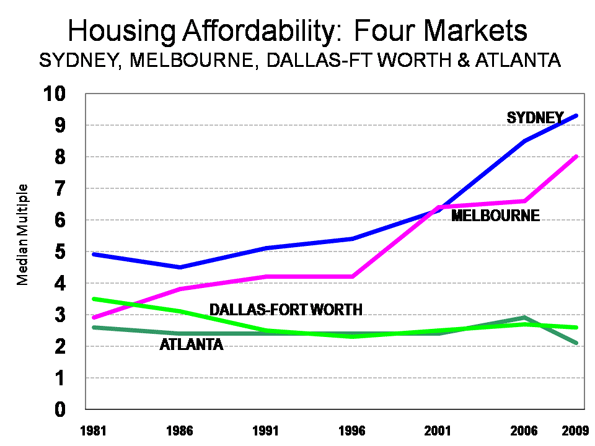
    Comparing Sydney, Melbourne, Dallas-Fort Worth and Atlanta

    Australia: A Nation in Mortgage Stress: The Survey includes a comparison of four similar markets, Sydney and Melbourne in Australia to Dallas-Fort Worth and Atlanta in the United States. In the early 1980s, Sydney had a higher population than Dallas-Fort Worth and Melbourne had a higher population than Atlanta. Since that time, the two US metropolitan areas have passed the Australian metropolitan areas in population, having added more people than Australia’s five largest metropolitan areas combined (Sydney, Melbourne, Brisbane, Perth and Adelaide). At the same time, despite their far higher demand, housing affordability has improved in Dallas-Fort Worth and Atlanta, while it has deteriorated markedly in Sydney and Melbourne (Figure 1). During this period, “plan driven” or more prescriptive land use policies were strongly enforced in Sydney and Melbourne in contrast to the “demand driven” land use policies in place in both Atlanta and Dallas-Fort Worth.

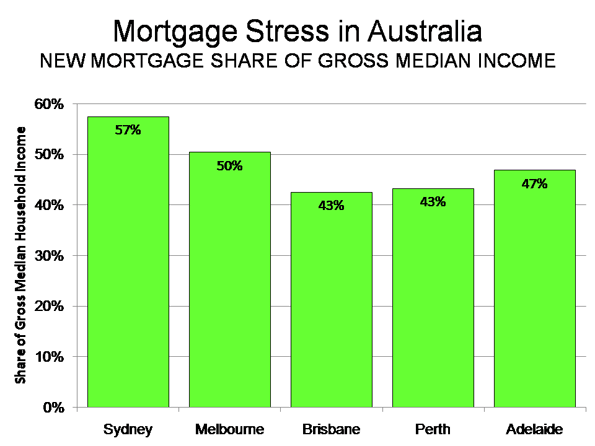
    Australian government agencies consider any household paying more than 30% of its gross income for housing to be in “housing stress.” At this point, a median income household in Sydney or Melbourne would pay more 50% or more of its gross income annually for a new mortgage on a median priced house. In Brisbane, Perth and Adelaide, the figure is above 40%. (Figure 2). By comparison, in Dallas-Fort Worth and Atlanta, however, the median income household would pay less than 20% of its income for the mortgage. Not surprising then is the huge loss in housing affordability in Australia, and a decline in home ownership rates from 72% to 68% between 1995 and 2008.

    Unaffordable Housing as Public Policy: It is clear that much of the cause for the differences in affordability lies with contrasting public policy approaches. The strong intervention in land markets under plan-driven regulation raises the price of land inordinately. Governments appear to have, however unwittingly, established unaffordable housing as an objective of public policy. Yet despite this, there is pressure – including from the US Obama administration, to adopt plan-driven regulation throughout the United States, despite the substantial economic disruption that such policies produced in the US bubble markets. Besides making houses unaffordable for many households, this could set the stage for even more housing bubbles in the future.

    If this trend continues, future generations will pay far more for their housing than did their parents. This seems likely to stunt economic growth and job creation, while facilitating higher levels of poverty and class stratification throughout the English speaking world.

    Wendell Cox is a Visiting Professor, Conservatoire National des Arts et Metiers, Paris. He was born in Los Angeles and was appointed to three terms on the Los Angeles County Transportation Commission by Mayor Tom Bradley. He is the author of “War on the Dream: How Anti-Sprawl Policy Threatens the Quality of Life.

  • E-Bikes, China and Human Aspirations

    The Wall Street Journal recently carried an article entitled “E-Yikes: Electric Bikes Terrorize the Streets of China.” The article describes difficulties arising from the fact that nearly 120 million electric (battery) bicycles (E-Bikes) are now in operation in China, as people have abandoned mechanical bicycles and highly-polluting petrol motorbikes.

    However, to the millions of owners, China’s E-Bikes are a boon, not a bane. E-Bikes are best understood in terms of human aspiration (just like cars in America or Western Europe). People generally seek to improve their lifestyles. Research at the University of Paris, the University of California, the University of North Carolina and elsewhere has clearly demonstrated a strong relationship between higher incomes and higher rates of economic growth where people have greater personal mobility. This is what the E-Bike provides.

    In the large urban areas of the 21st century, even the dense Chinese urban areas, travel is highly dispersed. The efficient operation of the urban area requires an ability to travel from any point in the urban area to any other point in a short amount of time. As effective as public transport can be for trips within the dense (but generally small) urban core or to the urban core from suburban areas, a large share of trips simply cannot be feasibly made any other way than by personal mobility. This includes walking, for very short trips and bicycles for somewhat longer trips. But, it also includes substantial and increasing travel by faster modes of transport, particularly cars and two-wheeled vehicles. E-Bikes have greatly improved mobility. At the same time, the E-Bike has enormously reduced both the air pollution and carbon footprint of two-wheeled personal mobility.

    This is not to discount the traffic and other difficulties. However, the Chinese, like their western counterparts, will continue to seek better lives and that means greater personal mobility. It means that E-Bike usage will continue to grow and that car usage will also continue to grow, as incomes rise. While that will make traffic congestion even worse, the spectacular automobile fuel efficiency improvements ahead will allow massive expansion of personal mobility, while moving in the right direction with respect to the carbon footprint. In the final analysis, the Chinese (and the Indians, Indonesians, etc.) would like to live as well as we do in the United States and Western Europe. And why not?

    Photograph: E-Bike display at a Suzhou (Jiangsu) hypermarket.

  • Traffic Congestion in Atlanta

    I was pleased to have the opportunity to have an op-ed produced on transportation in the Atlanta Journal-Constitution on January 17. The op-ed, entitled “Arterial system needed” argued that the most important thing the Atlanta metropolitan area could do to reduce traffic congestion would be to develop a decent arterial street system, something that, unbelievably, does not exist today. Regrettably, the permitted length of the op-ed did not permit much elaboration of the point, or mention of other important issues.

    In metropolitan areas with effective arterial street systems (such as Los Angeles), there is usually a surface alternative to a grid-locked freeway. A skilled driver can use these alternate routes and avoid much of the frustration of congestion. This may or may not improve travel times, but it is certainly better for the psyche. In Atlanta, there are few alternatives to the freeways and even the freeway system itself is very sparse.

    The principal elaboration for which I wish additional space had been available had to do with the role of transit. Many Atlanta officials are of the view that transit is the solution to traffic congestion. Many of them join pilgrimages to Portland (Oregon), where planners are only too happy to reinforce this view, with their doctrine to the effect that transit has transformed their urban area. The reality is that, after nearly 25 years of major transit improvements, transit’s market share in the Portland area is about the same as it was before.

    There are proposals to expand the MARTA transit system and tax from the core counties of Fulton and DeKalb to suburban counties. It is hard to imagine a more counterproductive policy approach. This would shower the overly-costly MARTA system with a stream of revenue with which its out of control costs per mile could escalate. The additional cost to taxpayers and riders would be far in excess of any potential benefits. MARTA’s principal problem is not lack of funding; it is rather insufficient cost control.

    The reality is that to reduce traffic congestion, transit would need to attract a large share of urban trips. In fact, however, whether in Paris, Portland or Atlanta, the transit system that could compete for most metropolitan trips has not yet been conceived of, much less developed or even proposed. Because of the necessity to travel from every point in an urban area to every other point, this is simply impossible. The vast majority of travel demand in all major urban areas of the United States and Western Europe is for personal mobility – automobiles – simply because there is no choice in their modern, affluent economies.

  • High-Speed Rail: Toward Least Worst Projections

    It comes as welcome news that the United States Department of Transportation Inspector General is concerned about the integrity of high-speed rail projections, “including ridership, costs, revenues and associated public benefits.” The issue has become ripe as a result of the $8 billion for high speed rail that the Obama Administration slipped into the economic stimulus bill early in 2009.

    The response was more than 250 applications from 30 states totaling $57 billion. It is easy to understand the Inspector General’s concern, though no-one should be surprised that the demand for free money outstrips the supply. Applicants range from the huge California High Speed Rail proposal, to a greenhouse gas belching magnetic levitation (maglev) line in population-losing Pittsburgh, to comparatively modest railroad grade crossings that could improve both railroad and highway safety.

    In a January 4 letter to the Federal Railroad Administrator, Inspector General Mitchel Behm announced an evaluation of “best practices” with respect to high-speed rail forecasts, noting that “it is of critical importance that the Federal investments are directed to the most worthy projects.” For starters, the Inspector General needs to understand that there are is no such thing as “best practices” in high-speed rail forecasts. Best practices and high speed rail in the same sentence sounds like a line from a comedy routine. The record of ridership, revenue and cost projections in high speed rail projects is abysmal.

    An Object Lesson: The Las Vegas Monorail Default: This was brought home earlier this week, when the privately financed Las Vegas Monorail defaulted on its bonds, principally because its ridership was absurdly over-projected. Even before the economic implosion (2007), the Las Vegas Monorail was carrying only 21,000 riders per day, far below the 53,500 riders that had been predicted for 2004 by the world-class planning firm retained by the promoters. In 2000 we produced a report predicting that the Monorail would carry between 16,900 and 25,400 daily riders. The reality was in the middle of that range. Of course, no venture could survive with consumer demand 60 percent below projections and default was inevitable, as we predicted. People who purchased the bonds may have overlooked the shaky foundations of the project, assuming that the state required bond insurance would make them whole. It did for the first defaulted payment, however the bond insurer, Ambac, itself is also in financial difficulty. Abmac has been characterized as “a borderline insolvent bond insurer.” Following Ambac’s debt payment, the Las Vegas Monorail filed for bankruptcy improbably claiming that it was necessary to permit expansion to the airport.

    High Speed Rail Follies: Of course, the Las Vegas Monorail is not a high-speed rail line, but high-speed rail projects are subject to the same risk of absurdly inaccurate projections of ridership, revenue and costs.

    High speed rail has often been touted by proponents as being profitable. However, they usually exclude such basic costs building the system and buying the trains. This is like a household that claims to be saving, but does not pay the mortgage. Proponents routinely repeat claims of profitability for one line or the other, without the slightest concept of reality. Indeed no less than Iñaki Barrón de Angoiti, director of high-speed rail at the International Union of Railways in Paris, said that high speed rail is not a profitable business and said that short Paris-Lyon and Tokyo-Osaka routes are the only ones in the world that have “broken even.”

    The California proposal, in particular, anticipates substantial private investment. Anyone courageous enough to invest will want due diligence performed by consultants other than those who produced the numbers to support the Las Vegas Monorail bond issue.

    Within the past few days, the non-partisan California Legislative Analyst’s office issued a critical report of the new California High Speed Rail business plan. The most damning criticism was that the plan “appears to violate law, because it assumed operating subsidies, which were prohibited by the bond issue passed by the voters of the state. This is particularly relevant to the USDOT Inspector General’s inquiry, since the California High Speed Rail Authority has been claiming for years that the project would not require operating subsidies. California, needless to say, is not in a position to be offering subsidies of any kind.

    Cheerleader Projections: There is plenty of reason for concern:

    Taiwan’s high-speed rail line, the only fully privately financed line in the world, has attracted approximately one-half of its projected ridership and has suffered considerable construction cost overruns. During its first few years of operations, its debt has been restructured, its bonds downgraded, expansion plans have been suspended and the Taiwan government has now taken majority control of the board. It should not be long before Taiwan taxpayers will be footing the bill.

    The new high-speed rail line in Korea is attracting approximately one-half of its projected ridership, while its costs were three to four times the projected level.

    This problem is all documented in Megaprojects and Risks: An Anatomy of Ambition, by Bent Flyvbjerg of Oxford University, Nils Bruzelius of and Werner Rothenberger of the University of Karlsruhe and former chairman of the World Conference on Transport Research. The authors examined decades of major transportation projects in Europe and North America and identified a general pattern of projection inaccuracy. With respect to the systematic cost projection errors, Professor Flyvbjerg says: “Underestimation cannot be explained by error and is best explained by strategic misrepresentation, that is, lying.” He further notes that “The policy implications are clear: legislators, administrators, investors, media representatives, and members of the public who value honest numbers should not trust cost estimates and cost-benefit analyses produced by project promoters and their analysts.”

    The California High Speed Roller Coaster: The proposed California High Speed Rail system seems poised to break “lower the bar” even further with respect to performance relative to projections. The ridership projections have been like a roller coaster. In 2000, the California High Speed Rail Authority’s modelers predicted, in an “investment grade projection” that the system would carry 32 million riders a year by 2020. Then, in 2007, the projection gurus raised the “base” number to 69 million by 2030 and added a “high” number of 97 million. By the time the high speed rail bond election was underway, some Authority board members went around the state citing a number of 117 million riders that included commuter ridership.

    Within the last month, the Authority has released a new plan indicating that ridership will be 41 million in 2035 (See Figure). If the 2000 ridership projections were “investment grade” then the subsequent projections have been “junk bond grade.”

    Joseph Vranich and I projected annual ridership of 23 million to 31 million for 2030 in a report published by the Reason Foundation (The California High Speed Rail Proposal: A Due Diligence Report). We also predicted, based upon our analysis of high speed rail systems worldwide, that the costs will rise by as much as another 70 percent to cover the usual cost overruns and to build portions of the system not included in the projections.

    The erratic ridership projections are just the beginning. We also found the proposed fare structure to be far too optimistic (fares far too low). Apparently the California High Speed Rail Authority agrees, because it has doubled its proposed fare levels. Meanwhile, its costs continue to rise, despite having risen by half from 2000 to 2008 (inflation adjusted), at the same time that the size of the proposed system was shrinking.

    Perverse Incentives: Part of the problem here lies with incentives. The “world class“ consulting firms have no incentive to produce reasonable numbers. Indeed, some actually participate in later stages of the projects and as a result have exactly the opposite incentive – an interest in projections being optimistic enough that the project gets approved.

    Solutions: The Inspector General might look at removing the incentive for misrepresentations and exaggeration, by prohibiting the participation of planning consultants in the implementation phase of high speed rail projects. Another modest proposal could revolutionize major project projections. Perhaps the world class consulting firms should be required to guarantee their projections financially.

    We certainly wish the Inspector General the best, though he has certainly set a standard (“best practices”) not likely to be achieved. But perhaps he can move the industry from absurdity to least worst projections.

    Wendell Cox is a Visiting Professor, Conservatoire National des Arts et Metiers, Paris. He was born in Los Angeles and was appointed to three terms on the Los Angeles County Transportation Commission by Mayor Tom Bradley. He is the author of “War on the Dream: How Anti-Sprawl Policy Threatens the Quality of Life.