Author: Wendell Cox

  • Go to Middle America, Young Men & Women

    A few weeks ago, Eamon Moynihan reviewed economic research on cost of living by state in a newgeography.com article. The results may seem surprising, given that some of the states with the highest median incomes rated far lower once prices were taken into consideration. The dynamic extends to the nation’s 51 metropolitan areas with more than 1,000,000 population (See Table).

    There is a general perception that the most affluent metropolitan areas are on the east coast and the west coast. Indeed, 8 of the 10 metropolitan areas with the highest nominal per capita income in 2006 were on the two coasts. These included San Francisco, San Jose and Seattle on the west coast and Washington, Boston, New York, Hartford and Philadelphia on the east coast. Middle-America is represented by Denver and Minneapolis-St. Paul. However, as anyone who has lived on the coasts and Middle America knows, a dollar in New York or San Francisco does not buy nearly as much as a dollar in Dallas-Fort Worth or Cincinnati.

    Per Capita Income: Purchasing Power Parity
    US Metropolitan Areas over 1,000,000 Population
        2006 Per Capita Income  
    Rank Metroplitan Area Purchasing Power Adjusted Nominal Nominal Rank
    1 San Francisco $46,287 $57,747 1
    2 Washington $45,178 $51,868 3
    3 Denver $44,798 $44,691 8
    4 Minneapolis-St. Paul $44,326 $44,237 9
    5 Houston $42,815 $43,174 11
    6 Boston $42,571 $50,542 4
    7 Pittsburgh $41,716 $38,550 20
    8 St. Louis $41,613 $37,652 27
    9 Milwaukee $41,572 $39,536 19
    10 Baltimore $41,451 $43,026 12
    11 Seattle $41,448 $45,369 6
    12 Kansas City $41,329 $37,566 28
    13 Hartford $41,104 $44,835 7
    14 New Orleans $40,935 $40,211 16
    15 Philadelphia $40,725 $43,364 10
    16 Dallas-Fort Worth $40,643 $39,924 17
    17 Cleveland $39,997 $37,406 30
    18 Indianapolis $39,843 $37,735 26
    19 Chicago $39,752 $41,591 14
    20 Richmond $39,282 $38,233 22
    21 New York $39,201 $49,789 5
    22 Birmingham $39,057 $37,331 31
    23 Cincinnati $38,691 $36,650 36
    24 Nashville $38,680 $37,758 25
    25 Detroit $38,670 $38,119 24
    26 Charlotte $38,632 $38,164 23
    27 Miami $38,555 $40,737 15
    28 San Jose $38,505 $55,020 2
    29 Jacksonville $38,413 $37,519 29
    30 Louisville $38,262 $36,000 41
    31 Oklahoma City $38,156 $35,637 42
    32 Las Vegas $37,691 $38,281 21
    33 Salt Lake City $37,381 $35,145 45
    34 San Diego $37,358 $42,801 13
    35 Rochester $37,066 $36,179 38
    36 Columbus $37,058 $36,110 39
    37 Atlanta $36,691 $36,060 40
    38 Memphis $36,501 $35,470 44
    39 Tampa-St. Petersburg $36,260 $35,541 43
    40 Portland $36,131 $36,845 35
    41 Buffalo $36,091 $33,803 48
    42 Norfolk (Virginia Beach metropolitan area) $35,418 $34,858 46
    43 Raleigh $35,087 $37,221 32
    44 San Antonio $34,913 $32,810 50
    45 Providence $34,690 $37,040 34
    46 Austin $33,832 $36,328 37
    47 Phoenix $33,809 $34,215 47
    48 Sacramento $32,750 $37,078 33
    49 Los Angeles $32,544 $39,880 18
    50 Orlando $32,095 $33,092 49
    51 Riverside-San Bernardino $25,840 $27,936 51
    Source:        
    http://www.bea.gov/scb/pdf/2008/11%20November/1108_spotlight_parities.pdf

    Purchasing Power Parity: Things change rather dramatically when purchasing power is factored in. Some years ago, international economic organizations, such as the Organization for Economic Cooperation and Development, the World Bank and the International Monetary Fund began using costs of living by nation to compare national economic performance, rather than currency exchange rate. This practice, called “purchasing power parity” is based upon the recognition that there may be substantial differences in the cost of living between nations.

    This can be illustrated by comparing Switzerland and the United States. For years, Switzerland has had a higher per capita GDP than the United States on an exchange rate basis. Switzerland’s gross domestic product per capita was $53,300 in 2006, nearly 30% above that of the United States ($42,000). However price levels in Switzerland are so high that incomes do not go nearly as far as the exchange rate would suggest. Once adjusted for purchasing power parity, the Swiss GDP per capita in 2006 drops to $39,000, well below that of the United States. Much of the difference has to do with regulation. The more liberal economy of the United States produces a lower cost economy than in Switzerland, or for that matter most of Western Europe. The US economic advantage would be even greater measured on a household basis, since US households include nearly 10% more members (generally children) than those in Western Europe.

    The same concept was applied by the Department of Commerce Bureau of Economic Analysis researchers in their review of purchasing power parities between US metropolitan areas in 2006. When purchasing power is factored in, five of the top metropolitan areas in nominal per capita income (not adjusted for purchasing power) drop out and are replaced by other metropolitan areas rarely thought of as among the nation’s most affluent.

    Among the three west coast nominal leaders, San Francisco remains as #1, in both nominal and purchasing power adjusted per capita income. Seattle dropped from 6th to 11th position. However, the real surprise is San Jose, which dropped from 2nd position to 28th.

    The east coast regions ranked among the top 10 metropolitan areas in nominal income also were decimated by their high costs, with only Washington (which rose from 3rd to 2nd) and Boston (which fell from 4th to 6th) remaining. New York fell from 5th to 21st, Hartford from 7th to 13th and Philadelphia from 10th to 16th.

    The two non-coastal metropolitan areas in the nominal top 10 remain, with Denver rising from to 3rd and Minneapolis-St. Paul rising from 9th to 4th.

    It can be argued that Middle-America replaced the five metropolitan areas dropping out of the top ten. Houston, long one of the most disparaged metropolitan areas among urbanists, occupies the 5th position (compared to its 11th ranking in the nominal list). Three of the new entrants are confirmed members of the Rust Belt: Pittsburgh (7th), St. Louis (8th) and Milwaukee (9th). Finally, there is a new east coast entrant, blue-collar Baltimore (10th).

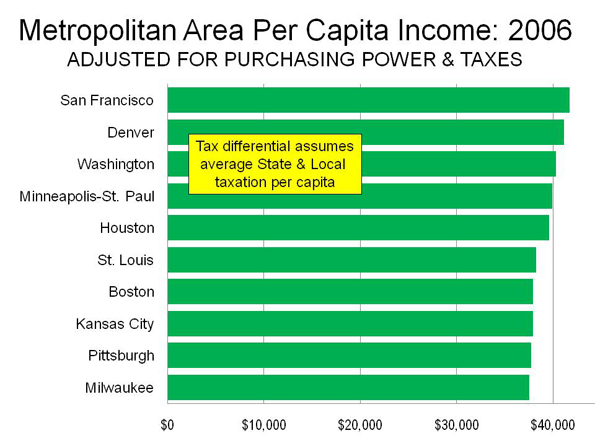
    The Impact of Taxes: But that is just the beginning. Taxes also diminish the purchasing power of households. Unfortunately, there is virtually no readily available information on state and local taxation by metropolitan area. There is, however state and local government taxation data at the state level. If it is assumed that this data is representative of metropolitan differences (weighted proportionately by state in multi-state metropolitan areas), there would be changes in rank among the top 10. Denver would displace Washington in the number two position, closing more than one-half the gap with San Francisco. Even more surprisingly, St. Louis would move ahead of both Boston and Pittsburgh to rank 6th. Kansas City would leap over #11 Seattle, Baltimore, Milwaukee and Pittsburgh to rank 8th, trailing #7 Boston by $25, not much more than the price of a Red Sox standing room ticket. Pittsburgh would occupy the #9 position and Milwaukee #10 (See Figure).

    More than Housing: The largest differences in purchasing power stem from housing, with east coast and west coast metropolitan areas having generally higher housing costs. As a result of the housing bust and the larger house price drops in those areas, purchasing power adjusted incomes could recover relative to those of Middle America. However, the high cost of living on the east and west coasts extend to more than housing prices. Generally, according to proprietary (and for sale) ACCRA cost of living data, the west coast and east coast metropolitan areas have higher costs of living even without housing. These differences are largely in grocery costs, which probably reflects the anti-big box store planning regulations and politics that exist in many of these areas. Grocery costs in the more affluent middle-American metropolitan areas tend to be lower.

    Other Surprises: Outside the top 10 most affluent metropolitan areas, there are other surprises. Urban planning favorite Portland ranks 40th, just above Buffalo. Rust Belt Cleveland ranks 17th, a few positions above New York. Kansas City, with its highly decentralized civic architecture, ranks 12th, just behind Seattle. Indianapolis (17th) is more affluent than Chicago (18th) and both are more affluent than New York.

    Five of the bottom 10 metropolitan areas are in the south, including Virginia Beach, Raleigh, Austin, San Antonio and Orlando. But perhaps the biggest surprise of all is that four of the five lowest ranking metropolitan areas are in the southwest: Phoenix (47th), Sacramento (48th), Los Angeles (49th) and Riverside-San Bernardino (51st).

    The Dominance of Middle America: But among the 10 most affluent metropolitan areas in the nation, six or seven may be counted as Middle-America (depending on how Baltimore is classified). Only three are from the original group that supplies 8 of the top metropolitan areas when purchasing power is not considered.


    Related articles:
    Gross Domestic Product per Capita, PPP: World Metropolitan Regions
    Gross Domestic Product per Capita, PPP: China Metropolitan Regions

    Photograph: Pittsburgh

    Wendell Cox is a Visiting Professor, Conservatoire National des Arts et Metiers, Paris. He was born in Los Angeles and was appointed to three terms on the Los Angeles County Transportation Commission by Mayor Tom Bradley. He is the author of “War on the Dream: How Anti-Sprawl Policy Threatens the Quality of Life.

  • On Cities, GHG Emissions, Apples & Oranges

    Every day or so a new greenhouse gas emission report crosses my desk. Often these reports are very useful, other times they add little of value to the subject. The problem is separating the “wheat” from the “chaff.”

    This dilemma is well illustrated by a paper called “Greenhouse Gas Emissions from Global Cities,” authored by 10 academics. I had received notification of the paper from Science Daily, a useful website that provides notification of new research on a wide range of scientific subjects.

    The Science Daily article indicated that Denver produces the most greenhouse gases per capita annually, while Barcelona produces the least. I am always interested in reports that compare the performance of “cities,” both out of general interest and because of the gross errors that often are the result of invalid comparisons. So, immediately I ran down the report, and to my surprise the report dealt with only 10 “cities.” This seems rather a small number, since the smallest in the sample, Geneva, is not even among the top 700 urban areas in the world. This seems to be a rather incomplete sample: 10 out of more than 700.

    That was just the beginning. There were serious problems of comparison between the 10 “cities.” Whenever someone starts talking about “cities,” it is best to ask what they mean. The word “cities” has so many meanings and is subject to such confusion that I generally avoid using it.

    “Cities” might be municipalities, such as the city of New York or the ville de Paris.

    Cities could be urban areas (urbanized areas or urban agglomerations), which are the urban footprints one observes from an airplane on a clear night.

    “Cities” could be metropolitan areas, which are labor markets and are generally larger than urban areas, because people commute from rural areas (outside the urban footprint) to work in the urban area.

    In nearly the entire world, with the exception of China, urban areas and metropolitan areas are larger than municipalities.

    Or, “cities” could be used in the sense of Chinese prefectural, sub-provincial or provincial level cities, which tend to be far larger than any reasonable definition of a metropolitan area. Nearly all of China is divided into cities, in the same way that most of the United States is divided into counties.

    These Chinese “cities” themselves often contain county level “cities” that are separate from the principal urban areas.

    These differing definitions of municipalities make any international comparison of these entities difficult and often misleading. The ville de Paris represents barely 20 percent of the Paris region. The “city” of Atlanta represents barely 10 percent of its metropolitan area. The “city” of Melbourne represents only 5 percent of its metropolitan area. Yet, other “cities” are larger than their metropolitan areas, such as Chongqing, China, which has at least five times the population of its genuine metropolitan area (the “city” covers an area the size of Austria or Indiana). The city of San Antonio, with its vast stretches of suburbanization is surely not comparable to the city of Hartford, which is dominated by an urban core.

    Any genuine comparison of “cities” must be at the metropolitan area or urban area level. These definitions both represent the city as the organism it is, rather than simply the happenstance of municipal boundaries. Of course, comparisons must be either between metropolitan areas or urban areas to be valid. It will not do to compare metropolitan areas with urban areas; they are as apples and oranges. Moreover, there are no international standards for delineation of metropolitan areas, which makes metropolitan comparisons more complex.

    All of this raises the principal problem with the “Global Cities” paper. There is no consistency to the city definitions the paper uses and its results are thus meaningless (though “headline grabbing”). For example, “Global Cities” uses the geographic areas of the following barely comparable “cities”:

    The municipality of Barcelona, which represents less than one half of the urban area and excludes the expansive suburbs that stretch in every direction but the Mediterranean.

    The municipalities of Bangkok, Denver and New York, which are only parts of their respective metropolitan or urban areas.

    The municipality of Cape Town, which could be considered a metropolitan area because of the large expanse of rural area under its jurisdiction.

    The canton (province) of Geneva might probably qualify as a metropolitan area, except that it excludes the suburbs in France, from which virtually free movement of labor is permitted.

    The Greater London Authority which is nearly co-existent with the London urban area, while Prague as the report defines it is somewhat larger than its urban area.

    The Greater Toronto Area which meets none of the “city” definitions above and is larger than both the metropolitan area and the urban area as defined by Statistics Canada.

    Los Angeles County, which meets none of the “city” definitions and is part of the larger Los Angeles-Orange County metropolitan area.

    All in all, as charitably as it can be put, the “Global City” compares four municipalities, three metropolitan areas, two urban areas, one area larger than a metropolitan area and one that is part of a metropolitan area. Put another way, it tries to make comparisons between four apples, three oranges, two peaches, one banana and one sweet potato.

    Granted, the paper indicates the geographical definitions it uses. That, does not, however, change the fact that treating apples and oranges as comparable is simply invalid.

    There are other problems with the “Global Cities” paper, but one more is enough. In the obligatory fashion, the authors stress how important it is to adopt “smart growth” policies in North America. They cite a US Department of Transportation study to indicate that a doubling of density reduces vehicle miles traveled by 40 percent.

    A bit closer reading would have indicated that the study says doubling density would reduce new vehicle miles by 40 percent, where population densities are already 6,000 to 7,000 per square mile. Only two large urban areas in the United States have densities that high, San Francisco and Los Angeles (which the authors characterize as having urban densities at least 40 percent below the US Bureau of the Census number for the Los Angeles urban area). A 40 percent reduction in “new” vehicle miles means that overall vehicle miles traveled increase 60 percent when the population is doubled, rather than 100 percent. Thus, even with the high density qualification in the US Department of Transportation study, vehicle miles would increase 60 percent as population densities double.

    Maybe tomorrow will bring a better report. One can always hope.

    Photograph: The “city” of Chongqing (part of its vast rural countryside)

    Wendell Cox is a Visiting Professor, Conservatoire National des Arts et Metiers, Paris. He was born in Los Angeles and was appointed to three terms on the Los Angeles County Transportation Commission by Mayor Tom Bradley. He is the author of “War on the Dream: How Anti-Sprawl Policy Threatens the Quality of Life.

  • How Smart Growth Disadvantages African-Americans & Hispanics

    It was more than 45 years ago that Dr. Martin Luther King, Jr. enunciated his “Dream” to a huge throng on the Capitol Mall. There is no doubt that substantial progress toward ethnic equality has been achieved since that time, even to the point of having elected a Black US President.

    The Minority Home Ownership Gap: But there is some way to go. Home ownership represents the core of the “American Dream” that was certainly a part of Dr. King’s vision. Yet, there remain significant gap in homeownership by ethnicity. Rather than a matter of discrimination, this largely reflects differing income levels between White-Non-Hispanics, African-Americans and Hispanics or Latinos. Today, approximately 75% of white households own their own homes. Whites have a home ownership rate fully one-half higher than that of African-Americans and Hispanics or Latinos at 47% and 49% (See Figure).

    Setting the Gap in Stone: A key to redressing this difficulty will be convergence of minority household incomes with those of whites, and that is surely likely to happen. However, there is another important dynamic in operation: house prices in some areas have risen well in advance of incomes, so that convergence alone can not narrow the home ownership gap in a corresponding manner. It is an outrage for public policy to force housing prices materially higher so long as home ownership remains beyond the incomes of so many, especially minorities.

    The Problem: Land Use Regulation: The problem is land use regulation. The economic evidence is clear: more restrictive land use regulation raises house prices relative to household incomes. This can be seen with a vengeance in the house price increases that occurred during the housing bubble. As we have previously described, metropolitan markets with more restrictive land use regulation (principally the more radical “smart growth” policies) experienced house price escalation out of all proportion to other areas in the nation. In some cases, they topped out at nearly four times historical norms. On the other hand, in the one-half of major metropolitan area markets where land use regulations were less severe, house prices tended to increase to little more than historic norms, at the most.

    How Smart Growth Destroys Housing Affordability: This difference is principally due to the price of land, which is forced upward when the amount of land available for building is artificially limited, as is the case in smart growth markets. At the peak of the bubble, there was comparatively little difference in house construction costs per square foot in either smart growth or less restrictive markets. However, the far higher land prices drove house prices in smart growth markets far above those in less restrictively regulated markets. Where house prices rise faster than incomes, housing affordability drops as prices rise at escalated rates.

    Wishing Away Reality: It is not surprising that the proponents of smart growth undertake Herculean efforts to deflect attention away from this issue. Usually they pretend there is no problem. Sometimes they produce studies to indicate that limiting the supply of land and housing does not impact housing affordability, which is akin to arguing that the sun rises in the West. Even the proponents, however, cannot “walk a straight line” on this issue, noting in their most important advocacy piece (Costs of Sprawl – 2000) that their more important strategies have the potential to increase the cost of housing.

    The Assault on Home Ownership: Worse, well connected Washington interest groups (such as the Moving Cooler coalition) and some members of Congress seek to universalize smart growth land rationing throughout the nation, which would cause massive supply problems and housing price inflation that occurred in some markets between 2000 and 2007. Even after the crash, these markets experienced generally higher house prices relative to incomes in smart growth markets than in traditionally regulated markets.

    House Price Increases and Minorities: House price increases relative to incomes weigh most heavily on ethnic minority households, because their incomes tend to be lower. This is illustrated by an examination of the 2007 data from the American Community Survey, in our special report entitled US Metropolitan Area Housing Affordability Indicators by Ethnicity: 2007. The year 2007 was the peak of the housing bubble, but represents a useful point of reference for when future “smart growth” policies were imposed nationwide.

    Median Priced Housing: The data (Table) indicates that median house prices were 75% or more higher for African-Americans than Whites, however that African-Americans in smart growth markets require 84% more to buy the median priced house. The situation was slightly better for Hispanics or Latinos with median house prices at least 50% more relative to incomes than for Whites. House prices relative to Hispanic or Latino median household incomes were 86% higher in smart growth markets than in less restrictively regulated markets.

    SUMMARY OF HOUSING INDICATORS BY
    LAND USE REGULATION CATEGORY
    Metropolitan Areas over 1,000,000 Population: 2007
    HOUSING INDICATOR Less Restrictive Land Use Regulation Markets More Restrictive Land Use Regulation Markets All Markets More Restrictive Markets Compared to Less Restrictive Markets
    MEDIAN VALUE MULTIPLE        
    All 3.1 5.8 4.5 1.89
    White Non-Hispanic or Latino 2.7 5.1 3.9 1.90
    African-American 4.9 8.9 6.9 1.84
    Hispanic or Latino 4.2 7.9 6.1 1.86
    LOWEST QUARTILE VALUE MULTIPLE      
    All 2.1 4.2 3.2 2.01
    White Non-Hispanic or Latino 1.8 3.7 2.8 2.01
    African-American 3.3 6.5 5.0 1.95
    Hispanic or Latino 2.9 5.7 4.4 1.98
    MEDIAN RENT/MEDIAN HOUSEHOLD INCOME      
    All 13.8% 17.1% 15.5% 1.24
    White Non-Hispanic or Latino 12.1% 15.1% 13.6% 1.25
    African-American 21.9% 26.1% 24.0% 1.19
    Hispanic or Latino 19.1% 23.0% 21.1% 1.20
    LOWER QUARTILE RENT/MEDIAN HOUSEHOLD INCOME    
    All 10.8% 13.1% 12.0% 1.22
    White Non-Hispanic or Latino 9.4% 11.6% 10.5% 1.23
    African-American 17.0% 20.0% 18.5% 1.17
    Hispanic or Latino 14.9% 17.5% 16.2% 1.18
    NOTES        
    Median Value Multiple: Median House Value divided by Median Household Income
    Low Quartile Value Multiple: Low Quartile House Value divided by Median Household Income
    2007 Data
    Calculated from American Community Survey (US Bureau of the Census) Data
    “More restrictive” land use regulation markets (generally "smart growth") include those classified as "growth management," "growth control," "containment" and "contain-lite" and "exclusions: in "From Traditional to Reformed A Review of the Land Use Regulations in the Nation’s 50 largest Metropolitan Areas" (Brookings Institution, 2006) and markets with significant large lot zoning and land preservation restrictions (New York, Chicago, Hartford, Milwaukee, Minneapolis-St. Paul, and Virginia Beach). Less restrictive" land use regulation markets (generally "traditional") include all others, except for Memphis, where urban growth boundaries have been drawn far enough from the urban area to have no perceivable impact on land prices and Nashville, where the core county is exempt from the urban growth boundary requirement in state law.

    Lower Priced Housing (Lowest Quartile): I recall being told by a participant at a University of California–Santa Barbara economic forum organized by newgeography.com contributor Bill Watkins that, yes, smart growth increases house prices, but not for lower income residents. My challenger went so far as to say that lower income households were aided economically by smart growth. The facts are precisely the opposite. Comparing the lowest quintile (lowest 25%) house price to median household incomes indicates that minorities pay even a higher portion of their incomes for lowest quintile priced houses than the median priced house. African-Americans in smart growth markets needed 95% more relative to incomes to afford the lowest quartile house. Hispanics or Latinos needed 98% more.

    Rental Housing: The problem carries through to rental housing. There is a general relationship between rental prices and house prices, though rental prices tend to “lag” house price increases. In the smart growth markets, minorities must pay approximately 20% more of their income for the median contract rental in smart growth metropolitan areas than in less restrictively regulated markets. Similar results are obtained when comparing minority household median incomes with lowest quintile contract rents, with African-Americans paying 17% more of their incomes in smart growth markets and Hispanics or Latinos paying 18% more.

    Moreover, it is important to recognize that all of the above data is relative, based on shares or percentages of incomes. Varying income levels are thus factored out. Minority and other households in smart growth markets face costs of living that are approximately 30% higher than in less restrictively regulated markets, according to analysis by US Department of Commerce Bureau of Economic Analysis economists. Some, but not all of the difference is in higher housing costs.

    Social Costs of Smart Growth: In 2004, the Tomas Rivera Policy Institute, which focuses on Latino issues, noted concern about the homeownership gap in California, which has been ground zero for land use regulation driven house price increases for decades:

    Whether the Latino homeownership gap can be closed, or projected demand for homeownership in 2020 be met, will depend not only on the growth of incomes and availability of mortgage money, but also on how decisively California moves to dismantle regulatory barriers that hinder the production of affordable housing. Far from helping, they are making it particularly difficult for Latino and African American households to own a home.

    Examples of the restrictions cited by the Tomas Rivera Policy Institute are restrictions on the supply of land, high development impact fees and growth controls.

    California has acted decisively, but against the interests of African-Americans and Hispanics or Latinos. The state enacted Senate Bill 375 in 2008, which will impose far stronger state regulations on residential development, increasing the likelihood that minorities in California will always be disadvantaged relative to White-Non-Hispanics. At the same time, State Attorney General Jerry Brown has forced some counties to adopt more restrictive land use regulations through legal actions. California, which had for decades been considered a state of opportunity, is making home ownership and the pursuit of the “American Dream” far more difficult, particularly for its ever more diverse population.

    Stopping the Plague: In California, the hope to increase African-American and Latino home ownership rates to match those of white-non-Hispanics may already be beyond reach due to the that state’s every intensifying radical smart growth policies. However, the “Dream” continues to “hang on” in many metropolitan markets. Hopefully Washington will not put a barrier in the way of African-Americans and Hispanics or Latinos that live elsewhere in the nation.

    US Metropolitan Area Housing Affordability Indicators by Ethnicity: 2007 includes tables with data for each major metropolitan area in the United States

    Photo: Starter house in Atlanta suburbs (by the author)

    Wendell Cox is a Visiting Professor, Conservatoire National des Arts et Metiers, Paris. He was born in Los Angeles and was appointed to three terms on the Los Angeles County Transportation Commission by Mayor Tom Bradley. He is the author of “War on the Dream: How Anti-Sprawl Policy Threatens the Quality of Life.

  • Taiwan’s Failing High Speed Rail Line Faces Government Takeover

    According to Railway Technology, Taiwan’s struggling high speed rail line, the only fully private and commercial high speed rail system in the world, will be taken over by the government his week. The line has been plagued by disappointing ridership levels totaling approximately one-third projected levels. The company has generated insufficient revenues to meet its debt obligations and had previously renegotiated its bank credit to substantially lower interest rates. The company lost $770 million in 2008 and has a debt of approximately $10 billion. The cost of the system was approximately $15 billion.

  • High Speed Rail in Springfield: “The Whole City Would Look Like Crap”

    Not every local official is smitten with the romance of high-speed rail. Graphic evidence of this was provided by Springfield, Illinois mayor Tim Davlin, who expressed his concern that the proposed rail overpasses would slice the city in half. Davlin told the State Journal Register that the “Whole city would look like crap.” This is a problem faced not only by historic Springfield, the state’s capital and location of many Abraham Lincoln sites. Citizens and cities on the San Francisco peninsula are concerned that a proposed “Berlin Wall” will divide their communities if construction of an elevated high speed rail wall proceeds through their communities.

  • Traffic Congestion, Time, Money & Productivity

    It is an old saying, but true as ever: “Time is money.” A company that can produce quality products in less time than its competitors is likely to be more profitable and productive. An urban area where employees travel less time to get to work is likely to be more productive than one where travel times are longer, all things being equal. Productivity is a principal aim of economic policy. Productivity means greater economic growth, greater job creation and less poverty.

    Congestion Costs: This is why such serious attention is paid to the Texas Transportation Institute’s (TTI) Annual Mobility Report, which estimates the costs of traffic congestion, principally the value of lost time as well as excess fuel costs. The fundamental premise, long a principle of transportation planning and policy, holds that more time spent traveling costs money, to employers, employees and shippers.

    Mobility & Productivity: Groundbreaking Research: Yet, until fairly recently, very little research was available to document the connection between travel times and the productivity of urban areas. The pioneering work has now been done by Remy Prud’homme and Chang-Woon Lee at the University of Paris. From reviewing French and Korean urban areas, they showed that productivity improves as the number of jobs that can be reached by employees in a particular period of time (such as 30 minutes) increases.

    Focused US Research: US reports on mobility’s role in reducing poverty came to similar conclusions. A middle 1990s report for the Federal Transit Administration found that low income households in inner city Boston were at a particular disadvantage in obtaining jobs in the fast growing suburbs because transit service was either spotty or non-existent. Margy Waller and Mark Allen Hughes noted in a report for the Progressive Policy Institute that “In most cases, the shortest distance between a poor person and a job is along a line driven in a car”. Steven Raphael and Michael Stoll at the University of California found that access to an automobile nearly halved the difference between African American unemployment and that of non-Hispanic Whites.

    New, Comprehensive US Research: But it was only last month that the Prud’homme-Chang research was broadly replicated in the United States. The Reason Foundation published “Gridlock and Growth: The Effect of Traffic Congestion on Regional Economic Performance” by David Hartgen and M. Gregory Fields, which looked at job accessibility in 8 US urban areas (Atlanta, Charlotte, Dallas, Denver, Detroit, Salt Lake City, San Francisco and Seattle, ). Hartgen and Fields chose a 25 minute commute period (the approximate national average one-way work trip) to evaluate accessibility and found, generally, that each 10 percent increase in the number of jobs accessible in that period resulted in a 1 percent increase in productivity, as measured by the Gross Domestic Product of the urban area. They also found that if free-flow traffic conditions could be established, considerable improvements in urban productivity would be achieved, because employees could get to more jobs in less time. At the same time, they show that traffic congestion will worsen considerably by 2030 under present plans as adopted by metropolitan planning organizations.

    Hartgen and Lee looked at five sample work destinations in each urban area, the central business district, the airport, a university, a mall and a major suburb. The results by sub region were surprising:

    “Contrary to conventional planning wisdom, the research suggests that regional economies might be more dependent on access to major suburbs, malls and universities than on access to downtowns or airports. Not only are models of productivity somewhat stronger for these sites than for CBD accessibility, but access to them has a stronger effect on regional productivity.”

    The research indicates that achieving free flow traffic conditions to major suburbs, universities and malls would increase gross domestic products by from 6 to 30 percent. The gain in central business districts would be between 4 and 10 percent, while airports showed the least potential for adding to urban productivity, at 2 to 8 percent. These productivity gains are far from unachievable. Hartgen and Fields find that there is more than enough transportation funding in each of the urban areas to remove severe traffic congestion by 2030. These conclusions find fault with the growing emphasis by many in Washington to force people out of cars and into transit. Transit is simply not viable for the non-downtown markets, which have the greatest potential for improving job creation and economic growth.

    Hartgen and Fields also show that achieving free flow operations in the studied urban areas would generally produce more in increased tax revenues by 2030 than the costs associated with reducing it.

    American Urban Areas: Superior Productivity and Mobility: American urban areas are among the most mobile in the world. When compared to international urban areas of similar size, work trip travel times in the United States tend to be less. That is one of the reasons that US metropolitan areas are the most productive in the world.

    For example, the Japanese megacity of Osaka-Kobe-Kyoto has somewhat fewer people than the New York consolidated (metropolitan) area and slightly more than the Los Angeles-Riverside consolidated area. Osaka-Kobe-Kyoto has perhaps the world’s second most heavily patronized transit system (after Tokyo), which carries at least 50% as many riders on its rail lines alone as all of the transit systems in the United States. Yet, in Osaka-Kobe-Kyoto, workers spend 20 percent more time traveling between work and home each year as New Yorkers. They spend 40 percent more time commuting than workers in Los Angeles, despite its having the worst traffic congestion in the nation. The difference between Osaka-Kobe-Kyoto and New York and Los Angeles lies in the fact that in the two American metropolitan areas, most workers travel to work by car, to destinations throughout the areas (Note 1).

    Naïve Proponents of Poverty: However, not everyone understands that time is money. Some members of the US Senate and House of Representatives and Washington special interests would seek to restrict highway funding, making traffic congestion even worse. They would seek to reduce the number of miles that Americans travel by car in an attempt to achieve marginal greenhouse gas emission reductions (that is before the higher greenhouse gas emissions that occur in slower, more congested traffic is factored in). Secretary of Transportation Ray LaHood has indicated a desire to coerce people out of their cars.

    Transit: Inherently Less Productive and Expensive: One common claim is that transit will provide alternative mobility. However, transit trips tend to be twice as long as car trips and no transit vision has ever been put forward that would replicate the efficiency of the automobile. There is good reason for this, since such a transit system would cost on the order of a metropolitan area’s entire income, each year, to operate and amortize. And, transit is expensive. The recent compact cities policy lobbying paper, Moving Cooler, shows that transit is far from a cost effective means for reducing greenhouse gas emissions, costing 20 times the maximum $50 per ton guideline as established by the United Nations Intergovernmental Panel on Climate Change.

    None of this is to deny the inestimable value of transit in serving the nation’s largest downtown areas (such as Manhattan, Brooklyn, Boston, Philadelphia, Chicago and San Francisco). However these locations are commercial hyper-density aberrations in much larger low-density seas and are exceptional among America’s more diffuse metropolitan areas. Rather, the problem is overselling transit in markets that it cannot competitively serve. Disinvesting in highways (forcing people into transit) makes no more sense than to require the injection of blood clots into the bloodstreams of patients under the guise of improving the health and livability of patients.

    It’s the Economy, Stupid: The United States has had enough recent experience with rising unemployment and falling economic performance. It hardly needs public policies that would increase travel time, reduce productivity and increase poverty, no matter how fervently and sincerely held are the misconceptions of the proponents. Hartgen and Fields have provided an invaluable work that could not have come at a better time.


    Note 1: Calculated from United States Bureau of the Census American Community Survey and Japan Statistics Bureau data.


    Wendell Cox is a Visiting Professor, Conservatoire National des Arts et Metiers, Paris. He was born in Los Angeles and was appointed to three terms on the Los Angeles County Transportation Commission by Mayor Tom Bradley. He is the author of “War on the Dream: How Anti-Sprawl Policy Threatens the Quality of Life.

  • The Costs of Climate Change Strategies, Who Will Tell People?

    Not for the first time, reality and politics may be on a collision course. This time it’s in respect to the costs of strategies intended to reduce greenhouse gas emissions. The Waxman-Markey “cap and trade” bill still awaits consideration by the US Senate, interest groups – mainly rapid transit, green groups and urban land owners – epitomized by the “Moving Cooler” coalition but they are already “low-balling” the costs of implementation.

    But this approach belies a bigger consideration: Americans seem to have limits to how much they will pay for radical greenhouse emissions reduction schemes. According to a recent poll by Rasmussen, slightly more than one-third of respondents (who provided an answer) are willing to spend $100 or more per year to reduce greenhouse gas emissions. About 2 percent would spend more than $1,000. Those may sound like big numbers, but they are a pittance compared to what is likely to be required to meet the more than 80 percent reduction in greenhouse gas emissions that the Waxman-Markey bill would require. Even more worryingly for politicians relying on voters to return them to office, nearly two-thirds of the respondents would pay nothing to reduce greenhouse gas emissions.

    If we do a rough, weighted average of the Rasmussen numbers, it appears that Americans are willing to spend about $100 per household per year (Note 1). This includes everyone, from the great majority, who would spend zero to the small percentage who would spend more than $1,000. At $100 per household, it appears that Americans are willing to spend on the order of $12 billion annually. This may look like a big number. But it is peanuts compared to market prices for greenhouse gas emissions. This is illustrated by the fact that the social engineers whose articles of faith requires building high speed rail to reduce greenhouse gas emissions would spend $12 billion to construct just 150 miles of California’s proposed 800 mile system.

    Comparing Consumer Tolerance to Expected Costs: At $100 per household, Americans are prepared to pay just $2 per greenhouse gas ton removed. All of this is in a policy context in which the United Nations Intergovernmental Panel on Climate Change suggests that $20-$50 per greenhouse gas ton is the maximum that should be spent per ton. The often quoted McKinsey/Conference Board study says that huge reductions in greenhouse gas emissions can be achieved at $50 or less, with an average cost per ton of $17. International markets now value a ton of greenhouse gas emissions at around $20. At $2 per ton, American households are simply not on the same “planet” with the radical climate change lobby as to how much they wish to spend on reducing greenhouse gases.

    International Comrades in Arms? This is not simply about Americans and their perceived differences from others who are so often considered more environmentally sensitive. France’s President Sarkozy has encountered serious opposition in proposing a carbon tax on consumers to discourage fossil fuel use. He is running into problems not only among members of the opposition, but concerns have also been expressed by members of his own party. It appears that many French consumers (like their American comrades) are more concerned about the economy than climate change at the moment.

    China, India and Beyond: If only a bit more than one-third of American households are willing to pay much of anything to reduce greenhouse gas emissions, it seems fair to ask what percentage of households in China, India and other developing nations are prepared to pay anything? A possible answer was provided recently by India’s environment minister, Jairam Ramesh, who released a report predicting that India’s greenhouse gas emissions would rise from the present 1.2 billion tons to between 4 and 7 billion tons in 2030. The minister said the “world should not worry about the threat posed by India’s carbon emissions, since its per-capita emissions would never exceed that of developed countries.” . At the higher end of the predicted range, India would add more greenhouse gas emissions than the United States would cut under even the proposed 80 percent reduction scheme. Suffice it to say that heroic actions to reduce greenhouse gas emissions seem unlikely in developing countries so long as their citizens live below the comfort levels of Americans and Europeans.

    Lower Standard of Living not an Option: I have been giving presentations on this and similar subjects for some years. I have yet to discern any seething undercurrent of desire on the part of Americans (or the vast majority anywhere else) to return to the living standards of 1980, much less 1950 or 1750. Neither Washington’s politicians nor those in Paris or any other high income world capital are going to tell the people that they must accept a lower standard of living. Nor is there any movement in Washington to let the people know that their tolerance for higher prices could well be insufficient to the task.

    For Washington, the dilemma is that every penny of the higher costs will hit consumers (read voters), whether directly or indirectly. There could be trouble when the higher utility bills begin to arrive and it could mean difficulty in delivering on the primary policy objective of virtually all governments, which is to remain in power. This is not to mention the unintended consequences of higher prices on many key industries, notably agriculture, manufacturing, and transportation.

    There is an even larger concern, however, and that is the stability of society. Harvard economist Benjamin Friedman, in The Moral Consequences of Economic Growth suggested from an economic review of history that economies that fail to grow lapse into instability.

    A Public Policy Collision Course? A potential collision between economic reality and public policy initiatives could be in the offing. Many “green” proposals are insufficiently sensitive – even disdainful – towards the concerns of everyday citizens. This suggests that politically there should be an emphasis only on the most cost effective strategies. In a democracy, you must confront to the reality that people are for the most part more concerned about the economy than about strategies meant to slow climate change.

    The imperative then is not to ignore the problem, but to focus on the most rational, low-cost and effective greenhouse gas emission reduction strategies. Regrettably, it does not appear that Washington is there yet. The special interests whose agendas are to cultivate and reap a bounteous harvest of “green” profits or to convert the “heathen” to behaviors – such as riding transit and living in densely packed neighborhoods – that they have been advocating long before the climate change issue emerged.

    Those concerned about the future of the environment also have to pay attention to reality. Reducing greenhouse gases is not a one-dimensional issue. Environmental sustainability cannot be achieved without both political and economic sustainability.


    Note 1: The Rasmussen question was asked of individuals. It is assumed here, however, that the answers related to households. One doubts, for example, that a queried mother answered with an assumption that she would pay $100, her husband would pay $100 and each of the kids would pay $100, but rather meant $100 for the household, since, to put it facetiously, few households devolve their budgeting to the individual members.


    Wendell Cox is a Visiting Professor, Conservatoire National des Arts et Metiers, Paris. He was born in Los Angeles and was appointed to three terms on the Los Angeles County Transportation Commission by Mayor Tom Bradley. He is the author of “War on the Dream: How Anti-Sprawl Policy Threatens the Quality of Life.

  • China’s Metropolitan Regions: Moving Toward High Income Status

    Changsha, Hunan (China): Over the past 30 years, China has eradicated more poverty than any nation in the world’s history. The reforms instituted by Deng Xiaopeng have not only created a large, new middle class in China, but have also produced some of the largest and architecturally most impressive urban areas in the world. There is still poverty in China, but the most extreme poverty is in the rural areas. The expansive shanty-town poverty found in Manila, Jakarta, Mexico City, Sao Paulo or Mumbai is absent in the large Chinese urban areas.

    While China as a nation is growing slowly, the same cannot be said of its urban areas. Perhaps the greatest migration in human history is underway, as rural residents move to the urban areas. United Nations population projections indicate that China will add 310 million people to its urban areas over the next 25 years, a figure equal to the population of the United States.

    Gross Domestic Product in Chinese Cities: China has seen its incomes and gross domestic product increase markedly. Urban economic growth has been even greater than that of the country as a whole. This article contains the latest available information on gross domestic product for the largest prefectural and provincial level cities in China, derived from annual yearbooks (see Table). It needs to be understood that “cities” are much different in China than anywhere else.

    The Differing Definitions of “City”: The most commonly used definition of a city in China is more akin to a large metropolitan region in the United States or Europe. Some cities, like Shanghai, Beijing, Tianjin and Chongqing are the equivalent of provinces, while other cities are “prefectural level,” administering large areas within provinces (Note 1). Each of these “cities” is comprised by smaller jurisdictions that go by at least 8 names, including city districts and “county level cities,” which are cities within the city, but not the main urban areas. Much of the land area in county level cities and even inside some city districts is rural rather than urban. As a result, analysts who should know better often make downright silly comparisons between Chinese cities and other cities in the world, simply because they do not understand the differing meaning of the term. Nearly all of China, urban and rural is broken into prefectural or provincial cities, just as nearly all of the United States is divided into counties.

    The large rural areas within the cities reduce the overall GDP per capita because incomes are generally so much lower outside the urban areas.

    Geographical Distribution of Wealth: China purposefully began its most significant reforms on the east coast, which is where much of the wealth of the nation is concentrated. All 25 of the most affluent metropolitan regions are on the east coast and 14 of the richest 20 metropolitan regions in China (measured by GDP per capita) are in the two river delta mega-regions, the Pearl and the Yangtze.

    The Pearl River Delta: China’s richest area is the Pearl River Delta, home of formerly British administered Hong Kong, Deng Xiaopeng’s megacity Shenzhen and historic Guangzhou (Canton). The area is one of the world’s great mega-regions, with a population of more than 50 million, in 8 virtually adjacent urban areas, tied together by a modern freeway system. Altogether the Pearl River Delta urban areas have more people than the world’s largest single urban area, Tokyo, and an overall higher density.

    Hong Kong, which remains outside the normal provincial governance structure, had the highest GDP per capita in the nation at $42,200 (purchasing power parity) in 2007, slightly more than 90 percent of the United States. Hong Kong and formerly Portuguese Macau have both achieved first world economic status, though Macau does not make the 1,000,000 urban area population threshold for inclusion on the present list.

    Shenzhen, on Hong Kong’s northern border ranks 4th in the nation at $22,100 and Guangzhou 5th, at $19,900. Two other Pearl River Delta metropolitan regions, Foshan, Zhuhai, have GDPs per capita greater than $15,000, which by some accounts qualifies them for entry into the high income world. The remaining large Pearl River Delta metropolitan regions, Dongguan, Zhongshan and Jiangmin each have GDPs per capita exceeding $10,000.

    The Yangtze River Delta: The Yangtze River Delta is another great mega-region, with more than 30 million people. It, however, covers much more land area than the Pearl River Delta and has much greater expanses of rural territory. The Yangtze River Delta metropolitan region of Suzhou, the city of canals, and neighbor of Shanghai, has the highest GDP per capita outside Hong Kong, at $25,500. One county level city within Suzhou, Kunshan has a GDP per capita of more than $28,000 (Note 2). Suzhou’s neighbor on the way to Nanjing, Wuxi, is next at $23,300. Shanghai, China’s largest metropolis, ranks 6th in GDP per capita at $18,400. Other Yangtze Delta metropolitan regions have GDPs per capita between $10,000 and $15,000, including Nanjing, Hangzhou, Changzhou and Ningbo.

    The Beijing Metropolitan Region: China’s third mega-region is around Beijing, the national capital. Altogether, this region has nearly 25 million people, but like the Yangtze River Delta, the Beijing megaregion has large swaths of rural territory. Beijing itself has a GDP per capita of $16,200, while Tianjin and Tangshan (site of the 1976 earthquake, one of history’s worst, which killed at least 250,000 people) have GDPs per capita of between $10,000 and $15,000.

    Outside the Megaregions: While the wealth is concentrated in the three large megaregions, prosperity has come to other metropolitan regions as well. One of Deng Xiaopeng’s original special economic zones, along with Shenzhen, was Xiamen, which is the richest metropolitan region outside the three large megaregions.

    Prosperity Comes to the West: The interior metropolitan regions are now well on their way to sharing the prosperity of the east. Changsha, from where I write, is now served by the nation’s “interstate” highway system in all directions. At the end of 2008, this system had expanded to 37,000 miles. Eventually, 53,000 miles are planned, which would make it longer than the present 46,000 mile US interstate system. This national expressway system is a pivotal factor in bringing prosperity to the interior. Now, trucks can reach Pacific Coast ports such as Guangzhou, Fuzhou or Hangzhou in six to nine hours of driving. This makes it possible for manufacturing businesses to locate in Changsha, Xi’an or Wuhan and a number of other metropolitan regions that are well inland.

    This should be of inestimable help as the nation seeks to decentralize its urban growth to the interior urban areas. Changsha, itself, has moved strongly into middle income status, with a GDP per capita closing in on $10,000. Moreover, local officials are planning for a near doubling of the current 2.5 million population in the next two decades. At least three major new towns under construction on the urban periphery and another will be built where the borders of three prefectural cities meet: Changsha, Zhuzhou and Xiangtan which is the birthplace of Chairman Mao Zedong (about 50 miles from Changsha, just off the Shangrui Expressway).

    Chongqing (formerly known in the west as Chungking), one of the four provincial level municipalities, has low GDP per capita of less than $5,000. However, this figure is skewed low by the fact that the urban area itself accounts for approximately one-sixth of the provincial city’s population, with the bulk of the population in the far lower income rural areas. Chongqing provides the ultimate evidence that cities in China are like nowhere else in the world. The “city” of Chongqing has a population of more than 30 million, in a land area the size of Austria or Indiana. The actual urban area, however, covers less area than the Indianapolis urban area and only 1.5 times the area of the Vienna urban area.

    Toward a High Income Nation: The urban areas of China still have poverty, but the commercial and residential development (both high rise and detached “villas”) make it clear that a great many people are doing “very well.”

    China is moving hard toward high-income world status. I specifically avoid the term “first world,” because metropolitan China already feels first world, regardless of its income status. However, should current growth rates continue relative to the high income world, metropolitan regions such as Suzhou and others could move into the list of the world’s 100 most affluent metropolitan areas within a decade. It cannot happen too soon.


    Note 1 : This includes sub-provincial level cities, which have jurisdiction over virtual prefectures within provinces, however have more administrative independence than prefectural level cities.

    Note 2: GDP per capita data is not widely available for divisions within prefecture and provincial level cities

    China Metropolitan (City) Regions Gross Domestic Product: 2007
    Provincial, Sub-Provincial & Prefectural Level Cities
    Purchasing Power Parity (US$)
    RANKED BY GDP/CAPITA GDP/Capita
    Rank Metropolitan (City) Regions ¥ (RMB) US$ PPP
    1 Hong Kong $42,200
    2 Suzhou, JS ¥91,900 $25,500
    3 Wuxi, JS ¥83,900 $23,300
    4 Shenzhen, GD ¥79,600 $22,100
    5 Guangzhou, GD ¥71,800 $19,900
    6 Shanghai, SHG ¥66,400 $18,400
    7 Zhuhai, GD ¥61,700 $17,100
    8 Foshan, GD ¥61,200 $17,000
    9 Beijing. BJ ¥58,200 $16,200
    10 Xiamen, FJ ¥56,200 $15,600
    11 Nanjing, JX ¥53,600 $14,900
    12 Changzhou, JS ¥52,800 $14,700
    13 Hangzhou, ZJ ¥52,600 $14,600
    14 Handan. HEB ¥51,900 $14,400
    15 Dalian, LN ¥51,600 $14,300
    16 Ningbo, ZJ ¥50,500 $14,000
    17 Zhongshan. GD ¥49,500 $13,700
    18 Tianjin. TJ ¥46,100 $12,800
    18 Dongguan. GD ¥46,000 $12,800
    20 Shenyang, LN ¥45,600 $12,600
    20 Qingdao. SD ¥45,400 $12,600
    22 Tangshan. HEB ¥44,700 $12,400
    23 Zibo, SD ¥43,500 $12,100
    24 Yantai, SD ¥41,300 $11,500
    25 Huizhou, GD ¥41,000 $11,400
    26 Baotau, NM ¥40,400 $11,200
    26 Shijiazhuang. HEB ¥40,300 $11,200
    28 Jinan, SD ¥39,300 $10,900
    29 Anshan, LN ¥38,400 $10,700
    30 Jiangmen, GD ¥37,800 $10,500
    31 Taiyuan. SAX ¥36,400 $10,100
    32 Wuhan. HUB ¥35,600 $9,900
    33 Hohhot, NM ¥34,900 $9,700
    34 Zhengzhou, HEN ¥34,100 $9,500
    35 Changsha. HUN ¥33,700 $9,400
    36 Urumqi, XJ ¥31,100 $8,600
    37 Nanchang, JX ¥30,500 $8,500
    38 Fuzhou, FJ ¥29,500 $8,200
    39 Changchun, JL ¥28,100 $7,800
    40 Hefei. AH ¥27,600 $7,700
    41 Wenzhou. ZJ ¥27,500 $7,600
    42 Baoding, HEB ¥27,100 $7,500
    43 Haikou, HA ¥26,700 $7,400
    43 Chengdu, SC ¥26,500 $7,400
    45 Lanzhou, GS ¥25,600 $7,100
    46 Luoyang. Hen ¥25,100 $7,000
    47 Harbin, HL ¥24,700 $6,800
    47 Fushun, LN ¥24,500 $6,800
    49 Jilin, JL ¥23,300 $6,500
    50 Xiangfan, HUB ¥22,500 $6,200
    51 Xi’an, SAA ¥21,300 $5,900
    52 Liuzhou, GX ¥20,700 $5,800
    53 Guiyang, GZ ¥19,500 $5,400
    54 Xuzhou, JS ¥19,200 $5,300
    55 Kunming, YN ¥18,800 $5,200
    56 Shantou, GD ¥17,000 $4,700
    57 Linyi, SD ¥16,300 $4,500
    58 Nanning, GX ¥15,800 $4,400
    59 Datong, SAX ¥15,600 $4,300
    59 Huiayn, JS ¥15,500 $4,300
    61 Chongqing, CQ ¥14,700 $4,100
    62 Qiqihar, HL ¥10,000 $2,800
    Sources: Annual statistical reports, generally from http://www.chinaknowledge.com
    GDP PPP calculated from 2007 International Monetary Fund data
    Caution: In some cases, GDP per capita may exclude temporary residents
    Includes all provincial, prefectural level and sub-provincial level cities and special economic regions on the mainland with a core urban area of more than 1,000,000 population (see http://www.demographia.com/db-worldua.pdf).
    Note: Cities in China are substantially different in definition than in other nations. See: http://www.demographia.com/db-define.pdf.
    Provincial abbreviations at db-china-abbr.pdf

    Wendell Cox is a Visiting Professor, Conservatoire National des Arts et Metiers, Paris. He was born in Los Angeles and was appointed to three terms on the Los Angeles County Transportation Commission by Mayor Tom Bradley. He is the author of “War on the Dream: How Anti-Sprawl Policy Threatens the Quality of Life.

  • Taking the Fun Out of Fighting Global Warming

    It is a rare spectacle when broadly respected national organizations and analysts condemn an initiative by some of the most influential players in the Washington establishment. Yet that is exactly what has happened to the Moving Cooler report, authored by the consulting firm Cambridge Systematics, published by the Urban Land Institute and sponsored by the American Public Transportation Association (APTA), the Environmental Defense Fund, Natural Resources Defense Council, the Environmental Protection Agency and others.

    Forcible Removal: Moving Cooler proposes a radical agenda to reduce greenhouse gas emissions pushing people out of their cars, whether forcibly or by making it so expensive they can no longer drive as much as they need to. Moving Cooler would employ such measures as charging home owners up to $400 annually to park in front of their own houses, placing tolls on now-free interstate highways (up to $0.05 per mile by next year) and pushing as much as 90 percent of future development into existing urban footprints, in the vain hope that cutting driving would reduce greenhouse gas emissions by a similar amount. In fact, as traffic congestion increases in more densified urban areas, the one-to-one relationship between reduced driving and reduced greenhouse gas emissions is materially diminished.

    More Huddled Masses: If this plan, endorsed by at least some in the Administration, occurs densification policies would impose urban growth boundaries and other restrictive regulations. Planning decisions would be removed from counties, cities, towns and villages to regional planning organizations forced to implement federal mandates as a condition of receiving back federal funding, most of which had been taken from their own taxpayers.

    These restrictions would force up to 125,000,000 new residents into existing neighborhoods many of whose residents probably think are already crowded enough. Think of it as adding as many people as live and Mexico and Guatemala, without allowing urban areas to expand. All of this would worsen traffic congestion, lengthen travel times for those who can still afford to drive and severely intensify the unhealthful local air pollution that the nation has fought so successfully to reduce over the past four decades.

    Ignoring Productivity: Alan Pisarski, author of the acclaimed “Commuting in America” series and one of the most respected names in transportation policy issued a cutting indictment on these pages. For example, Pisarski notes that Moving Cooler does not count travel times, “so shifting from a 15 minute car trip to an hour on transit or walking has no penalty.” In a world where time and productivity are inextricably associated, lost time is lost time, whether in a car, in transit or walking. In the broader economy, lost time is lost jobs, lost income and lost economic productivity.

    Misleading Policymakers? C. Kenneth Orski, whose career has included assignments at the Organization for Economic Cooperation and Development in Paris and as Associate Administrator at the Urban Mass Transportation Administration (now the Federal Transit Administration) reported in Innovation Briefs that the American Association of State Highway and Transportation Officials (AASHTO), an original member of the Moving Cooler coalition, walked away from the study, saying that Moving Cooler overstates the greenhouse gas emissions that can be realistically expected from its strategies, underestimates the potential of more fuel efficient cars and telecommuting and minimizes the returns from improved transportation operations and car pooling, which are already yielding “remarkable” results. AASHTO further charged that the Moving Cooler report “did not produce results upon which decision-makers can rely.” In the polite world (really) of Washington transportation policy, these are damning words indeed.

    According to Orski, researchers provided AASTHO with a litany of criticisms including findings that Moving Cooler relied on “assumptions that are not plausible,” analysis that was “flawed and incomplete” and an “invalid” peer review process. Costs were characterized as “incomplete and misleading,” greenhouse gas emission results were “not comparable or plausible” and “many assumptions are extreme, unrealistic and in some cases, downright impossible.” Moving Cooler was dismissed because of its “Heroic assumptions about land use and travel behavior and extraordinary pricing do not come close to the GHG reductions needed by 2050.”

    Orski himself characterized the report as containing “flawed analysis and unrealistic assumptions that could mislead policymakers and the public and raise unreasonable expectations about how much progress can be achieved using these strategies.”

    There is plenty of reason to be concerned. Already Senators Jay Rockefeller (D-WV) and Frank Lautenberg (D-NJ) had introduced legislation that would require annual reductions in how much Americans drive. The senators have confused reducing driving with reducing greenhouse gases. They are not the same thing. After all the federal government is dedicating literally billions of dollars to improving vehicle fuel efficiency. The President himself has promised 150 mile per gallon automobiles. There is significant potential for improving the carbon footprint of cars without forcing people to reduce their driving.

    Land Use & Transit: Meager Returns: Orski strikes a nerve, especially with respect to the Moving Cooler coalition’s favored policies of densification and transit expansion. Moving Cooler itself produces embarrassingly modest (and probably exaggerated) estimates of the potential for densification and transit to reduce greenhouse gas emissions. According to Moving Cooler, these combined strategies would reduce greenhouse gas emissions no more than 7 percent from a 2050 base, and woefully short of any meaningful contribution. Not surprisingly, Moving Cooler ignores the fact that banning development on most suitable land around urban areas would raise land prices and thus home prices, a relationship noted by economists from the left, center and right of the spectrum and grudgingly admitted even in smart growth’s most influential advocacy document, The Costs of Sprawl — 2000.

    As the Tomas Rivera Institute said in a report decrying the barriers to home ownership that California’s similarly restrictive land use policies impose on Hispanic and Latino households: “While there is little agreement on the magnitude of the effect of growth controls on home prices, an increase is always the result.” (Note 1).

    Transit and High Speed Rail? Cross Them Off the List: Moving Cooler endorses significant expansion of transit service and establishment of high speed rail systems, but its own data speaks to the contrary. The maximum necessary cost for removing a ton of greenhouse gas emissions is $50, according to the United Nations Intergovernmental Panel on Climate Change. Moving Cooler’s data puts transit expansion at more up to 20 times the $50 standard ($900) and high speed rail at 14 times the standard (more than $700). To put the matter in context, if the nation were to spend as much per ton to reach the Waxman-Markey “Cap and Trade” legislation’s greenhouse gas reduction target, the annual bill would be more than $5 trillion, more than one-third of the gross domestic product of the United States. With all of the talk in Washington about cost control and reducing the budget deficit, such extravagantly expensive strategies like transit expansion and high speed rail should be crossed off the public policy list.

    And, indicative of the implausible greenhouse gas results noted by the AASHTO researchers, Moving Cooler excludes the greenhouse gases emitted in construction. This leads one to wonder if there are “good” greenhouse gas emissions (like from building high speed rail) and bad greenhouse gas emissions (like from driving). Construction emissions can be very substantial. For example, it has been reported that construction emissions from proposed high speed rail lines in the United Kingdom would offset any reductions achieved in daily operations compared to airplanes.

    Incompatible Bedfellows: Pitifully, Moving Cooler attempts to associate itself with a highly respected study by McKinsey & Company and The Conference Board that concludes significant greenhouse gas reductions can be achieved by 2030 at less than $50 per ton. Moving Cooler cites itself as “companion piece” Yet, the McKinsey/Conference Board study specifically rejects the high-handed social engineering proposed by Moving Cooler, indicating that its strategies would involve “maintaining comparable levels of consumer utility,” which they defined as: “no change in thermostat settings or appliance use, no downsizing of vehicles, home or commercial space and traveling the same mileage annually relative to levels assumed in the government reference case” (Note 2).

    The Mantra: Moving Cooler chants a mantra about how automobile fuel efficiency will improve, but that continued growth in driving will largely cancel out those gains. However, to do so Moving Cooler lumps automobile and other light-duty vehicle data in with railroads, trucks and buses.

    In fact, the Energy Information Administration of the US Department of Energy projects a 13 percent reduction in greenhouse gas emissions from cars and other light-duty vehicles by 2030, and that is before accounting for the more stringent fuel economy standards adopted by the Obama Administration a few months ago. Further, Moving Cooler buries its laughingly ineffective and expensive policy favorites, smart growth, transit expansion and high speed rail, among a panoply of other strategies that would account for the “lion’s share” of the emission reductions it anticipates.

    The Real Agenda? As Pisarski indicated: Maybe the saddest part of it all, the authors appear not to take global warming or energy security very seriously at all. Rather these public concerns are just a convenient hook, the cause du jour, on which to hang their favorite solutions. Given this apparent reality, it is probably not surprising that two of the three Moving Cooler cover pictures are from Europe, which the smart growth movement has worshipped for years.

    The Moving Cooler strategies would not only force people to live in ways they would not voluntarily choose, and for scant gain and no reason. Moving Cooler’s radical measures need to be rejected forcefully. There are better, more effective and far less intrusive ways to reduce greenhouse gases.

    That would, however, probably take the fun out of fighting global warming for those whose real intent is telling others how to live.


    Note 1: “Growth controls” is a synonym for smart growth strategies, such as urban growth boundaries and development impact fees.

    Note 2: The 2007 government reference case used by McKinsey and The Conference Board assumed that per capita driving would increase more than 50 percent between 2005 and 2030. Later estimates have reduced that figure.


    Wendell Cox is a Visiting Professor, Conservatoire National des Arts et Metiers, Paris. He was born in Los Angeles and was appointed to three terms on the Los Angeles County Transportation Commission by Mayor Tom Bradley. He is the author of “War on the Dream: How Anti-Sprawl Policy Threatens the Quality of Life.

  • Vetting the Volt: Toward Meaningful Electric Car Fuel Consumption Ratings

    The 230 Miles per Gallon Claim: The General Motors (GM) announcement last week that the Chevrolet Volt would achieve 230 miles per gallon in city driving and a rating of more than 100 miles per gallon with combined city and highway driving sadly contains more hype than reality. The Chevrolet Volt is a plug-in hybrid vehicle that GM intends to begin marketing in 2010. GM has indicated that the car will be able without gasoline for 40 miles, on its rechargeable battery. After the battery is depleted, the car would begin to use gasoline. The 230 mile per gallon figure, according to GM, was calculated using a proposed but yet not revealed Environmental Protection Agency fuel economy testing procedure. Similarly, the details of the GM calculation were not revealed.

    Criticisms: Rather than the expected praise, the GM claim was met by a barrage of questions and criticism. Consumer Reports said that the 230 miles per gallon claim might be the exaggeration of the century. Automaker Nissan, facetiously responded with a claim that its forthcoming all electric (not hybrid) “Leaf,” would achieve 367 miles per gallon in a Twitter post. Nissan, unlike GM can be excused for not providing the details of its calculation, since it was “making fun.” EPA distanced itself from the GM announcement, indicating that it had not yet tested the Volt.

    The criticisms and questions revolved around a single issue: How had General Motors calculated the 230 miles per gallon figure. Regrettably, General Motors has yet to provide a complete answer.

    From the sketchy details released, it appears that the 230 mile per gallon rating was based upon the assumption that a driver would travel less than 40 miles each day and recharge the battery at night. Using this methodology, there would never be a reason for the car to use gasoline, so long as the daily mileage is less than the battery capacity.

    A New EPA Rating System: Reportedly, the EPA’s fuel economy testing procedure for plug-in electric vehicles (whether hybrid or not) will report kilowatt hours (KWH) of electricity consumed per 100 miles. Presumably, this rating will be placed on the fuel economy window sticker on new cars, perhaps alongside some miles per gallon conversion. GM indicates that the Volt will consume 25 kilowatt hours per 100 miles in city driving.

    Policy Imperative for Improving Fuel Efficiency: The impetus for improving automobile fuel economy is being driven by public policy objectives to reduce greenhouse gas emissions, especially carbon dioxide (Note 1), and away from the consumption of petroleum .

    Even though the Volt will produce no greenhouse gas emissions from its tailpipe when operating in the electric mode, the electricity that drives its battery would come from power plants, many of them relying on fuels like coal, which produce high amounts of greenhouse gas emissions. In fact, coal accounts for roughly 30 percent of all electricity production in the country; other fossil fuels another 35 percent.

    A Flawed EPA Fuel Economy Rating System? Neither the GM calculation nor apparently the proposed EPA rating system include greenhouse gas emissions from electricity generation. A greenhouse gas gram emitted from an electric power plant smokestack has the same impact as one from an auto tailpipe. Any EPA fuel efficiency rating system that does not take into consideration power generation emissions would be shockingly incomplete and misleading. Consumers would not be given reliable information on the greenhouse gas emissions from cars they might purchase. One would expect that a government committed to greenhouse gas emission reduction would task its implementing agency with ensuring the availability of relevant and reliable information.

    Power Generation and Plug-In Cars: On average in the United States, the generation of each KWH produces 610 grams of carbon dioxide (1.35 pounds). By comparison, combustion of a gallon of gasoline emits nearly 8,900 grams of carbon dioxide. Thus, nearly one gallon of gasoline is the equivalent of approximately 15 KWH of electric power in its greenhouse gas emissions (Note 2).

    Thus, if the Volt uses 25 KWH to travel 100 miles in an urban area, then the greenhouse gas emissions from generating its power will be somewhat over 15,000 grams (Note 2), or the same as 1.7 gallons of gasoline (Note 3). Under these average operating conditions, the Volt would achieve approximately 60 miles per gallon (Note 4).

    Exaggeration Doesn’t Help: Now there is nothing to be ashamed about 60 miles per gallon, unless, that is, you have claimed 230 miles per gallon. Regrettably, General Motors, which could have claimed a great environmental advance, has diminished it by failing to “level” with the public. This kind of public relations will not help a company whose performance has cost it market share for well over a generation. .

    The Volt (and the Leaf) Will Get Better: Of course the equivalent miles per gallon would be much higher if US power generation were more efficient. And, it will be. For example, it has been proposed that electric power generation needs to become at least 80 percent less greenhouse gas intensive by 2050. If this is accomplished, the Chevrolet Volt could indeed achieve 230 equivalent miles per gallon and perhaps the Leaf 367. But neither car will reach these plateaus in the short term.

    A Better Fuel Economy Rating System: Since the EPA fuel economy rating system has not been finalized, its potential defects can be corrected. Any EPA fuel economy rating system should include a greenhouse gas emissions indicator. This should be provided for city driving, for highway driving and a combined overall figure. Moreover, such a rating must include the very real emissions that occur at the power plant. It would be appropriate for EPA to continue reporting miles per gallon and adding KWH per 100 miles, so that the cost impacts are clear to purchasers.

    Regional Variations: There is another complicating factor – regions. For example, in North Dakota fuel economy would be approximately 35 miles per gallon equivalent with full electric operation, well below the average 60 equivalent miles per gallon. On the other hand, in the state of Washington, the Volt would achieve its 230 miles per gallon equivalent, nearly 7 times the North Dakota fuel efficiency. This is not because people in Washington are more environmentally sensitive than North Dakotans. The difference is in type of power generation. Nearly 80 percent of Washington’s power is generated by hydro-electric and nuclear plants, which produce virtually no carbon dioxide emissions. On the other hand, nearly 80 percent of North Dakota’s electric power is produced with fossil fuels. These differences will be moderated as electric power production becomes less greenhouse gas intensive.

    The Bottom Line: Despite the exaggeration and misleading information, this story is far more positive than negative. Congratulations to General Motors (and Nissan) on the strong advances they have apparently made in vehicle technology. This is just further evidence of the potential of human ingenuity. From the 150 mile per gallon cars to which President Obama is committed to the zero emission petroleum car system demonstrated by a Georgia Tech team, the good news is that people can continue to live as they like, while admirably reducing their greenhouse gas emissions to meet whatever objectives are ultimately adopted.


    Notes
    1: Carbon dioxide accounts for the overwhelming share of greenhouse gas emissions from motor vehicles.
    2: Calculation: 8,900 (divided by) 610
    3: Calculation: 25 KWH (times) 610
    4: Calculation: 15,000 grams (divided by) 8,900 grams
    5: Calculation: 100 (divided by) 1.7
    6: A grams per mile rating system should include “upstream” activities, such as the greenhouse gas emissions required to produce and distribute petroleum, which by various estimates increases the emissions by 20 to 25 percent. Similarly, upstream electric power production emissions should be included.


    Wendell Cox is a Visiting Professor, Conservatoire National des Arts et Metiers, Paris. He was born in Los Angeles and was appointed to three terms on the Los Angeles County Transportation Commission by Mayor Tom Bradley. He is the author of “War on the Dream: How Anti-Sprawl Policy Threatens the Quality of Life.