Author: Wendell Cox

  • Suburbs and Cities: The Unexpected Truth

    Much has been written about how suburbs have taken people away from the city and that now suburbanites need to return back to where they came. But in reality most suburbs of large cities have grown not from the migration of local city-dwellers but from migration from small towns and the countryside.

    It is true that suburban areas have been growing strongly, while core cities have tended to grow much more slowly or even to decline. The predominance of suburban growth is not just an American phenomenon, but is fairly universal in the high income world).

    This is true in both auto-oriented and transit oriented environments. Suburbs have accounted for more than 90 percent of growth in Japan’s metropolitan areas with more than 1,000,000 residents, both those with high transit market shares and those with high auto market shares, The same is true in Canada, Australia and New Zealand.

    In Western Europe, where vaunted transit systems carry a far smaller share of travel than cars, all growth and then some has been in the suburbs, as overall core city populations have declined. Indeed, the same trend is well underway in middle and lower income world urban areas. In such places as Mexico City, Sao Paulo, Buenos Aires, Manila, Shanghai, Kolkata, and Jakarta, nearly all population growth has occurred in the suburbs, rather than the core cities.

    As the world faces a more expensive energy future and as efforts are intensified to reduce greenhouse gas (GHG) emissions, it is sometimes suggested that people need to “move back” to the cities. This is a dubious and needless strategy, which reveals a fundamental misunderstanding of the dynamics of metropolitan growth.

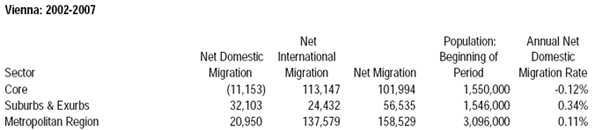
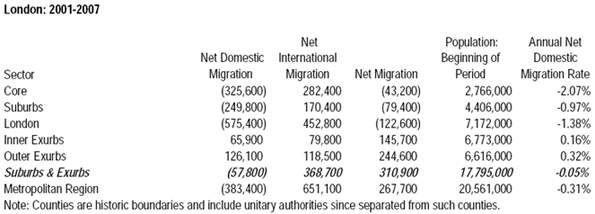
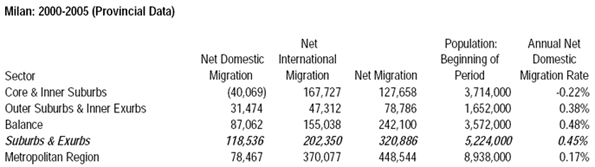
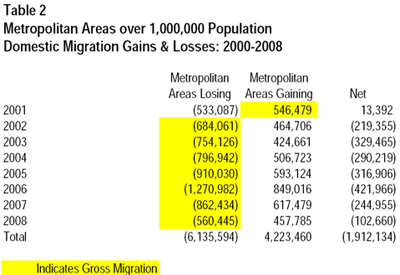
    Most suburban growth is not the result of declining core city populations, but is rather a consequence of people moving from rural areas and small towns to the major metropolitan areas. It is the appeal of large metropolitan places that drives suburban growth.

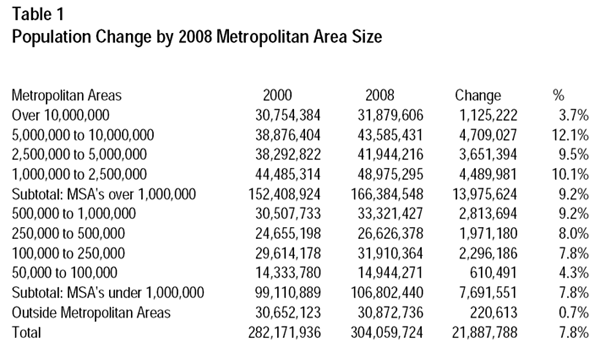
    Larger metropolitan areas have more lucrative employment opportunities and generally have higher incomes than smaller metropolitan areas. This is particularly the case in developing countries. As a result, the big urban areas attract people seeking to escape what are often the stagnant or even declining economies in smaller areas.

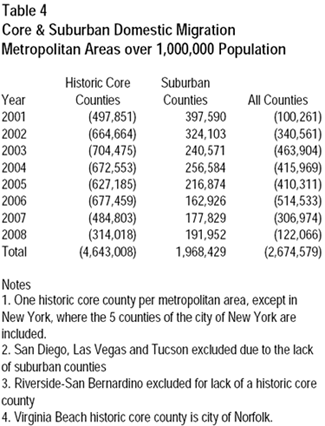
    There are, of course, significant individual exceptions. Virtually all of the first world core cities that have achieved a population of more than 400,000 – if they have not expanded their boundaries and did not have substantial empty land for development – experienced losses to 2000. Yet even in most of these cases, the majority of suburban growth was from outside the metropolitan areas, rather than from the core cities. For example:

    • St. Louis is a champion among the ranks of population losers, having lost the greatest percentage of its population of any large municipality in the world, (dropping from nearly 860,000 in 1950 to 350,000 in 2000). Indeed, it may be fair to say that St. Louis has lost more of its population than any city since the Romans sacked Carthage. Yet, even in St. Louis, 60 percent of suburban growth was from outside the metropolitan area, rather than from the city.
    • Few core cities have lost the nearly 1,000,000 residents that have fled Detroit since 1950. Yet, even in Detroit, 65 percent of suburban growth was from outside the metropolitan area, rather than from the city.
    • The city of Chicago lost 725,000 residents between 1950 and 2000, yet 82 percent of the suburban growth was from outside the metropolitan area.
    • The city of Philadelphia lost 550,000 residents between 1950 and 2000, yet 76 percent of the suburban growth was from outside the metropolitan area (See lead picture of Philadelpia downtown).
    • The central city of Paris lost approximately one-quarter of its population from 1965 to 2000 (675,000), while the suburbs gained nearly 3,850,000 residents. More than 80 percent of suburban Paris growth came from outside the region.
    • The central city of Lisbon experienced a 30 percent population decline from 1965 to 2000. Yet suburban Lisbon’s growth was 80 percent from outside.
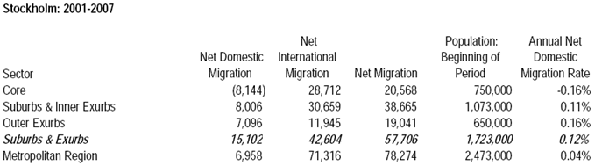
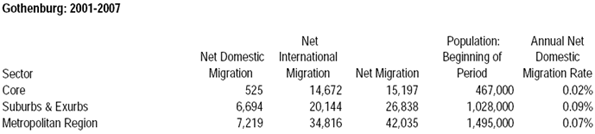
    • Stockholm was another losing core city, yet more than 90 percent of the suburban growth came from smaller towns and cities.
    • Despite Zurich’s nearly one-quarter population loss 83 percent of the suburban gains derived from outside the region.
    • The core city of Tokyo (which really doesn’t exist except as 23 separate subdivisions or kus of a city abolished during World War II) lost more than 700,000 residents from 1965 to 2000. Tokyo’s suburbs, however, attracted more than 90 percent of their growth from region.

    In some metropolitan areas, smaller towns and rural areas contributed less to suburban growth. In Amsterdam, 50 percent of the suburban growth was from outside the metropolitan area. In Copenhagen, the number was 40 percent of the suburban growth while in Birmingham (UK) only 30 percent of the suburban gain was from outside.

    In a few cases, both the core city losses were greater than the suburban gains, such as in Pittsburgh, Liverpool and Manchester. In these cases, it is fair to attribute all of the suburban gains to core city losses.

    Unlike the cases above, however, most core cities gained population. This includes all in Canada, Australia and New Zealand and many in the United States. As a result, none of the suburban growth in the corresponding metropolitan areas can be attributed to an exodus from the city, because there, on balance, was no exodus.

    Suburbanization is often characterized as reducing densities, but in fact it has done just the opposite. Most suburbanites come from smaller places; they may prefer suburbs because they are less dense, safer, or simply more manageable than the core cities. But they are also, almost invariably, more dense than where they lived before. Suburbanization is thus a densifying dynamic, albeit one that is less dramatic than preferred by many planners and architects.

    In this sense, suburbs have to be seen not as the enemies of the city, as just a modern expression of urbanization. They are neither the enemies of the city, nor are their residents likely to move “back” there. You cannot move back to someplace you did not come from.

    Wendell Cox is a Visiting Professor, Conservatoire National des Arts et Metiers, Paris. He was born in Los Angeles and was appointed to three terms on the Los Angeles County Transportation Commission by Mayor Tom Bradley. He is the author of “War on the Dream: How Anti-Sprawl Policy Threatens the Quality of Life.

  • Falling Off Bicycles in Portland

    It has become customary for the fawning print media to lazily repeat whatever information is provided them by the urbanist lobby. The result is all manner of puff pieces that report as reality what is nothing more than hopes, or even delusions.

    The latest puff piece is about Portland and is in today’s Wall Street Journal. The article indicates that 8 percent of Portlanders commute to work by bicycle, based upon data from a bicycle advocacy group. That number is more than five times the figure reported by the United States Bureau of the Census, (which is not a bicycle advocacy group). In 2007 (latest data available), 1.5 percent of Portland metropolitan area workers commuted by bicycle according to the Bureau of the Census.

    It is, of course, possible that there is confusion about the definition of Portland. Domestic migration is the principal subject and it is clear from the data cited that the article is citing metropolitan area data, rather than municipal (city of Portland) data.

    However, even if we allow that the editors might have erroneously substituted municipal for metropolitan data and that the advocacy group bicycle market share of 8 percent applies to the city of Portland; it would still be off by at least 100 percent. The Bureau of the Census data indicates that 3.9 of workers rode bicycles to work in 2007 in the city of Portland.

    Of course, it is always possible that three quarters of metropolitan Portland’s bicycle commuters have fallen off their bikes or that, if the editors were confused as to the difference between metropolitan and municipal, that half have fallen off.

  • Unsustainable Transit: New York City

    When it comes to transit, as like many things in the United States, there is no place like New York City. The subways and buses of the New York City Transit Authority (NYCTA) carry more than 40 percent of the nation’s transit rides (unlinked trips). To account for 40 percent of the nation’s ridership is quite an accomplishment inasmuch as the city represents less than 3 percent of the nation’s population.

    Of course, New York City’s ridership domination stems from the evolution of an ideal environment for transit. Most of the ridership comes from the heavily urban boroughs of Manhattan, Brooklyn, Queens and the Bronx, with a much smaller ridership in Staten Island, most of which looks like the second ring adjacent New Jersey suburbs. The four highly urban boroughs have exceedingly high population densities, averaging above 30,000 per square mile. The city of San Francisco, with its reputation for density, is little more than one-half as dense. The four boroughs are nearly as dense as city (23 ku area) of Tokyo, denser than most European core cities and nearly three times as crowded as Amsterdam.

    The most important factor, however, is the concentration of destinations in the central business district, south of 59th Street in Manhattan. This is the world’s second largest central business district and the home of approximately 2,000,000 jobs. Only the geographically larger business district inside Tokyo’s Yamanote Loop has more jobs. The Manhattan business district (really two, Uptown and Lower Manhattan and the area between) has at least four times as many jobs as Chicago’s Loop, the second largest central business district in the nation.

    The share of people commuting to work by transit is far higher than anywhere else in the nation. Approximately 75 percent of the people commuting to jobs in Manhattan get there by transit. Approximately 55 percent of the city’s working population commutes by transit, double the percentage of automobiles. By comparison, other highly urbanized central cities have far smaller transit work trip market shares, with Boston at 34 percent, San Francisco at 33 percent and Chicago at 26 percent. In each of these cities, considerably more people commute by car than by transit.

    Suffice it to say that New York is the penultimate transit city. If transit is the answer anywhere, it is the answer in New York.

    Yet the history of New York City Transit Authority has been one of financial crisis. From the NYCTA’s founding in 1953, transit riders of New York City have been faced by recurring threats of service reductions and fare increases. Over the years, transit fares have risen sharply despite increased subsidies. The financial downturn has generated yet another financial crisis at NYCTA, as well as at many other transit agencies around the country. There may be a financial bail-out from Albany, or there could be significant fare increases or service reductions. But the present financial crisis is by no means the first and it is unlikely to be the last. The problem is that transit is characterized by perverse incentives that keep if from focusing on its principal mission.

    Transit’s mission, as my late Los Angeles County Transportation Commission colleague (and Santa Monica city councilwoman) Christine Reed so eloquently put it, is to serve both riders and taxpayers. Regrettably, however, the riders and taxpayers routinely take a back seat to other more concentrated and powerful groups with a strong interest in getting themselves more money and scant interest in cost efficiency.

    As a result, the story is always the same in New York and elsewhere. Financial crises are characterized as funding crises and the answer to every question is more money. Little or no serious attention is paid to the cost side of the equation. In the present environment, the riders and the taxpayers are unlikely to ever be able to provide enough money to make transit financially sustainable.

    Both labor and management operate in an environment of perverse incentives. Labor unions understandably seek to improve the wages and working conditions of their members. In a competitive environment, there are some limits. But transit remains immune to competitive pressures; it is rather a political environment. Transit board members are appointed by elected officials, many of whom rely heavily on political contributions from labor unions and their often sophisticated get out the vote operations.

    Transit managers must live with this reality and any who become too courageous in their dealings with transit labor can expect to be shown the door. At the same time, transit labor negotiations are often not really conducted between parties across the table from one-another. Indeed, often the table is shoved up against the wall, since the gains that are won by the labor unions are largely duplicated in the pay and benefits packages of transit managers. Thus, costs are higher in transit – whether at NYCTA or at other agencies – than they would be for similar work in the private sector.

    One might expect transit to face frequent crises in Eugene, Madison or even Los Angeles or Seattle. But New York City? Perverse incentives are the problem, but other cities have managed to have successful transit systems without such incentives. In some of the world’s largest cores, such as Tokyo and Hong Kong, transit obtains virtually all of its funds from commercial revenues, principally fares. Without access to the deep pockets of taxpayers, transit is required to live within their means. Serious attention is paid both to funding and costs. It may be too much to ask for transit in New York City to be converted from its heavy subsidies to a profitable operation. But improvements can be made.

    In transit operations, one answer is competitive contracting (competitive tendering), whereby the transit agency seeks competitive bids on bus and rail routes for private operation. The competitive market reduces costs, while the transit agency specifies all aspects of the service. The best example of competitive contracting in the world is the London Transport bus system, which is the largest city bus system in the developed world. Buses are operated by multiple private contractors, under the control of Transport for London, which determines fare levels, routes, schedules and transfer arrangements. To the public, London Transport’s buses look and act like a single system. There is, however, a big difference. Competitive contracting has reduced costs per mile by nearly 40 percent after adjustment for inflation over the past 25 years. The savings have been plowed back into substantial service increases, which have led to strong ridership increases. Subway operating costs have also been reduced through competitive contracting, such as in Stockholm.

    But so long as the focus is on revenues and costs are largely ignored, the only thing sustainable about transit in New York City will be its fiscal crises. Even if there is an eventual financial bailout of NYCTA this time, expect the clock to start ticking towards the next inevitable crisis.

    Wendell Cox is a Visiting Professor, Conservatoire National des Arts et Metiers, Paris. He was born in Los Angeles and was appointed to three terms on the Los Angeles County Transportation Commission by Mayor Tom Bradley. He is the author of “War on the Dream: How Anti-Sprawl Policy Threatens the Quality of Life.

  • The Draw of Dhaka

    In recent centuries, the principal migration of the world’s population has been from rural areas to urban areas. As late as 1900, less than 20 percent of the world’s population lived in urban areas. That figure has now risen to more than 50 percent. Urbanization occurred earliest in the first world, as the increased wealth produced by the industrial revolution attracted people from the countryside. In 1900, 40 percent of the US population was urban, a figure that had risen to 80 percent by 2005. Trends in Europe, Japan and other first world nations are similar.

    The migration to cities has been slower to start in the less developed world. Only in 2005 did China achieve a 40 percent urbanization rate. Urbanization is expected to continue virtually everywhere, with the world rate increasing to 70 percent by 2050.

    Nowhere, however, are the trends starker than in Bangladesh and its capital, Dhaka, which I had the privilege of visiting a few weeks ago. Bangladesh is approaching 160 million people, despite having a land area less than that of Wisconsin. Its population density, rural and urban combined, is approximately 3,200 per square mile (1,250 per square kilometer) and is nearly equal to that of the Portland urban (urbanized) area, which had 3,300 per square mile. The nation’s population density is more than three times the minimum population density used by census authorities in the United States, France, the United Kingdom and Canada for definition of urban areas.

    However, most of Bangladesh is not urban. The United Nations puts the urban share of the Bangladesh population at 28 percent, barely two-thirds of the less developed world average. Even this is a stunning increase from the less than 5 percent of 1950. By 2050, the United Nations says that the urban areas of Bangladesh will add 97 million people, as the rural population declines, sending the urban population to roughly 60 percent of the total.

    Growing Dhaka: Dhaka is the world’s newest megacity, with an urban agglomeration just over 10 million population (based upon United Nations population growth rate projections). There are few urban areas in the world that are growing faster. Historically, nearly one-third of the urban population increase in Bangladesh has been in Dhaka. This seems likely to continue, since the nation has few other urban centers. The second largest, Chittagong, is just one-third the size of Dhaka. At projected urban population growth rates, Dhaka could have 40 million people by 2050.

    Dhaka’s Unfortunate Location: As difficult to imagine as this urban growth may seem, other emerging super-cities such as Shanghai can be imagined with 40 million people, with their plentiful supply of quality land for development. Things are much different in Dhaka. No rapidly expanding urban area (and no nation) faces greater locational challenges.

    Dhaka could be the most inconveniently placed urban area in the world, even worse than New Orleans. The urban area sits on the world’s largest river delta, the Ganges – Brahmaputra Delta (The Ganges is called the Padma River in Bangladesh). This Delta, nearly the size of Oregon, is more than 1.5 times the size of the nation, though not all of the nation is in the Delta.

    Dhaka itself is virtually surrounded by the rivers of the Ganges-Brahmaputra system, from which most of it is protected from routine and disastrous floods by floodwalls. The main channel of the Ganges is less than 20 miles distant the confluence with the Brahmaputra and is less than 50 miles away and the Indian Ocean (Bay of Bengal), barely 100 miles away. Dhaka lies at a low elevation, so rising sea levels could intensify the problem. The same river delta is also home to another megacity, Kolkata (India). However Kolkata’s geographical challenges are far less, with fewer Ganges outlet channels and less in wetlands, which has permitted it to develop at one-third the density of Dhaka.

    Dhaka’s Unprecedented Population Density: The urban area is the world’s most dense, having recently passed Hong Kong (based, again on United Nations estimates and projections). Covering a land area of little more than 100 square miles, Dhaka’s population density is now approaching in excess of 100,000 per square mile (40,000 per square kilometer). At that density, the New York urban area would accommodate all of the population of the United States and Mexico.

    Dhaka’s Impossible Traffic: The urban area is from five to seven miles wide and from 15 to 20 miles long, north to south. There is a single north to south thoroughfare through the whole urban area, which the Inspector General of Police estimates is blocked for 6 hours per day at railroad crossings. Needless to say, with its density inducing traffic congestion and insufficient road infrastructure, Dhaka’s traffic is horrific.

    The Poverty: There is, of course, the grinding poverty. Most recent estimates place the gross domestic product per capita of Bangladesh at under $1,500 annually (purchasing power parity). Dhaka is very likely the world’s poorest megacity. Progress is being made, principally from the fruits of globalization. There has been strong growth in garment production and huge numbers of jobs have been created. However, even this progress is threatened by inward-looking anti-trade movements in developed countries whose proponents ignore the likelihood that their policies would drive the poor of Dhaka into even greater decrepitude. Even if these selfish intentions fail, it will take decades for Bangladesh to join the ranks of middle income nations, much less high income nations. That, nonetheless, should be the objective.

    The Shantytowns: Various estimates indicate that up to one-quarter of Dhaka’s population lives in informal settlements (shantytowns, slums or favelas). These settlements tend to be “marbled” throughout the urban area, along the streams, railroads, lakes and ponds and in the drainage canals. However, none of the shantytowns are so expansive as those in Mumbai. Perhaps that is because commerce is decentralized in Dhaka, with garment factories spread throughout the urban area. People in the shantytowns have to work and many walk to their jobs, both factory and domestic. Their lives are precarious. Population densities in the slums have been reported as high as 4,200 per acre, which converts to more than 2,500,000 per square mile or more than 1,000,000 per square kilometer. At that density, the population of the world could be accommodated in the Tokyo-Yokohama urban area, leaving 10 percent of the land for open space.

    The Draw of Dhaka: Why do they come to Dhaka? What is the draw of a place that to western eyes could be dismissed as one of the least attractive urban environments in the world? It is the same incentives that drew people to Chicago from the farmlands of Poland, Italy or Iowa and to Sao Paulo from the sugar plantations. People routinely seek better lives. As in other cities in the developing world (or the developed world before), rural populations did not migrate to Dhaka because they were better off where they came from. Moreover, virtually all of the migrants from rural areas could return home tomorrow. Not surprisingly, few do.

    Moreover, there is progress, even in the shantytowns. Many residents “cook with gas” and have access to electricity, even if pirated from adjacent lines. There are schools where the children of the migrants are exposed to the foundation of literacy required for better lives in the future.

    Dhaka: City of Hope: Of course, it is all a matter of perspective. Dhaka may not look pleasing to affluent foreigners. Few residents of Portland, Paris or Perth would willingly embrace even a privileged lifestyle amidst the poverty of Dhaka. But despite the intense challenges, for the rural poor of Bangladesh, Dhaka remains very much a city of hope.


    Additional References:
    The Megacity Book: http://www.rentalcartours.net/megacity_book.pdf
    Dhaka Rental Car Tour: (soon to be published): http://www.rentalcartours.net/rac-dhaka.pdf

    Wendell Cox is a Visiting Professor, Conservatoire National des Arts et Metiers, Paris. He was born in Los Angeles and was appointed to three terms on the Los Angeles County Transportation Commission by Mayor Tom Bradley. He is the author of “War on the Dream: How Anti-Sprawl Policy Threatens the Quality of Life.

  • Playing With Trains

    The Obama administration appears to have established the development of high speed rail (HSR) as the most important plank of its transportation strategy. The effort may be popular with the media and planners, but it’s being promoted largely on the basis of overstatement and even misinformation.

    I have had considerable experience evaluating high speed rail projects. Most recently, Joe Vranich (a former colleague on the Amtrak Reform Council) and I teamed to produce an extensive report on the subject, California High Speed Rail: A Due Diligence Report. The findings, based on information provided by the HSR promoters reveal the claims of the Administration to be highly questionable.

    Financing: It begins with understanding transportation financing in the United States. The Administration notes that far more money has been spent on highways and airports than on intercity rail. This is not in question. However, virtually all of the money spent to build the nation’s highway system and its major airports has been paid for by users of the system. Highway users have paid for intercity highways with their state and federal fuel taxes. Airport users have paid for the airports and the air traffic control system with taxes on their tickets. Put directly, if you don’t use the highway or airport system, you don’t pay. Indeed, not only do highway users pay for highways, but at the federal level, their funds provide 8 times as much revenue to transit per passenger mile as to highways.

    Passenger rail finance is another matter. Generally, users pay less than one-half the total costs of passenger rail. The rest comes from taxpayers. If passenger rail were financed the same way as highways and airports, it would be largely paid for – both capital and operating costs – by fares and by taxes on tickets. Of course that would not work, because passenger rail is far more costly than the highway and airport competition. Today, Amtrak fares per passenger mile are more than double that of the airlines per passenger mile, and that is before the heavy subsidies received by Amtrak.

    Indeed, the most recent data provided by the Department of Transportation indicates that the federal government made a profit of $1.00 per 1,000 passenger miles on the highway program while subsidizing passenger rail $210 and transit $159 per 1,000 passenger miles.

    Ridership and Relieving Congestion: High Speed Rail is also promoted by the Administration, which claims it will reduce traffic congestion. This claim is fraught with difficulty. First, highway traffic congestion is almost exclusively within urban areas, not between the urban areas that HSR would serve. Data from the California promoters indicates that traffic levels would rise nearly as much with HSR as without it. HSR is projected to reduce traffic by less than 3 percent once the system is complete. Without high speed rail, traffic volumes would increase 52 percent and without high speed rail, traffic volumes would increase 49 percent above 2000 levels (See Figure). In either case, things would be far worse in the future than they are today. And if HSR can make so little difference in congested California, it will surely do less in other parts of the country.

    Similarly, HSR will have little or no impact on the need to expand airports. For example, the Bay Area’s regional airport plan noted that high speed rail “would not divert enough passengers to make up for the shortfall in runway capacity.”

    In France and Japan, where travel is far more concentrated due to the linear location of major urban areas and the smaller number of large metropolitan centers, markets that are well served by HSR still have significant airline traffic (Tokyo to Osaka and Paris to Marseille). Also worth noting, both nations boasted pre-existing rail ridership levels that account for much of the HSR volumes. There is no such foundation in the United States. The ridership issue is particularly important, because of the miserable record of transportation ridership projections both in the United States and around the world. A most recent example is the Taiwan high speed rail system, which according to the early projections of promoters was to carry 180,000 passengers per day in its early operations. Yet in its second year of operation (2008), the average daily ridership was less than one-half that projection (84,000, calculated from Taiwan government data). This is telling in a country with notoriously congested traffic and very few major urban centers,

    This strategy of exaggerating ridership claims (and grossly under-estimating costs) is widespread in rail projects and has been extensively documented in Megaprojects and Risks: An Analysis of Ambition, by international scholars Bent Flyvbjerg, Nils Bruzelius and Werner Rothengatter (available from booksellers). The Taiwan and other international experiences suggest a major HSR investment would cost the taxpayers many additional billions and could bankrupt any private investors.

    Greenhouse Gas Emissions: But perhaps the most misleading claims are related to greenhouse gas (GHG) emissions. It starts with the marketing. The Administration’s press release indicates that building all of its routes would reduce GHG emissions by “six billion pounds” annually. This sounds like a big number. It is akin to my characterizing my weight as nearly 100,000 grams, instead of the pounds (200 in my case) that is customary in talking about weight. In GHG emissions, we do not talk about pounds, we talk about metric tons. Six billion pounds is only 2.7 million metric tons (2,205 pounds), which is an infinitesimal share of the GHG emissions from the nation’s passenger transportation. Indeed, given the propensity of the consultants to produce ridership projections less accurate than “Vietnam body counts,” the figure is probably less.

    The Administration falls into the usual trap of assuming that theoretical differences in GHG emissions can be turned into radical changes in travel patterns and behavior. The GHG emissions per passenger mile may be less (at least before the coming improvements in vehicle technology) but that does not mean that enough passenger miles can be moved from cars (and planes) to make a material difference. Our experience in high cost urban rail projects should have taught us this.

    Moreover, a mere reduction in GHG emissions is not sufficient to justify adoption of a strategy. Strategies must be prioritized based upon their effectiveness, and that is measured by cost. On this score, the California HSR system fails to a degree that is incomprehensible. The Intergovernmental Panel on Climate Change (IPCC) has indicated that the cost of GHG emission reduction should be no more than from $20 to $50 per ton. Even that may be too high. For example, Al Gore, Governor Schwarzenegger and Speaker of the House of Representatives Nancy Pelosi studiously buy carbon offsets for the tons of GHG that they produce flying around the country. The current market rate for such offsets is under $15.

    The California High Speed Rail Authority, whose leadership touts its GHG emissions reduction potential constantly, did not even bother to look at the cost of GHG emission removal in its thousands of pages of expensive, taxpayer financed reports. We looked at the issue, using California High Speed Rail Authority and California Air Resources Board assumptions and found that the cost per ton of GHG emission removal would be nearly $2,000, or 40 times the maximum figure used by the IPCC. To illustrate how extravagant a figure that is, if the nation were to reduce its GHG emissions by 80 percent (as proposed by the Administration) at the same rate, the annual cost would be more than 75 percent of the gross domestic product.

    But that assumes all of the rosy cost and ridership projections. The figure could be as high as $10,000 per GHG ton, if the consultants have exaggerated as much in California as elsewhere.

    Conclusion: It is likely that the same arguments can be made even more strongly in other proposed high speed rail markets. Yet, as costly as it is, HSR would be no more objectionable than building a new hardware store if it were paid for by its users. However, when taxpayers are asked to foot the bill, objective analysis of the claims, costs and benefits should at least have some priority. These are issues that an Administration committed to reducing GHG emissions by 80 percent has an interest in addressing. Relying on folklore rather than reality, as seems to be the present case, reflect an abject naivety at the least and incredible foolhardiness at the worst.

    Wendell Cox is a Visiting Professor, Conservatoire National des Arts et Metiers, Paris. He was born in Los Angeles and was appointed to three terms on the Los Angeles County Transportation Commission by Mayor Tom Bradley. He is the author of “War on the Dream: How Anti-Sprawl Policy Threatens the Quality of Life.

  • Sydney: From World City to “Sick Man” of Australia

    Americans have their “American Dream” of home ownership. Australians go one step further. They have a “Great Australian Dream” of home ownership. This was all part of a culture that celebrated its egalitarian ethos. Yet, to an even greater degree than in the United States, the “Dream” is in the process of being extinguished. It all started and is the worst in Sydney.

    Sydney is Australia’s largest urban area, having passed Melbourne in the last half of the 19th century. With an urban area population of approximately 3.6 million, Sydney leads Melbourne by nearly 300,000.

    The “Great Australian Dream” in Sydney: Sydney incubated and perfected the Great Australian Dream. New housing was built in all directions from the central business district. The most expensive was built to the east and north, while the least expensive – the bungalows and other modest detached houses – rose principally to the west and the south. Western Sydney is the culmination of the Great Australian Dream for perhaps more middle and lower middle income households than any other place in the nation.

    Of course, Western Sydney was not planned in the radical sense of the word currently used by contemporary urbanists. In fact, most have little more regard for Western Sydney than for the shantytowns of Jakarta or Manila. Yet, the people of Western Sydney, like the people of countless modest suburban areas around the world, are proud of their communities and of their homes.

    Rationing Land, Blowing Out Land Prices: About three decades ago, Sydney embarked upon what was to become one of the world’s strongest “smart growth” programs (called “urban consolidation” in Australia). Aimed at concentrating population closer to the core, urban consolidation sought to restrict and even prohibit new housing on the urban fringe. Sydney developed its own equivalent of the famous Portland urban growth boundary. The result is that every land owner knows whether or not their property can be developed, and the favored understandably take advantage by charging whatever price the highly constrained market will bear.

    Reserve Bank of Australia research indicates that the price of raw land – Sydney urban fringe land for building a house that has not yet been fitted with infrastructure (sewers, water, streets, etc.) has now risen to a price of about $190,000 for a one-eighth acre lot. In the days before smart growth, the land would cost about $1,000. Needless to say, adding an unnecessary nearly $190,000 plus margins to the price of a house makes housing less affordable.

    But even where development is nominally allowed, government restrictions make building almost impossible. For years the state government has promised to “release” land for new housing on the western fringe. Yet despite announcement and re-announcement, there have been interminable delays.

    Destroying Housing Affordability: As a result, Sydney is now the second most expensive major housing market in the six nations in our Demographia International Housing Affordability Survey, trailing only Vancouver. Sydney’s Median Multiple (the median house price divided by the median household income) is now 8.3. It should be close to the historic norm of 3.0 or less. Indeed, if land prices had risen with inflation from before urban consolidation, Sydney’s Median Multiple would be less than 3.0. As a result, households entering the housing market can expect to pay nearly three times as much for their houses than was the case before. This will lead to an inevitably lower standard of living compared to what would have otherwise been.

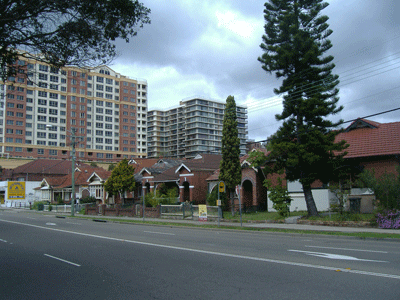
    Forcing Density: Urban consolidation is destroying not only housing affordability, but also the character of Sydney itself. Sydney is an urban area of low density suburbs. It is also an urban area of high rise living. These two housing forms have combined with one of the world’s most attractive geographical settings to create an attractive and livable urban area.

    The planners, empowered by the state of New South Wales government, are changing all of that. From the suburbs of Western Sydney to the attractive and more affluent North Shore suburbs, high-rise residential buildings are being thrust upon detached housing neighborhoods. One of Sydney’s great strengths is that the urban area has many local government areas (municipalities), empowering local democracy. These local governments have done their best to resist the state government densification mandates, in response to opposition from their citizens.

    Raw Exercise of Power: One of Sydney’s greatest weaknesses is that the state government exercises undue control over the municipalities and is using its power to “shoe-horn” high density into places where it makes no sense. High density is fine in the Toney Eastern suburbs, but has no place where detached housing is the rule. Unfortunately, the planners seem to presume communities with detached housing have no character worth salvaging.

    Urban Consolidation: Infrastructure Costs: Further, there is an inherent assumption that densification has no costs. The planners routinely exaggerate the cost of providing infrastructure on the urban fringes (failing, for example, to understand that much infrastructure is included in the price of the house, without government involvement). However, the infrastructure built for lower density detached housing is not sufficient for higher densities. As a result, there have been sewer overflows in densifying areas. Huge expenditures have been made for sewer upgrades. Tony Recsei, president of Save Our Suburbs, a community organization seeking to limit inappropriate densification, blamed recent power failures on an electricity infrastructure that was not built for high density in an April 7 Daily Telegraph letter, noting that “Cram in more people and overloading must result. That should not be too hard for people to understand.”

    Greater Traffic Congestion: And, of course, insufficient road expansion has been undertaken to accommodate the inevitable intensification of traffic congestion. The planners like to say that higher densities mean less traffic. In fact virtually all of the evidence, throughout the first world, indicates that more intense traffic congestion is associated with higher densities.

    Sydney is no exception. The average one-way work trip now takes 34 minutes, which equals that of America’s largest urban area, New York, which has more than five times the population and the land area as well as the longest travel time of any major urban area in the nation. Sydney’s planners delight in comparisons with Los Angeles, frequently suggesting that their regulations are necessary to ensure that Sydney does not “sprawl” as much as Los Angeles. Actually Sydney sprawls considerably more in relation to its population. The Los Angeles urban area is a full one-third more dense than the Sydney urban area. And despite the fact that nearly half of the planned Los Angeles freeway system was not built, Angelinos spend one hour less each week getting to work each than Sydneysiders. Even in Atlanta, with a pathetic freeway system little better than Sydney’s and one-third Sydney’s density, people spend an hour less commuting to and from work every two weeks and spend less total time traveling than in Sydney.

    The Economic Cost: There may also be an economic cost. Bernard Salt – perhaps Australia’s leading demographer – has predicted that Melbourne will overtake Sydney in population by 2028. Moreover, there has been substantial domestic migration from New South Wales to Queensland. At current growth rates this could lead the Brisbane-Gold Coast region being larger than Sydney by mid-century. Salt blames Sydney’s declining fortunes on its overly expensive housing.

    Sydney: World-Class City Status Threatened? Research in the United States has associated restrictive land use regulation with lower levels of employment growth in US metropolitan areas. In a more colorful finding, Australia’s Access Economics characterized the economy of New South as “so sick that it is at risk of adoption by Angelina Jolie.” A few decades ago, the English economy was referred to as the “sick man of Europe.” Sydney may well be on its way to becoming the “sick man of Australia.”

    Wendell Cox is a Visiting Professor, Conservatoire National des Arts et Metiers, Paris. He was born in Los Angeles and was appointed to three terms on the Los Angeles County Transportation Commission by Mayor Tom Bradley. He is the author of “War on the Dream: How Anti-Sprawl Policy Threatens the Quality of Life.

  • Greenhouse Gas Emissions and Reality: Residential Emissions

    In the quest to sufficiently reduce greenhouse gas (GHG) emissions, it is crucial to “get the numbers right.” Failure to do so would, in all probability, mean that the desired reductions will not be achieved. Regrettably, much of what is being proposed is not based upon any comprehensive quantitative analysis, but is rather rooted in anti-suburban dogma.

    Further, ideologically based approaches carry the risk of severe economic and social disruption, which could make it even more difficult, in a political world, to reach GHG emission reduction objectives. Unconsidered attacks on suburbs could also backfire, setting back more reasonable attempts to reduce emissions over time.

    For example, a recent New York Times blog entitled “The Only Solution is to Move” presumed it a necessity to (1) move from the suburbs to the city, where (2) “you are near everything you need” and to (3) abandon cars, which the author contends “cannot be reformed.” This screed provides an ideal point of reference. We start with the comparative GHG emissions efficiency of suburbs and deal with the other issues in future articles.

    The Need for Comprehensiveness: Any plausible attempt to reduce GHG emissions must start with a comprehensive understanding of the issue, including the comparative GHG intensity of various types of living and mobility patterns.

    This requires a “top down” analysis of GHG emissions by mode and locality. Such an analysis must start with the gross GHG emissions in a nation and allocate each gram to a consuming household. A household allocation is necessary, because businesses emit GHGs only to satisfy the immediate or eventual demand of consumers. “Top down” is required because that is the only way to make sure the analysis includes everything. The typical “bottom up” analysis runs the risk of missing large amounts of emissions as analysts highlight their own “hobby horse” sources, while excluding the inconvenient. This is why we have “double entry” bookkeeping – to make sure that the sums balance.

    “Top down” comprehensiveness has been best developed by the Australian Conservation Foundation (ACF) Consumption Atlas, which is the only study I have found that allocates every gram of GHG emissions in a nation to households. That is a minimum requirement.

    Residential GHG Emissions

    Having reviewed the need for comprehensiveness, the balance of this article will deal with residential GHG emissions. Despite all the airtime – and trees – sacrificed for lengthy columns on GHG emissions, it is clear that the state of the research in the United States remains abysmal.

    GHG Emissions: A Function of House Size: Research has been published that suggests the dominant suburban housing form (the detached single-family dwelling) is more GHG intensive than more urban, multi-unit and high-rise apartment and condominium housing forms. However, the entire supposed city versus suburbs advantage relates to house size. The Department of Energy’s Residential Energy Conservation Survey (RECS) data shows that the energy consumption per square foot is 70 percent higher in residential buildings with five or more units (the largest building size reported upon) than in detached houses. Full disclosure on the part of the anti-suburban crowd would require telling people that their conclusions would mean much smaller house sizes.

    Common Area GHG Emissions: There is, however, a far more fundamental problem. The databases usually relied upon (The Bureau of the Census’s PUMS and the Energy Department’s RCES), as cited in the USDOE 2008 Buildings Energy Data Book, do not provide sufficient information to demonstrate any high-density GHG emissions advantage.

    None of these data sources include the GHG emissions from “common” energy consumption in multi-unit residential buildings. Their information is limited to energy consumption as directly billed to consumers. Thus, in a high-rise building, common energy consumption sources such as elevators, common area lighting, parking lot lighting, swimming pool heating, common heating, common water heating, common air conditioning, etc. are not included. Detached housing generally does not have common energy consumption.

    The “common” consumption omission is serious. Other Australian research indicates how inaccurate consumer based inventories can be. Energy Australia has showed that, in the Sydney area, GHG emissions per capita, including common consumption, in high-rise residential buildings are 85 percent greater than in single family detached dwellings. Other multiple unit buildings are also more GHG intensive, while townhouses (row houses) are the best (see Figure).

    The inclusion of common consumption may be a principal reason why the ACF data associates lower GHG emissions with single family detached housing.

    Construction Materials: There is a further complicating factor. The materials that must be used to construct high-rise residential buildings, chiefly concrete and steel, are far more GHG intensive than the wood used in most single family dwelling construction. A 1997 Netherlands study indicates that the GHG emissions per square foot of high rise construction may be as much as five times that of a detached dwelling. In the newest energy efficient housing, the same study finds that the GHG emissions, over a building’s lifetime, can be greater than the emissions from day to day operation. The report notes that construction materials will become more important in residential GHG emissions, because improvements in routine energy consumption are likely to be more significant than those in building materials production.

    Then there is the issue of the GHG emissions in the construction process. It would not be surprising, for example, if heavy cranes could also tip the balance against high-rise towers.

    Dynamic Rather Than Static Analysis: Anyone who has studied economics understands the importance of “dynamic” versus “static” analysis. Dynamic analysis takes account of likely changes, while static analysis assumes that everything will continue to be as it is today. Much of the research on residential GHG emissions is based upon a static analysis. Yet, the housing stock (like the automobile stock) was largely produced during a time when there was little policy incentive to reduce GHG emissions. We are entering what may well be a very different policy environment. The comparatively recent emphasis on GHG emissions is producing a plethora of ideas, research and solutions. A recent Chicago Tribune article noted a surge in university graduates interested in research to reduce the GHG intensity of energy. The zero emission suburban house is on the horizon, which could take housing form “off the table” as a GHG emission issue and render static research to the internet equivalent of rarely accessed library stacks. Dynamic analysis asks “what can be,” not just “what is.”

    Cost per GHG Ton Reduced: All of this raises a question about how to identify policy strategies. The answer is to compare costs. The Intergovernmental Panel on Climate Change suggests that the maximum costs should be on the order of $20 to $50 per ton. McKinsey has published research indicating that steep reductions can be produced in the United States at less than $50 per ton.

    Yet, the costs of GHG emissions reduction are as absent from much of the present literature as the GHG emissions from elevators in high-rise towers. But costs are important. Economic and social disruption is likely to be greater to the extent that people are forced to change their lives. There is a big difference between requiring people to reduce their emissions where they live versus trying to uproot them – as well as their families and business – to urban cores. The former offers the hope of achieving sufficient GHG emission reductions, while the latter promises to incite a bitter fight between the bulk of the middle class and the regulatory apparatus. All this with a high probability that GHG emissions will not be sufficiently reduced.

    The Bottom Line: Outside some in the urban planning community, there is no lobby for reducing people’s standard of living. At least with respect to residential development and housing form, this does not appear to be necessary. The common area and construction GHG impacts of high-rise condominium buildings could well be greater both per capita and per square foot than those of detached housing. There is no need to force a move into a futuristic Corbusian landscape of skyscrapers. Indeed, it could even make things worse – for households, communities and even the environment.


    Previous posts on this subject:
    Regulating People or Regulating Greenhouse Gases?
    Greenhouse Gas Reduction Policy: From Rhetoric to Reason
    Enough “Cowboy” Greenhouse Gas Reduction Policies

  • Move to Suburbs Continues in Western Europe

    Despite the assertions of some planners and urban boosters, urban core population loss has been the rule since mid-century throughout the metropolitan areas of Western Europe (see note below). For example, the ville de Paris lost a quarter of its population from 1954 to 1999, Copenhagen shrank 39 percent from 1950 to 1991, inner London (This includes the 13 inner boroughs and the “city” of London, which are roughly the former London County Council area) declined by a third from 1951 to 1991 while Milan‘s population declined by a quarter from 1971 to 2001.

    At the same time, widely ignored by many American observers, Western Europe has been suburbanizing strongly. Since 1965, virtually all major metropolitan area growth has been in the suburbs. Indeed the share of the metropolitan area population gains in the suburbs has been greater in Western Europe than in the United States.

    It is true, however, that there has been a generally modest turnaround in core population trends, with strong turnarounds in the “ancient” losers of Vienna (which peaked in 1911) and inner London (which peaked in 1901). It might be tempting to suggest – as is often done in the United States – that these reversals indicate that Europeans are moving back to the cities from the suburbs.

    To answer this question, we examined all of the available “components of population change” reported by the census authorities of Western European nations. Seven of the 17 (the European Union-15 plus Norway and Switzerland) produce such data at a geographical level that makes metropolitan analysis possible. A review of this data suggests that the new residents are largely international migrants and that the core cities generally continue to lose domestic migrants, while the suburban areas continue to perform better with respect to attracting domestic migrants. This parallels the experience in the United States.

    Vienna: Vienna illustrates the trend. The city of Vienna increased its population from 1,550,000 to 1,656,000 between 2002 and 2007. This 7.3 percent gain is impressive but over the same period, a net 11,000 residents left the city. Virtually all of the population increase was the result of international migration, which accounted for 113,000 new residents. On the other hand, the suburbs of Vienna added 32,000 new domestic migrants and also added 23,000 international migrants. Vienna’s population turnaround can be fully attributed to immigration.

    Inner London and England: Like Vienna, inner London’s gains have not been the result of people moving from the suburbs to the city. Between 2001 and 2007, a net 326,000 people moved from inner London to other parts of England and Wales. The domestic migration losses were even larger than the gain of 282,000 from international migration. The inner suburbs (the outer boroughs added to the city in the 1960s) also lost domestic migrants, but at a rate half that of inner London. The exurbs (the two rings of counties outside the Green Belt) added 126,000 domestic migrants and a somewhat larger number of international migrants.

    Overall, the London metropolitan region experienced a net domestic migration loss of more than 383,000 between 2001 and 2007. However, there were strong international migration gains, in every sector of the metropolitan area.

    Thus, the data indicates that the recent inner London population growth is not the result of suburbanites moving to the city. Inner London’s population growth is being driven by international migration and the natural increase in population (births minus deaths).

    As with inner London, the cores of Birmingham, Manchester, Liverpool, Newcastle and Leeds-Bradford all lost domestic migrants from 2001 to 2007. Thus, despite the improved population performance of the largest metropolitan areas in the United Kingdom, people continue to move out of the cores, while people are generally moving to suburban areas.

    Milan and Italy: The city of Milan, the core of Italy’s largest metropolitan area, has experienced one of Western Europe’s most significant population losses since the early 1970s. Yet, in the early years of the decade, Milan has experienced a turnaround, as the population has begun to grow. The pattern was much the same as seen in London, with a net 40,000 residents leaving Milan province to move to other parts of Italy. At the same time, there was a strong net international migration gain of 168,000. Suburban areas, on the other hand, attracted a net 119,000 domestic migrants as well as a strong component of international migration.

    A shorter data series is available for cities (communes) and shows net domestic migration losses in the central cities of Milan, Rome, Naples, Turin, Genoa, Palermo, Florence and Bologna. The suburbs, however, gained domestic migrants, with the exception of Naples. However, the Naples suburban losses were at a far lower rate than that of the city.

    It is thus evident that the core areas of the largest Italian metropolitan areas are not receiving net migration from their suburbs.

    Stockholm and Sweden: Similarly, the city of Stockholm’s recent gains have not been the result of migration from the suburbs. Between 2001 and 2007, the city lost a net 8,000 domestic migrants. This loss was more than made up by the international net migration of 29,000. At the same time, the suburbs and exurbs gained 15,000 domestic migrants.

    Sweden’s second largest metropolitan area, Gothenburg, was one of only two of the 19 cases in which there was net domestic migration to the core (which had been enlarged in the 1990s to include many suburban areas). The city gained 500 domestic migrants and 15,000 international migrants. However, the suburbs gained approximately 13 times as many domestic migrants than the city, again indicating no trend of movement from the suburbs to the city.

    Helsinki: Finland’s capital mirrors the general trend. The city of Helsinki lost 6,500 domestic migrants between 2002 and 2007, which was more than compensated for by an 11,800 net international migration gain. As in nearly all of the other cases, the suburbs and exurbs gained domestic migration, illustrating that there is not a movement from the suburbs to the city in Helsinki.

    Oslo: Norway’s capital was, with Gothenburg, the only core experiencing net domestic migration. Oslo County gained 5,400 domestic migrants. However, the suburbs and exurbs gained domestic migrants at a greater rate, adding 16,000. Thus, despite the core domestic migration gains, there is no evidence of a “return” from the suburbs and exurbs to the city in Oslo.

    Conclusion: The available data from national census authorities provides no evidence to suggest any sort of general movement of the population from suburban and exurban areas to the central cities of Western Europe. This mirrors the situation in the United States, where interests that hold the suburbs in contempt continue to declare their death, while the latest data continues to show the opposite – strong domestic migration losses in core areas and gains in the suburbs.

    There is one other key factor in the European case: the enlargement of the European Union in 2004, which increased the national membership from 15 to 25 (and subsequently to 27) and allowed for the mass migration of people from the east to the wealthier west. Whether the international financial crisis may reverse this trend, with many Eastern European residents moving back to their native countries, remains an open question.


    Note on European metropolitan areas: There is no European standard for determining metropolitan areas (which are labor markets). The European Audit’s “Larger Urban Zones” (LUZ) are the closest approximation, but are not consistently defined throughout the European Union. For example, the Naples LUZ includes only the core and inner suburbs, an area far smaller than the functional metropolitan area. Many other larger urban zones include suburban and exurban areas, consistent with the concept of a metropolitan area.

    Wendell Cox is a Visiting Professor, Conservatoire National des Arts et Metiers, Paris. He was born in Los Angeles and was appointed to three terms on the Los Angeles County Transportation Commission by Mayor Tom Bradley. He is the author of “War on the Dream: How Anti-Sprawl Policy Threatens the Quality of Life.

  • SPECIAL REPORT – Domestic Migration Bubble and Widening Dispersion: New Metropolitan Area Estimates

    Returning to Normalcy

    The Bureau of the Census has just released metropolitan and county population estimates for 2008, with estimates of the components of population change, including domestic migration. Consistent with the “mantra” of a perceived return to cities from the suburbs, some analysts have virtually declared the new data as indicating the trend that has been forecast for more than one-half a century. In fact, the new population and domestic migration data merely indicates the end of a domestic migration bubble, coinciding with the end of the housing bubble.

    Metropolitan Area Growth: As usual, the metropolitan areas with more than 1,000,000 population increased above the national rate of 7.8 percent, at 9.2 percent from 2000 to 2008. Smaller metropolitan areas (between 50,000 and 1,000,000 population) grew at the national rate of 7.8 percent. Also continuing a long-standing pattern, areas outside metropolitan areas (including rural areas) grew slower, at only 0.7 percent (Table 1).

    The overall trends, however, mask significant variations. The nation’s two metropolitan areas with more than 10,000,000 population are experiencing growth rates less than one-half the national average. New York grew only 3.6 percent, while Los Angeles – which for decades experienced above average growth, could manage only one-half the national average rate, at 3.8 percent. Indeed, Chicago grew faster, at 5.0 percent. If 2000s growth rates were to continue to 2050, Dallas-Fort Worth, Atlanta and Phoenix would exceed Los Angeles in population, while Houston would pass Los Angeles shortly thereafter. This is not a prediction – population growth in these fast growing areas will likely slow as they get larger – but is merely offered to show how moribund the Los Angeles growth rate has become.

    The strongest growth was among metropolitan areas with between 5,000,000 and 10,000,000 population, which added 12.1 percent to their populations. This was driven by gains of more than 1,000,000 in Dallas-Fort Worth and Atlanta, nearly 1,000,000 in Houston and over 500,000 in Washington (DC). Philadelphia’s growth rate, however, was even less than that of New York or Los Angeles, at 2.7 percent.

    There was also strong growth (9.5%) among the metropolitan areas with between 2,500,000 and 5,000,000 population. This was driven by an increase of more than 1,000,000 in Phoenix and more than 800,000 in Riverside-San Bernardino. San Francisco (3.3 percent) and Boston (2.7 percent) grew at less than one-half the national rate, while Detroit lost population.

    The metropolitan areas with between 1,000,000 and 2,500,000 population also grew more than the national average, at 10.5 percent. The strongest growth was in Las Vegas, which added nearly 475,000 residents. Charlotte, Sacramento and Austin also added more than 300,000. Providence, Milwaukee and Hartford all experienced growth at less than one-half the national rate; while Cleveland, Pittsburgh, Buffalo and Katrina ravaged New Orleans all lost population. Tucson became the nation’s 52nd metropolitan area with more than 1,000,000 population in 2008, having added nearly 20 percent to its population since 2000.

    The largest percentage growth (35.4%) among metropolitan areas over 1,000,000 population was in Raleigh, which added 284,000 new residents (This is not Raleigh-Durham, which the Bureau of the Census calls a combined statistical area, consisting of the Raleigh metropolitan area and the Durham metropolitan area). Raleigh displaced recent perennial growth leader Las Vegas, which experienced slower growth due to the collapse of the housing bubble.

    Domestic Migration

    Much has been made of the apparent recent slow-down in domestic migration (residents moving from one county to another) as indicated in the new data. In fact, however, domestic migration was greater in 2008 than it was in 2001. The slow-down should be more appropriately viewed as a return to more normal conditions.

    This can be illustrated by examining the gross domestic migration between metropolitan areas over 1,000,000 population. In 2008, gross migration in the metropolitan areas of more than 1,000,000 was 560,000. This is slightly more than the 546,000 in 2001. Gross migration increased after 2001, peaking at 1,270,000 in 2006. This fell to 862,000 in 2007 and then to 560,000 in 2008 (Table 2).

    The Domestic Migration Bubble

    The domestic migration bubble that developed from 2000 through 2007 coincided with the domestic housing bubble. This is not surprising, because housing consumes a major part of household expenditures. The differences in housing costs are much greater between metropolitan areas than any other major category of personal expenditure. For example, transportation, clothing and food have similar costs among the nation’s metropolitan areas. During the bubble, however house prices doubled and tripled in some metropolitan areas relative to incomes. The housing bubble appears to have sparked its own domestic migration bubble, as people moved from less affordable areas to more affordable areas.

    This is illustrated by examining domestic migration trends by housing affordability. The more affordable metropolitan areas had Median Multiples at the peak of the housing bubble of 4.0 or less (The “affordable” and “moderately unaffordable” categories from the Demographia International Housing Affordability Survey) and the less affordable metropolitan areas had Median Multiples of 4.1 or above (the “seriously unaffordable” and “severely unaffordable” categories from the Demographia International Housing Affordability Survey).

    The less affordable (higher cost) metropolitan areas experienced both the largest house price increases and a spike in net domestic migration losses. Overall, the less affordable metropolitan areas lost 2.8 million domestic migrants from 2000 to 2008 (Table 3 and Figure). This started in 2001 with a modest loss of 116,000, which ballooned to 514,000 by 2007. The loss dropped to 287,000 in 2008, a figure more than 2.5 times the 2001 net domestic migration loss.

    At the same time, the affordable metropolitan areas experienced substantially lower house price escalation, while gaining nearly 900,000 domestic migrants from 2000 to 2008. In 2001, the more affordable metropolitan areas experienced a net domestic migration gain of nearly 129,000. Domestic migration gains peaked in 2007, at 269,000. Domestic migration gains fell to 184,000 in 2008 in the more affordable metropolitan areas. However, this figure was still far higher than the numbers at the beginning of the decade.

    Suburbs Continue to Gain

    The data also shows that people continue to move to the suburbs and move away from core areas. This can be shown from the county data, which is generally the smallest geographic area for which migration data is produced. One caveat: because many core counties contain suburban areas as well as the historic core cities, a county based migration analysis usually understates the extent of both core losses and suburban gains.

    The core counties improved their domestic migration performance in 2008, but continue to suffer losses. In 2008, the net domestic migration loss in core counties was 314,000, which compares to the 498,000 loss in 2001 and an annual average loss of 580,000 over the decade. Losses of this magnitude can hardly be characterized as a “turnaround.”

    Net domestic migration gains were down to 192,000 in the suburban counties from a 398,000 gain in 2001 and an average gain of 246,000 over the period. However, net suburban migration gains were up in 2008 from 2007 and 2006 (Table 4). Out of the 48 metropolitan areas, suburban counties performed better than core counties in net domestic migration in 42 cases, matching the figure for 2000-2008, the same as in 2007 and up from 38 in 2006. Among the six metropolitan areas where core net migration was greater than in the suburbs, core counties lost fewer domestic migrants than the suburbs (Washington and Virginia Beach), three were areas where the core county typically experiences higher net migration because of its population dominance (Phoenix, Raleigh and San Antonio) and the last was New Orleans, where the core county was much harder hit than the suburban counties by Hurricane Katrina related losses leading to greater gains in domestic migrants as it recovers (Orleans Parish, which is also the city of New Orleans). It is more than “a stretch” to interpret the new data to suggest any move to core areas from suburban areas.

    The 2008 domestic migration data does indicate a slow down or even a reversal in some more distant suburban and exurban areas. This was also to be expected because these areas had experienced a large increase in home ownership and a high volume of high risk sub-prime lending.

    As a result, exurban metropolitan areas like Riverside-San Bernardino, Stockton, Modesto and Merced experienced domestic migration reversals, while distant counties within metropolitan areas (such as Stafford County, Virginia in the Washington area and Pike County, Pennsylvania in the New York area) saw declines in their domestic migration. Much of the growth in such more distant areas occurred because of planning regulations in closer in areas made new development impossible or impossibly expensive. Thus, new housing construction was forced to “leap frog” over developable land, which also imposed higher transportation costs and longer commuting distances on the new home owners.

    At the same time, the better domestic migration performance in some core counties and “closer-in” counties occurred in large part because households no longer had a financial incentive to “cash-out” and move to lower cost areas, since they were often facing negative equity. This removed much of the incentive to move from San Francisco or Los Angeles to Las Vegas, Reno, Phoenix, Tucson or Portland, where prices were considerably lower (though still much higher than before).

    The Real Story: Widening Dispersion

    Not only are people continuing to move from core areas to more suburban areas, but they are also moving from larger metropolitan areas to smaller metropolitan areas (Table 5). Since 2000, approximately 2,275,000 people have moved from large metropolitan areas and non-metropolitan areas to smaller metropolitan areas – those with populations of between 50,000 and 1,000,000. In 2001, the smaller metropolitan areas gained 115,000 domestic migrants. These net migration gains peaked in 2006, at 423,000. Following the national trend, net domestic migration to smaller metropolitan areas fell to 144,000 in 2008, still in excess of the 2001 number. Net domestic migration in the smaller metropolitan areas exceeded that of the larger less affordable metropolitan areas by 5.1 million over the period and exceeded that of the larger more affordable metropolitan areas by 1.4 million.

    Despite these trends, most metropolitan areas continue to add population. The domestic migration losses are more often than not made up by the natural increase in population (births minus deaths) and net international migration gains.

    However, households who already live here continue to exhibit a pattern of dispersion. Both within the same metropolitan area and between metropolitan areas, the latest Bureau of the Census data continues to show a clear trend of wider dispersal – from core counties to suburban counties and from larger metropolitan areas to smaller.

    References:Major Metropolitan Area Population & Domestic Migration 2000-2008: http://www.demographia.com/db-2008met.pdf

    Wendell Cox is a Visiting Professor, Conservatoire National des Arts et Metiers, Paris. He was born in Los Angeles and was appointed to three terms on the Los Angeles County Transportation Commission by Mayor Tom Bradley. He is the author of “War on the Dream: How Anti-Sprawl Policy Threatens the Quality of Life.

  • Enough “Cowboy” Greenhouse Gas Reduction Policies

    The world has embarked upon a campaign to reduce greenhouse gas (GHG) emissions. This is a serious challenge that will require focused policies rooted in reality. Regrettably, the political process sometimes falls far short of that objective. This is particularly so in the states of California and Washington, where ideology has crowded out rational analysis and the adoption of what can only be seen as reckless “cowboy” policies.

    Last year, California enacted Senate Bill 375, which seeks to reduce future GHG emissions by encouraging higher urban population densities and forcing more development to be near transit stations. Yet there is no objective analysis to suggest that such an approach will work. Of course, there are the usual slogans about people giving up their cars for transit and walking to work, but this occurs only in the minds of the ideologues. The forecasting models have been unable to predict any substantial reduction in automobile use, and, more importantly, such policies have never produced such a result.

    In fact, higher densities are likely to worsen the quality of life in California, while doing little, if anything to reduce GHG emissions. California already has the densest urban areas (which includes core cities and surrounding suburbs) in the United States. The Los Angeles urban area is 30 percent more dense than the New York urban area. The San Francisco and San Jose urban areas are also denser than the New York urban area. Sacramento stands as the 10th most dense among the 38 urban areas over 1,000,000 population, while Riverside-San Bernardino ranks 12th and San Diego ranks 13th.

    This high density creates the worst traffic congestion in the nation. The slower stop and go operation of cars in traffic congestion materially intensifies local air pollution and increases health hazards. It also consumes more gasoline, which increases GHG emissions. Finally, California’s prescriptive land use regulations have destroyed housing affordability. By the early 1990s, land use regulation had driven prices up well beyond national levels relative to incomes, according to Dartmouth’s William Fischell. Over the next decade the rationing effect of California’s excessive land use restrictions tripled house prices relative to incomes, setting up the mortgage meltdown and all that has followed in its wake.

    The implementation of Senate Bill 375’s provisions seems likely to make things worse. California’s urban areas already have plenty of dense “luxury” housing, much of which is now empty or is now converted from condos to rentals. Wherever they are clustered, particularly outside traditional urban centers like San Francisco, such areas experience intense traffic congestion, with all the resultant negative impact on both people and the environment.

    Yet despite the problems seen in California, the ideological plague has spread to Washington state. Last year the Washington legislature enacted a measure (House Bill 2815) that requires reductions in driving per capita, for the purpose of GHG emission reduction. By 2050, driving per capita is supposed to be halved. This year there was a legislative proposal, House Bill 1490, that would have mandated planning for 50 housing units to the acre within one-half mile of light rail stations. This would have amounted to a density of nearly 50,000 per square mile, 3 times the city of San Francisco, 7 times the density of the city of Seattle and more than that of any of more than 700 census tracts (small districts) in the three-county Seattle area. Areas around stations would be two-thirds as dense as Hong Kong, the world’s most dense urban area.
    The density requirement has since been amended out of the bill, but the fact that it made it so far in the legislature indicates how far the density mania has gone. The bill appears unlikely to pass this year.

    Extending the density planning regime is not likely to help the people on the ground, much less reduce GHGs. Seattle already has a housing affordability problem, which is not surprising given its prescriptive planning policies (called growth management or smart growth). Theo Eicher of the University of Washington has documented the close connection between Seattle’s regulatory structures and its house price increases.

    As in California, Seattle house prices rose dramatically during the housing bubble, nearly doubling relative to incomes. At the same time, much of the debate on House Bill 1490 has been over affordable housing. Yet there has been virtually no recognition of connection between Seattle’s low level of housing affordability and its destructive land use regulations. House Bill 1490 would have only made things worse, and still could. Proponents have indicated that they have not given up.

    The theory behind House Bill 1490 parallels that of California’s SB 375. It assumes high densities would significantly reduce driving and attract people to transit. As in California, however, this is based upon wishful thinking, and has no basis in reality. No urban area in the developed world has produced a material decline in automobile use through such policies.

    Regrettably, the special interest groups behind the California and Washington initiatives appear more interested in forcing people to change their lifestyles than in reducing GHG emissions. This is demonstrated by the Washington driving reduction requirement.

    A good faith attempt to reduce GHG emissions from cars would have targeted GHG emissions from cars, not the use of cars. The issue is GHG emission reduction, not behavior modification, and the more the special interests target people’s behavior, the clearer it becomes how facetious they are about reducing GHG emissions.

    Technology offers the most promise. Already the technology is available to substantially reduce GHG emissions by cars, without requiring people to change their lifestyles. Hybrids currently being sold obtain nearly three times the miles per gallon of the average personal vehicle (cars, personal trucks and sport utility vehicles) fleet. And that is before the promising developments in decades to come in alternative fuels and improved vehicle technology. In addition, the rapid increase in people working at home – a number on track to pass that of transit users by 2015 – would also represent a clear way to reduce GHG emissions.

    Finally it is not certain that suburban housing produces higher GHG emissions per capita than high rise urban development. The only comprehensive research on the subject was conducted in Australia and found that, generally, when all GHG emissions are considered, suburban areas emitted less per capita than higher density areas. This is partially because dense urbanites tend to live a high consumption lifestyle, by eating out at restaurants serving exotic foods, having summer homes and extensive travel. It is also because high density living requires energy consumption that does not occur in lower density suburbs, such as electricity for elevators, common area lighting, and highly consumptive central air conditioning, heating, water heating and ventilation, as Energy Australia research indicates.

    Further, tomorrow’s housing will be more carbon friendly than today’s. Japan has already developed a prototype 2,150 square foot, single story suburban carbon neutral house.

    Much of the anti-suburban and anti-car sloganeering ignores these developments and generally assumes a static world. If the world were static, we would still be living in caves.

    The California and Washington initiatives were not based upon any comprehensive research. There were no reports estimating the tons of GHG emissions that were to be reduced. There was no cost analysis of how much each ton removed would cost. United Nations Intergovernmental Panel on Climate Change (IPCC) has said that the maximum amount necessary to accomplish deep reversal of GHG concentrations is between $20 and $50 per ton. Responsible policy making would have evaluated these issues. (It seems highly improbable that Seattle’s currently under-construction University light rail extension remotely matches this standard, with is capital and operating costs per annual patron of more than $10,000.)

    The price that society can afford to pay for GHG emission reduction is considerably less today than it was just six months ago. The history of the now departed communist world demonstrates that poorer societies simply do not place a high priority on environmental protection. That is not surprising, since people address their basic human needs before broader objectives, such as a better environment. That may not comport with the doctrines of political correctness, but it is reality.

    In such times, communities should be careful not to undertake policies based on assumptions or the preferences of those planners, architects and ideologues who seem to hold suburbs and personal mobility in such contempt that they would not be satisfied even if they emitted no GHGs. These radical motives are inappropriate. “Cowboy” policies enacted ad hoc at the bequest of ideologues openly disdainful of our basic lifestyles threaten not only the future prosperity of a society but our most reasonable path to long-term environmental improvement including reducing GHG emissions.

    Wendell Cox is a Visiting Professor, Conservatoire National des Arts et Metiers, Paris. He was born in Los Angeles and was appointed to three terms on the Los Angeles County Transportation Commission by Mayor Tom Bradley. He is the author of “War on the Dream: How Anti-Sprawl Policy Threatens the Quality of Life.