Category: Demographics

  • China’s Urban Challenge: Balancing Sustainable Economic Growth and Soaring Property Prices

    Today, Beijing seeks to balance strong economic growth and soaring prices amidst a severe global crisis and debt turmoil in advanced economies. The challenge is colossal – to provide urban space for more than 600 million people in the coming decades.

    For months, the famous hedge fund wizard, James Chanos, has been predicting a severe Chinese property slump. As he puts it, “Dubai times 1,000 – or worse,” with the “potential to be a similar watershed event for world markets as the reversal of the U.S. subprime and housing boom.”

    The contrarian investor Chanos made his fortune on Wall Street by foreseeing the collapse of Enron and other high flying companies whose stories were “too good to be true.” He is not the only skeptic on China, but certainly one of the most prominent and articulate. And yet, China’s real estate market is very different from those of the U.S. or Dubai.

    In Dubai, the problem had to do with too much leverage. In China, consumers buying residential properties are required to put down 30 percent before taking out a mortgage. For a second home, the down payment is 50 percent, irrespective of their net worth. Home purchase is predicated on affordability.

    In the pre-crisis U.S., perverse incentives were magnified by low interest rates, sometimes minimal down payment and loans to those with poor credit histories. Excessive debt was sliced, repackaged and securitized into mortgages. Banks and ratings agencies engaged in unethical conduct. Appropriate regulatory oversight was absent.

    In the long-run, the containment of rapid price increases is vital for China’s economic growth and social cohesion. In the short-run, volatile price fluctuations are difficult to avoid in the large urban centers. These large agglomerations are evolving into “global cities”, which are driven not just by local conditions, but by global trade and investment.

    Soaring prices
    In “China bubble” predictions, Chinese property markets are typically portrayed as unitary or homogeneous. Yet, there is huge variation among cities and regions. In 2009, the urban GDP per capita was highest in Shenzhen reaching almost US$13,800 USD, whereas in Hefei it was about US$6,100.

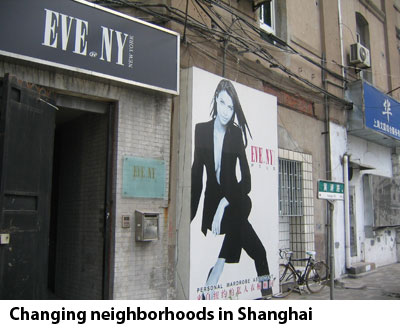
    Until recently, the concern for the soaring prices in the property markets has been focused primarily on the high-end segment of the first-tier cities. Since the 1980s, the economic ripple effect of the successful first-tier cities – such as Shenzhen, Beijing, and Shanghai – has been spreading into new generations of Chinese cities.

    By the early 2000s, second-tier cities – from Suzhou and Shenyang to Chengdu and Chongqing – attracted significant attention with investments from global corporate giants. Third-tier cities – from Ningbo and Fuzhou to Wuxi and Harbin – have been following in the footprints, while inspiring still others, such as Kunming and Hefei.

    Yet for the most part soaring prices characterize primarily residential properties – almost exclusively the high-end segment of the most prosperous first-tier cities.

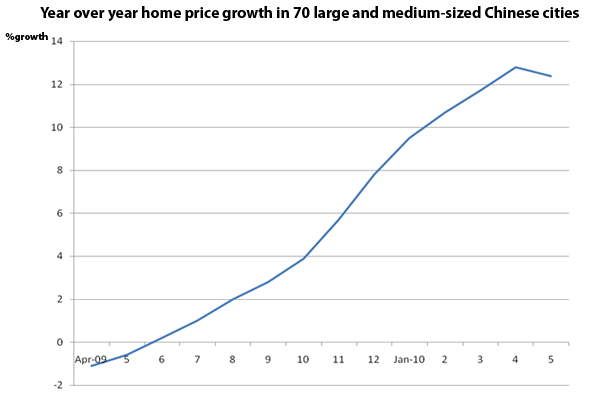
    In March, property prices in 70 Chinese cities soared by a record 11.7 percent from the previous year. In response, the government rolled out a series of measures to curb the domestic housing market amid concerns over asset bubbles.

    In early May, the People’s Bank of China raised the reserve requirement ratio for major banks by half a percentage point. Property stocks were expected to face further decline. Following Beijing and Shenzhen, the Shanghai municipal government released regulations for the property sector to curb housing speculation and soaring prices.

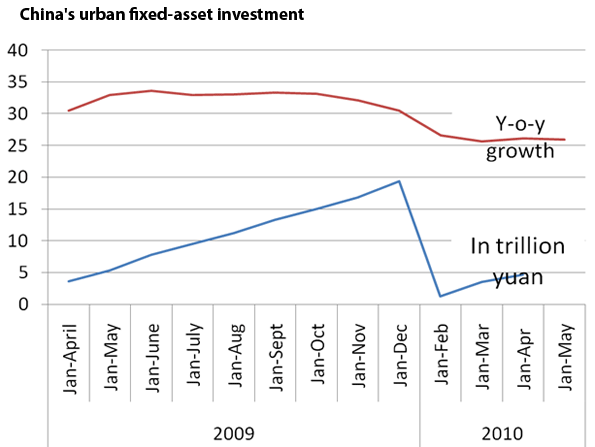
    Some observers worried that tightening policies may deter property developers from starting new projects and purchasing land, thereby cutting the supply and pushing up prices next year. And yet, despite these measures, housing prices rose 12.8 percent in April from a year earlier. At the same time, China’s urban fixed-asset investment increased by 26.1 percent year-on-year to $684.63 billion. The growth rate was 4.4 percentage points lower from the same period of 2009.

    As public concern over “skyrocketing housing prices” continued to simmer, the real estate tycoon Ren Zhiqiang was hit by a shoe at a forum in Dalian. The attacker was fuming over soaring housing prices.

    Last month, home prices in 70 Chinese cities rose by 12.4 percent year-on-year. The growth rate was 0.4 percentage points lower than in April, as property sales in first-tier cities (including Beijing, Shanghai and Shenzhen) contracted following the string of government measures. New home prices rose 15.1 percent year-on-year, down 0.3 percentage points from April.


    In a bid to curb soaring prices, the government has tightened scrutiny of developers’ financing, curbed loans for third-home purchase, raised minimum mortgage rates and tightened down-payment requirements for second-home purchases.

    By early summer, new home sales in Beijing were down 70 percent. Property transactions in Shanghai slumped around 70 percent and in Shenzhen by 62 percent month-on-month in May.

    Why have prices soared so frantically and what could be done about it?

    Toward new developments and new business models
    In the West, the great urban centers – from Paris to New York City and Tokyo – evolved into great metropolises in a century or two. In China, the first-tier cities – such as Shenzhen, Beijing, and Shanghai – are morphing into global cities in barely decades.

    Understandably, the residents of the first-tier cities would like to own an apartment in their home city. However, these cities also attract the wealthy across China, prosperous investors in East Asia and multinational property companies worldwide.

    Additionally, the high price-to-rent ratios have been driven by speculation, the desire for long-term investment, and few investment instruments.

    Even buyers contribute to soaring prices. To facilitate the marriage of their son or daughter, parents are often willing to devote their savings to real estate. As the young couple and their parents put income and savings into a purchase of a single apartment, excessive prices are driven even higher.

    In addition to great demand, the soaring prices reflect supply dilemmas. Currently, residential real estate development is geared to high-end and high-margin properties, which ensure a significant cash flow for cities. In the leading cities, the direct and indirect GDP contribution by real estate can amount to some 25-35 percent of the GDP; in other cities, this contribution is relatively higher. Ironically, luxury developments support local incomes, which maintain economic growth nationwide.

    As long as high-end real estate offers high margins where affordable housing does not, regional governments, which possess the land rights, have an incentive to prioritize luxury projects.

    The government seeks to sustain real estate market development and thus to support growth critical for China’s economy. It also seeks to ensure affordable housing vital to Chinese people. As debt problems are escalating in the West, reconciling these goals – economic growth and affordable housing – poses a difficult challenge.

    A shift towards affordable mass-market – reportedly only 10 percent of total residential sales – is critical. In the current business model, high margins come from a very narrow high-end segment of the market. This made sense in the early days of Chinese real estate when only few wealthy people could afford a home.

    Today, far more Chinese are able and willing to acquire a home. A new era requires a new business model, which can be based on the broad middle-class segment of the market.

    Conclusion: China is not Japan déjà vu
    In China’s property markets, some argue that the risks are now so great that a decade of little or no growth, as Japan experienced in the 1990s, can no longer be dismissed. They see parallels with Japan in the late 1980s, when authorities responded to the export slump caused by the revaluation of the yen after the 1985 Plaza Accord. As Tokyo adopted a low interest rate policy to boost an expansion in domestic demand, it also created conditions for a massive economic bubble.

    Yet, contemporary China’s situation is very different. First of all, in China, there remains a large shortage of residential property that meets new living standards.

    In Japan, property price increases were more than 30 percent in the latter half of the 1990s. In China’s prosperous coastal cities, they have been around 12 percent in 2003-2009.

    In Japan, the health of the banks deteriorated rapidly with the asset bubble. In China, the share of non-performing loans declined from almost 20 percent to less than 2 percent in the 2000s.

    In Japan, the asset bubble occurred after the eclipse of the high-growth era. Instead of a potential growth rate of 3-4 percent, China, assuming stability in the international and domestic operating environment, may enjoy relatively high growth for another decade or two. In such circumstances, even rapid price fluctuations in the first-tier cities can be tolerable, even if they are not preferable.

    Ultimately the difference between Japan and China is reflected by demand. Japan in the 1980s was already highly urbanized and its city population was plateauing. In China, the situation is very, very different.

    Today, there are some 360 million urban residents in China. In the next three decades, the figure is expected to grow to 970 million. What Beijing is trying to achieve is unique in history – to create urban space to more than 610 million people, within a single generation.

    In such an environment, periods of overheating will occasionally be accompanied by dramatic price increases.

    China, the urbanization rate is about 45 percent, whereas in Japan and other advanced countries it is more than 80 percent. As these nations reflect very different levels of economic development and different levels of individual prosperity, their real estate markets are different as well.

    Despite its rapid pace of expansion, China’s real estate is still at a very preliminary stage. The marketplace is so colossal that there are no precedents, no simple models.

    Yet the prospects for a robust growth remain intact. The key will be not to allow that growth to become threatened by a property bubble – while providing affordable housing for the rapidly-expanding new middle-class.

    Dr. Dan Steinbock is Research Director of International Business at India, China and America Institute (USA) and Senior Fellow at Shanghai Institutes for International Studies (China). The brief is part of the author’s ongoing project on emerging megapolises worldwide. A highly abbreviated version of the brief has been published by China Daily, China’s leading English-language daily in May.

    Photos and Illustrations: Dan Steinbock and China’s National Bureau of Statistics

  • Decentralized Growth and “Interstate” Highways in China

    Andrew Batston of The Wall Street Journal writes of China’s decentralization, with the growing employment in interior urban areas. Until the last decade, most of China’s spectacular urban population and employment growth had occurred on the East Coast, especially in the world’s largest megaregions of the Pearl River Delta (Hong Kong-Shenzhen-Dongguan-Guangzhou-Foshan-Jiangmin-Zhongshan-Zhuhai-Macao), the Yangtze Delta (Ningbo-Shaoxing-Hangzhou-Shanghai-Suzhou-Wuxi-Changzhou-Nangjing) and Beijing-Tianjin. Millions of migrant workers had traveled to the East Coast from the interior to take jobs paying far more than they could earn at home.

    But that has changed. Industrial production and jobs have expanded substantially in the interior, making it possible for people to take jobs closer to home, in Chongqing, Chengdu, Xian, Changsha, Wuhan, Shenyang, Taiyuan and many more urban areas. This is a fortuitous development, because the mega-regions are already sufficiently populated and could have well grown far larger if the interior development had not taken place.

    However, jobs have become more plentiful in the interior. China’s growing US interstate standard expressway (freeway) system has been an important contributor to this development. Like the US system, there are no grade crossings and all roadways have at least two lanes of traffic in each direction.

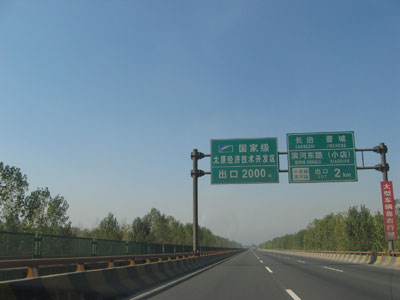
    Now, a number of interior urban areas are now within a day’s truck drive of the East Coast ports and those that are not are within two days. According to China Daily, the 65,000 kilometers (over 40,000 miles) of the national expressway system is open. This does not include extensive provincially administered systems, such as in Beijing, where four full freeway ring roads are open and a fifth is at least half complete (Beijing has six ring roads, but the first is not a freeway). Shanghai has an extensive locally administered freeway system, as do some other urban areas.

    By comparison, the US interstate system is approximately 46,000 miles (this excludes 1,000 miles of 2-lane interstate designated conventional highway in Alaska), and a total of 57,000 miles including non-interstate freeways. China is expected to displace the United States in freeway mileage by the end of the decade, when plans call for more than 60,000 miles.

    Photograph: National Expressway Route G-040 near Taiyuan, Shanxi

  • Time to Dismantle the American Dream?

    For some time, theorists have been suggesting that it is time to redefine the American Dream of home ownership. Households, we are told, should live in smaller houses, in more crowded neighborhoods and more should rent. This thinking has been heightened by the mortgage crisis in some parts of the country, particularly in areas where prices rose most extravagantly in the past decade. And to be sure, many of the irrational attempts – many of them government sponsored – to expand ownership to those not financially prepared to bear the costs need to curbed.

    But now the anti-homeowner interests have expanded beyond reigning in dodgy practices and expanded into an argument essentially against the very idea of widespread dispersion of property ownership. Social theorist Richard Florida recently took on this argument, in a Wall Street Journal article entitled “Home Ownership is Overvalued.”

    In particular, he notes that:

    The cities and regions with the lowest levels of homeownership—in the range of 55% to 60% like L.A., N.Y., San Francisco and Boulder—had healthier economies and higher incomes. They also had more highly skilled and professional work forces, more high-tech industry, and according to Gallup surveys, higher levels of happiness and well-being. (Note)

    Florida expresses concern that today’s economy requires a more mobile work force and is worried that people may be unable to sell their houses to move to where jobs can be found. Those who would reduce home ownership to ensure mobility need lose little sleep.

    The Relationship Between Household Incomes and House Prices

    It is true, as Florida indicates, that house prices are generally higher where household incomes are higher. But, all things being equal, there are limits to that relationship, as a comparison of median house prices to median house prices (the Median Multiple) indicates. From 1950 to 1970 the Median Multiple averaged three times median household incomes in the nation’s largest metropolitan areas. In the 1950, 1960 and 1970 censuses, the most unaffordable major metropolitan areas reached no higher than a multiple of 3.6 (Figure).

    This changed, however, in some areas after 1970, spurred by higher Median Multiples occuring in California.

    William Fischel of Dartmouth has shown how the implementation of land use controls in California metropolitan areas coincided with the rise of house prices beyond historic national levels. The more restrictive land use regulations rationed land for development, placed substantial fees on new housing, lengthened the time required for project approval and made the approval process more expensive. At the same time, smaller developers and house builders were forced out of the market. All of these factors (generally associated with “smart growth”) propelled housing costs higher in California and in the areas that subsequently adopted more restrictive regulations (see summary of economic research).

    During the bubble years, house prices rose far more strongly in the more highly regulated metropolitan areas than in those with more traditional land use regulation. Ironically many of the more regulated regions experienced both slower job and income growth compared to more liberally regulated areas, notably in the Midwest, the southeast, and Texas.

    Home Ownership and Metropolitan Economies

    The major metropolitan areas Florida uses to demonstrate a relationship between higher house prices and “healthier economies” are, in fact, reflective of the opposite. Between August 2001 and August 2008 (chosen as the last month before 911 and the last month before the Lehman Brothers collapse), Bureau of Labor Statistics data indicates that in the New York and Los Angeles metropolitan areas, the net job creation rate trailed the national average by one percent. The San Francisco area did even worse, trailing the national net job creation rate by 6 percent, and losing jobs faster than Rust Belt Pittsburgh, St. Louis, and Milwaukee.

    Further, pre-housing bubble Bureau of Economic Analysis data from the 1990s suggests little or no relationship between stronger economies and housing affordability as measured by net job creation. The bottom 10 out of the 50 largest metropolitan areas had slightly less than average home ownership (this bottom 10 included “healthy” New York and Los Angeles). The highest growth 10 had slightly above average home ownership (measured by net job creation). Incidentally, “healthy” San Francisco also experienced below average net job creation, ranking in the fourth 10.

    Moreover, housing affordability varied little across the categories of economic growth (Table).

    Net Job Creation, Housing Affordability & Home Ownership
    Pre-Housing Bubble Decade: Top 50 Metropolitan Areas (2000)
    Net Job Creation: 1990-2000 Housing Affordability: Median Multiple (2000) Home Ownership: Rate 2000
    Lowest Growth 10  7.4%                                2.8 62%
    Lower Growth 10 14.9%                                3.1 63%
    Middle 10 22.8%                                3.2 64%
    Higher Growth 10 30.9%                                2.6 61%
    Highest Growth 10 46.9%                                2.9 63%
    Average 24.7%                                2.9 62%
    Calculated from Bureau of the Census, Bureau of Economic Analysis and Harvard Joint Housing Center data.
    Metropolitan areas as defined in 2003
    Home ownership from urbanized areas within the metropolitan areas.

    Home Ownership and Happiness

    If Gallup Polls on happiness were reliable, it would be expected that the metropolitan areas with happier people would be attracting people from elsewhere. In fact, people are fleeing with a vengeance. During this decade alone, approximately one in every 10 residents have left for other areas.

    • The New York metropolitan area lost nearly 2,000,000 domestic migrants (people who moved out of the metropolitan area to other parts of the nation). This is nearly as many people as live in the city of Paris.
    • The Los Angeles metropolitan area has lost a net 1.35 million domestic migrants. This is more people than live in the city of Dallas.
    • The San Francisco metropolitan area lost 350,000 domestic migrants. Overall, the Bay Area (including San Jose) lost 650,000, more people than live in the cities of Portland or Seattle.

    Why have all of these happy people left these “healthy economies?” One reason may be that so many middle income people find home ownership unattainable is due to the house prices that rose so much during the bubble and still remain well above the historic Median Multiple. People have been moving away from the more costly metropolitan areas. Between 2000 and 2007:

    • 2.6 million net domestic migrants left the major metropolitan areas (over 1,000,000 population) with higher housing costs (Median Multiple over 4.0).
    • 1.1 net domestic migrants moved to the major metropolitan areas with lower house prices (Median Multiple of 4.0 or below).
    • 1.6 million domestic migrants moved to small metropolitan areas and non-metropolitan areas (where house prices are generally lower).

    An Immobile Society?

    Florida’s perceived immobility of metropolitan residents is curious. Home ownership was not a material barrier to moving when tens of millions of households moved from the Frost Belt to the Sun Belt in the last half of the 20th century. During the 2000s, as shown above, millions of people moved to more affordable areas, at least in part to afford their own homes.

    Under normal circumstances (which will return), virtually any well-kept house can be sold in a reasonable period of time. More than 750,000 realtors stand ready to assist in that regard.

    Of course, one of the enduring legacies of the bubble is that many households owe more on their houses than they are worth (“under water”). This situation, fully the result of “drunken sailor” lending policies, is most severe in the overly regulated housing markets in which prices were driven up the most. Federal Reserve Bank of New York research indicates that the extent of home owners “under water” is far greater in the metropolitan markets that are more highly restricted (such as San Diego and Miami) and is generally modest where there is more traditional regulation, such as Charlotte and Dallas (the exception is Detroit, caught up in a virtual local recession, and where housing prices never rose above historic norms, even in the height of the housing bubble). Doubtless many of these home owners will find it difficult to move to other areas and buy homes, especially where excessive land use regulations drove prices to astronomical levels.

    Restoring the Dream

    There is no need to convince people that they should settle for less in the future, or that the American Dream should be redefined downward. Housing affordability has remained generally within historic norms in places that still welcome growth and foster aspiration, like Atlanta, Dallas-Fort Worth, Houston, Indianapolis, Kansas City, Columbus and elsewhere for the last 60 years, including every year of the housing bubble. Rather than taking away the dream, it would be more appropriate to roll back the regulations that are diluting the purchasing power and which promise a less livable and less affluent future for altogether too many households.

    Note. Among these examples, New York is the largest metropolitan area in the nation. Los Angeles ranks number 2 and San Francisco ranks number 13. The inclusion of Boulder, ranked 151st in 2009 seems a bit curious, not only because of its small size, but also because its advantage of being home to the main campus of the University of Colorado. Smaller metropolitan areas that host their principal state university campuses (such as Boulder, Eugene, Madison or Champaign-Urbana) will generally do well economically.

    Photograph: New house currently priced at $138,990 in suburban Indianapolis (4 bedroom, 2,760 square feet). From http://www.newhomesource.com/homedetail/market-112/planid-823343

    Wendell Cox is a Visiting Professor, Conservatoire National des Arts et Metiers, Paris. He was born in Los Angeles and was appointed to three terms on the Los Angeles County Transportation Commission by Mayor Tom Bradley. He is the author of “War on the Dream: How Anti-Sprawl Policy Threatens the Quality of Life.

  • L.A.’s Economy Is Not Dead Yet

    “This is the city,” ran the famous introduction to the popular crime drama Dragnet. “Los Angeles, Calif. I work here.” Of course, unlike Det. Sgt. Joe Friday, who spoke those words every episode, I am not a cop, but Los Angeles has been my home for over 35 years.

    To Sgt. Friday, L.A. was a place full of opportunities to solve crimes, but for me Los Angeles has been an ideal barometer for the city of the future. For the better part of the last century, Los Angeles has been, as one architect once put it, “the original in the Xerox machine.” It largely invented the blueprint of the modern American city: the car-oriented suburban way of life, the multi-polar metropolis around a largely unremarkable downtown, the sprawling jumble of ethnic and cultural enclaves of a Latin- and Asian-flavored mestizo society.

    Yet right now even the most passionate Angeleno struggles to feel optimistic. A once powerful business culture is sputtering. The recent announcement of Northrop Corp.’s departure to suburban Washington was just the latest blow to the region’s aerospace industry, long our technological crown jewel. The area now has one-fourth as many Fortune 500 companies as Houston, and fewer than much-smaller Minneapolis or Charlotte, N.C.

    Other traditional linchpins are unraveling. The once thriving garment industry continues to shift jobs overseas and has lost much of its downtown base to real estate speculators. The port, perhaps the region’s largest economic engine, has been mismanaged and now faces severe threats from competitors from the Pacific Northwest, Baja, Calif., and Houston. Although television and advertising shoots remain strong, the core motion picture shooting has been declining for years, with production being dispersed to such locations as Toronto, Louisiana, New Mexico, Michigan, New York and various locales overseas.

    Once a reliable generator of new employment, over the past decade L.A. has fared worse than any of the major Sun Belt metros–including hard-hit Phoenix–losing over 167,000 jobs between 2000 and 2009. Historic rival New York notched modest gains, while the rising big metro competitors, Dallas and Houston, enjoyed strong and steady growth. L.A. may not be Detroit, and probably never will be, but its once proud and highly diversified industrial base is eroding rapidly, losing one-fifth of all its employment since 2004. In contrast to the rest of the country, unemployment still continues to rise.

    To give you an idea how much L.A. has sunk, look to this year’s Forbes best city rankings, which measures both short- and mid-term job growth. Once perched in the upper tier of major cities, Los Angeles now ranks a pathetic 59th out of 66 large metro areas, far below not only third-place Houston and fourth-place Dallas but also New York and even similar job-losing giants like San Francisco and Philadelphia.

    It takes a kind of talent to sink this low given L.A.’s vast advantages: the best weather of any major global city, the largest port on this side of the Pacific, not to mention the glamour of Hollywood, the Lakers and one of the world’s largest and most diverse populations of creative, entrepreneurial people.

    Jose de Jesus Legaspi, a prominent local developer, pins much of the blame for this on what he describes as “a parochial political kingdom”–with Antonio Villaraigosa, mayor since 2005, wearing the tinsel crown. A sometimes charming pol utterly bereft of economic acumen, Villaraigosa is a poor manager who is also highly skilled at self-promotion. His idea of building an economy revolves around subsidizing downtown developers and pouring ever more funds into the pockets of public sector workers. No surprise then that L.A. suffers just about the highest unemployment rate of any of the nation’s 10 largest cities outside Detroit. One in five county residents receive some form of public aid.

    But the real power in L.A. today is not so much Villaraigosa but what the Los Angeles Weekly describes as a “labor-Latino political machine,” whose influence extends all the way to Sacramento. These politicians represent, to a large extent, virtual extensions of the unions, particularly the public employees.

    The rise of the Latino-labor coalition does stir some pride among Hispanics, but it has proved an economic disaster for almost everyone who doesn’t collect a government paycheck–L.A.’s city council is the nation’s highest paid–or subsidy. Although perhaps not as outrageously corrupt as the Chicago machine, it is also not as effective. L.A.’s version manages to be both thuggish and incompetent.

    According to an analysis by former Mayor Richard Riordan, the city’s soaring pension liabilities will grow by an additional $2.5 billion by 2014, by which date the city will probably be forced to declare bankruptcy.

    So is the city of the future doomed for the long term? Not necessarily. Although Latino politicians and “progressive” allies strive to derail entrepreneurialism, our grassroots remains stubbornly entrepreneurial. This is particularly true of Latino and other immigrant businesspeople in Los Angeles. In 2006, for example, roughly 10% of the foreign born population was self-employed, almost twice the percentage of the native born.

    To be sure, much of this activity takes place in smaller area municipalities–Burbank, Glendale, Lynwood, Monterey Park–that are mercifully outside the reach of the City of Los Angeles, which accounts for somewhat less than half of L.A. County’s 10 million people. But as Legaspi, who came to L.A. from Zacatecas, Mexico, in 1965, points out, ethnic enterprises–Armenian, Iranian, Israeli, Korean, Chinese as well as Mexican and Salvadoran–continue to thrive even within the city limits. You rarely find in L.A. the kind of desolation found in dying cities like Detroit or Cleveland or even large swaths of New York or Chicago.

    All this suggests there’s still hope for Los Angeles to blossom further as a hub for international trade, global culture and fashion. But to achieve that goal the city needs a government that will nurture its grassroots rather than stomp or extort them. “Los Angeles is a potential great world city, but it needs to be ruled like a world city,” Legaspi points out. Until that happens, our putative city of the future will exist more as dreamscape than reality.

    This article originally appeared in Forbes.com.

    Joel Kotkin is executive editor of NewGeography.com and is a distinguished presidential fellow in urban futures at Chapman University. He is author of The City: A Global History. His newest book is The Next Hundred Million: America in 2050, released in Febuary, 2010.

    Photo by k.landerholm

  • The Declining Human Footprint

    There are few more bankrupt arguments against suburbanization than the claim that it consumes too much agricultural land. The data is so compelling that even the United States Department of Agriculture says that “our Nation’s ability to produce food and fiber is not threatened” by urbanization. There is no doubt that agricultural production takes up less of the country’s land than it did before. But urban “sprawl” is not the primary cause. The real reason lies in the growing productivity of American farms.

    Since 1950, an area the size of Texas plus Oklahoma (or an area almost as large as France plus Great Britain) has been taken out of agricultural production in the United States, not including any agricultural land taken by new urbanization (Note 1). That is enough land to house all of the world’s urban population at the urban density level of the United Kingdom.

    America’s Spectacular Agricultural Productivity

    Even with less land, agriculture’s performance has been stunning. According to US Department of Agriculture data, US farm output rose 160% between 1950 and 2008. Productivity per acre rose 260%. In particular , California’s farms – often cited as victims of sprawl – have done quite well. Between 1960 and 2004 (Note 2), the state’s agricultural productivity rose 2.3% annually and 3.0% per acre. By comparison national agricultural productivity rose less over the same period at 1.7% overall and 2.2% per acre.

    According to the United States Department of Agriculture, from 1990 to 2004 (latest data), California’s agricultural production rose 32% and on less farm land.

    Of course, there has been substantial reduction of farmland close to some metropolitan areas, but overall the impact of urbanization nationally has not been substantial. For example, since 1950:

    In addition, the nation’s agriculture is subsidized to the tune of more than $15 billion annually, which is strong evidence that more land is being farmed than is required. Subsidies increase the supply of virtually anything beyond its underlying demand. This can be illustrated by imagining how much less transit service there would be if it were not 80% subsidized. Suffice it to say, America is not threatened by “disappearing farmland.”

    America has less farmland because it has not needed as much as before to serve its customers. Thus, considerable farmland has been returned to a more natural state. Generally, this has got to be good for the environment. Land that is left to nature does not require fertilization, for example. The same interests that have frequently claimed that farmland has been disappearing also decry the loss of open space. In fact, the withdrawal of redundant farmland has produced considerable open space – call it open space sprawl.

    Repeat it Often Enough….

    None of this has kept “disappearing farmland” from being a rallying cry among those who would construct Berlin Walls around the nation’s urban areas. Yet the extent to which Bonnie Erbe of Politics Daily and National Public Radio embraced the fiction was surprising. Her “Vanishing Farmland: How It’s Destabilizing America’s Food Supply,” was accompanied by “meant to indict” photograph of farm equipment next to new suburban housing.

    Ms. Erbe’s principal source was a web page from the American Farmland Trust, which seeks to conserve farm land. In its California Agricultural Land Loss & Conservation: The Basic Facts, the American Farmland Trust argues for more “efficient” (i.e. denser) urbanization and claims that, “One-sixth…” (17%) “… of the land urbanized since the Gold Rush … has been developed since 1990.” That might be an impressive figure, if it were not that the state has added 7 million urban residents since 1990, which is one-fourth (25%) of all the urban population added since the Gold Rush and equal to the 1990 population of New York City.

    It is worth noting that California has agricultural preservation measures already in place for farm owners and, finally, that no one can compel an unwilling farm owner to sell their land to a developer or anyone else (except perhaps a government agency through eminent domain).

    In California, as elsewhere in the nation, urbanization has not been the principal cause of farm land reduction. According to the US Census of Agriculture, farmland declined in California from 2002 to 2007 by 2.2 million acres. That 5 year reduction in farmland is approximately equal to the expansion of all California urban areas over the 50 years between 1950 and 2000.

    Most Development is Not Urban

    In the same document, the American Farmland Trust indicates support for the radical urban land regulations. Policies such as in Sacramento’s Blueprint that raise significantly inflate the price of land, make housing less affordable. The agricultural, property and urban planning interests who would ration land for people and their houses have missed a larger targets such as ultra-low density “ranchettes” favored by a small wealthy minority who live in the country, but are not farmers.
    According to the US Department of Agriculture, rural, large lot residential development (non-agricultural) covered 40% more land than all of the nation’s urbanization in 2000. These parcels represent “scattered single houses on large parcels, often 10 or more acres in size.” Further, since 1980, the increase in this rural residential development has been one-third greater than the land area occupied by all of the urban areas in the nation with more than 1,000,000 population.

    Finally, if there is a serious threat to agriculture, it is from over-zealous regulation that has put farmers at risk. Water reductions in the San Joaquin Valley – mostly the result of environmental demands – likely have taken more land out of production than any sprawl-happy developer.

    Declining Human Footprint: An International Phenomenon

    The human footprint, as measured by the total urban and agricultural land has been declining for decades, both in the nation and California, where the greatest growth has occurred (Figure 1 & 2). The same is also true of Europe (EU-15), Canada and Australia, where all of the urbanization since the beginning of time does not equal the agricultural land recently taken out of production. Even in Japan, the human footprint has been reduced. It may be surprising, but human habitation and food production has returned considerable amounts of land to a more natural state in recent decades, while America’s urban areas were welcoming 99% of all growth since 1950.


    Note 1: This assumption represents the worst case, since not all land on which new urbanization was developed had previously been farmed.

    Note 2: State data is available only between 1960 and 2004.

    Photograph: Metropolitan Chicago, 2007 (Grundy County)

    Wendell Cox is a Visiting Professor, Conservatoire National des Arts et Metiers, Paris. He was born in Los Angeles and was appointed to three terms on the Los Angeles County Transportation Commission by Mayor Tom Bradley. He is the author of “War on the Dream: How Anti-Sprawl Policy Threatens the Quality of Life.

  • It is Time to Plant

    It is springtime in Kentucky – think foals and mares in the pristine meticulously fenced pastures. But, in another part of the state – the Appalachia region of eastern Kentucky – it is time to plant on those rocky hillsides. As my 90 year old father puts it, you plant your corn when tree buds are the size of squirrel ears. I confess to not having given a thought to whether squirrels even have ears or not … but my father knows. He was born and raised in a part of the world where they know things like that, typical of the mostly Scots-Irish who settled there. He knows the land like the back of his hand, he is self-reliant and stubborn to a fault and he knows what it is like to be poor and bereft of opportunity.

    Appalachia Eastern Kentucky – take just one geographic area out of a huge region spread over several states – is negatively depicted in popular imagery and academic literature as a drag on the Kentucky economy. The whole region is enigmatic like the underachieving child in a family of superstars. Until now, that is. With the financial collapse having brought America to her knees, it is a bit like the screaming headline about Toyota’s debacle: “the A student flunked the class.” Perhaps that underachieving C student finally has her chance to shine. After all, who would have given Ford a chance a few years ago?

    But Appalachian eastern Kentucky is after all a land where every manner of program has been tried, books written, studies undertaken, and mournful music sung. It is where the failed War on Poverty was launched in the 1960s. The reason for a “new day dawning” is that there is a stir across the land that signaling an epochol shift in the evolution of the American Dream. Call it by wonky titles like “new localism” or call it “choosing who I want to be and where I want to do it.” But whatever it is, it is impacting on our lives dramatically and will do more so in the future.

    The prestigious Economist Magazine (May 15, 2010) recently reflected that in the future people will have unprecedented choices of living in big vibrant cities or in smaller more nurturing rural settings. And, the stories abound. Take Patty who left the factories of the north to return to her native land. Always known for her shrewd business acumen, she took over and renovated “The Old Schoolhouse” antique gallery located near Cave Run Lake. She scours the region for her “goods” and is visited daily by weary travelers seeking the authenticity of a culture too long locked in the shadow of conventional definitions of success. Likewise, despite the long held belief that they are leaving, young people are finding ways to stay in the region, such as the young man in a recent audience who has taken advantage of “tele-learning” and plying his trade as a graphic artist for a west coast software company.

    There appears to be a convergence of forces at work that could prove transformational for regions like Appalachia. Brought on by the Great Recession, people have to make choices about their priorities and perhaps even to downsize lifestyle appetites. But that’s not all. These forces will impact all places but particularly rural places like Kentucky, places of great beauty and tranquility and appeal waiting for the right moment that may finally be here.

    These converging forces are driven in large part by technology and the realization of its earlier promise that we truly can live and work anywhere. It is about participating in the preservation of a precious culture locked for too long in the closet of neglect and stigmatized with the label of backwardness. It is about an ability to do more than scrape out a meager living in the rocky hillsides. Evidence can be seen in a migration pattern that is, for the first time in decades, giving Kentucky and surrounding states a positive net migration from the rest of the country. We are seeing youthful retirees coming home in some instances and young families putting down roots in places that feel right for their chosen way of life. And there is a growing business culture that knows about the world but sees no paradox in growing itself in Appalachian soil – and using the culture to its advantage.

    Just take note of Kentucky “ham” country if you want to partake of successful business stories. Recently profiled in the New York Times Magazine (May 23, 2010), Kentucky’s home grown hams are making their way onto the world stage. The author marveled at the ham store owner’s chatter about attending a ham conference in Spain and the desire of buyers to travel to a small town to buy nitrate free bacon. Imagining Kentucky hams being worth a wait in noisy New York City restaurants defies explanation except to acknowledge that the song is right that “somethin’s happenin’ here.”

    What must the Appalachian region of eastern Kentucky and the rest of Appalachia do to take advantage of this new opportunity? It must reinvent itself as with many other aspects of the American Dream under the new rules of the 21st century. Reinvention will require answering the question “what is success”? With extreme partisanship and 30,000 foot politics at other levels of government, it is no longer viable to look in the direction of the “higher ups.” We must look to ourselves. Only we can provide the basis for community building and ensure the investments we need to make in health and education.

    Ah, springtime. Nature has taught us well; re-invention is to see the possible and to seize the moment. The moment is now.

    Sylvia Lovely is an author, commentator and speaker on issues relating to communities and how we must adapt to the new landscape that is the 21st century.

    Photo by J. Stephen Conn.

  • Can Europe’s Economy Turn Around If Its Great Cities Continue To Wither?

    Europe’s Greece crisis has turned the world’s attention to the continent’s fundamental flaw: burgeoning public spending and sluggish growth in some of its national economies.

    To the extent that Europe’s more economically fragile countries cannot fix this flaw, Europe poses a global financial risk as toppling EU countries cannot meet their obligations and those left standing cannot prop them up. Only fiscal discipline and boosting growth can save Europe in the long-run.

    And for this reason, we ought to worry about Europe’s cities. Why? Because as large cities increasingly drive national economies in our rapidly urbanizing global community, Europe’s urban growth patterns look alarmingly tepid.

    Around the world, people are clustering together faster than ever at a time when it seems technology should allow them to disperse more easily than ever. As it turns out, innovation and a growing services sector flourish best when lots of people and firms are geographically proximate. Ideas, knowledge and valuable skills are transferred more easily in denser areas.

    There is a direct relationship between economic competitiveness in the 21st century and the growth of metropolitan areas. But Europe’s cities show signs of trouble. They have almost entirely lost the momentum that has driven European pre-eminence for the past 200 years.

    In 1800, only 3% of the world’s population lived in urban areas, and the only Western cities among the world’s 10 largest urban areas were London and Paris. Neither had a population greater than 1 million. Just 100 years later, though, nine of the world’s 10 largest cities were in the West — with four of the top six located in Europe, propelled by their economic predominance through industrialization.

    Other countries followed the model. By the mid-20th century, 30% of the world’s population lived in urban areas, a considerable increase since 1800. But that was only the beginning of an explosive era in urbanization. Between 1960 and 2000, the number of people living in cities worldwide skyrocketed to 3 billion from 750 million.

    Currently, the world’s largest 100 cities generate 25% of global GDP, a figure that will continue to rise over the next few decades — and which will increasingly exclude Europe’s cities.

    Asia and Africa, often regarded poetically as agrarian societies, are leading the global urbanization boom. Today, London is the only European city among the world’s largest 20 metropolitan areas. Paris is 22nd. Among the top 25 cities, they are two of the three slowest-growing areas.

    Late-20th century growth has been driven almost entirely by suburban expansion around core cities. Nevertheless, central cities worldwide have added population on average over the past half century — except in Europe. It is the only continent where core cities have lost population over the past 45 years. While its suburban growth has kept its metropolitan areas growing overall, its net urbanization rate since 1965 is the slowest worldwide.

    Because developed countries are already highly urbanized, their metropolitan areas grow more slowly than those in emerging economies. But Europe’s rate is unusually slow compared to its peer group of developed nations.

    Europe’s main metropolitan areas grew just 28% since 1965, a period during which the United States essentially doubled its urban population. Australia and New Zealand have seen urbanization rates of 90% during the same period. Worldwide, the growth average in urban areas has been 135% since 1965.

    Europe is the only continent with cities growing at less than 1% annually. In Eastern Europe, the growth rate is actually negative. Some cities, such as Munich and Warsaw, have grown at respectable rates and mitigate Europe’s well-known population decline problems. For instance, each city grew between 2000 and 2010, while Germany and Poland each contracted as a whole.

    However, urban growth rates in Europe will likely stay low in coming years, which raises questions about whether Europe’s economy will continue to grow enough to help the continent out of its present troubles.

    European leaders’ disconnect with this important reality was on display several weeks ago when the European Commission chose to announce major carbon emissions in 500 cities at the same time its finance ministers were structuring the massive Greece bailout.

    However important greening urban areas may be, if Europe should be doing anything with its cities these days, it should be figuring out how to put them at the forefront of its economic recovery. The European habit of implementing growth-inhibiting policies — especially in its cities — has to change if the continent hopes to have a prosperous future.

    Given the increasingly metropolitan nature of economic growth around the globe, the health and vitality of Europe’s cities will be key to the continent’s future prosperity. Policymakers need now more than ever to ask serious questions about the origins of future growth. To answer those questions, they need to pay serious attention to their cities.

    This article first appeared at Investors Business Daily.

    Ryan Streeter is a senior fellow at the London-based Legatum Institute, an independent, nonpartisan organization that researches and advocates an expansive understanding of global prosperity.

  • The Suburban Exodus: Are We There Yet?

    For many years, critics of the suburban lifestyles that most Americans (not to mention Europeans, Japanese, Canadians and Australians) prefer have claimed that high-density housing is under-supplied by the market. This based on an implication that the people increasingly seek to abandon detached suburban housing for higher density multi-family housing.

    The Suburbs: Slums of the Future?

    The University of Utah’s Arthur C. (Chris) Nelson, indicated in an article (entitled “Leadership in a New Era“) in the Journal of the American Planning Association. that in 2003, 75% of the housing stock was detached and 25% was attached, including townhouses, apartments, and condominiums. By 2025 he predicts that only 62% of consumer will favor detached homes, (Note 1). He also predicts a major shift in consumer preferences from housing on large lots (defined as greater than 1/6th of an acre) to smaller lots (Note 2). This, he suggests, would create a surplus of 22 million detached houses on large lots.

    This predication is largely made on the basis of “stated preference” surveys which the author, Dr. Emil Malizia of the University of North Carolina (commenting on the article in the same issue), and others indicate may not accurately reflect the choices that consumers will actually make. Dr. Nelson’s article has been widely quoted, both in the popular press and in academic circles. It has led some well-respected figures such as urbanist and developer Christopher Leinberger to suggest in an Atlantic Monthly article that “many low-density suburbs and McMansion subdivisions, including some that are lovely and affluent today, may become what inner cities became in the 1960s and ’70s—slums characterized by poverty, crime, and decay.”

    The Condo Market Goes Crazy

    Misleading ideas sometimes have bad consequences. The notion that suburbanites were afflicted with urban envy led many developers to throw up high-rise condominiums in urban districts across the country. Sadly for these developers, the Suburban Exodus never materialized, never occurred. As a result, developers have lost hundreds of millions, if not billions of dollars and taxpayers or holders of publicly issued bonds could be left “holding the bag” (see discussion of Portland, below).

    This weakness has been seen even in the nation’s strongest condominium market, New York City, where one developer offered to pay purchaser’s mortgages, condominium fees and real estate taxes for a year as well as closing costs.

    But the damage is arguably worse in other major markets which lack the amenities and advantages of New York.

    Take, for example, Raleigh (North Carolina), where low density living is the rule (the Raleigh urban area is less dense than Atlanta). The News and Observer reports that the largest downtown condominium building (the Hue) “considered a bold symbol of downtown Raleigh’s revitalization,” has closed its sales office and halted all marketing efforts. The development’s offer of a free washing machine, dryer, refrigerator, and parking space were not enough to entice suburbanites away from the neighborhoods they were said to be so eager to leave.

    This is not an isolated instance. Around the nation, condominium prices have been reduced steeply to attract buyers. New buildings have gone rental, because no one wanted to buy them. Other buildings have been foreclosed upon by banks; and units have been auctioned. Planned developments have been put on indefinite hold or cancelled.

    Miami: Of Little Dubai and Cadavers

    Miami’s core neighborhood (downtown and Brickell, immediately to the south) has experienced one of the nation’s most robust condominium building booms. More than 22,000 condominium high rise units were built between 2003 and 2008. Miami could well have more 50-plus story condominium towers than any place outside Dubai.

    As a result, Miami has suffered perhaps the most severe condominium bust in the nation. According to National Association of Realtors data, the median condominium price in the Miami metropolitan area has dropped 75% from peak levels (2007, 2nd Quarter). By comparison, the detached housing decline in the metropolitan area was 50%; the greatest detached housing price decreases among major metropolitan areas were from 52% to 58% (Riverside-San Bernardino, Sacramento, San Francisco and Phoenix).

    The most recent report by the Miami Downtown Development Authority indicates that 7,000 units still remain unsold. The Brickell area is home to the greatest concentration and largest buildings and has the highest ratio of unsold units at 40%.

    Icon Brickell (see photograph above) may be the largest development in the core. Icon Brickell consists of three towers, at 58, 58 and 50 floors and a total of nearly 1,800 units. Despite opening in 2008 and offering discounts of up to 50%, barely one-third (approximately 620) of the units have been sold, according to the Daily Business Review, which also reported on May 13 that the developer had transferred control of two of the towers to construction lenders.

    One building, Paramount Bay, was referred to by The New York Times as a “47-story steel and glass cadaver” with a lobby “like a mortuary.” A real estate site indicates that only one of the buildings 350 units has been sold.

    More recently sales have inched up in the core but due not to any suburban exodus. According to The Miami Herald, huge discounts that have lured Europeans, Canadians, and Latin Americans to the core. The real estate and consulting firm Condo Vultures notes that more than 1,000 of the sales are to a few bulk buyers, a market segment some might refer to as “speculators.”

    The latest data from the US Bureau of the Census confirms that there is no fundamental shift away from detached housing in the Miami area, as housing trends point toward more detached housing. In 2000, 48.1% of residents in the Miami metropolitan area lived in detached housing. By 2008, the figure had risen to 49.2% (Figure 1). Essentially, the Suburban Exodus remains a mirage.

    Portland: Gift Certificates for Distressed Developers

    If developer greed was the motive in Miami, government subsidies have been the driving force in Portland. The city of Portland will soon have issued nearly $450 million in urban renewal bonds, provides 10-year tax property tax forgiveness, and reduced development fees, which the Portland Development Commission (PDC) has called “gift certificates” for developers (Note 3).

    Gift certificates have not been enough to cure Portland’s sickly downtown condominium market. The Oregonian reported that prices were down, on average, 30% over the year ended the first quarter of 2010. Remarkably prices in the much ballyhooed Pearl District are plummeting even more than those in the rest of the Portland area. According to DQ News, the median sale price of a house in the Pearl District dropped four times the average in Multnomah County and an even greater six times decline relative to suburban counties over the past year.

    There is more. Just this year, the Pearl District has seen its Eddie Bauer, Adidas, and Puma stores close.

    One condominium building the Encore, is reported to have sold only 17 of 177 units. A recent auction of units at the largest building in the city, the John Ross brought prices “far below the replacement cost” according to The Oregonian’s Ryan Frank, who noted that “it will likely be years before there’s a new high-rise condo built.” Late last year, the Pearl District’s Waterfront Pearl was reported to have sold only 31% of its units and had not sold a unit for a year.

    The Portland Development Commission itself has become part of the condominium bust story. PDC had indicated it was considering relocating its offices to a new 32-story mixed use tower (Park Avenue West), which was to have included condominiums, offices, and retail stores. For more than a year, the proposed 32-story tower has been an unsightly hole in the ground, with construction suspended. PDC decided to stay put in its older, less expensive offices. Even before PDC decided not to locate in Park Avenue West, the developers eliminated the plans for 10 floors of condominiums, doubtless because it made no economic sense to add to an already flooded market.

    In Portland, like in Miami, the fact remains that suburbia has not been abandoned. Despite the high density over-building in the Pearl District and elsewhere in the core, detached housing has become even more popular in the region. According to data from the Bureau of the Census, the share of households living in detached housing in the Portland metropolitan area rose from 63.7% in 2000 to 64.5% in 2008 (Figure 2).

    High-Rise Condos: Slums of the Future?

    To say that the high-rise condominium market has fallen on hard times would be an understatement. The condo bust in New York has become so acute that Right to the City, a coalition of community organizations has called upon “the City to acquire the tax delinquent buildings through tax foreclosure and convert vacant units into permanently affordable housing for low-income New Yorkers.” In a report entitled People without Homes and Homes without People: A Count of Vacant Condos in Select NYC Neighborhoods, Right to the City points out that there are more than 4,000 empty condo units in 138 buildings, with owners delinquent on nearly $4 million in taxes to the city.

    Owners of new condominiums around the nation who paid pre-bust prices for their units may not be inclined to stay around if they are surrounded by less affluent renters who have been attracted by desperate building owners and lenders.

    Are these dark towers of discounting the slums of tomorrow? Only the data and time will tell and it’s too early to know, but preliminary findings show little of the predicted shift toward higher density living (Figure 3). Certainly national data indicates, if anything, a slightly strengthening market for detached, rather than attached housing (Figure 4).

    • Between 2000 and 2008, the share of households living in detached housing rose from 61.4% to 63.5%.

    • A similar trend is shown by the national building permits data. Between 2000 and 2009, 75.2% of residential building permits in the United States were for detached housing. This is up strongly from 69.6% in the 1990s and nearly equals the highest on record (the 1960s), when 77.7% of residential building permits (housing units) were detached houses.


    Looking at the data, there remains little evidence that the stated preferences on which the predictions relied have been translated into the reality of a shift in preferences toward smaller lots in cores or inner ring suburbs. Domestic migration continues to be strongly away from core counties to more suburban counties. Core cities are growing less quickly than suburban areas. Exurban areas are growing faster than central areas, including inner suburbs.

    Clearly, the Suburban Exodus has not begun and there is little reason to believe that it will anytime soon.


    Note 1: In estimating the 2003 share of detached housing (75%), Dr. Nelson uses “one-unit structures” data from the 2003 American Housing Survey Table 2-3. US Bureau of the Census American Housing Survey personnel responded to my request for clarification, indicating that “one-unit structures” includes … single detached housing units, mobile homes, and single attached housing units (such as a townhouse).” Thus the 75% detached estimate is high because it includes mobile homes and single attached housing. As is indicated above, data from the US Bureau of the Census data indicates that the share of detached housing of detached plus attached housing in 2000 was 61.4%. This figure, coincidentally, is virtually the same as the 62% Dr. Nelson predicts for 2025.

    Note 2: The assumption that consumers prefer small lot detached housing may not be sufficiently robust and may even be exaggerated. Dr. Nelson appears to principally rely on research by Myers and Gearin (2001) (in the journal Housing Policy Debate) for concluding that consumers prefer small lot rather than larger lot detached housing, defining small lot development as 1/6th of an acre or less or less than 7,000 square feet. Yet neither figure appears in Myers and Gearin. Moreover, a National Association of Home Builders commenter (also in Housing Policy Debate) questions how its data was characterized by Myers and Gearin in justifying a finding of preference for smaller lots (the survey is unpublished). Without access to the original surveys referenced in Myers and Gearin, it is impossible to judge what respondents may have had in mind as the dividing line between large lots and small lots.

    Note 3: This characterization was on the Portland Development Commission website (accessed January 2, 2007). It was cited in our report, Zero Sum Game: The Austin Streetcar and Development and subsequently removed from the website. A large share of Portland’s urban renewal bonds are insured by Ambac Financial Corporation, which has reported losses exceeding $1 billion in the last two quarters. Ambac indicated that it has “insufficient capital to finance its debt service and operating expense requirements beyond the second quarter of 2011 and may need to seek bankruptcy protection.” Ambac was the insurer of State of Nevada bonds to build the Las Vegas Monorail, which has already entered bankruptcy and is unable to pay its bonds.

    Wendell Cox is a Visiting Professor, Conservatoire National des Arts et Metiers, Paris. He was born in Los Angeles and was appointed to three terms on the Los Angeles County Transportation Commission by Mayor Tom Bradley. He is the author of “War on the Dream: How Anti-Sprawl Policy Threatens the Quality of Life.

    Photo: Icon Brickell, Miami

  • The Future Of America’s Working Class

    Watford, England, sits at the end of a spur on the London tube’s Metropolitan line, a somewhat dreary city of some 80,000 rising amid the pleasant green Hertfordshire countryside. Although not utterly destitute like parts of south or east London, its shabby High Street reflects a now-diminished British dream of class mobility. It also stands as a potential warning to the U.S., where working-class, blue-collar white Americans have been among the biggest losers in the country’s deep, persistent recession.

    As you walk through Watford, midday drinkers linger outside the One Bell pub near the center of town. Many of these might be considered “yobs,” a term applied to youthful, largely white, working-class youths, many of whom work only occasionally or not at all. In the British press yobs are frequently linked to petty crime and violent behavior–including a recent stabbing outside another Watford pub, and soccer-related hooliganism.

    In Britain alcoholism among the disaffected youth has reached epidemic proportions. Britain now suffers among the highest rates of alcohol consumption in the advanced industrial world, and unlike in most countries, boozing is on the upswing.

    Some in the media, particularly on the left, decry unflattering descriptions of Britain’s young white working class as “demonizing a whole generation.” But many others see yobism as the natural product of decades of neglect from the country’s three main political parties.

    In Britain today white, working-class children now seem to do worse in school than immigrants. A 2003 Home Office study found white men more likely to admit breaking the law than racial minorities; they are also more likely to take dangerous drugs. London School of Economics scholar Dick Hobbs, who grew in a hardscabble section of east London, traces yobism in large part to the decline of blue-collar opportunities throughout Britain. “The social capital that was there went [away],” he suggests. “And so did the power of the labor force. People lost their confidence and never got it back.”

    Over the past decade, job gains in Britain, like those in the United States, have been concentrated at the top and bottom of the wage profile. The growth in real earnings for blue-collar professions–industry, warehousing and construction–have generally lagged those of white-collar workers.

    Tony Blair’s “cool Britannia,”epitomized by hedge fund managers, Russian oligarchs and media stars, offered little to the working and middle classes. Despite its proletarian roots, New Labour, as London Mayor Boris Johnson acidly notes, has presided over that which has become the most socially immobile society in Europe.

    This occurred despite a huge expansion of Britain’s welfare state, which now accounts for nearly one-third of government spending. For one thing the expansion of the welfare state apparatus may have done more for high-skilled professionals, who ended up nearly twice as likely to benefit from public employment than the average worker. Nearly one-fifth of young people ages 16 to 24 were out of education, work or training in 1997; after a decade of economic growth that proportion remained the same.

    Some people, such as The Times’ Camilla Cavendish, even blame the expanding welfare state for helping to create an overlooked generation of “useless, jobless men–the social blight of our age.” These males generally do not include immigrants, who by some estimates took more than 70% of the jobs created between 1997 and 2007 in the U.K.

    Immigrants, notes Steve Norris, a former member of Parliament from northeastern London and onetime chairman of the Conservative Party, tend to be more economically active than working-class white Britons, who often fear employment might cut into their benefits. “It is mainly U.K. citizens who sit at home watching daytime television complaining about immigrants doing their jobs,” asserts Norris, a native of Liverpool.

    The results can be seen in places like Watford and throughout large, unfashionable swaths of Essex, south and east London, as well as in perpetually depressed Scotland, the Midlands and north country. Rising housing prices, driven in part by “green” restrictions on new suburban developments, have further depressed the prospects for upward mobility. The gap between the average London house and the ability of a Londoner to afford it now stands among the highest in the advanced world.

    Indeed, according to the most recent survey by demographia.com, it takes nearly 7.1 years at the median income to afford a median family home in greater London. Prices in the inner-ring communities often are even higher. According to estimates by the Centre for Social Justice, unaffordability for first-time London home buyers doubled between 1997 and 2007. This has led to a surge in waiting lists for “social housing”; soon there are expected by to be some 2 million households–5 million people–on the waiting list for such housing.

    With better-paid jobs disappearing and the prospects for home ownership diminished, the traditional culture of hard work has been replaced increasingly by what Dick Hobbs describes as the “violent potential and instrumental physicality.” Urban progress, he notes, has been confused with the apparent vitality of a rollicking night scene: “There are parts of London where the pubs are the only economy.”

    London, notes the LSE’s Tony Travers, is becoming “a First World core surrounded by what seems to be going from a second to a Third World population.” This bifurcation appears to be a reversion back to the class conflicts that initially drove so many to traditionally more mobile societies, such as the U.S., Australia and Canada.

    Over the past decade, according to a survey by IPSOS Mori, the percentage of people who identify with a particular class has grown from 31% to 38%. Looking into the future, IPSOS Mori concludes, “social class may become more rather than less salient to people’s future.”

    Britain’s present situation should represent a warning about America’s future as well. Of course there have always been pockets of white poverty in the U.S., particularly in places like Appalachia, but generally the country has been shaped by a belief in class mobility.

    But the current recession, and the lack of effective political response addressing the working class’ needs, threatens to reverse this trend.

    More recently middle- and working-class family incomes, stagnant since the 1970s, have been further depressed by a downturn that has been particularly brutal to the warehousing, construction and manufacturing economies. White unemployment has now edged to 9%, higher among those with less than a college education. And poverty is actually rising among whites more rapidly than among blacks, according to the left-leaning Economic Policy Institute.

    You can see the repeat here of some of the factors paralleling the development of British yobism: longer-term unemployment; the growing threat of meth labs in hard-hit cities and small towns; and, most particularly, a 20% unemployment rate for workers under age 25. Amazingly barely one in three white teenagers, according to a recent Hamilton College poll, thinks his standard of living will be better than his parents’.

    It’s no surprise then that Democrats are losing support among working-class whites, much like the now-destitute British Labour Party. But the potential yobization of the American working class represents far more than a political issue. It threatens the very essence of what has made the U.S. unique and different from its mother country.

    This article originally appeared in Forbes.com.

    Joel Kotkin is executive editor of NewGeography.com and is a distinguished presidential fellow in urban futures at Chapman University. He is author of The City: A Global History. His newest book is The Next Hundred Million: America in 2050, released in Febuary, 2010.

    Photo by MonkeyBoy69

  • An American History Post 2010: The Great Deconstruction

    There is a great battle brewing – the proverbial paradox of the immovable object versus an irresistible force. The battle lines are drawn. On one side is the Greatest Generation, Americans over 60, middle class and mostly white. Mainstream media calls them The Tea Party and worse.

    On the other side is President Barack Obama and a younger generation of progressive Democrats who see the need for an ever more expansive government. The battlefield is spending and debt. The Greatest Generation, following World War II, bought homes with a 30-year mortgage and 20% down, and paid off those mortgages accumulating trillions in equity along the way. The Credit Card Generation – epitomized by both George W. Bush and his Democratic successor – nurtured the zero down, no doc, adjustable rate mortgage that allowed millions of homebuyers, who could not afford to purchase a home, to buy one. The bursting of the housing bubble cost trillions in lost equity and resulted in 2.8 million foreclosures in 2009.The figures tell the story.

    Spending

    According to the Office of Management & Budget (OMB), Federal spending has grown more than eight times faster than Household Median Income. Since 1970, middle-income Americans’ earnings have risen 29 percent, but federal spending has increased 242 percent (Percentage Change of Inflation-Adjusted Dollars, 2009). The Greatest Generation believes that spending by Washington politicians has grown out of control. They understand it is not a Republican or Democrat issue. They opposed the $800 billion TARP Bailout under Bush as much as Obama’s $800 Stimulus Bill. They opposed the trillion dollar Healthcare Bill recently enacted into law despite a clear majority opposed to its passage. They recognize that Social Security and Healthcare comprise huge unfunded obligations that will be passed on to their grandchildren.


    Source: Heritage Foundation

    Debt

    Since World War II, publicly held debt as a percentage of the economy (GDP) has remained below 50%. In 2008 when President Obama took office, it was 40.8 percent, nearly five points below the post-war average. According to the OMB, Obama’s budget would more than double this figure to 90 percent of Gross Domestic Product by 2020, levels not seen since World War II. (Greece’s debt level of 150% precipitated their meltdown). By 2020, Americans will spend more on interest payments on the Federal debt than on military spending. The Greatest Generation believes these debt levels to be unsustainable.


    Source: Heritage Foundation

    An Unsustainable Path

    In 1990, the federal budget was less than $2 trillion. Ten years later the federal budget was just $2.3 trillion. By 2010 the budget exploded to $4 trillion. The Obama budget projects a 43% growth to $4.3 trillion by 2019 according to the OMB. This massive increase over the $2.9 trillion budget Obama inherited in 2008 is not due to emergency spending alone but an intentional structural growth in government. Federal revenues have not kept pace with spending. The U.S. government was forced to borrow $1.5 trillion to pay its bills last year. The national debt is projected to increase from $13 trillion to $20 trillion by 2020 (Inflation-Adjusted Dollars, 2009). The path is unsustainable.


    Source: Heritage Foundation

    While the classic paradox of the immoveable object versus the irresistible force can never be solved, this battle will be settled at the ballot box in 2010 and 2012 when Americans determine the path their country will follow in the 21st Century. If the Greatest Generation prevails, many incumbent politicians will find themselves out of a job as collateral damage. A new wave of politicians will begin The Great Deconstruction.

    New Jersey Governor Chris Christie may be the prototype of this new generation of politicians. He was elected to deconstruct the dysfunctional government of New Jersey, an economy that resembles Greece. Christie inherited the nation’s worst state deficit — $10.7 billion out of a $29.3 billion budget. Christie is doing something unusual, honoring his campaign promises and acting like his last election is behind him. Christie epitomizes the politician the Greatest Generation craves, one willing to lose his job.

    Christie has already declared a state of emergency, signed an executive order freezing spending, and cut $13 billion in spending – in just two months. His first budget included 1,300 layoffs, cut spending by 9%, and privatized government services. The deconstruction of New Jersey has begun. New Jersey may be an unlikely place for The Great Deconstruction to begin, but it is a harbinger of things to come.

    The Great Deconstruction is a series written exclusively for New Geography. Future articles will address the impact of The Great Deconstruction at the national, state, county and local levels.

    Robert J. Cristiano PhD is the Real Estate Professional in Residence at Chapman University in Orange County, CA and Director of Special Projects at the Hoag Center for Real Estate & Finance. He has been a successful real estate developer in Newport Beach California for twenty-nine years.

    Other works in The Great Deconstruction series for New Geography
    The Great Deconstruction – First in a New Series – April 11, 2010
    Deconstruction: The Fate of America? – March 2010