Category: Demographics

  • The Real State of Metropolitan America

    The week opened with an important report on metropolitan demographics by the Brookings Institution, only to be followed by the Census Bureau’s annual report on migration, which contained a different message than the Brookings report. We offer yet a third analysis, since both the Brookings and the Census Bureau reports classify up to one-sixth of suburban population as not being in the suburbs.

    Brookings: The new Brookings State of Metropolitan America report examined trends in the 100 largest metropolitan areas using Census Bureau data between 2000 and 2008 (the census and the American Community Survey). Brookings highlighted findings that some “primary cities” were experiencing an increase in white population, while the rest of the metropolitan area (which it called suburbs) was becoming more diverse. Not uncharacteristically, the core city oriented press took the bait and embellished a bit on the findings. MSNBC characterized the report as indicating that “many younger, educated whites move to cities for jobs and shorter commutes.” Brookings, which largely shares and encourages the urbanist media spin, calls this movement of young, educated whites from suburbs to the cities “bright flight.”

    Brookings also expanded is previous finding that the majority of people in poverty live in suburbs to note that a majority of Hispanic and African-Americans now live in the suburbs. This is really not all that surprising, since suburban areas continue to grow faster and comprise the overwhelming share of metropolitan population.

    Census Bureau: Just a day or two later, the Census Bureau published its annual analysis of migration in the nation. The basis of this report is the Current Population Survey, which like the American Community Survey is conducted by the Census Bureau. The Census Bureau report received considerably less press attention than the Brookings report, perhaps it would be hard to characterize any of its findings as being consistent with the favored “death of the suburbs” line. The previous annual editions back to the beginning of the decade indicate little difference from the 2008-2009 migration trends in the current report.

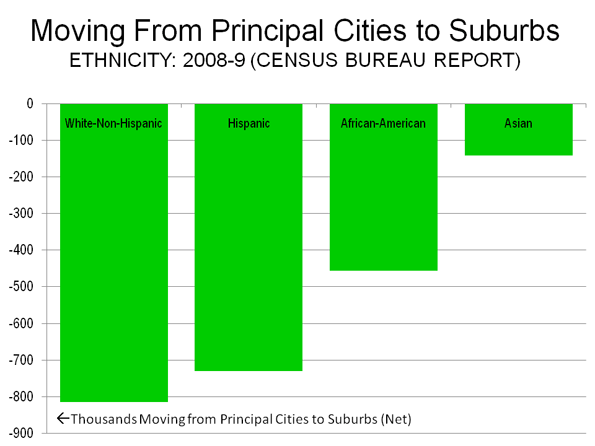
    The Census Bureau analysis indicates that, almost regardless of the category, many more people are moving from “principal cities” to what it refers to as “suburbs.”

    • Every ethnic group is moving to the suburbs in greater numbers than to principal cities. Three times as many Hispanics are moving from principal cities to the suburbs as from the suburbs to principal cities. The same is true for twice as many African-Americans and Asians. Whites are moving to the suburbs at 1.5 times the rate of their moving to principal cities (Figure 1).
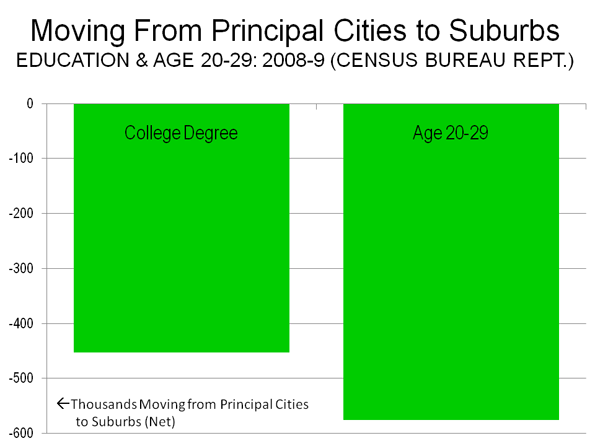
    • Every age group but one is moving to the suburbs at substantially above the rate of movement to the principal cities. There is strong movement among people aged from 20 to 25 to the suburbs rather than the principal cities (Figure 2). The one exception was that among people over 85 years of age, not exactly the epitome of the “bright flight” cited by Brookings and the media.
    • The overwhelming migration from principal cities to the suburbs, rather than from suburbs to principal cities was characteristic across all income categories.
    • There is, in reality, little “bright flight” to report. Among people with college and graduate degrees, nearly twice as many moved from principal cities to suburbs as moved from suburbs to principal cities (Figure 2). While the Census report does not provide mobility information on educational attainment by age, there was strong movement of young adults to the suburbs (noted above).


    The trends in the Census report are consistent with the domestic migration trends that we have previously reported.

    What is a Suburb? There are significant problems with definition of the term “suburb in each of the reports.

    The Office of Management and Budget (OMB), which establishes metropolitan area criteria switched to the “principal city” terminology for the 2000 census, partly to make it clear that principal cities were not inner cities or central cities. The criteria designates as principal cities, the largest in each metropolitan area, any city over 250,000 and any city with more than 50,000 population in which total employment exceeds the workforce.

    Among the 52 major metropolitan areas (those with more than 1,000,000 population), OMB designates 230 principal cities. The Census Bureau report calls everything outside a principal city a suburb. In fact, most of the principal cities are themselves suburbs, developed since World War II as urban areas and expanded outward from their cores.

    For example, principal city Schaumburg, Illinois is located well outside the core city of Chicago and contains a large suburban employment center (“edge city”). Bellevue, the large suburban employment center in the Seattle area is a principal city and not called a suburb by the Census Bureau. Cerritos, California is one of the 25 principal cities of the Los Angeles metropolitan area. Cerritos used to be called Dairy Valley, since it consisted largely of dairy farms until the middle 1950s.

    The Brookings report, in recognition of this problem, calls its non-suburbs primary cities and limits them to no more than three for any metropolitan area. Still, many suburbs are designated as primary cities and not counted in the suburban data, such as Mesa, Arizona (Phoenix), Arlington, Texas (Dallas-Fort Worth), and Cary, North Carolina (Raleigh).

    Suburban versus core analysis needs to be considerably more precise to be meaningful. It would be best to define the characteristics of the core and analyze metropolitan areas at the census tract level, rather than at the city level. However, the data at the city level is far more accessible and is thus predominantly used.

    What is a Core City? Even so, it is important to recognize that there are substantial differences among core cities (which are, broadly speaking, the only parts of urban areas that are not suburbs). Core cities may be divided into three broad categories:

    Pre-World War II Core Cities: These are core cities that have essentially the same boundaries as in 1950. There are 21 Pre-World War II Core Cities in the major metropolitan areas (See Table 2 below). These were largely built before the automobile became dominant, and once were predominately walking and transit cities. New York, Chicago, Boston, Philadelphia and San Francisco are probably the best examples.

    Pre-World War II Core Cities with Suburbs: Many pre-World War II core cities either included wide swaths of vacant developable land in 1950 or annexed substantial amounts of vacant or suburban land after 1950. These cities have cores that are similar to the Pre-World War II Core Cities, but also include suburbs that are little different than the inner suburbs outside the city. For example, in 1950, Los Angeles contained substantial amounts of non-urban land in the San Fernando Valley, which was eventually covered with suburban development. Other cities, such as Milwaukee, Portland, Seattle, Austin and Houston annexed considerable suburban land after 1950. These annexations did not always result in increased population. For example, Salt Lake City doubled its land area between 1950 and 2000, yet retained essentially the same population. Milwaukee nearly doubled its land area, yet lost 40,000 residents.

    Suburban Core Cities: A number of core cities developed predominantly after World War II and as a result, have little, if any pre-World War II core. The largest of these is Phoenix, which recently passed Philadelphia to become the nation’s 6th largest city. San Jose, Charlotte, Orlando and Las Vegas are also examples of Suburban Core Cities.

    Another Perspective: The following analysis (expanded version available here) is offered to indicate general trends in suburbs when non-suburban areas are defined to exclude demonstrably suburban areas. (This may sound circular, but both Brookings and the Census Bureau define some suburban areas as non-suburban.)

    Table 1
    Population Trends: Metropolitan Areas Over 1,000,000: 2000-2008 by Geography
    2000
    2008
    Change
    %
    Metropolitan Areas   152,382,483      166,564,617     14,182,134 9.3%
      Core Cities     43,818,674        45,922,606        2,103,932 4.8%
         Pre-WW2 Core Cities      20,172,850       20,219,342            46,492 0.2%
         Pre-WW2 Core Cities with Suburbs     18,472,298       19,723,295       1,250,997 6.8%
         Suburban Core Cities (Post WW2)        5,173,526          5,979,969          806,443 15.6%
      Suburbs   108,563,809      120,642,011     12,078,202 11.1%
        Suburbs Classified by OMB as Principal Cities    17,968,287       19,334,689       1,366,402 7.6%
        Suburbs Not Classified as Principal Cities    90,595,522     101,307,322    10,711,800 11.8%
    Calculated from US Bureau of the Census Data
    For classification of core cities, see Table 3
    2008 Population of "Suburbs Classified as Principal Cities" is slightly understated because there are no late official estimates for 7 "census designated places." (which are not cities): 2000 estimates used.

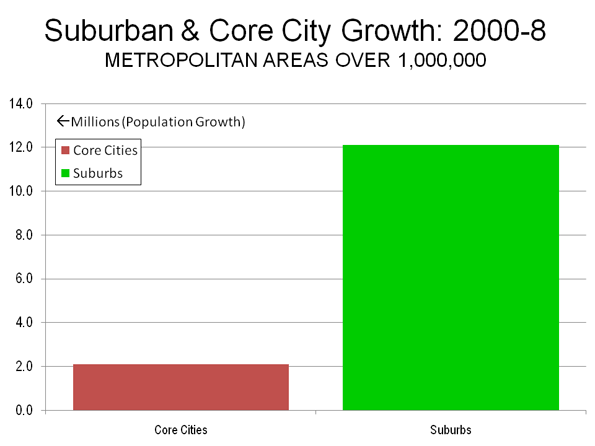
    Generally, suburbs continue to grow much faster than the core cities (Table 1 and Figure 3). Between 2000 and 2008:

    • Suburbs added 12.1 million residents, growing 11.1%.
    • Core cities added 2.1 million residents, growing 4.8%. The greatest growth was in the Post War (Suburban) Core Cities, at 15.6%. The Pre-War Core Cities with Suburbs grew 6.8% and the Pre-War Cities grew 0.2% (Figure 4).


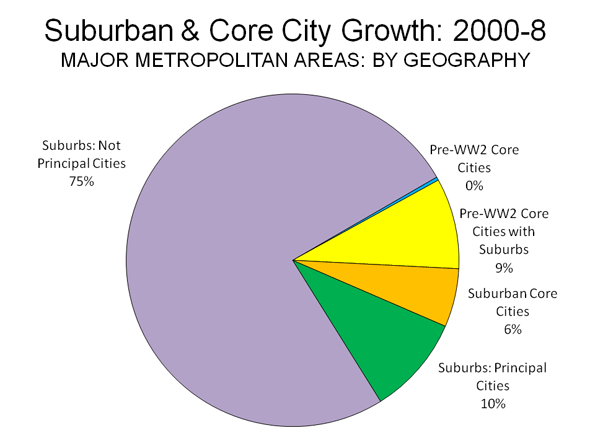
    Virtually all of the core city growth was in the more suburban core cities, which is another indication that suburbanization is continuing. Further, the principal cities that are really suburban grew at a rate of 7.6%, more than double that of the core cities. This would seem to indicate that the migration data from the Census Bureau indicating a continued migration to the suburbs is, if anything, materially understated (by classification of some suburbs as principal cities).

    At the same time, the demographic trends and prospects in the nation’s core cities are better than in the past. The rampant lawlessness that drove so many out of the cities in the 1970s has been replaced by law enforcement strategies developed under former New York mayor Rudi Giuliani. Core cities would become more attractive to future residents with serious reform of school performance and business regulation. Until that occurs, however, it seems unlikely that the movement from the cities to the suburbs will be reversed.

    The city-centric media, with its faith-based demographics, continue to announce the demise of the suburbs. However, until migration data shows a net movement from the suburbs to the core cities, it will remain little more than disingenuous hype. At this point, it is not even close. From 2000 to 2008, suburban counties in major metropolitan areas gained 2,000,000 domestic migrants, while the core counties lost 4,600,000 domestic migrants (Note).


    Note: Domestic migration data is reported at the county level and is thus not available for core cities, except where they are coterminous with counties (Such as New York, San Francisco, Baltimore and Washington).

    Table 2
    Metropolitan Areas and Core Cities
    Metropolitan Area Core City (ies) Type of Core City
    Atlanta-Sandy Springs-Marietta, GA  Atlanta Pre-WW2 Core City with Suburbs
    Austin-Round Rock, TX  Austin Pre-WW2 Core City with Suburbs
    Baltimore-Towson, MD  Baltimore Pre-WW2 Core City
    Birmingham-Hoover, AL  Birmingham Pre-WW2 Core City with Suburbs
    Boston-Cambridge-Quincy, MA-NH  Boston Pre-WW2 Core City
    Buffalo-Niagara Falls, NY  Buffalo Pre-WW2 Core City
    Charlotte-Gastonia-Concord, NC-SC  Charlotte Pre-WW2 Core City with Suburbs
    Chicago-Naperville-Joliet, IL-IN-WI  Chicago Pre-WW2 Core City
    Cincinnati-Middletown, OH-KY-IN  Cincinnati Pre-WW2 Core City
    Cleveland-Elyria-Mentor, OH  Cleveland Pre-WW2 Core City
    Columbus, OH  Columbus Pre-WW2 Core City with Suburbs
    Dallas-Fort Worth-Arlington, TX  Dallas Pre-WW2 Core City with Suburbs
    Denver-Aurora-Broomfield, CO  Denver Pre-WW2 Core City with Suburbs
    Detroit-Warren-Livonia, MI  Detroit Pre-WW2 Core City
    Hartford-West Hartford-East Hartford, CT  Hartford Pre-WW2 Core City
    Houston-Sugar Land-Baytown, TX  Houston Pre-WW2 Core City with Suburbs
    Indianapolis-Carmel, IN  Indianapolis Pre-WW2 Core City with Suburbs
    Jacksonville, FL  Jacksonville Pre-WW2 Core City with Suburbs
    Kansas City, MO-KS  Kansas City Pre-WW2 Core City with Suburbs
    Las Vegas-Paradise, NV  Las Vegas Suburban Core City (Post -WW2)
    Los Angeles-Long Beach-Santa Ana, CA  Los Angeles Pre-WW2 Core City with Suburbs
    Louisville/Jefferson County, KY-IN  Louisville Pre-WW2 Core City with Suburbs
    Memphis, TN-MS-AR  Memphis Pre-WW2 Core City with Suburbs
    Miami-Fort Lauderdale-Pompano Beach, FL  Miami Pre-WW2 Core City
    Milwaukee-Waukesha-West Allis, WI  Milwaukee Pre-WW2 Core City with Suburbs
    Minneapolis-St. Paul-Bloomington, MN-WI  Minneapolis Pre-WW2 Core City
    Minneapolis-St. Paul-Bloomington, MN-WI  St. Paul Pre-WW2 Core City
    Nashville-Davidson–Murfreesboro–Franklin, TN  Nashville Pre-WW2 Core City with Suburbs
    New Orleans-Metairie-Kenner, LA  New Orleans Pre-WW2 Core City
    New York-Northern New Jersey-Long Island, NY-NJ-PA  New York Pre-WW2 Core City
    Oklahoma City, OK  Oklahoma City Pre-WW2 Core City with Suburbs
    Orlando-Kissimmee, FL  Orlando Suburban Core City (Post -WW2)
    Philadelphia-Camden-Wilmington, PA-NJ-DE-MD Philadelphia Pre-WW2 Core City
    Phoenix-Mesa-Scottsdale, AZ  Phoenix Suburban Core City (Post -WW2)
    Pittsburgh, PA  Pittsburgh Pre-WW2 Core City
    Portland-Vancouver-Beaverton, OR-WA  Portland Pre-WW2 Core City with Suburbs
    Providence-New Bedford-Fall River, RI-MA  Providence Pre-WW2 Core City
    Raleigh-Cary, NC  Raleigh Suburban Core City (Post -WW2)
    Richmond, VA  Richmond Pre-WW2 Core City with Suburbs
    Riverside-San Bernardino-Ontario, CA  Riverside Suburban Core City (Post -WW2)
    Rochester, NY  Rochester Pre-WW2 Core City
    Sacramento–Arden-Arcade–Roseville, CA  Sacramento Pre-WW2 Core City with Suburbs
    Salt Lake City, UT  Salt Lake City Pre-WW2 Core City with Suburbs
    San Antonio, TX  San Antonio Pre-WW2 Core City with Suburbs
    San Diego-Carlsbad-San Marcos, CA  San Diego Pre-WW2 Core City with Suburbs
    San Francisco-Oakland-Fremont, CA  San Francisco Pre-WW2 Core City
    San Francisco-Oakland-Fremont, CA  Oakland Pre-WW2 Core City
    San Jose-Sunnyvale-Santa Clara, CA  San Jose Suburban Core City (Post -WW2)
    Seattle-Tacoma-Bellevue, WA  Seattle Pre-WW2 Core City with Suburbs
    St. Louis, MO-IL  St. Louis Pre-WW2 Core City
    Tampa-St. Petersburg-Clearwater, FL  Tampa Pre-WW2 Core City with Suburbs
    Tucson, AZ  Tucson Suburban Core City (Post -WW2)
    Virginia Beach-Norfolk-Newport News, VA-NC  Norfolk Pre-WW2 Core City with Suburbs
    Washington-Arlington-Alexandria, DC-VA-MD-WV Washington Pre-WW2 Core City
    See: Core City Classification Definitions

    Wendell Cox is a Visiting Professor, Conservatoire National des Arts et Metiers, Paris. He was born in Los Angeles and was appointed to three terms on the Los Angeles County Transportation Commission by Mayor Tom Bradley. He is the author of “War on the Dream: How Anti-Sprawl Policy Threatens the Quality of Life.

    Photograph: Suburban core city: Phoenix

  • So Much for Europe’s Superiority

    For much of the last quarter century, European pundits, particularly in France, have been promoting the notion that the old continent sat on the verge of a grand resurgence. The events of the past month—culminating in a trillion dollar rescue of the Euro—should, at least, put that dodgy notion to rest.

    Although the financial crisis may have originated on Wall Street, it’s been Europe and the Euro that now represent the big threat to drive world markets back into recession. The show stealers are India, China and Brazil. Still the big boy on the block, the American economy is growing, albeit not spectacularly.

    What a change from the heady predictions of the European elites just a decade ago. Back then Jacques Attali, eminence grise for former French President Francois Mitterrand, asserted that “Japan and Europe” would likely “supplant the United States as the chief superpowers wrangling for global economic supremacy.” More recently, author Jeremy Rifkin wrote a book about what he defined as The European Dream, a green-tinged, social democratic ode to enlightened diversity that he predicted would supplant the declining dirty, unruly model forged by the United States on the world stage.

    You can blame the spendthrift Greeks for this trouble, or even the lack of geeks in Europe (anyone found a continental Google or Apple lately?). But Euro-stagnation is nothing new. It’s deeply rooted and longstanding. Indeed, since 1970 it has not been the U.S. that has faded before the onslaught from the East, but the core 15 nations of the European Union. Over that 40-year period the EU-15’s share of world GDP has plummeted from roughly 37 percent to under 28 percent; the American chunk, roughly 27 percent, has stayed remarkably even. Basically Asia, and particularly China and India’s gain, largely has been at Europe’s expense, not our’s.

    In stating the case for European superiority, much has been made by boosters of Europe’s different institutional framework, tax or regulatory structure. No question these have advantages and disadvantages compared with those of the United States, but there’s little case for arguing that the “Euro-model” has been a rip-roaring economic success. It’s imploding on its weak periphery, and the collapse is threatening even bigger players, including the United Kingdom.

    Europe’s problems extend well beyond policy, into the realm of culture and demographics. Even in France, people and what they do actually matter more than abstract ideas. A culture that believes in itself, not only to have children, but also start businesses and innovate will overcome one, however theoretically well managed, that does not. This is the fundamental problem of Europe as whole, although it does not apply equally to every individual country in the union.

    One key element is demographics. According to the most conservative estimates, the United States by 2050 will be home to at least 400 million people, roughly 100 million more than live here today. In contrast, the populations of much of the EU, as well as most of East Asia, will be stagnant or falling over the next few decades. Like other advanced countries, the United States will be aging but not nearly as quickly. By 2050, there may be close to 40 percent of the population in Japan and Germany over 65; in the United States that proportion should be closer to 25 percent.

    If there’s going to be a European dream, they better start importing people or creating them. Otherwise, the European workforce will be dying out, literally. Between 2000 and 2050 the population of the U.S. between 14 and 64 is projected to expand by some 44 percent, while that of the EU contracts by 25 percent and Japan’s by over 40 percent.

    With its growing workforce, the United States will require substantial economic growth in order to stave off downward mobility of its young population. Europe’s prime challenge will be to pay for its aging population with a diminished workforce, and perhaps find ways to invest in faster growth economies. Europe’s future may be as the world’s coupon-clippers, consultants and waiters.

    Yet this may not be the fate of all Europe, particularly if the grand neo-Bonapartist European is allowed to fizzle and national characteristics can reassert themselves. The aptly named PIGS (Portugal, Italy, Greece and Spain) make clear that you can not enjoy a Scandinavian welfare state with a Mexican-style economy. You have to earn the right to six weeks of vacation and Porsche-level heath-care plans.

    This contrasts with the productive, disciplined countries of the north—roughly today’s version of the Medieval Hanseatic League—who continue to export goods and services enough to sustain their expansive, and generally less corrupt, welfare states. Essentially you have the sunny, good food and times countries—an arc from Portugal to Spain—and the gloomier places like Scandinavia, the Netherlands and Germany.

    A secular kind of Protestant ethic is alive and well in post-Christian Europe. In some countries like Sweden and Denmark, blond and red-haired baby-making is making a modest comeback, lifting the future prospects for these countries. As for the Mediterranean crowd, get used to African or Arab chefs cooking your pasta. It might not be too bad, as long as the weather holds up.

    This article originally appeared in The Daily Beast.

    Joel Kotkin is executive editor of NewGeography.com and is a distinguished presidential fellow in urban futures at Chapman University. He is author of The City: A Global History. His newest book is The Next Hundred Million: America in 2050, released in Febuary, 2010.

    Photo by alibaba0

  • LA the Least Gentrified Major City?

    Los Angeles has been “gentrified” and made more stable in many of its areas by immigrant settlement, but the phenomenon of Anglo “gentrification” – what used to be “yuppies” or their more contemporary counterparts (original “yuppies” are now in their 50s) upgrading a formerly “bad” neighborhood by pushing up rents and squeezing out existing relatively poor folks – is rarer in Los Angeles than in almost any other American city.

    The closest thing to it has occurred in a few “paleo-urbanist” beach communities. (“Paleo-urbanist” means planned to New Urbanist specifications, but nearly a century ago!) And I think the reason for it has to do with the massive projects by the Irvine Company especially in the 60s and 70s. These projects, plus the nearby existence of Newport Beach – already a “watering spot” for the WAS (WASP but including Catholics, this being California) – plus the riots of 1965, plus the perception that the air in the Irvine and Newport region was less polluted at a time when smog was worse than now, led to a massive secessio patriciorum, a secession of the patricians, It was a physical manifestation of Christopher Lasch’s The Revolt of the Elites. Corporate headquarters relocated en masse. Second homes near Newport Bay often became first homes. Many of the people that might otherwise be gentrifiers in Los Angeles were removed to the first great Edge City, at the head of Newport Bay.

    Los Angeles proper ultimately recovered from the Great Secession. It did so with the help of immigrants on the one hand, and the entertainment industry on the other. In days of old “Hollywood” and “Los Angeles” had been two separate cities occupying the same space. Outsiders who were concerned with the film industry often didn’t refer to “LA” at all, but to “Hollywood” or “The Coast.” “LA” was the rather bourgeois city that happened to occupy the same physical space.

    I remember, for example, when Los Angeles magazine was socially conservative enough to declare, “Why is it they never organize against the popular smut [pornography] – movies like Beach Party, for instance?” This is unimaginable now. I also remember how few were the movie stars in attendance at the openings of the major Music Center (now LA Performing Arts Center) in 1964 and 1967.

    It is now recognized that Hollywood is at the center of cultural life in Los Angeles. The two largest political parties in the state are the Hollywood Democrats and the Eastside LA Democrats, with quite different social priorities. The third party, the Republicans, is desperately trying to hold on to its veto on taxation and the budget. As a matter of fact, the terms Westside and Eastside are used a lot more now. When I lived in Hancock Park in my high school years, I had somewhat of a perception that I was in the exact middle. Wilshire Boulevard, the grand prestigious street of Los Angeles, had, because of foolish zoning, a strip of vacant lots where it went by the Hancock Park residential district (not to be confused with the city park of the same name, two miles west, where LACMA and the Page Museum are}. These lots were not built on until the 70s, when condos were allowed there.

    The so called “Park Mile” did provide a separation between the Miracle Mile on one side and the Wilshire Center – not in those days Koreatown, and in fact a serious rival to Downtown – but the separation between West and East has grown sharper as the Miracle Mile has faded a bit, and Koreatown is what it is and not a rival of Downtown any more. The perceived border between Westside and Eastside LA seems to run near Vine Street, through Old Hollywood and Hancock Park.

    Pasadena and Santa Monica, both singularly uncool places 40 years ago, have become among the coolest parts of the city. Remarkably, Pasadena and nearby areas were the main source of the secessio patriciorum of 40 years ago. The vacuum has been filled in a very interesting way!

    In contrast, downtown San Diego feels a lot like downtown Denver, except with palm trees and water. Both of those downtowns fill up on weekends at night with hard-partying young Anglos, not exactly to be seen on Broadway in LA at any hour. If there was a secessio patriciorum in San Diego, it was only to the UCSD area near La Jolla, much closer. If the secessio had gone, say, to Carlsbad, and upper class San Diegans had relocated to Carlsbad and La Costa en masse, downtown San Diego might be the ethnic wonderland Downtown LA now is. Carlsbad may be 30 miles away but the few Carlsbadians I know seem a lot more loyal to San Diego than OCers are to Los Angeles. Who knows?

    Howard Ahmanson of Fieldstead and Company, a private management firm, has been interested in these issues for many years.

  • The States and Economic Development, Identifying Top Performers

    This is an excerpt from “Enterprising States: Creating Jobs, Economic Development, and Prosperity in Challenging Times” authored by Praxis Strategy Group and Joel Kotkin. The entire report is available at the National Chamber Foundation website, including highlights of top performing states and profiles of each state’s economic development efforts.

    States throughout American history have done everything they can to cultivate, attract, retain, and grow the businesses that comprise the most fundamental building blocks of their economy. Even in today’s volatile global economy states with severe unemployment and budget woes can point to policies, programs, and investments that foster new economic opportunities and create jobs.

    Read the full report.
    Read part one in this series: The Jobs Imperative: Power to the States

    Many state economic development organizations were originally established with business recruitment and attraction as their primary focus. But today’s mix of state approaches to economic development has moved well beyond earlier, sometimes singularly focused attempts to lure footloose businesses with huge financial incentives and/or by offering a business climate based on cheap labor, low taxes, and lenient regulations.

    States, nonetheless, still compete with each other for companies in “traded sectors” and jobs in the global economy, either directly or by virtue of unique assets and resources, and this sometimes involves financial incentives and tax abatements. But there is growing momentum among governors and state legislatures to grow their economies from within by creating a new set of competitive advantages that include building human capital through workforce development and training, harnessing the power of science and technology assets, making strategic investments in infrastructure, reaching out to global markets, developing opportunities related to energy and the environment, and spurring entrepreneurship and innovation.

    Generally, state economic development efforts include an interrelated array of policies, programs and investments, falling into three major categories: (1) an entrepreneurial approach focusing on new business and technology-based development, oftentimes with a focus on bolstering productivity and innovation; (2) recruitment, expansion, and retention strategies emphasizing financial incentives or investments and other programs, including international trade and export promotion; and (3) “fertile soil” policies28 that create the conditions for growth that will benefit almost any type of business by streamlining governmental regulation, optimizing taxes, investing in infrastructure, and/or by providing a better-educated, more highly skilled work force.

    While it is up to state governors and legislators to set the environment for development to flourish, ultimately economic development success is defined by execution at the local and regional level. With well designed state-implemented development tools, effective workforce development and skills training systems, and strong infrastructure, states can give local economic developers the power to assist the growing businesses, to broker the key partnerships, and to lead the key initiatives that create the jobs needed to sustain our growing population.

    Most of all, states must carefully weigh policy to refrain from constructing barriers to private enterprise growth. Many of the most effective economic development initiatives start from grassroots efforts or private sector business leaders, so supporting these efforts from the state level is imperative.

    Measuring the States: A List of the Top Performers
    A primary goal of any state economic development program is not only to increase the number of jobs in the state, but to improve the quality of jobs and the overall prosperity of the state’s residents.

    This study combines metrics for each economic development policy area to measure overall high performers in each policy topic area. States are compared in each metric and top states are determined by a composite comparison of all metrics in overall performance and in each policy area. For a full description of all metrics and results for each state as well as top performers in exports, innovation, workforce development, infrastructure, and tax and regulation, see the full report.

    To establish the overall best performers we combined measures of Job growth rate since 2000 and since 2007; Gross State Product (GSP) measures: real GSP growth since 2000, GSP per job 2008, Growth in GSP per job 2000-2008; and income: per capita personal income growth 2000-2009 and median four person family income adjusted for cost of living, 2009.

    Top Overall Growth Performers

    1. North Dakota – While North Dakota’s low unemployment and recession resistance is often attributed to healthy agriculture and energy sectors, its construction and manufacturing sectors are relatively healthy and the state has seen 42% job growth in professional and technical services and 36% in management of companies since 2002. North Dakota is the top job performer since the 2007 peak and is fifth since 2000. The state also places first in growth in GSP per job (productivity increase), second in GSP growth and third in per capita income growth. Recent investments in research and development (R&D) infrastructure are beginning to pay off as the state is the fastest growing in science, technology, engineering, and mathematics (STEM) job growth.
    2. Virginia – Already a professional and technical services powerhouse in 2002, Virginia added another 135,000 jobs in that sector since that time, fueled by 90,000 new jobs in computer systems design and management and technical consulting services. The state’s high incomes and slightly below average cost of living placed it first on our cost of living adjusted family income measure.
    3. South Dakota – South Dakota is a strong overall performer, doing best in productivity and output measures. Partly due to an enterprise-friendly regulatory structure, the state has 30% more finance industry employment than the national norm and has added 18% growth in finance employment since 2002. The state’s manufacturing sector actually gained jobs since 2002, led by growth in signs, chemicals, communications equipment, and construction equipment, all averaging more than $43,000 in earnings per worker.
    4. Maryland – Maryland landed in the top 20 or better on all seven performance metrics. Maryland saw strong growth in technical consulting and computer systems design, but especially private scientific research and design services, a sector more than 2.5 times as concentrated in Maryland than the nation as a whole and paying nearly $95,000 in earnings per worker.
    5. Wyoming – Wyoming’s growth is powered by a rapidly expanding energy cluster, which added more than 18,000 jobs since 2002 and now holds 30% of all employment in the state. The energy growth has spilled over into business services sectors such as environmental consulting, surveying and mapping, and testing laboratories. Its overall manufacturing supersector also gained jobs, seeing the fabricated metal and electrical equipment clusters begin to emerge.
    6. New York – While New York saw average job growth through the beginning of the decade, it has weathered the recession better than most other states, and its high productivity and productivity gains help place it among our top performers. Accounting for about 8% of all jobs in the state, the professional and technical services sector added more than 115,000 jobs for 15% growth.
    7. Texas – Texas has seen strong job growth this decade and has weathered the recession well, fueled by 20% expansion of a now 1.1 million job energy cluster. Recently machinery manufacturing and transportation equipment manufacturing clusters are emerging, both growing to more than 90,000 jobs. This has helped stimulate a 15% expansion in transportation and logistics including warehousing and storage and many freight and specialized trucking sectors.
    8. Iowa – A solid performer across most of our metrics Iowa’s strength is perhaps in its stability. The state’s largest cluster, agribusiness, food processing and technology, grew at a 1% rate since 2002, significantly better performing than the same group of industries nationally. Iowa’s other most competitive clusters include machinery manufacturing (farm and construction equipment, refrigeration and heating systems, and other commercial equipment) transportation and logistics, and advanced materials (search and navigation equipment and machine shops).
    9. Nebraska – Nebraska has added 15,000 jobs to its business and financial services cluster since 2002, led by management and technical consulting, management of enterprises, and credit intermediation, all adding at least 3,000 jobs and averaging $55,000 to $90,000 in earnings per worker. The state’s railroads and support industries and freight trucking support a strong transportation and warehousing cluster, and the state has seen a boom in marketing consulting and market research sectors.
    10. Montana – While Montana’s energy and mining clusters added a combined 8,400 high-paying jobs to the state since 2002, Montana’s greatest source of national dominance came from the collection of arts, entertainment, recreation, and visitor industries, perhaps a sign that the rest of the nation is beginning to discover the Big Sky country. Montana is also beginning to see the emergence of smaller clusters in chemicals, apparel and textiles, and fabricated metal products.

    Growing Jobs: How Do They Do It?

    A review of which states are high performing shows a diverse group—some big, some small; some rural, some urban; some inland, some coastal—but a closer examination shows a shared pattern of policies by these high performers.

    There is no such thing as single a silver bullet strategy for job creation. Among our top ten performers, all ten have seen at least 4% job growth since 2002 in mid-level jobs requiring at least long term on-the-job training but less than a four-year degree. Five of the ten states increased those jobs more than 10%. At the same time all ten increased science, technology, engineering, and mathematics (STEM) jobs by at least 4% over the same period, with 7 of 10 growing STEM jobs at least 14%.29

    An assessment of top performing states, regardless of by what measure, eventually gets down to a state’s ability to execute successful initiatives. Aside from minding the basics of primary education and supportive infrastructure, success begins with an understanding of a state’s economy and demographics, including its strong points and its gaps. States that can mobilize the relevant partners to put together the strategic networks to build upon those strengths while addressing the weaknesses will be winners in the long run.

    Adequately financing any initiative is paramount to its success. Top performing states have come up with winning formulas often based on combining state funding with federal programs and private sources. As regional workforce skills gaps become more acute, non-governmental agencies and private enterprises more are willing to join new collaborative development projects.

    Programs such as Kentucky’s “Bucks for Brains” which requires universities to match state funds with donations from philanthropists, corporations, foundations, and other non-profit agencies, or Florida’s use of American Recovery and Reinvestment Act (ARRA) funding in combination with existing state funds to tackle major infrastructure programs illustrate unique solutions to sufficiently financing winning initiatives.

    Examples of strong partnerships featuring open communication are especially evident in high performing export states. Export programs are based upon effective communication between the importing country, the exporting manufacturer or business, and the state program helping to facilitate the connection.

    The TexasOne program creates promotional materials to market the state and its manufacturers to importing countries and leads trade missions to importing countries and hosts reverse trade missions to the state. Nevada works with a network of trade representatives in targeted markets throughout Asia, North America and Europe, focused on cultivating distribution channels and facilitating opportunities for foreign direct investment in Nevada enterprises.

    Many high performing states offer an array of corporate, manufacturing, and land tax programs. So too, many states are shying away from direct subsidies for promised job growth in favor of highly targeted tax credit programs that require direct investment by the firm or venture investors wherein the tax benefits are only realized after new jobs are in place. Other credit programs target historically underdeveloped geographical regions.

    Other states such as North Dakota, Florida, and Mississippi have turned to comprehensive tort reform as another key element enterprise-friendliness. Whether these reforms are specific to a particular industry or issue, they ultimately help businesses, large and small, remain competitive and free of excessive burdens from excessive litigation.

    Private sector and academic collaboration is one of the most readily identifiable attributes of high performing states across all measures. Whether it is successful innovation and entrepreneur programs such as Montana’s TechRanch, Oregon’s Innovation Council, Rhode Island’s Center for Innovation and Entrepreneurship, or job creation and economic development initiatives such as Momentum Mississippi, these private and academic partners are providing critical input, oversight, and resources to bolster the effectiveness of state efforts.

    Many states are locating business incubators adjacent to universities in partnership with the schools while others are building laboratory spaces and other specialized infrastructure to offer to growing companies on an a la carte basis. In either case, this business and scientific infrastructure can reduce start-up costs for new enterprises and provide students the chance for experiential learning while earning their degrees.

    While there are obviously other policies or initiatives that high performing states share there are some commonalities: building on momentum; delivering adequate funding for initiatives; developing strong relationships and communication strategies; enterprise-friendly tax and regulation systems; and vigorous collaboration between business, government, and education institutions.

    Read the full report.

    Praxis Strategy Group is an economic development, analysis, and strategic planning firm. Joel Kotkin is executive editor of NewGeography.com and author of The Next Hundred Million: America in 2050

  • Enterprising States: Creating Jobs, Economic Development, and Prosperity in Challenging Times

    This is an excerpt from “Enterprising States: Creating Jobs, Economic Development, and Prosperity in Challenging Times” authored by Praxis Strategy Group and Joel Kotkin. The entire report is available at the National Chamber Foundation website, including highlights of top performing states and profiles of each state’s economic development efforts.

    Read the full report.

    Read part two in this series: The States and Economic Development, Identifying Top Performers

    The Jobs Imperative: Power to the States

    In the coming decades, the United States will enjoy an enormous demographic advantage over its primary competitors in both Europe and East Asia. As countries such as Germany, France, Japan, South Korea and even China will experience declining workforce growth and rapid aging, by 2050 the pool of people aged 14 to 64 in the United States is expected to grow by more than 40%, compared to what it was in 2000. In contrast, China’s workforce will fall by 15%, Europe’s will decline by 25%, and that of Japan will plunge by 44%.

    This growth represents an unprecedented opportunity for free enterprise in America, but it also poses a tremendous challenge. What the United States does with its “demographic dividend”—that is, its relatively young working-age population—will largely depend on whether or not the private sector can generate growth in jobs and wealth to help meet the needs of a larger aging population.

    Government, too—particularly at the state and local levels—will need to play a role with policies that spur the private sector. Government can facilitate long-term job growth by establishing smart approaches to education, immigration, health care, energy, infrastructure, and tax and regulatory policies.

    A University of Kentucky report prepared for the U.S. Chamber of Commerce has calculated the total number of new jobs needed “to return the economy to our pre-recession level of employment and provide jobs for all the expected new entrants.” It concluded, “The national total is nearly 23 million workers. Almost forty percent of these additional jobs are concentrated in California, Florida, and Texas, three states that comprise 26 percent of the population as of 2008.” Each of the three states that are predicted to need fewer positions since the start of the recession has fewer than 850,000 people. In these states, North Dakota, South Dakota, and Wyoming, the number of workers affected by the recession is more than offset by slower population growth projected by the Census.

    And simply to keep pace with population growth in 2010, the New America Foundation estimates, the country needs to add more than 125,000 jobs a month. The employment imperative is particularly critical today, with over fifteen million unemployed. Even if we reach the administration’s goal of providing 95,000 jobs a month this year, 190,000 monthly next year, and 250,000 in 2012, our overall unemployment rate is expected to remain over 8% by 2012. According to estimates by the Economic Policy Institute, it could take until 2013 or even 2014 to get back to the unemployment levels of before the recession.

    The most critical need is to create jobs for middle and working class people, and for the young, with the teen unemployment rate now over 24% compared to under 15% in 2007.

    These groups have borne the brunt of the recession—particularly in areas such as construction, where employment has contracted by two million jobs since 2006. The nature of the federal stimulus, which focused more on the social safety net than on infrastructure, appears to have largely missed this heavily male, blue collar segment.

    Many have been out of work for a long time. Nearly 6.3 million Americans have been unemployed for over six months, the largest number since the federal government started keeping track in 1948. The average duration of unemployment—28.5 weeks—is the highest since the end of the Second World War. According to the labor department, right now there are roughly 6.1 unemployed people for every job, four times the rate in December 2007.

    Needed: An American Approach to Job Creation

    More than a year after the passage of the federal stimulus, much more work needs to be done to strengthen of our free enterprise system. Some analysts suggest that we take our lead from the example of European societies, and use tax dollars to stimulate and preserve employment as well as expand social protections. Others argue that adopting European models of shorter hours and more leisure might benefit the economy. Yet these are not rational choices for the United States, since virtually all these societies are aging rapidly, and few have been growing rapidly.

    Indeed, many of these societies still have higher rates of youth unemployment than the United States. By the end of 2009, unemployment for those under the age of 25 stood at 21% in the European Union (EU), with some countries—Sweden (27%) and Spain (44%)—at extraordinarily high levels.

    Overall, the core European countries have not grown as quickly as the United States over the past forty years, and seem to be lagging in the current early stages of the recovery. This is a long term trend. The core EU fifteen countries’ share of the world economy has shrunk considerably, while that of the United States has remained remarkably stable. For EU countries, expansive social protection has not been paired with rapid growth.

    The United States will need to find its own means to address its unique jobs imperative. Clearly, the expansion and preservation of government employment has proven stimulative, but private sector employment continues to be a struggle in most of America.

    One third of the stimulus was directed to local government, and public employment has barely dropped. Even so, there is increasing stress on state and local government, due to the declines in the private sector economy. The limited efficacy of a government-centered approach can be seen in the states—which, after all, cannot print their own money to cover their deficits—with extremely stressed budgets and the inevitability of large cutbacks in public employment.

    Another misplaced approach to job creation is the widely embraced notion—both at the federal and the local levels—that government regulations tied to a “green” economy could create a large new employment source. Various studies in countries that have created massive incentives for such employment—Spain, Germany, Denmark—find that the employment-stimulating impact of such policies can be more than off-set by the negative consequences of resulting high energy prices. When cap and trade mandates raise energy taxes and the cost of doing business, they ultimately inhibit job growth. In the long run new jobs in energy sectors will be created by the creation and production of new technologies.

    Expanding our production of all energy sources could be a major source of jobs. But the experience in some European countries makes clear that green jobs on their own cannot be a fundamental driver of future job creation. Indeed, literature suggests that much of the job growth in green industries has occurred in China and other countries. To date, the actual impact of green jobs seems to be less than expected.

    The one likely way to expand green jobs, notes a series of studies by EMSI, would be through greater economic growth. Most new green jobs depend on the expansion of other key sectors, notably housing, manufacturing, warehousing and agriculture. As these industries expand, they will be the prime markets for new, environmentally responsible technologies and techniques.

    The only sustainable way for the United States to create jobs lies in a rapid expansion of the private sector economy, including in the construction, manufacturing, and energy sectors. A ‘green’ economy cannot be created at the expense of the rest of the economy as a whole. Unreasonable constrictions on manufacturing and construction inhibit job growth. And roadblocks to energy development—including to renewable energy projects—from environmental legislation, as well as from environmentalists and NIMBYs, are also harmful to job growth. Improving the quality of the environment should be a primary concern here, of course, as well. But without robust economic growth, the United States simply will have to accept a massive decline in living standards.

    The growing divergence between advanced countries should not be viewed as a matter of right or wrong, better or worse. Rather, it signifies how societies of different heritages, faced with different prospects, cope with their evolving futures.

    What Is the Best Role for the Federal Government In Job Creation?

    The best role for the federal government is to fund national priorities like energy, physical infrastructure, and the national defense, and to set basic health and safety regulatory guidelines that are carefully balanced against the need to maintain low barriers to entry into the market. But, for the most part, the primary mission for economic development went to the states, and, more importantly, the private sector economy.

    The mounting federal initiatives to wrest environmental, wage, and benefit concessions from private companies are examples of a centralization of government power over both states and private businesses that could take us in the wrong direction. Although certain times do call for increased federal activity—legitimate threats to national security or economic emergencies, such as the Great Depression or the recent financial crisis—we may be approaching a critical juncture where Washington’s power may be reaching beyond its effectiveness.

    The current impulse to create a high-employment economy by imposing federal restrictions—such as the proposal that private firms that do not raise wages will be bullied into doing so by the manipulation of federal contract awards—marks a departure from our free-market traditions. Similarly, possible federal control over local zoning decisions—through such organizations as the EPA—also mark a crossing of the regulatory Rubicon.

    States and localities are far better positioned than the federal government to foster strategic investment, regulations, taxes and incentives that encourage private sector prosperity. In large part, this is because they are more responsive to local conditions. Many academic planners, policy gurus, and national media have tended to favor large government units as the best way to regulate and plan for the future. But central planners consistently seek to reduce the influence exercised by the plethora of villages, towns, and cities in the United States: well over 65,000 general-purpose governments. With so many “small towns,” the average local jurisdiction population in the United States is 6,200, small enough that nonprofessional politicians can have a serious impact on local issues.

    The American preference for solving problems at the state or local level should be central to the government role in job creation. One size determined in Washington will not fit all. South Dakotans and Californians will prefer to address employment problems in different ways. Within the limits of constitutional rights, we should let them try their hand, and let everyone else learn from their success or improve upon their policies.

    Indeed, many Americans on both the right and left are instinctive decentralists. Our economic evolution mirrors this trend. America’s entrepreneurial urge, in contrast to developments elsewhere, has actually strengthened. In 2008, 28% of Americans said they had considered starting a business—more than twice the rate for French or Germans. Self-employment, particularly among younger workers, has been growing at twice the rate of the mid-1990s.

    For this reason, supporting new businesses—and small and medium-sized firms—by ensuring that they can get the credit they need is an essential piece of the job-creation picture. For jobs to grow, these businesses must thrive.

    Innovation and Entrepreneurship Are the Key to Solving the Jobs Imperative

    America will depend on its emerging population of younger workers to keep expanding its economy. In the 1970s, when the coming-of-age of the boomers began to impact the labor market, labor force growth created a period of higher unemployment. Now, we could see a reoccurrence as the large millennial generation starts to seek employment. Yet now, as then, predictions of a long term labor glut could well change as these workers find and develop new opportunities.

    This happened to the boomers in the late 1980s, when talk of long-term high unemployment was replaced with concerns over a labor shortage. The growth of new industries tied to the use of computers, and later of the internet, created a surge in demand for skilled workers. As boomers integrated into the workforce and were replaced by less numerous generation “X”-ers at the entry level, companies fretted increasingly about a diminishing pool of workers.

    The opportunities for employment created by the rise of new industries, and by the innovative expansion of established businesses, cannot be underestimated. Such innovation has long been the source of new growth for the American economy, although the exact nature of that innovation is impossible to predict. Much of the pioneering will likely come from skilled immigrants, who are
    estimated to have started a quarter of all venture-backed
    public companies between 1990 and 2005.

    This enterprising spirit reflects a broad, long-term American trend. U.S. employment has been shifting not to mega corporations, but to individuals and smaller units; between 1980 and 2000, the number of self-employed individuals expanded tenfold to comprise 16 percent of the workforce.

    The smallest businesses—the so-called microenterprises— have enjoyed the fastest rate of growth. By 2006 there were some twenty million such businesses, one for everysix private-sector worker. Hard economic times could slow this trend, but historically, recessions have served as incubators of innovation and entrepreneurship. Many of the individuals starting new firms will be those who have recently voluntarily left or been laid off by bigger companies.

    The Vital Role of Infrastructure and Basic Industries

    To succeed in the mid-21st century, Americans also will need to pay more attention to the country’s basic industries. Some assume that the American future can be built around high-end “creative” jobs, without ever reviving the industrial economy or rebuilding our physical infrastructure. In the America envisioned by advocates of “the creative economy,” our productive facilities would serve mainly as tourist attractions, much as we now visit restored pioneer villages.

    Such an approach assumes that our rising competitors, notably China and India, will surrender high value activities such as media, finance and engineering. This is a dangerous and historically ill-considered assumption. In the 1980s, Japanese firms that were widely written off as “copycats” became primary innovators, particularly in automobiles, semiconductors, and computer games. In the coming decades, Chinese, Indian, and Brazilian companies—to name a few—will seek to move from low-wage work to more specialized, innovative kinds of products. The enormous revenues generated from the less trumpeted activities will provide the funds to invest in their move into ever higher-end activities.

    Americans can create a more prosperous future, but only if we focus on maintaining the physical infrastructure necessary for basic production and transportation, as well as on developing the intellectual prowess of our citizenry. America’s unique demographics require the country to pay attention not only to high-tech industries or financial services, but also to the basics: construction, manufacturing, agriculture, and energy.

    These critical industries underpin our prosperity and employ our expanding blue-collar workforce. They can provide new opportunities for the majority of workers who do not possess four year or advanced college degrees. In 2005, the National Association of Manufacturers, the Manufacturing Institute, and Deloitte Consulting surveyed eight hundred U.S. manufacturing firms: More than 80% reported that they were “experiencing a shortage of qualified workers overall.” Nine in ten firms stated that they faced a “moderate-to-severe shortfall” of qualified technicians. By 2020 this shortage could grow to 13 million workers. A resurgent manufacturing sector would also boost the country’s technological workforce. By 2007, industry employed about a quarter of the nation’s scientists and related technicians.

    This revived focus on production would help large swaths of the country. The Great Plains area, which is still profiting from industrial and agricultural expansion, would benefit, as would the Great Lakes, which has weathered so many challenges in recent decades. Historically neglected regions such as Appalachia would also profit.

    The Critical Role of States

    America is a vast country made up of hundreds of diverse economies. From early on, very different industries clustered in different places. There has been wide divergence in the skills and abilities of local populations. Although federal intervention is necessary in certain areas—for example, in creating national research institutions or interstate transportation—it is often at the state or local level that the best policies for a particular region can be developed.

    The need to tailor economic development to local needs has been a critical aspect of the success of our federal system. By giving a state wide leeway to develop its own solutions to the jobs imperative, we would be providing the other states with potential role models—as well as a warning system of policies to avoid—in their own strategies. The states are described in the famous opinion issued by Supreme Court Justice Louis Brandeis as places that “serve as a laboratory” where the nation can “try novel social and economic experiments without risk to the rest of the country.”

    States have often been leaders in fashioning progressive approaches to economic development. Private and state-sponsored development created the initial network of roads, canals, and steamboats that knit together regional economies. When President James Madison vetoed federal funding for the Erie Canal in 1817, the New York legislature used its own tax and credit resources to complete the 363 mile system eight years later. Eventually the canal helped assure the Empire State’s national preeminence. Other states, including Pennsylvania, Ohio, Indiana, Illinois, Maryland and Virginia, followed suit with their own canal-building projects.

    In the 1920s and 1930s states—and some municipalities—also invested heavily in wealth-creating infrastructure, including highways and water and power systems. These investments supplemented significant new underwriting of projects from private corporations. States continued to make these investments throughout the 1950s.

    At the time, no state was more successful at developing its economy than California. Under both Republican and Democratic Governors, California developed what has become a widely accepted model of local economic development based on the expansion of traditional infrastructure—roads, bridges, water and energy systems—matched by massive investments in “human capital”, including a master plan for higher education that spanned the elite universities to the community colleges.

    California’s state investment and business promotion policies inspired other states, notably Texas and North Carolina. This state role was also embraced by the young Governor of Arkansas, Bill Clinton. Faced with the issues of a poor, racially divided state, Clinton recognized that, given the deep divisions in Washington, “There is no alternative to continued intense state efforts to deal with our most pressing domestic problems.”

    Although unemployment dropped, there remained problems relating to national competitiveness and declining middle class wages, Clinton argued. But he continued to believe in the exercise of local power. “In a country as complex and diverse as ours, in which most job growth is generated by small business,” he noted, “many of these [economic] issues will almost have to be dealt with at the state level.”

    In David Osborne’s landmark work, Laboratories of Democracy, he described how the late 1980s and early 1990s saw the emergence of a whole host of innovative Governors. The “first agenda” of these Governors, Osborne noted, was “creating economic growth”, a notion Governor Clinton later used effectively in his campaign for the Presidency.

    In today’s federal-level climate, states could potentially play a more significant role than they did in the ‘80s and ‘90s. Chuck McCutcheon, co-editor of Politics in America at CQ-Roll Call Group, suggests that continued DC “political gridlock” makes the states better suited to deal with major policy issues. At the state and local levels, he suggests, politicians are more likely than their highly polarized federal counterparts to “get along” with each other.

    Conclusion: The Power of the States to Lead the Jobs Imperative

    Ultimately, states and localities are best qualified to meet the jobs imperative. As Alexis De Tocqueville observed, it is natural that citizens of a state or locality are more solicitous about “the increasing prosperity of his own district,” and this serves “to stir men more readily than the general interests of the country and the glory of the nation.”

    As our country grows, reaching 400 million people by 2050, the differences between our various states and communities will grow. We will have more diverse regional economies, demographics and cultures. We need to look at these local sources—what Thomas Jefferson called “our little Republics”—to lead the jobs imperative. It is an imperative upon which depends the future success of our entire nation.

    Read the full report.

    Praxis Strategy Group is an economic development, analysis, and strategic planning firm. Joel Kotkin is executive editor of NewGeography.com and author of The Next Hundred Million: America in 2050

  • Shanghai: The Rise of the Global City

    The opening of the World Expo heralds Shanghai’s coming of age, the rising economic might of China, and the financial power of Asia’s legendary metropolis.

    But that’s only part of the story. The World Expo also reflects the rise of Shanghai as a global city and the intensity of competition among emerging Chinese mega-cities.

    At the eve of the World Expo, Shanghai was buzzing with anticipation and excitement. Presented by 192 countries and 50 international organizations, the World Expo will continue for six months. It will also be the largest world exhibition ever and is expected to attract 70 million visitors from home and abroad.

    With a population of over 20 million people, Shanghai is a hugely popular tourist destination renowned for its historical landmarks such as the Bund with its historical buildings lining the Huangpu River. In turn, Shanghai’s increasing financial power and China’s rapid economic development is reflected by the ultra-modern and ever-expanding Pudong skyline, with the Oriental Pearl Tower, the Jin Mao, and the 492-meter (1,614 ft) World Financial Center.

    For foreign sinologists, the World Expo heralds not only the resurgence of the great metropolis, but the “comeback of the city’s brash patrons.” In reality, Shanghai’s comeback started in the early 1990s, and today the resurgence of the colossal city may still be in its infancy.


    China Pavilion Preview
    Theme: Chinese Wisdom in Urban Development
    The main structure of the China Pavilion, “The Crown of the East,” has a distinctive roof, made of traditional dougong or brackets, which date back more than 2,000 years.


    Shanghai Pavilion
    Theme: New Horizons Forever
    Taking the form of Shikumen, Shanghai Pavilion seeks to blend history and modernism, the East and the West.

    In 2005, the wealthiest metropolises, as measured by their estimated GDP, were still led by the great urban centers of the leading advanced economies. By 2020 a third of these wealthy cities will be in the large emerging economies. Shanghai‘s strategic position at the mouth of the Yangtze River has made it an ideal location to assume a position in the urban paragon.

    In fact, Shanghai and the Yangtze River Delta already constitute one of the largest concentrations of adjacent metropolitan areas in the world. It is the home to some 80-90 million people with GDP (PPP) of some US$2 trillion, or about the economic size of France. However, unlike France, which is growing at the rate of 1-2 percent in 2010-2011, Shanghai enjoyed a double-digit growth in 1992-1997 and continues to grow at about 8-9 percent per year.

    Shanghai’s Resurgence

    Originally a fishing and textiles town, Shanghai grew to importance in the 19th century. The rapid development of the city began in the aftermath of the Opium War of 1840 when the Western powers forced China to open five of its coastal cities, including Shanghai, to foreign trade. The colonial powers forced the weak Qing government to sign treaties granting them the right to establish foreign concessions. In Shanghai, the part of the city proper west of the Huangpu River grew ever larger in size, whereas Pudong on the east side of the river was left untouched.

    Back in 1918, founder of the Republic of China, Dr. Sun Yat-sen put forward the idea of building a major harbor in East China with Pudong as its base. By the 1920s and the early 1930s, Shanghai was a major center of international trade and finance in the East Asian region.

    Shanghai’s Pudong and the Lujiazui Financial District

    In the late 1930s and 1940s, Shanghai was engulfed by one calamity after another. First it was battered by the currency crisis in 1935, the Sino-Japanese War starting in 1937, the onset of the Pacific War in late 1941 and, in the aftermath of World War II, the Civil War (1945-1949).

    After the declaration of the People’s Republic of China in 1949, most foreign firms moved their offices to Hong Kong, as part of an exodus of foreign investment. As Shanghai fell into a historical oblivion, Hong Kong thrived. The “Pearl of the Orient” lost its position as East Asia’s main financial center.

    During the 1950s and 1960s, Shanghai was transformed into an industrial center. It paid a crippling price in terms of taxes; until 1990, one-sixth of the central government’s revenue came from Shanghai. After China embarked on its open-door policy in the early 1980s, things began to change. After decades of neglect,there rose a resurgence of trade and investment.

    A Wedding Couple by the People’s Heroes Memorial on the Bund

    The great transformation came in the early 1990s, when Deng Xiaoping declared that Shanghai would be “the head of the dragon” pulling the country into the future. The development of Pudong helped to restore Shanghai’s historical role for the Yangtze River Delta and, more broadly, to China.

    In a whirlwind of two decades, Shanghai increased its role in finance, banking, and as a major destination for corporate headquarters. It became a major lure to the highly educated portion of China’s workforce.

    Dusk in Pudong’s Financial District

    Tale of Two Cities

    Since the early 2000s, Shanghai and Hong Kong have increasingly been seen as rivals for the economic center of the Greater China region. Hong Kong has the advantage of a less opaque legal system, international market integration, broader economic freedom, greater banking and service expertise, lower taxes, and a fully-convertible currency. Shanghai has stronger links to both the Chinese interior and the central government, and an impressive base in manufacturing and technology.

    Since the late 1990s, Shanghai has been booming and thriving, while Hong Kong, despite its historical wealth and capabilities, has been haunted by anxiety and doubt over the future. Yet Hong Kong remains one of the world’s great financial centers. According to Financial Development 2009 by the World Economic Forum (WEF), Hong Kong ranks 5th worldwide in terms of financial sector development. Along with Tokyo and Singapore, it stands as one of the premier financial centers in Asia.

    With the recent global financial crisis, Asian cities are closing in on London and New York as leading financial centers. Although still behind Hong Kong, Shanghai has been catching up.

    The financial strength of Hong Kong has been boosted by decades of globalization. The rise of Singapore as a financial center has been also driven by determined government policies and multinational investment. Shanghai’s emergence as a future financial hub has been shaped by similar forces: years of financial reforms and multinational investment and more recently, a strong support by the central government.

    In early 2009, China’s State Council approved Shanghai’s plans to position itself into one of the world’s leading financial and shipping centers by 2020. A month later, five major trading cities – including Shanghai – got the nod from the central government to use the yuan in overseas trade settlement, which reflects China’s recent, gradualist moves to expand the use of its currency globally.

    In the long term, China will play a major role in the emerging global financial architecture. What is less certain is how this emergence will shape the roles of Shanghai and Hong Kong. Already Shanghai’s stock market is worth more than Hong Kong’s, but the city’s financial sector lacks Hong Kong’s depth and the breadth. Hong Kong has an active financial futures market, whereas Shanghai trades commodities futures. In fixed income markets, Hong Kong is far more active in global bonds than Shanghai, which is far more active in domestic currency trading.

    A big barrier: the Hong Kong dollar can be traded freely in international markets, whereas China’s RMB is not fully convertible. But over time this barrier will dissolve. Hong Kong’s regulatory system is considered independent and transparent, whereas Shanghai’s whereas Shanghai’s regulator is part of the government’s state council. In addition to the regulatory regime, there are substantial systemic differences with legal system and taxation.

    In the future, some observers expect China to have a single dominant financial center. Others believe that, due to China’s massive size, multiple centers are conceivable. In the third scenario the assumption is that, in the medium-term, Shanghai and Hong Kong will co-exist as complementary centers. But in the long-term, Shanghai will become China’s international financial center.

    Competition of Chinese Cities

    As can be seen in other parts of the world, there is increased competition among China’s cities. But since the number and scale of Chinese cities is far higher relative to their counterparts in advanced economies, the implications of Chinese urban rivalry are broader and global.

    Having suffered relative decline since the establishment of the People’s Republic of China, Shanghai’s population base increased faster relative to other cities only briefly during the massive infrastructure projects of the 1990s. Economically, Shanghai is still growing, but doing so more slowly relative to other Chinese first-tier cities such as Beijing, Shanghai, Guangzhou, Shenzhen, and in particular the emerging second-tier cities such as Chengdu, Dalian, and Shenyang. In the footprints follow the third-tier cities from Harbin to Ningbo and the fourth-tier cities from Kunming to Hefei.

    The criteria for these tiers comprise GDP per capita adjusted to purchasing power parity, level of economic development, property markets, foreign direct investment, distance to ports, and so on. As productivity levels are increasing in the more prosperous cities, the old low-margin industries are migrating to poorer regions. The process of migration predates the global crisis, but the latter has amplified it. Today, Shanghai’s growth model is predicated increasingly on innovation and high-value industries.

    Yet despite the rise of second and third tier cities, the true competition for global financial preeminence in China will boil down to a contest between Shanghai and Hong Kong. However, it may not result in a win-lose scenario. As Shanghai is evolving into China’s global financial hub, Hong Kong’s efforts to accelerate IPOs and regional innovation and the proposed merger of Hong Kong and Shenzhen could support a Nasdaq-like stock exchange in the future Pearl River Delta Metropolis.

    Meanwhile, China is giving rise to a number of megacities, which seek for specialized competitive advantages. The central government is urging and providing incentives for the wealthiest urban centers to cooperate with other cities in order to accelerate urban growth regionally. Shanghai is no exception; emulating the lessons of the Pearl River Delta, it is boosting the regional innovation system in its Yangtze River Delta.

    Shanghai’s advantage lies in its size and industrial diversity, the competitiveness of several manufacturing subsectors, and the emergence of business services. At the same time, Shanghai’s expanding technological capabilities are being nurtured by a deepening pool of human capital, increasing R&D, FDI in high-tech activities, and the openness of the city to the rest of the world. The dynamic megapolis is driven by a growing middle class, which is feeding a nascent demand for innovation. With its advanced services, large population base, and China’s largest retail sales, Shanghai is well-positioned to emerge as China’s premier business city.

    Just as New York City exemplified the strengths and aspirations of emerging America in the 20th century, Shanghai, perhaps more than any old or emerging rival, will personify the capabilities and dreams of rising Asia in the 21st century.

    Dr. Dan Steinbock is research director of international business at the India, China and America Institute (USA). He currently also serves as senior fellow at the Shanghai Institute for International Studies (SIIS), and visiting professor at the Shanghai Foreign Trade Institute. He focuses on the post-crisis integration of G-7 and BRIC economies worldwide and advises companies, governments and municipalities on issues of competitiveness and innovation. He divides his time between New York City, Shanghai and Guangzhou, and occasionally Helsinki, Finland.

  • When Saving 90% is Not Enough: The Transit Savings Report

    The American Public Transportation Association (APTA) is publishing monthly Transit Savings Report to illustrate the purportedly great savings that can be achieved by giving up the car and traveling by transit instead. APTA compares the average cost of buying a monthly transit pass to replace a car, which is assumed to travel 15,000 miles annually.

    The latest edition was made public on April 6 and reveals astounding savings, as was reported by The Wall Street Journal and other press-release echoing press outlets. The APTA release indicates that households could save from $8,174 to $13,784 annually by giving up a car for transit in the 20 urban areas with the highest transit ridership. Overall, the APTA figures calculate to an average savings of $10,183. The APTA press release does not say how much the monthly bus pass would cost. However, our own quick survey of 17 major transit systems indicates that a monthly pass averages approximately $90 per month, or $1,080 per year. This means that getting rid of the car and riding transit instead saves approximately 90%, ($10,183 divided by [$1,080 + $10,183]) at least according to APTA (Note).

    With savings such as these, a visitor from Mars to APTA’s Fantasyland might expect that nearly all urban travel should logically be by transit rather than by cars. But, alas, no. Nothing could be further from the truth. In fact, cars, which APTA tells us cost nearly 10 times transit, account for more than 98% of motorized travel in US urban areas.

    Profligate Americans? What could possibly explain this paradox? Surely, there is plenty of evidence that Americans would much rather spend less than more on products of equal value. This has been painfully evident to “legacy” airlines that have had to lower their prices to compete with discount carriers like Southwest Airlines. Traditional supermarkets have lost hoards of customers stores like Wal-Mart or Costco over amounts that pale by comparison to the savings that APTA would have us believe are so readily available by rejecting our “love affair” with the automobile.

    Of course, the choice is not that simple. Americans no more have a love affair with the automobile than with flush toilets or refrigerators. The American (and Canadian, Australian, European and Asian) love affair is not with products, but rather with the better life style that the products make possible. People have refrigerators because they keep food fresh and prevent spoiling. Under certain circumstances, however, refrigerators are not practical, such as when one uses a cooler instead at a picnic. Transit is like that. It makes sense for some trips, but not a large share in the overall scheme of things.

    The Largest Downtowns: Where Transit Works Best: For the overwhelming majority of trips, the automobile provides much faster and generally more comfortable travel than can be made available by transit. There are times, however, when transit is superior. For example, the car is particularly impractical for commuting into crowded Manhattan, which is served by an enormous subway, commuter rail and bus system that extends to the further reaches of the metropolitan area.

    This is evident in data from the latest US Bureau of the Census American Community Survey, which indicates that transit accounts for 80% of the motorized commuter travel to Manhattan. Manhattan’s business district has nearly 2,000,000 jobs in a relatively small area, and riding transit and the average transit commute is only slightly longer than the average car commute. With Manhattan’s world class traffic, transit is a demonstrably superior competitor to the car.

    This, in reality, simply demonstrates that transit is “about downtown.” Consumer preferences demonstrate that commuting to some of the nation’s largest downtown areas is better by transit. The impressive skyscrapers can leave the impression that downtowns are dominant in metropolitan employment. However, downtowns represent only 10% of metropolitan employment. The largest downtowns are well situated for transit service, by virtue of their high employment densities and the fact that transit systems focus on them.

    These include central business districts, including New York’s Manhattan and Brooklyn, Chicago, Boston, Philadelphia and San Francisco. All of these downtown areas where transit is dominant were added together, they would cover barely one-third of the expanse Orlando’s Walt Disney World. But consumer preferences also show that the car provides superior mobility to virtually all other destinations. Our already heavily indebted public sector could not begin to provide a level of service to replicate transit’s downtown access throughout the urban area.

    Transit even has difficulty competing in the dense outer boroughs of New York City. While slightly more people commute to Brooklyn jobs by transit than by car, the reverse is true in the Bronx. Twice as many people commute to jobs in Queens by car than transit, despite the borough’s having a population density greater than that of San Francisco, the nation’s second most dense large municipality.

    Transit’s share falls off even more sharply in the suburbs of New York. Nine times as many people commuting to jobs in inner suburban Nassau County use cars as use transit. Commuters to outer suburban Suffolk County use cars 40 times as much as transit.

    Consumers make these choices not because cars are inherently superior to transit or vice versa. A commuter who lives in New Brunswick, New Jersey and works in Manhattan, usually takes a New Jersey Transit train or bus to work, because the car competes poorly for such a trip. The neighbor, however, who works in the suburban I-287 corridor takes the car, because transit cannot compete for that trip.

    It remains true that for the overwhelming majority of trips cars meet the needs of consumers far better than transit. Cars are faster and deliver people within walking distance of their destinations.

    Even the ultimate — making transit free — makes little difference. In 1990, Austin, Texas eliminated fares. Yet the share of travel in the Austin area by car declined about a quarter of one percent. For most urban travel, transit is so uncompetitive that you can’t even give it away.


    Note: None of the above should be interpreted to be an acceptance of the APTA figures. APTA assumes annual parking costs of $1,850, yet most parking outside downtowns. Some might object that there is a cost to this free parking, but to ignore its costs is quite appropriate, given that APTA’s figures do not include subsidies to transit, which would quadruple its cost. Further, APTA uses especially high costs for automobile use, which assume that everyone purchases a new car every five years. This substantially overstates the cost of cars relative to transit.

    Wendell Cox is a Visiting Professor, Conservatoire National des Arts et Metiers, Paris. He was born in Los Angeles and was appointed to three terms on the Los Angeles County Transportation Commission by Mayor Tom Bradley. He is the author of “War on the Dream: How Anti-Sprawl Policy Threatens the Quality of Life.

    Photo: New Jersey Turnpike

  • Arizona’s Short-Sighted Immigration Bill

    Arizona’s recent passage of what is widely perceived as a harsh anti-immigrant bill reflects a growing tendency–in both political parties–to focus on the here and now, as opposed to the future. The effort to largely target Latino illegal aliens during a sharp recession may well gain votes among an angry, alienated majority population, but it could have unforeseen negative consequences over time.

    In terms of the Arizona law, this is not simply a case of one wacko state. The most recent Gallup survey shows that more Americans favor the law than oppose it, with independents and Republicans showing strong support. Despite the negative coverage in the media, the Arizona gambit could somewhat pay off in November. A weak economy tends to exacerbate nativist sentiments, something that has been constant throughout much of American history.

    But there is a distinct danger for the GOP here, not only in Arizona but in the rest of the country as well. As Bill Frey of the Brookings Institute points out, there is a growing gap between the electorate, which is still largely white and older, and the much younger, far more rapidly growing Latino population. In Arizona Frey says the “cultural generation gap” between the ethnicity of seniors and children is some 40%, meaning that while 83% of senior are white, only 43% of children are. Nationwide, Frey estimates the gap in the ethnic composition of seniors and youths stands at a still sizable 25 points.

    Arizona’s large disequilibrium in the ethnicity of its generations is a product, in part, of the state’s historic pull to white retirees. Yet its formerly booming economy, based largely around construction and tourism, required a massive importation of largely Latino, low-wage labor, much of it illegal. As a result over the past two decades, Arizona’s Latino population has grown by 180%, turning what had been a 72% Anglo state to one that is merely 58% white.

    You don’t have to go very far–in fact just across the California border–to see what awaits Arizona’s nativist Republicans. The Grand Canyon state’s future has already emerged there. In the 1970s and 1980s California’s generally robust economy made it a primary destination for immigrants from both Asia and Latin America. Comfortable in their Anglo-ness, papers like the Arizona Republic were dismissing California as a “third world state,” particularly in the wake of the 1992 LA riots.

    Like their Arizona counterparts today, many white Californians then were sickened by pictures of mass Latino participation in looting during the riots. Many were also concerned with soaring costs of providing social services to a largely poor immigrant population. Sensing an opportunity, in 1994 Gov. Pete Wilson–locked in tough re-election battle amid a deep recession–endorsed Proposition 187, a measure designed to prevent illegal aliens from accessing public services. The measure passed easily, with support from both whites and African-Americans. The strong backing among Independents and even some Democrats helped Wilson win re-election with surprising ease.

    But the long-term consequences of 187 reveal the longer-term consequences for the GOP. During the Reagan era and even the first Wilson term, Latino voters split their votes fairly evenly between the parties. But after 1994 there was a distinct turn toward the Democrats, with the GOP share at the gubernatorial level falling from nearly half in 1990 to less than a third in subsequent election. In some cases, right-wing Republicans garnered even smaller portions of Latino voters.

    This is a classic case of the past waging war on the future. Since 1990 Latino and immigrant population has continued to grow. Overall, the percentage of foreign-born residents, according to USC demographer Dowell Myers, has grown from roughly 22% to 27%. One-third of Californians in 2000 were Latino; Myers projects Latinos will constitute almost 47% of the state’s population in 2030.

    The political consequences will only get worse for Republicans. Latino population voting power already has doubled from roughly 10% of the total in 1990 to 20% in 2006.

    This Latino population will become increasingly active and engaged. It is, for one thing, ever more English-fluent, and increasingly dominated by the second and third generations. This group could become permanently estranged, like African-Americans, from the GOP. If that happens, notes longtime Sacramento columnist Dan Weintraub, Republicans could “all but become a permanent minority party in California.”

    And the rest of the country will feel these trends; between 2000 and 2050, the vast majority of America ‘s net population growth will come from racial minorities, particularly Asians and Hispanics. Already one out of every five American children–tomorrow’s voters–is Hispanic.

    Of course, as Latinos integrate and intermarry, they may become less particular in their world view and share more in common with other middle-class Americans. Yet memories of slights against a particular group can overcome even economic self-interest. Blood often proves thicker than bank accounts. The tendency of Jews, a largely affluent and entrepreneurial tribe, to back often harshly anti-business Democrats has its roots in old world scars left from the pogroms in czarist Russia as well as the right-wing genocide in Nazi Germany. Some older voters recall the rabid anti-Semites once prominent in the American far-right as well as the more genteel exclusionism practiced by more refined upper-class Republicans.

    In the future, today’s images of shrill, anti-immigrant right-wing activists could resound for coming generations of Latinos as well as Asians and other newcomer groups. It could essentially deprive the Republican Party of voters who might otherwise consider the GOP option, handing the Democrats a permanently expanded base, not only in southwest but in much of the country.

    None of this is necessary or good for the country. Political competition for ethnic groups is a healthy thing for national interests and for the individual groups. Lock-step support by African-Americans may make them powerful within the Democratic Party, but it also means they can also be taken for granted when push comes to shove. And, of course, when they are in power, Republicans have little real political stake in confronting the serious issues facing black America.

    All this is particularly disturbing since competition for Latino voters should be intense. Heavily employed in construction and manufacturing industries, they have been badly hurt in the recession and their interests were not particularly addressed in the Obama stimulus plan. Many are also socially conservative, supporting, for example, California’s Proposition 8 ban on gay marriage.

    In coming months other proposed steps by the administration and its congressional allies, such as the proposed cap-and-trade legislation, could prove very tough on industries that tend to employ Latinos. Climate change-inspired moves against single-family homes–already in place in California–conflict directly with the aspirations of many Latinos as well as other immigrants who, unlike the usually affluent, homeowning white population, are still seeking the chance to buy their own home.

    But instead of fighting for their economic interests, the Arizona law has handed the Democrats a golden opportunity for to engage their own demagogy on race issues. Instead of having to defend their plans to restart the economy and reorient them to middle and working class needs, Democrats now can play to narrow racial concerns among Latinos while further bolstering the self-righteousness of their affluent, white, left-wing base.

    The reversion to racial politics prompted by the Arizona law ultimately does no good for anyone except “base-oriented” partisan campaign consultants, nativists and ethnic warlords. With all the long-term economic and social challenges that face this growing country, Phoenix’s folly marks an unfortunate step backward to our more shameful past and away from a potentially promising future.

    This article originally appeared in Forbes.com.

    Joel Kotkin is executive editor of NewGeography.com and is a distinguished presidential fellow in urban futures at Chapman University. He is author of The City: A Global History. His newest book is The Next Hundred Million: America in 2050, released in Febuary, 2010.

    Photo by Caleb Alvarado

  • Growing America: Demographics and Destiny

    Over the next four decades, American governments will oversee a much larger and far more diverse population. As we gain upward of 100 million people, America will inevitably become a more complex, crowded and competitive place, but it will continue to remain highly dependent on its people’s innovative and entrepreneurial spirit.

    In 2050, the U.S. will look very different from the country in 2000, at the dawn of the new millennium. By mid-century, the U.S. will no longer be a “white country,” but rather a staggering amalgam of racial, ethnic and religious groups, all participants in the construction of a new civilization whose roots lie not in any one country or continent, but across the entirety of human cultures and racial types. No other advanced, populous country will enjoy such ethnic diversity.

    The implications of this change will be profound for governments-perhaps in ways not now commonly anticipated. Many “progressives” believe a more diverse, populous nation will need more guidance from Washington, D.C., but a more complex and varied country will increasingly not fit well into a one-size-fits-all approach.

    Although the economic crisis of 2008 led to a rapid rise of federal power, there has been a stunning and largely unexpected push-back reflected, in part, by the tea party movement. Some states have passed laws that seek to restrict federal prerogatives on a host of issues. More importantly, public opinion, measured in numerous surveys, seems to be drifting away from major expansions of government power.

    Of course, most Americans would accede to the federal government an important role in developing public works, national defense and regulations for health and safety. But generally speaking, they also tend to believe that local communities, neighborhoods and parents should possess the power to craft appropriate solutions on many other problems.

    This also reflects our historical experience. From its origins, American democracy has been largely self-created and fostered a dispersion of power; in many European countries, and more recently in parts of Asia, democracy was forged by central authorities.

    Other periods of massive government intervention, most notably after the New Deal and the Great Society, also elicited reactions against centralization. But the current push-back’s speed and ferocity has been remarkable. Yet the often polarizing debate about the scope of federal power largely has ignored the longer-term trends that will promote the efficacy of an increasingly decentralized approach to governance.

    Perhaps the most important factor here is the trajectory of greater growth and increasing diversity of who we are and how we live. Not only are Americans becoming more racially diverse, but they inhabit a host of different environments, ranging from dense cities to urbanized suburbs, to smaller cities and towns, that have different needs and aspirations.

    Americans also are more settled than any time in our history-partially a function of an aging population-and thus more concerned with local developments. As recently as the 1970s, one in five Americans moved annually; in 2004 that number was 14 percent, the lowest rate since 1950. In 2008, barely one in 10 moved, a fraction of the rate in the 1960s. Workers are increasingly unwilling to move even for a promotion due to family and other concerns. The recession accelerated this process, but the pattern appears likely to persist even in good times.

    Americans also prefer to live in decentralized environments. There are more than 65,000 general-purpose governments; the average local jurisdiction population in the United States is 6,200-small enough that nonprofessional politicians can have a serious impact on local issues. This contrasts with the vast preference among academic planners, policy gurus and the national media for larger government units as the best way to regulate and plan for the future.

    Short of a draconian expansion of federal power, this dispersion is likely to continue. Roughly 80 to 90 percent of all metropolitan growth in the last decade took place on the periphery; at the same time, the patterns of domestic migration have seen a shift away from the biggest cities and toward smaller ones. As Joel Garreau noted in his classic Edge City, “planners drool” over high-density development, but most residents in suburbia “hate a lot of this stuff.” They might enjoy a town center, a paseo or a walking district, but they usually resent the proliferation of high-rises or condo complexes. If they wanted to live in buildings like them, they would have stayed in the city.

    Attempts to force major densification in these areas will be fiercely resisted, even in the most liberal communities. Some of the strongest anti-growth hotbeds in the nation are areas like Fairfax County, Va., with high concentrations of progressives-well educated people who might seem amenable to environmentally correct “smart growth”-advocating denser development along transit corridors. As one planning director in a well-to-do suburban Maryland county put it, “Smart growth is something people want. They just don’t want it in their own neighborhood.”

    The great long-term spur to successful dispersion will come from technology, as James Martin first saw in his pioneering 1978 book, The Wired Society. A former software designer for IBM, Martin foresaw the emergence of mass telecommunications that would allow a massive reduction in commuting, greater deconcentration of workplaces and a “localization of physical activities … centered in local communities.”

    Technology would allow skilled people to congregate in communities of their choice or at home. Today not only knowledge workers but also those in construction trades, agriculture and other professions are home-based, conducting their operations out of trucks, vans or home offices.

    Many leading-edge companies now recognize this trend. As much as 40 percent of IBM’s work force operates full time at home or remotely at clients’ businesses. Siemens, Hewlett-Packard, Cisco, Merrill Lynch and American Express have expanded their use of telecommuting, with noted increases in productivity.

    At the same time, employment is shifting away from mega-corporations to smaller units and individuals; between 1980 and 2000, self-employed individuals expanded tenfold to include 16 percent of the work force. The smallest businesses, the microenterprises, have enjoyed the fastest rate of growth, far more than any other business category. By 2006 there were some 20 million such businesses, one for every six private-sector workers.

    Hard economic times could slow this trend, but recessions have historically served as incubators of innovation and entrepreneurship. Many individuals starting new firms will have recently left or been laid off by bigger companies, particularly during a severe economic downturn. Whether they form a new bank, energy company or design firm, they will do it more efficiently-with less overhead, more efficient Internet use and less emphasis on pretentious office settings. In addition, they will do it primarily in places that can scale themselves to economic realities.

    Simultaneously the Internet’s rise allows every business-indeed every family-unprecedented access to information, something that militates against centralized power. Given Internet access, many lay people aren’t easily intimidated into accepting the ability of “experts” to dictate solutions based on exclusive knowledge since the hoi polloi now possess the ability to gather and analyze information. Even the powerful media companies are rapidly losing their ability to define agendas; there are too many sources of information to mobilize mass opinion. The widespread breakdown of support for climate change is a recent example of this phenomenon.

    Once the current drive for centralization falters, support for decentralization will grow, including progressive communities that now favor a heavy-handed expansion of federal power. Attempts to impose solutions from a central point will be increasingly regarded as obtrusive and oppressive to them, just as they would to many more conservative places like South Dakota. In the coming era, in many cases, only locally based solutions-agreed to at the community, municipal or state level-can possibly gather strong support.

    This drive toward dispersing power will prove critical if we hope to meet the needs of an unprecedentedly diverse and complex nation of 400 million. New forms of association-from local electronic newsletters to a proliferation of local farmers markets, festivals and a host of ad hoc social service groups-are already growing. Indeed, after a generation-long decline, volunteerism has spiked among Millennials and seems likely to surge among downshifting baby boomers. In 2008, some 61 million Americans volunteered, representing more than one-quarter of the population older than 16.

    It’s these more intimate units-the family, the neighborhood association, the church or local farmers market-that constitute what Thomas Jefferson called our “little republics,” which are most critical to helping mid-21st-century America. Here, our nation of 400 million souls will find its fundamental sustenance and its best hope for the brightest future.

    This article originally appeared in GOVERNING Magazine.

    Joel Kotkin is executive editor of NewGeography.com and is a distinguished presidential fellow in urban futures at Chapman University. He is author of The City: A Global History. His newest book is The Next Hundred Million: America in 2050, released in Febuary, 2010.

    Photo by slynkycat

  • Is Sweden a False Utopia?

    By Nima Sanandaji and Robert Gidehag

    Sweden is often held up by American pundits and experts as a kind of Utopia, a country to be emulated. As is often the case when dealing with Utopias however, the complexities of history, culture and policy frequently are shoved aside.

    Rather than being guinea pigs in a progressive experiment in social engineering, Swedes are a unique people with a long history. Therefore, we should question the lazy assumption that good Swedish outcomes (long life expectancies, social equality) are due to particular Scandinavian policies (the welfare state).

    After all, even before the high-tax welfare state, Sweden was characterized by an even distribution of income, low poverty and long life spans, the same phenomena that today are said to be the result of high-tax welfare policies. In 1950, before the high-tax welfare state, Swedes lived 2.6 years longer than Americans. Today the difference is 2.7 years.

    A more reasonable view of why Sweden performs well on many social metrics has its basis in history and sociology: Swedes have for hundreds of years benefited from sound low-level institutions, such as a strong work ethic and high levels of trust and cooperation.

    These cultural phenomena do not disappear when Swedes cross the Atlantic to the supposedly inferior “cowboy” country. On the contrary, they appear to bloom fully. The 4.4 million Americans with Swedish origins are considerably richer than the average American. If Americans with Swedish ancestry would form their own country their per capita GDP would be $56,900, more than $10,000 above the earnings of the average American.

    The old Sweden, in contrast, has not done as well in economic terms. In 1960 taxation stood at 30 percent of GDP, roughly where the US is today. As taxes rose, economic growth decreased, with Sweden dropping from being the 4th richest country in 1970 to being the 12th richest in 2008. Swedish GDP per capita is now $36,600, far below the $45,500 of the US, and even further behind the $56,900 of Swedes in America.

    A Scandinavian economist once stated to Milton Friedman: “In Scandinavia we have no poverty.” Milton Friedman replied, “That’s interesting, because in America among Scandinavians, we have no poverty either.” Indeed, the poverty rate for Americans with Swedish ancestry is only 6.7%, half the U.S average. Economists Geranda Notten and Chris de Neubourg have calculated the poverty rate in Sweden using the American poverty threshold, finding it to be an identical 6.7%.

    Ironically, this points us towards the conclusion that what makes Sweden uniquely successful is not the welfare state, as is commonly assumed. Rather than being the cause of Sweden’s social strengths, the high-tax welfare state might have been enabled by the hard-won Swedish stock of social capital. It was well before the welfare state, when hard work paid off, that a culture with strong protestant working ethics developed.

    As taxes in Sweden have grown rapidly towards taking up half of the economy, that social capital is being eroded. In the 1990s, supposedly hyper-healthy Sweden established itself as being sickest country in the rich world, in terms of sick-leave. In addition, half a million working-age people (compared to a total labor force of four million) were placed in health-related “early retirement”.

    Labor union economist Jan Edling calculated that a fifth of working-age Swedes were supported by some form of public unemployment support, including sickness related leave in 2004, when the economy was growing strongly.

    The high-tax state has also created an increasingly threatened middle class. In a recent study, the Swedish Taxpayers association noted that wealth formation among the middle classes is weak. There is little correlation between earnings and wealth amongst Swedes.

    Instead of building capital, Swedes go into debt: 27 percent of Swedish households in fact have more debts than wealth, compared to between 16 and 19 percent in the US. With middle class wealth formation being held back by high taxes, Sweden has ironically developed a more unequal wealth distribution than the US. The Gini coefficient for ownership is almost 0.9 in Sweden, compared to slightly above 0.8 in the US.

    In short, there is much to admire in Sweden. But when it comes to economic policy and copying Swedish institutions, Americans are probably better off being inspired by Swedes in America, rather than Swedes in Sweden.

    Nima Sanandaji, is President of the Swedish think-tank Captus and Robert Gidehag is president of the Swedish Taxpayer´s association. They were assisted by Tino Sanandaji and Arvid Malm, chief economists at Captus respectively the Swedish Taxpayers Association.