Category: Demographics

  • The New Look of the American Suburb

    If you want an easy demonstration of the unsustainability of the classic American suburb, just take a drive around the inner ring suburbs of almost any city, starting with the ones that have a classic branching, winding streets, not traditional grids or those that grew up along transit lines. It is easy to find untold miles of decay, of “dead malls”, “grayboxes”, and subdivisions that have seen better days. If most of today’s new suburbs think they’ll fare any better, they are going to be in for a rude shock in 30 years or so.

    Some have argued that what we need are “suburban retrofits,” where older areas are redeveloped along new urbanist lines. While this is certainly an attractive option in some places, particularly in town center areas, the sheer quantity of decaying older suburbs means this isn’t a viable option across the board at the moment. Retrofits are hard to pull off and expensive to boot. There simply isn’t enough planner/political bandwidth or TIF dollars to make it happen on a wholesale basis. So we have to find some method to renew most of these areas in place.

    Enter immigrants. In older cities, immigrants were historically crammed into near downtown ghettos like the various “Chinatowns” and the like we see. Today, in cities that have them, those districts might still have a cultural role, but they are no longer the demographic core of their communities. Also, for cities without longstanding histories of immigration, these ghettos never developed. Instead, today immigrants disperse throughout metro areas. You find them everywhere from inner city neighborhoods to the most posh suburbs. One of the places along that spectrum you can find them are these inner ring suburbs.

    I want to share some pictures of immigrant driven revitalization of inner ring suburbs through some facts and photos from Indianapolis. But I think you’d find similar things in many cities across the nation.

    Indianapolis was traditionally one of America’s least diverse cities, featuring only the classic black-white split. But it has seen a large influx of immigrants in the last decade. Its metro foreign born population is only 5.19%, which is small, but the Indianapolis Star reported last year that this represented a 70% population increase since 2000. Unlike some towns which have seen immigration driven almost entirely from Mexico, Indianapolis has seen a very diverse set of immigrants, that come from all over the globe, including 26,000 Asians and 10,500 Africans. The Indian population has doubled to 6,000, the Pakistani and Nigerian populations have tripled to 1,000 each. There are 5,600 Chinese and 1,500 Burmese. These aren’t huge numbers today, but given the network effects of international immigration and the lead time to build a large community (remember the example of the large community from Tala, Mexico, which has its roots in the 1970’s), this represents a potential future tsunami of immigration, provided the economy stays strong, the local climate welcoming, and a bit of pro-active marketing takes place. Again, I’m sure we’d see similar diversity of immigrants in other cities, ranging from Detroit’s Arab community to Bosnians in St. Louis to Somalis in Columbus, Ohio.

    The most diverse area in Indianapolis is Pike Township on the northwest side. Though technically part of the city today, it is originally an inner ring suburban area. Its schools have children from 63 different countries speaking 74 different languages. The Lafayette Square area on the southeast boundary of Pike Township is a classic struggling inner ring commercial zone, complete with a dying mall.

    Yet the presence of all of those immigrants has led to a spontaneous renewal of parts of this struggling area in the form of businesses catering to local ethnic populations.

    One of them is a 62,000 square feet international supermarket called Saraga:


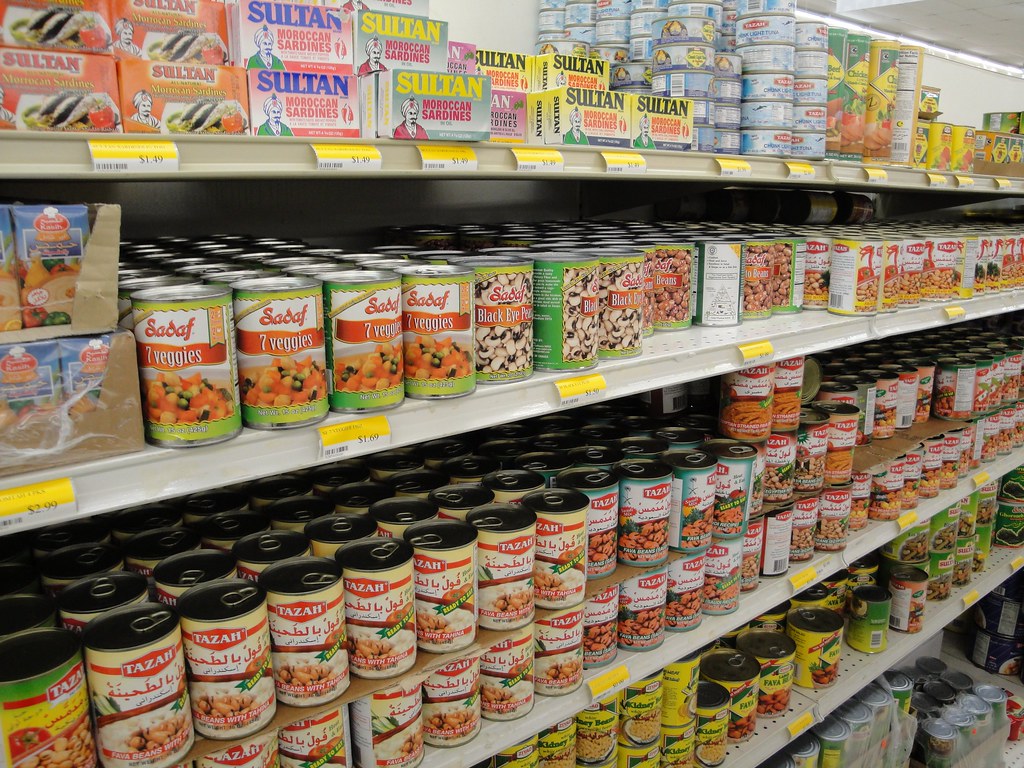
    Saraga is run by Korean brothers Jong Sung and Bong Jae Sung and features hundreds of spices and 40,000 products from around the world, ranging from house made kimchi to a halal meat department. Lest I stir up too much suspicion I didn’t take many photos inside the store, but wanted to share one shot of some of the contents from a Middle Eastern aisle:


    The owners are planning to open a second location on the South Side. They are facing a lot of competition from an array of new specialty markets in their current location, and also want to be positioned closer to the burgeoning immigrant community on the South Side and south suburbs. Not long ago the South Side of Indianapolis was stereotyped as the “redneck” side of town, but as American Dirt chronicled, this has changed a lot. While not part of the favored quarter, the South Side has increasing diversity both ethnically and in terms of incomes. Notably the South Side has become epicenter of the Indianapolis Sikh community.


    Saraga should be careful. There are already two Indian groceries and a Mexican grocery in Greenwood. Here is part of the competition in Lafayette Square:


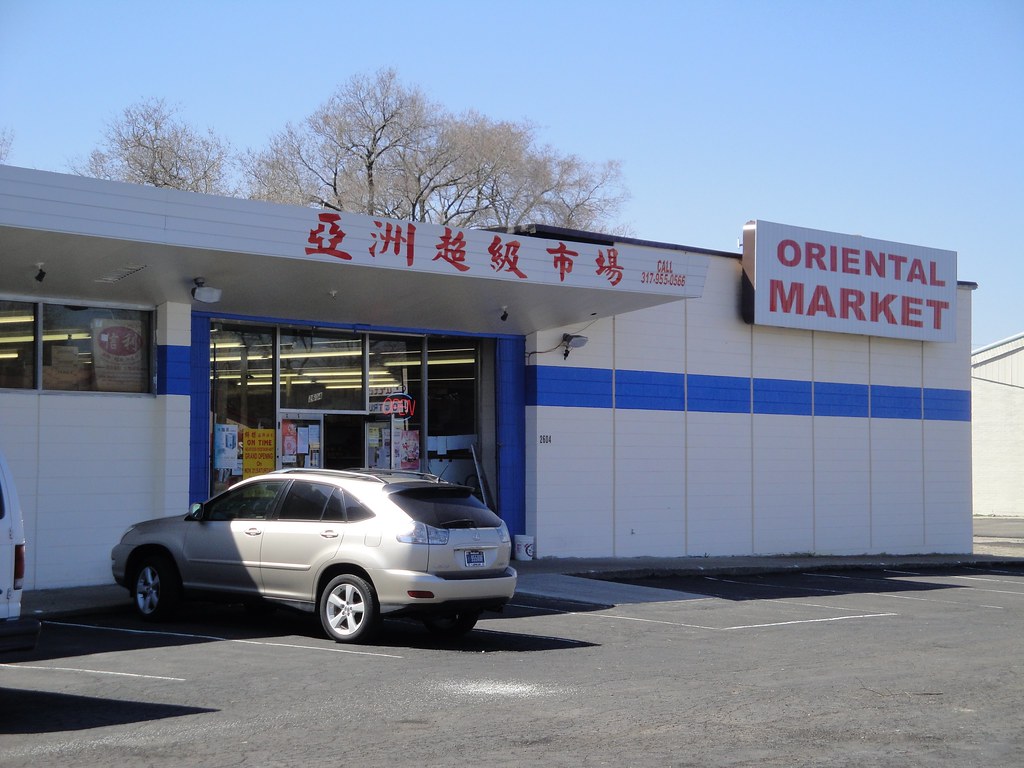
    This, and many of the other establishments, might not look like much. But imagine what it would look like if they weren’t there.

    Here’s one of my favorite signs from a nearby strip center, showing the diversity of establishments rubbing elbows:


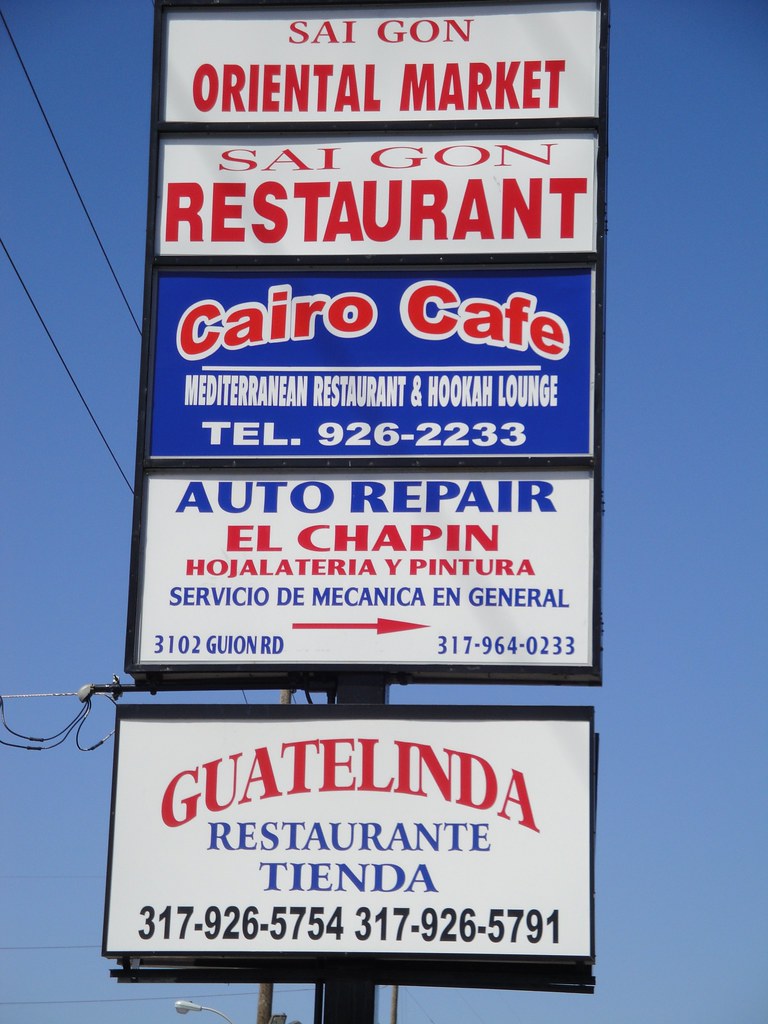
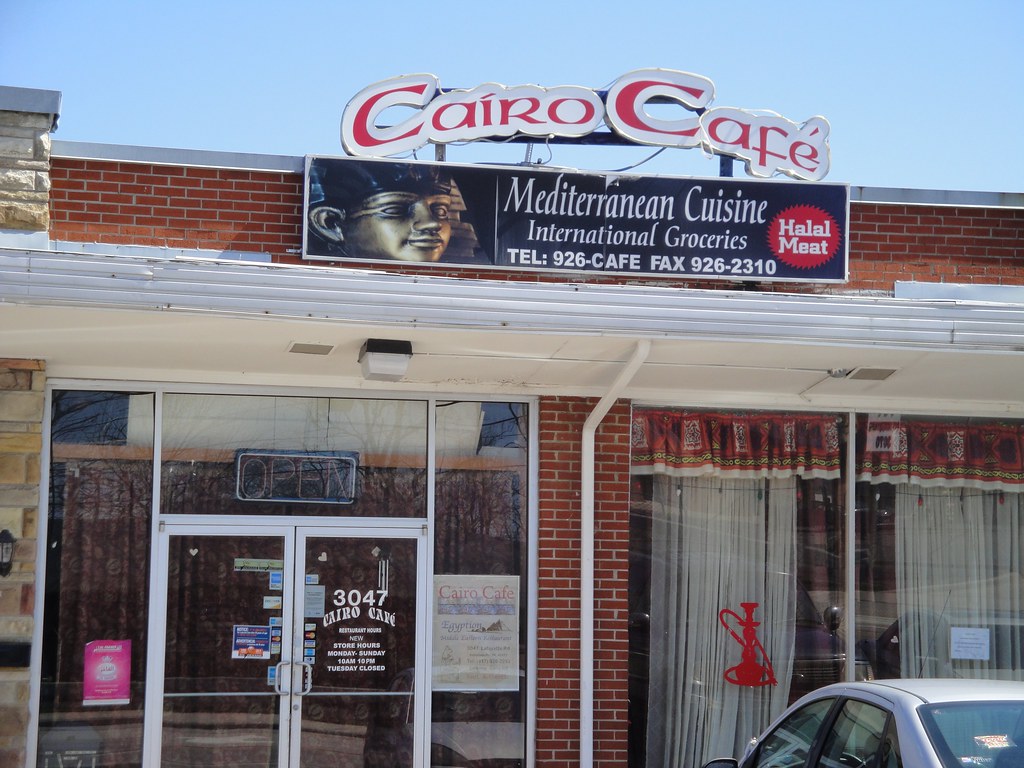
    The facade of Cairo Cafe shows a typical Indianapolis pattern, where an ethnic restaurant does double duty as a small scale specialty grocery.


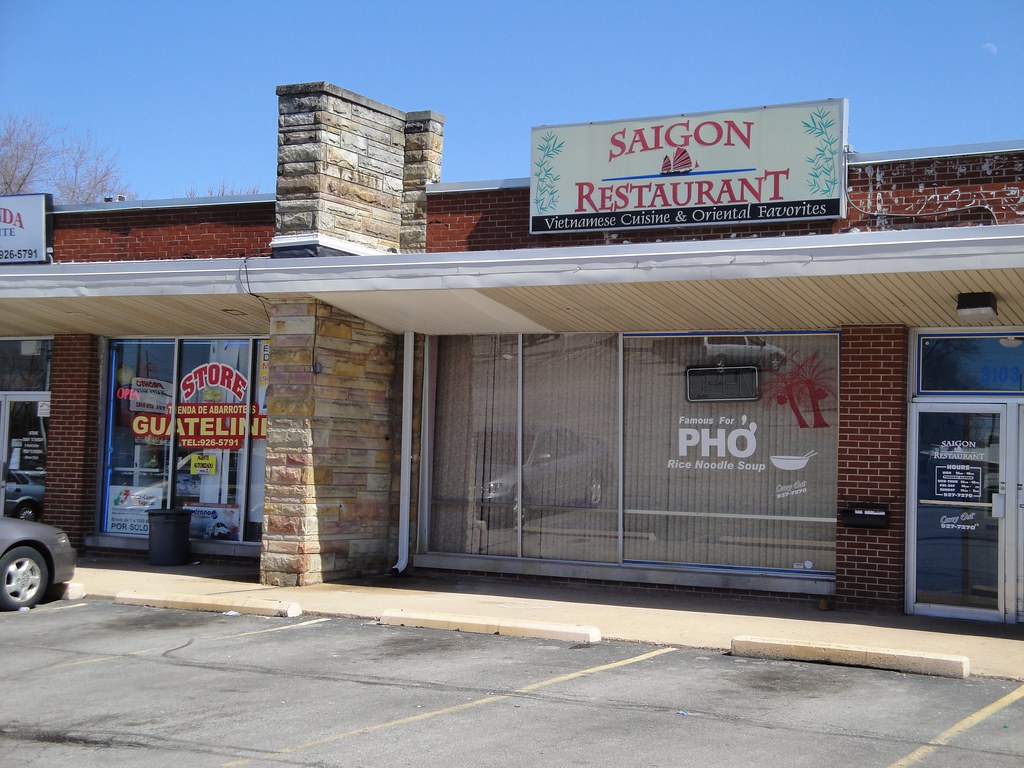
    It’s the same thing at the Vietnamese restaurant Saigon and Guatelinda. Saigon is beloved of hipsters, but I’ve got to confess I don’t think it is very good.


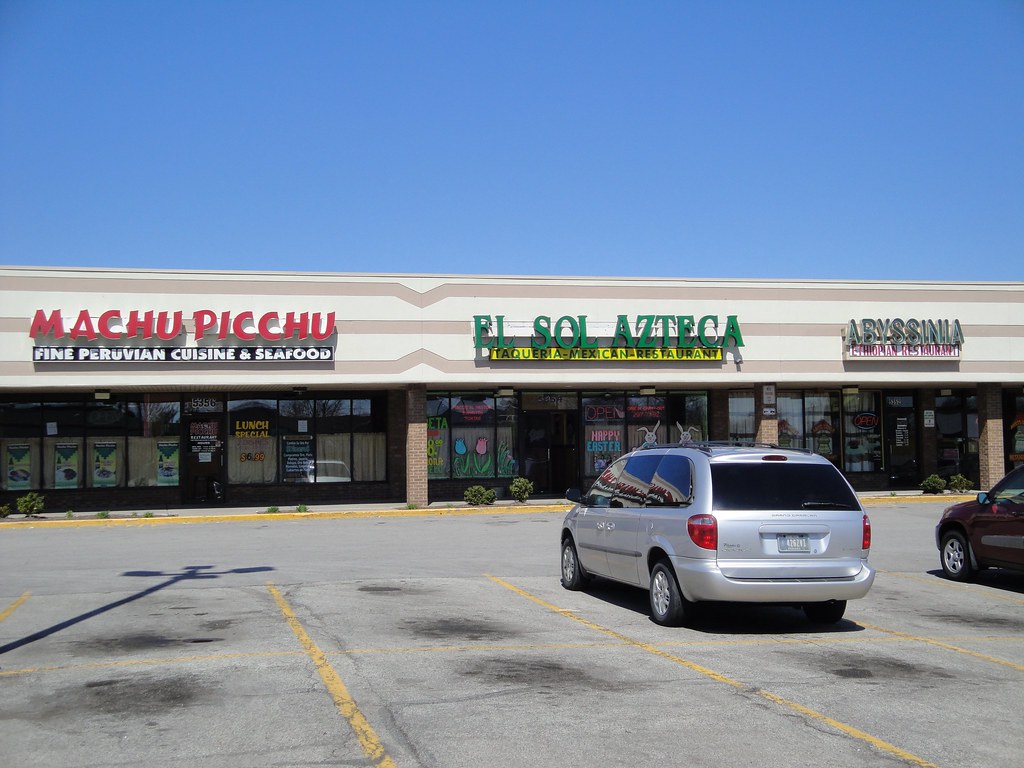
    Another nearby strip mall always blows my mind for the diversity of restaurants and stores it contains. You might need to enlarge this one to see, but it’s a Peruvian restaurant next to a Mexican restaurant next to an Ethiopian restaurant:


    A pastry shop next to another oriental market:


    Some type of Latino shop:


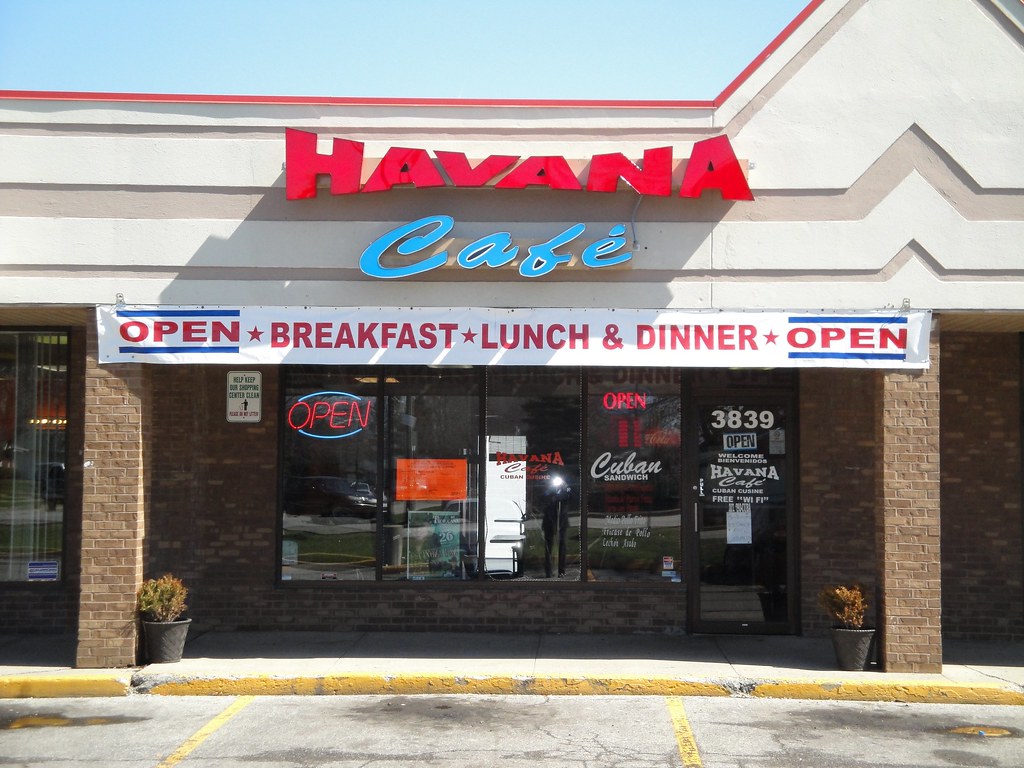
    A Cuban sandwich shop:


    Hopefully this gives you a flavor for how immigrants can be a force of renewal for older, struggling suburban area. I’ll admit I focused on food establishments, since that’s what’s most interesting to me, but there are plenty of others. This also shows the increasingly multi-cultural face of America, even in an interior city in the middle of Midwest corn country. If I were a city with lots of these struggling areas – and let’s face it, that’s most cities – I’d sure want to get me a lot more immigrants pronto.

    In the interest of completeness, I should also note that the Lafayette Square area has also become home to large number of independent black-owned businesses. In addition to being Indy’s immigrant heart, Pike Township has also emerged as a key hub for the region’s black middle class. That will have to be the topic of a future post, alas.

    Aaron M. Renn is an independent writer on urban affairs based in the Midwest. His writings appear at The Urbanophile.

    This article is re-posted from The Urbanophile.

  • Unaffordable Housing in Hong Kong

    For the past six years, Hugh Pavletich of Performance Urban Planning (Christchurch, New Zealand) and I have authored the Demographia International Housing Affordability Survey. The Survey assesses structural housing affordability by the use of the Median Multiple (median house price divided by the median household income). This measure is in wide use and has been recommended by the United Nations and the World Bank.

    Six nations are routinely covered, including the United States, the United Kingdom, Canada, Australia, Ireland and New Zealand. In each of these nations, the Median Multiple has been astonishingly similar, at least until recent years, with all six nations having had a Median Multiple of 3.0 or less until the last decade, or at the worst, the late 1980s. Of course, as Demographia and a world-class collection of economists have shown, house prices have risen substantially relative to incomes as a result of growth management (also called smart growth, urban consolidation) that ration land for development.

    For the first four years of the Survey, California markets were the most unaffordable, with Los Angeles exceeding 11 at one point, while San Francisco, Honolulu and San Diego exceeded 10. That all changed with the US housing bust, which was the most severe in California. As a result, Vancouver has become the most unaffordable major metropolitan area in the six nations, with a Median Multiple of 9.3 in the 2010 Survey. Sydney was a close second at 9.3.

    The South China Morning Post, Hong Kong’s leading English language newspaper, approached Demographia to estimate a Median Multiple for Hong Kong. This we were pleased to comply, given our interest in expanding the scope of the Survey to more than the six nations.

    It took a considerable amount of “digging” to develop the data, and a number of emails back and forth with The South China Morning Post. The result was an estimated Median Multiple for Hong Kong (the entire Special Economic Region) of 10.4. This makes Hong Kong the least affordable metropolitan area of the 273 Demographia has reported upon. The South China Morning Post illustrated this in an attractive graphic.

    At least temporarily, however, home purchasers in Hong Kong have been able to arrange financing packages that mute these high costs. Currently, mortgage interest rates are from 0.8% to 2.1%, which is far below the lowest levels reached in the six nations. As a result, such homeowners find their housing more affordable that some metropolitan areas with higher Median Multiples (such as Vancouver and Sydney).

    However, things could soon change. Professor Chau Kwong-wing of the University of Hong Kong calls the present situation: “… just a short-term illusion,” adding that “People think they can afford an expensive flat with a reasonably cheap mortgage. Their dreams will burst and the flat will become unaffordable when the interest rate rises.” The professor has a point. Variations in interest rates can mask or magnify structural affordability, which is measured by the Median Multiple. This is because interest rates are subject to fluctuation, while buyers and sellers do not renegotiate sales prices after the deal is concluded.

    Professor Chau echoed the land regulation views of the economists, indicating that the need for “increasing land supply for sales.”

    We look forward to routinely reporting on Hong Kong in future editions of the Demographia International Housing Affordability Survey.


    Hong Kong has grown fast in recent decades, not only in population but also in income. International Monetary Fund placed Hong Kong’s 2009 gross domestic product per capita (adjusted for purchasing power) only 10% below that of the United States, and 15% above its former colonial administrator, the United Kingdom. Hong Kong was even further ahead of other major European Union nations and Japan.

  • The Muddled CNT Housing and Transportation Index

    The Center for Neighborhood Technology (CNT) has produced a housing and transportation index (the “H&T Index”), something that has been advocated by Secretary of Housing and Urban Development (HUD) Shaun Donovan and Secretary of Transportation Ray LaHood. The concept is certainly worth support. Affordable housing and mobility are crucial to the well-being of everyone, which translates into a better quality of life, more jobs and economic growth. Surely, much of the internationally comparatively high standard of living enjoyed by so many middle and lower income households in the United States has resulted from inexpensive housing (often on the urban fringe) and the ability to access virtually all of the urban area by quick and affordable personal transportation.

    CNT has developed an impressive website, with “tons” of data and maps that are both impressive and attractive. Maps can be adjusted to look at approximately 40 demographic indictors for “block groups” in the nation’s metropolitan areas. Block groups are neighborhoods (smaller than census tracts) defined by the Bureau of the Census and have an average population of approximately 1,500.

    CNT uses the HUD “housing burden” at 30% of household income as a maximum for affordability and further says that housing and transportation should not exceed 45%. The maps show neighborhoods that CNT finds to be affordable and not affordable by these criteria.

    But for all of its superficial impressiveness, the H&T Index is subject to serious misinterpretation and suffers from methodological flaws that neutralize the usefulness of its affordability indices.

    The H&T Index: Potential for Misinterpretation

    The H&T Index: Not a Neighborhood Index: The H&T Index is particularly susceptible to misinterpretation by ideological interests contemptuous of America’s suburban lifestyle, who would use public policy to force people to live in higher densities. While the H&T Index reports data at the neighborhood level, it is not a neighborhood index. However, the H&T Index does not compare neighborhood housing and transportation costs with neighborhood incomes. Rather, the H&T Index uses the metropolitan median household income.

    As a result, low income neighborhoods appear to be affordable, because their less costly housing is compared to the higher metropolitan area median income. Higher income neighborhoods appear unaffordable, because their higher housing costs are compared to the lower metropolitan area median income.

    Press reports, such as in the Washington Post have failed to clearly describe this issue. Without clear reporting, the H&T Index is could play into the popular fiction that suburbs are filled with households unable to cannot afford their housing and transportation. In fact, the vast majority of suburban homeowners can afford their transportation and housing and an appropriate portrayal of neighborhood data (with the corrections noted below) would illustrate this. The high level of recent foreclosures that have occurred in some suburbs are simply a reflection of the fact that “easy money” enticed some people to take on obligations that were beyond their means (just as central city developers built condominium towers that have been foreclosed upon or offered as rentals, with unit prices discounted 50% and more).

    The potential for misinterpretation is illustrated by examining three neighborhoods in Dallas County (Table 1), one low income, one middle income and one high income (2000 data).

    • The H&T Index indicates that housing costs are 8% of incomes in the low-income West Dallas neighborhood when compared to median metropolitan income. However, when the neighborhood income is used, the share of income required for housing is 57%, nearly twice the HUD maximum standard.

    It might be thought that people should move to West Dallas from the suburbs to take advantage of the low housing prices. However, any such migration would quickly escalate land prices up to eliminate any advantage (and to force the low income residents to move, as happens in “gentrifying” neighborhoods).

    • In the middle income (Garland) neighborhood, housing costs as a share of income are 24%, whether measured by the metropolitan or neighborhood income, both within the HUD 30% maximum
    • In the high income (University Park) neighborhood, CNT finds housing costs to be 102% of median metropolitan incomes. When neighborhood income is used instead, housing costs drop to 25% of incomes, well within the HUD 30% maximum.
    Metropolitan & Neighborhood Housing & Transportation Indices: 2000
    Factor Low Income Neighborhood: West Dallas Middle Income Neighborhood: Garland High Income Neighborhood: University Park
    Median Household Income: Metropolitan (PMSA) $48,364 $48,364 $48,364
    Housing Cost Share 8% 24% 102%
    Median Household Income: Neighborhood $6,989 $48,594 $200,001
    Housing Cost Share 57% 24% 25%
    Base data from H&T Index

    The H&T Index: Criticisms of the Methodology

    (1) Missing the Housing Bubble? CNT places more emphasis on transportation costs than on housing costs. This is evident in the H&T Index attention to rising transportation costs from 2000 to 2008. The housing bubble and its impact on household costs appears nowhere among the 40 indicators (Note).

    Yet, there is every indication that housing costs have risen substantially more than transportation costs since 2000. For example, in Kansas City’s core Jackson County, the Census Bureau’s American Community Survey data indicates that the increase in average housing costs was nearly 60% greater than CNT’s transportation cost increase. In Portland’s core Multnomah County, the increase in average housing costs was more 125% greater than CNT’s estimated increase in transportation costs (Figure).

    (2) Exaggerating by Mixing Averages and Medians: The H&T Index compares average housing and transportation costs with the median household income. Averages and means are not the same things. Median income data is “middle” score, with one half of households having incomes above the median and one-half having incomes below the median. On the other hand, “average” housing costs and transportation costs are the total housing and transportation costs divided by the total number of households. High incomes and high priced housing skews averages up. Mixing medians and averages is inherently invalid. For example, in 2008, average housing costs were 19% higher than median housing costs. This means that, on average, where the H&T Index reports a 30% housing affordability figure, it is really substantially lower, at 25% (30% reduced by 19%).

    Thus, the net effect of comparing average housing costs to median incomes makes the housing element of the H&T Index worse than it really is.

    (3) Exaggerating by Leaving Some Households Out: The H&T Index excludes home owning households without a mortgage. The average housing expenditures of households without mortgages are smaller than those of households with mortgages. However, this is a material omission, since housing costs include utility payments. In Multnomah County, excluding households without mortgages raises average housing expenditures by nearly 10% (in 2008). Households without mortgages are households too. The net effect of excluding households without mortgages is to increase housing costs, making the housing portion of the index higher than it would otherwise be.

    (4) Exaggerating by Mixing Data from Different Years: The H&T Index provides 2008 estimates for neighborhood transportation costs, using modeled data. Transportation costs have surely increased since 2000, reaching their peak in 2008 due to the highest ever gasoline prices. CNT again compares these average costs to median household income, but not for 2008. CNT uses 2000 income data. In Jackson County and Multnomah counties, the use of 2000 instead of 2008 data exaggerates transportation’s share of household income between 20% and 25%.

    Each of the above methodological issues is sufficient to render H&T Index outputs to be unreliable.

    Housing’s Role in Housing & Transportation Affordability

    While both transportation and housing costs are important, housing costs have dented household budgets far more than the increase in transportation costs. Even after the house price declines of the last few years, house prices remain well above their historic ratio to household incomes. This will only get worse, if, as many expect, mortgage interest rates rise from their present lows and as rents rise to follow higher house prices.

    In contrast, transportation costs are more susceptible to reduction than housing costs. Once the mortgage is signed, the cost of the house will not be reduced. Once the lease is signed, there is little chance that the rent will be lowered. But transportation costs will be reduced in the future by the far more fuel efficient vehicles being required by Washington. Some people can work at home part of the time. People also change cars more frequently than they change houses. If costs become an issue, perhaps the next car is a compact rather than an SUV.

    CNT’s focus on trends in transportation costs rather than housing costs is consistent with its related study, Penny Wise Pound Fuelish, which advocates expansion of prescriptive land use (smart growth) policies to encourage core urban development and make much suburban development illegal. Yet, these very policies played a dominant role in driving house prices up three times as fast relative to incomes as in metropolitan areas that did not adopt them.

    Genuine advocacy for affordability requires addressing both transportation and housing costs. It also requires recognition of the significant damage done to affordability by prescriptive land use policies. An extra dollar that a household must pay for housing is just as valuable as one spent on transportation.

    All of which leaves us where we started. The nation could still use a reliable housing and transportation index.


    Note: CNT provides no 2008 data for housing costs. Such costs will not be available at the neighborhood level from the American Community Survey until 2012 or 2013. However, it would likely have been no more difficult for CNT to model updated housing data by neighborhood than it was to model 2008 data for transportation costs at the neighborhood level.

    Wendell Cox is a Visiting Professor, Conservatoire National des Arts et Metiers, Paris. He was born in Los Angeles and was appointed to three terms on the Los Angeles County Transportation Commission by Mayor Tom Bradley. He is the author of “War on the Dream: How Anti-Sprawl Policy Threatens the Quality of Life.

    Photograph: Hartford Suburbs

  • The Best Cities For Jobs

    This year’s “best places for jobs” list is easily the most depressing since we began compiling our annual rankings almost a decade ago. In the past–even in bad years–there were always stalwart areas creating lots of new jobs. In 2007’s survey 283 out of 393 metros areas showed job growth, and those at the top were often growing employment by at least 5% to 6%. Last year the number dropped to 63. This year’s survey, measuring growth from January 2009 to January 2010, found only 13 metros with any growth.

    Mike Shires at the Pepperdine School of Public Policy, who develops the survey, calls it “an awful year.” Making it even worse, the source of new jobs in almost all areas were either government employment or highly tax payer-funded sectors like education and health. This year’s best-performing regions were those that suffered the smallest losses in the private economy while bulking up on government steroids.

    So far the recovery has favored the government-dominated apparat and those places where public workers congregate.After all, besides Wall Street, public-financed workers have been the big beneficiaries of the stimulus, with state and local governments receiving more than one-third of all funds. Public employment grew by nearly 2% over the past three years, while private employment has dropped by 7%.

    Private sector workers have also seen their wages decline, while those working for the various levels of government have held their own. Federal workers now enjoy an average salary roughly 10% higher than their private sector counterparts, while their health, pension and other benefits are as much as four times higher.

    Not surprisingly government workers, according to a recent survey, are more likely to see the economy improving than those engaged in the private sector. It’s not so pretty a picture on Main Street; personal bankruptcy filings rose 23% in the year ending in March.

    Small Is Still Beautiful

    Despite these differences, some patterns from previous years still persist. The most prominent is the almost total domination of the top overall rankings by smaller communities. With the exception of Austin, Texas, all the top 10 growers–and all the net gainers–were small communities. Americans have been moving to smaller towns and cities for much of the past decade, as well as jobs, and this recession may end up accelerating the trend.

    At the top of the list stands No. 1 Jacksonville, N.C., whose economy grew 1.4%, paced by 3.3% growth in government jobs. Fast growth, however, is not a stranger to this Southern community, whose employment base has grown 22.8% since 1998. The area includes the massive Marine Base at Camp Lejeune, a beehive of activity since the U.S. started waging two wars in Afghanistan and Iraq. Fort Hood-Temple-Fort Hood in Texas came in fourth place overall with Fayetteville, N.C., home to the Army’s Fort Bragg, placing sixth and Lawton, Okla., home of Fort Sill, close behind at No. 7. Similar explanations can apply to war economy hot spots Fort Stewart (No. 20 overall) and Warner Robbins (No. 26), both in Georgia.

    But perhaps nothing captures the current zeitgeist more than the presence, at No. 23, of Hanford-Corcoran, Calif. A large Air Force base and a state prison have bolstered Hanford-Corcoran’s economy, which shows that even in the Golden State–an economic basket case whose unemployment keeps rising–a large concentration of government jobs still guarantees some degree of growth.

    Not all our top-ranked small stars got their stimulus from Uncle Sam. Energy-related growth explains strong performances from Bismarck and ag-rich Fargo, N.D., at Nos. 2 and 8, respectively. You can also credit some energy-related growth to the high standing of Morgantown, W.Va., (No. 17) and Anchorage, Alaska, (No. 18), which have benefited from consistently high prices of oil and other sources of energy.

    Texas at the Top of Big Cities

    Our list of best places among big cities is dominated this year, as last, by Texas, with the Lone Star State producing fully half of our top 10. This year, like last, the No. 1 big city (those with a more than 450,000 non-farm jobs) was Austin, Texas, which enjoys the benefits of being both the state capital and the home to the University of Texas, as well as a large, and growing, tech sector.

    But the Texas story also includes places that do not enjoy Austin’s often overwrought “hip and cool” image. Broad-based economies, partly in energy, have paced the growth of No. 2 San Antonio, No. 3 Houston, No. 5 Dallas and No. 7 Fort Worth. Other consistent big-city Southern performers include No. 8 big metro Raleigh-Cary, N.C., as well as two ascendant Great Plains metropolises, No. 9 Omaha and No. 11 Oklahoma City. None of these places were too hard-hit by the mortgage meltdown, and they all have retained reputations as business-friendly areas.

    The other big winner among the large areas is an obvious one: No. 6 ranked greater Washington, D.C. While most American communities suffer, our putative Moscow on the Potomac has emerged as the big winner under Barack Obama and the congressional centralizers. Remarkably, federal employment in the area has grown at a smart pace throughout the recession. One partial result: Washington office space is now–for the first time ever–more expensive than that in Manhattan. Northern Virginia, home to many beltway bandit companies, ranks No. 4 on our list.

    The Eds and Meds Economy

    With the productive economy outside energy only now getting its footing, the biggest relative winners have been what could be called the “eds and meds” economies. This includes de-industrialized places such as Pittsburgh (ranked a surprising No. 13), Rochester, N.Y., (ranked No. 17) and Buffalo, N.Y. (No. 20). If you have few more factory jobs to lose, little in-migration and a huge collection of institutions relatively immune to the economic turndown, you have a better chance to look good in bad times. The stimulus tilted more toward education and health than to construction and infrastructure, something that has worked to the favor of these cities.

    We can see this in New York City, whose huge and growing concentration of colleges and hospitals helped propel it to No. 10 among the big regions, its best ranking ever, despite losing almost 130,000 jobs. This is all the more remarkable since the Big Apple was the epicenter of the financial collapse, although that also made it the prime beneficiary of the federal bailout and Wall Street’s boom. Soaring salaries for hedge fund managers and new hires at financial firms could be pacing new growth in the city’s elaborate service industry, from toenail painters, restaurateurs and psychologists to dog walkers and yoga instructors.

    The health of the eds and meds economy, however, has even been enough to lift some traditional bottom-dwelling sad sacks, such as No. 14’s Philadelphia, to unfamiliar, if rather relative, heights. With private-sector growth weak everywhere, cities with lots of big hospitals, universities and nonprofit foundations look better for the time being than they have in a generation.

    The Road Ahead

    We expect our list to change next year, but how it will do so will depend as much on politics as economics. The current policy approaches–with healthy increases in government employment and strong support for education–have worked relatively well for taxpayer-financed economies including those with a strong “eds and meds” sectors. State universities, now confronted with the real pain of the recession felt by state taxpayers, are already crying for heavy increases in federal support.

    But if Congress takes a turn to the center, or even right, after November, the advantageous position of the favored government-supported sectors may erode. Particularly vulnerable will be state workers, whose current federally sanctioned reprieve could be terminated if voters force legislators to start addressing concerns over the huge governmental deficits both locally and nationally. Given D.C.’s unique ability to print money, Washington and its environs will likely continue to expand, as they did under the spendthrift Bush regime, but many state and local governments may be forced onto a stringent diet.

    On the other hand, a welcome return to basic growth in overall economy would further boost those relatively low-cost areas–notably in Texas, the Great Plains and the Intermountain West–that have in recent years enjoyed the strongest trajectory in the non-government related sectors, including natural resource-based industries . These places have pro-business regulatory and tax regimes, lots of available land and affordable housing, which will attract new businesses and workers to their areas.

    This change could also benefit some places, such as Silicon Valley, parts of Southern California and the Pacific Northwest, which despite high costs still retain globally competitive, tech-related sectors. A resurgent job market in these areas would erase the current apparent advantage enjoyed by “eds and meds” based economies in favor of those places that will serve as the real incubators for a revived private sector economy. With the resumption growth, hopefully, our economy next year will begin resembling the more capitalist, competitive one we have enjoyed in the past.

    This article originally appeared at Forbes.com.

    Joel Kotkin is executive editor of NewGeography.com and is a distinguished presidential fellow in urban futures at Chapman University. He is author of The City: A Global History. His newest book is The Next Hundred Million: America in 2050, released in Febuary, 2010.

    Photo: kiril106

  • The Millennial Metropolis

    Back in the 1950s and 60s when Baby Boomers were young, places like Los Angeles led the nation’s explosive growth in suburban living that has defined the American Dream ever since. As Kevin Roderick observed, the San Fernando Valley became, by extension, “America’s suburb” – a model which would be repeated in virtually every community across the country.

    These suburbs – perfectly suited to the sun-washed car culture of Southern California – have remained the ideal for most Americans. And they remain so for the children of Boomer and Generation X parents, Millennials,(born 1982-2003), who express the same strong interest in raising their families in suburban settings.

    According to the most recent generational survey research, done for Washington-based think tank, NDN, by Frank N. Magid Associates, 43 percent of Millennials describe suburbs as their “ideal place to live,” compared to just 31 percent of older generations. In the same survey, a majority of older generations (56%) expressed a preference for either small town or rural living. This may reflect the roots of many older Americans, who are more likely to have grown up outside of a major metropolis, or it may indicate a desire of older people for a presumably simpler lifestyle.

    By contrast, these locations were cited by only 34 percent of Millennials as their
    preferred place to live. A majority (54%) of Millennials live in suburban America and most of those who do express a preference for raising their own families in similar settings. Even though big cities are often thought of as the place where young people prefer to live and work, only 17 percent of Millennials say they want to live in one, less than a third of those expressing a preference for suburban living. Nor are they particularly anxious to spend their lives as renters in dense, urban locations. A full 64 percent of Millennials surveyed, said it was “very important” to have an opportunity to own their own home. Twenty percent of adult Millennials named owning a home as one of their most important priorities in life, right behind being a good parent and having a successful marriage.

    This suggests that some of the greatest opportunities in housing will be in those metropolitan areas that can provide the same amenities of suburban life that Los Angeles did sixty years ago. In this Millennials are just like their parents who moved to the suburbs in order to buy their own home, with a front and back yard, however small, in a safe neighborhood with good schools.

    Given the fact that nearly four in five Millennials express a desire to have children, cities that wish to attract Millennials for the long-term will have to offer these same benefits. These Millennial metropolises also will need to be built with the active participation of their citizens, using the most modern communication technologies, to create a community that reflects this generation’s community-oriented values and beliefs. Metropolises that wish to attract Millennials, will also need to include them in their governing institutions. Such cities will have a leg up on those run by closed, good old boy networks that don’t reflect the tolerance and transparency Millennials believe in.

    The passion of Millennials for social networking and smart phones reflects their need to stay in touch with their wide circle of friends every moment of the day and night. In fact, 83 percent of this generation say that they go to sleep with their cell phone. This group-oriented behavior is reflected in the efforts of Millennials to find win-win solutions to any problem and their strong desire to strengthen civic institutions. Seventy percent of college age Millennials have performed some sort of community service and virtually every member of the generation (94%) considers volunteer service as an effective way to deal with challenges in their local community.

    The other key characteristic of the Millenial metropolis will be how it carves out a safe place for children. The Boomer parents of Millennials took intense interest in every aspect of their children’s lives, earning them the sobriquet “helicopter parents” because of their constant hovering. Now the Generation X “stealth fighter parents” of younger Millennials are turning the Boomer desire to hover and talk into a push for action and better bottom line results.

    This can already be seen in cities like Los Angeles where a parent revolution is successfully challenging the entrenched interests in the Los Angeles Unified School District (LAUSD).

    The idea began with a website, www.parentrevolution.org, that offered a bargain to parents willing to participate in a grass roots effort to improve individual schools. The organizers, led by Ben Austin, a long time advocate on behalf of Los Angeles’s kids, promised that if half of the parents in a school attendance district signed an online petition indicating their willingness to participate in improving their local school, they would “give you a great school for your child to attend.”

    This process has worked both in working class areas like East Los Angeles’ Garfield High School and the Mark Twain Middle School in affluent West LA. With the backing of the parents, Austin went to the Los Angeles school district and demanded that they either put the management of the school “out to bid,” or his organization would be forced to respond to the parent’s demands by starting a charter school in competition with the LAUSD school. Since each child has seven thousand dollars of potential state funding in their back pack, a newly enlightened LAUSD agreed to these demands. When 3000 parents showed up to demonstrate their support of the concept, the school district voted 6-1 to adopt a policy mandating competitive bids eventually be issued for the management of all 250 “demonstrably failing schools” as defined by federal education law.

    The key to building the Millenial metropolis will be to accommodate such changes. Places like Dallas, Houston, Austin, or Raleigh-Durham that have survived the Great Recession reasonably well now are focusing on producing open, accessible communities with good schools and safe streets. These communities appear best positioned to take advantage of the next bloom of urban growth. Of course the ability to provide America’s next great generation with good jobs and a growing economy will also be required if any metropolis wants to attract Millennials. But with the right leadership and a sustained effort to focus on the basics of family living, almost any city has the opportunity to become a leader in the rebirth of America’s Millennial Era metropolises.

    Morley Winograd and Michael D. Hais are fellows of the New Democrat Network and the New Policy Institute and co-authors of Millennial Makeover: MySpace, YouTube, and the Future of American Politics (Rutgers University Press: 2008), named one of the 10 favorite books by the New York Times in 2008.

    Photo: Papalars

  • Beyond the Census: America’s Demographic Advantage

    As the nonstop TV commercials have made clear, the U.S. Census Bureau really hopes you’ve sent back your questionnaire by now. But in reality, we don’t have to wait for the census results to get a basic picture of America’s demographic future. The operative word is “more”: by 2050, about 100 million more people will inhabit this vast country, bringing the total U.S. population to more than 400 million.

    With a fertility rate 50 percent higher than Russia, Germany, or Japan, and well above that of China, Italy, Singapore, South Korea, and virtually all of Eastern Europe, the United States has become an outlier among its traditional competitors, all of whose populations are stagnant and seem destined to eventually decline. Thirty years ago, Russia constituted the core of a vast Soviet empire that was considerably more populous than the United States. Today, Russia’s low birthrate and high mortality rate suggest that its population will drop by 30 percent by 2050, to less than one third that of the United States. Even Prime Minister Vladimir Putin has spoken of “the serious threat of turning into a decaying nation.”

    Perhaps an even more important demographic gap is emerging between the United States and East Asia. Over the past few decades a rapid expansion of their workforce fueled the rise of the East Asian tigers, the great economic success story of our epoch. Yet within the next four decades, a third or more of their populations will be older than 65, compared with only a fifth in America. By 2050, according to the United Nations, roughly 30 percent of China’s population will be more than 60 years old. Lacking a developed social-security system, China’s rapid aging will start cutting deep into the country’s savings and per capita income rates. A slowdown of population growth in poor countries can offer a short-term economic and environmental benefit. But in advanced countries, a rapidly aging or decreasing population does not bode well for societal or economic health.

    Between 2000 and 2050 the U.S. population aged 15 to 64—the key working and school-age group—will grow 42 percent, while the same group will decline by 10 percent in China, nearly 25 percent in Europe, and 44 percent in Japan. Unlike its rivals, America’s economic imperative will lie not in meeting the needs of the aging, but in providing job and income growth for our expanding workforce. What the United States does with its “demographic dividend”—that is, its relatively young working-age population—will depend largely on whether the private sector can generate jobs, an issue that’s particularly critical now, with more than 15 million unemployed.

    Immigrants may be one force that will lead the way: between 1990 and 2005 immigrants started one quarter of all venture-backed public companies. This enterprising spirit is crucial, because U.S. employment has been shifting not to mega corporations but to individuals; between 1980 and 2000, the number of self-employed people expanded tenfold to make up 16 percent of the workforce.

    To create jobs, America needs to pay attention not only to high-tech industries but also the basic ones—construction, manufacturing, agriculture, energy—that will employ our expanding blue-collar workforce. Expanding our basic industries, and focusing on the necessary skills training for those laboring in them, will provide new opportunities for the majority of workers who do not possess college degrees. It also will be critical to addressing the outflow of capital to other countries, and provide the basis for innovations that will create new exports.

    With the mobilization of our entrepreneurs and supportive government policies, the United States should be able to exploit its vibrant demography to assure its preeminence over the next four decades. If we fail to start taking these steps now, our current leaders will have earned the opprobrium that future generations will heap upon them.

    This article originally appeared at the Newsweek.

    Joel Kotkin is executive editor of NewGeography.com and is a distinguished presidential fellow in urban futures at Chapman University. He is author of The City: A Global History. His newest book is The Next Hundred Million: America in 2050, released in Febuary, 2010.

    Photo by Seema K K

  • All In The Family

    For over a generation pundits, policymakers and futurists have predicted the decline of the American family. Yet in reality, the family, although changing rapidly, is becoming not less but more important.

    This can be traced to demographic shifts, including immigration and extended life spans, as well as to changes of attitudes among our increasingly diverse population. Furthermore, severe economic pressures are transforming the family–as they have throughout much of history–into the ultimate “safety net” for millions of people.

    Those who argue the family is less important note that barely one in five households–although more than one-third of the total population–consists of a married couple with children living at home. Yet family relations are more complex than that; people remain tied to one another well after they first move away. My mother, at 87, is still my mother, after all, as well as the grandmother to my daughters. Those ties still dominate her actions and attitudes.

    Critically, marriage, the basis of the family, is also far from a dying institution. Sociologist Andrew Cherlin notes that over 80% of Americans eventually get married, often after a period of cohabitation. Later marriages are also reflected in later childrearing. Younger women today may be less likely to have children, but far more older women are giving birth; since 1982 the number of those over 35 who give birth has more than tripled. This trend has accelerated and will continue to do so given advances in natal science.

    More important, people continue to value the stability and cohesion that only families can provide. According to social historian Stephanie Coontz, Americans today are more likely to be in regular contact with their parents than in the past. Some 90% consider their parental relations close, and far more children are likely to live with at least one parent now than they were as recently as the 1940s.

    To be sure, as Coontz makes clear, the 21st-century family will not reprise the Ozzie-and-Harriet norms of the 1950s. Everything from divorce to immigration and gay marriage is reshaping family relations. While Americans may “swing back” to a more family-oriented society, social historian Alan Wolfe notes, “it will be with a difference.”

    But family will remain the central force that informs our communities and economy. For example, when people move, a 2008 Pew study reveals, they tend to go to areas where they have relatives. Family, as one Pew researcher notes, “trumps money when people make decisions about where to live.”

    Perhaps nothing better illustrates this trend than the increase in multigenerational households. As people live longer and produce offspring later, family ties are strengthening. A recent Pew survey reveals that the number of households accommodating at least two adult generations has grown in recent years. Today the percentage of such multigenerational households–some 16%–is higher than any time since the 1950s and swelled by some 7 million since 2000. At the same time, the once rapid growth of single-person households, which nearly tripled since the 1950s, has begun to slow and, among those over 65, has declined in recent years.

    Rather than be hived off in isolation, grandparents are playing a larger role in family life, both as financial supporters and as sources of reliable child care. Living with or being close to grandparents is particularly important for younger Americans, many of whom are struggling to raise families in expensive regions such as New York or Los Angeles. As Queens resident and real estate agent Judy Markowitz puts it, “In Manhattan, people with kids have nannies. In Queens, we have grandparents.”

    As these caregivers age, in turn, they will require help for themselves. One welcome change, already evolving, is the number of older adults moving in with their children. Institutionalized care for people over 75, once seen as inevitable, has dropped since the mid-1980s, as more families hire part-time help or have aging parents move in with them.

    Today as many as 6 million grandparents live with their offspring, allowing, by one estimate, as many as half a million people to avoid nursing homes. Between 2000 and 2007, according to the Census Bureau, the number of people over 65 living with adult children increased by more than 50%. One California builder reports that one third of new home buyers want a “granny flat,” an addition to accommodate an aging parent. Roughly one third of American homes have the potential to create such units. In the coming decades homes that can be adapted to the changing needs of families will become an increasingly desirable commodity.

    Arguably the strongest force for continued importance of family comes from the two groups, ethnic minorities and millennials, who will shape the next few decades. Immigrants, particularly Latinos and Asians, are also far more likely to live in married households with children than are other Americans. They are also more than twice as likely, according to Pew, to live in households with at least two adult generations.

    The other key group will be the millennials, those Americans born since 1982. As noted generational researchers Morley Winograd and Mike Hais suggest in their landmark book Millennial Makeover, the rising “millennial” or “echo boom” generation–those born after 1983–enjoy more favorable relations with their parents: Half stay in daily touch, and almost all are in weekly contact.

    The millennials, Winograd and Hais suggest, generally do not share the generational angst that defined many boomers. Indeed three-quarters of 13-to-24-year-olds, according to one 2007 survey, consider time spent with family the greatest source of happiness, rating it even higher than time spent with friends or a significant other. And they seem determined to start families of their own: More than 80% think getting married will make them happy, and some 77% say they definitely or probably will want children, while less than 12% say they likely will not.

    The current tough economic conditions may be slowing family formation but is clearly bolstering close, long-term ties between children and parents. One quarter of Gen Xers, for example, still receive financial help from their parents, as do nearly a third of those under 25.This trend has been mounting since well before the recession. Ten percent of all adults younger than 35 told Pew researchers last year that they had moved in with their parents over the past year.

    Higher college debts, high home prices and a less-than-vibrant job market could all extend this virtual adolescence in which children maintain strong ties of dependence into adulthood. Although these conditions may increase support for more governmental assistance among some, young people are finding out there’s one institution that, despite political shifts, really can be counted on: the family.

    This article originally appeared at Forbes.com.

    Joel Kotkin is executive editor of NewGeography.com and is a distinguished presidential fellow in urban futures at Chapman University. He is author of The City: A Global History. His newest book is The Next Hundred Million: America in 2050, released in Febuary, 2010.

    Photo: driki

  • The Heartland Will Play a Huge Role in America’s Future

    One of the least anticipated developments in the nation’s 21st-century geography will be the resurgence of the American Heartland, often dismissed by coastal dwellers as “flyover country.”

    Yet in the coming 40 years, as America’s population reaches 400 million, the American Heartland particularly the vast region between the Rocky Mountains and the Mississippi will gain in importance.

    To fully appreciate this opportunity, Americans need to see the Heartland as far more than a rural or an agricultural zone. Although food production will remain a crucial component of its economy, high-tech services, communications, energy production, manufacturing and warehouses will serve as the critical levers for new employment and wealth creation.

    This contradicts the common media portrayal of the Great Plains as a kind of Mad Max environment a postmodern, desiccated, lost world of emptying towns, meth labs and militant Native Americans about to reclaim a place best left to the forces of nature.

    Some environmentalists and academics even have embraced the idea, popularized by New Jersey academics Frank J. Popper and Deborah Popper, that Washington, D.C., accelerate the depopulation of the Plains and create “the ultimate national park.” Their suggestion is that the government return the land and communities to a “buffalo commons.”

    Yet ironically, the future of the Heartland particularly its cities will be tied, in part, to growing migration from the expensive, crowded coasts. Already, the growth capacity for “mega- cities” like New York, Chicago and Los Angeles may be approaching their limits as the urban megalopolis of cities, suburbs and exurbs become more crowded and expensive.

    As huge urbanized regions become less desirable or unaffordable for many businesses and middle-class families, more and more Americans will find their best future in the wide-open spaces that, even in 2050, will still exist across the continent. The beneficiaries will include places as diverse as Fargo and Sioux Falls in the Dakotas to Des Moines, Oklahoma City, Omaha and Kansas City.

    Many of these areas are now enjoying both population growth and net domestic in-migration even as the nation’s most ballyhooed “hip cool” regions like the Bay Area, Los Angeles, New York City and Chicago experience slower growth. Fargo, N.D., Sioux Falls, S.D., Des Moines and Bismarck, N.D., for example, all grew well faster than the national average throughout the past decade.

    Economics undergirds this trend. Unemployment in the Great Plains has remained relatively low, even during the recession that began in 2007. For much of the decade, the biggest problem facing many businesses has been finding enough workers.

    In the future, some will thrive by the production of energy or specialized manufactured products. Others will serve as magnets for tourists, hunters, bird-watchers, arts festivals and pageants. Small rural college towns may serve as refuges for empty nesters relocating or returning from the congested, expensive coasts.

    The critical sources for the evolving resurgence of the Heartland lie both in new technology and traditional strengths.

    The advent of the Internet, which has broken the traditional isolation of rural communities, has facilitated the movement of technology companies, business services and manufacturing firms to the nation’s interior. This will reinforce not so much a movement to remote hamlets but to the growing number of dynamic small cities and towns throughout the Heartland.

    The other critical element concerns the traditional role of the Heartland as a producer of critical raw materials. As world competition for food and energy supplies intensifies, a critical primary advantage for the United States in contrast with China, India, Japan and the European Union will lie with the vast natural abundance of its Heartland regions.

    New investment will flow back into the Heartland to tap previously difficult-to-access resources such as oil and gas, while new technologies will exploit prodigious natural sources such as wind.

    Equally critical, the Heartland will reconnect America with its own historic strengths as a great, largely open, continental nation, a place of aspiration that can accommodate future growth. The Heartland reinforces our national character, what Frederick Jackson Turner called “that restless, nervous energy; that dominant individualism, working for good or evil … that buoyancy and exuberance which comes with freedom.”

    As the population expands to 400 million people, Americans will need to tap that spirit more than ever.

    This article originally appeared at the Omaha World Herald.

    Joel Kotkin is executive editor of NewGeography.com and is a distinguished presidential fellow in urban futures at Chapman University. He is author of The City: A Global History. His newest book is The Next Hundred Million: America in 2050, released in Febuary, 2010.

    Photo by: Sacred Destinations

  • Pondering Urban Authenticity: A look at the new book “Naked City”

    “If you seek authenticity for authenticity’s sake you are no longer authentic.”

    – Jean-Paul Sartre

    As the United States shifted from a manufacturing to a knowledge-based economy during the latter half of the 20th Century, former industrial cities suffered population losses to the suburbs and post-WWII boomtowns. Some of these cities were able to stay afloat while others went into permanent decline never to fully recover. Most experienced an increase in crime and a decrease in quality-of-life.

    Following flight from the city core, an entire generation of Americans, Generation X (born roughly between the early 1960s and early 1980s), was raised in suburban environments which they came to resent as bland and homogenous. Alienated by the conformity of the ‘burbs,, this generation suffered a kind of postmodern malaise which in turn spurred a quest for meaning. Rather than uniting around a single cause like their parents and grandparents, Xers searched for meaning by seeking out a variety of ‘authentic experiences’.

    One of the places that more adventurous GenXers sought authentic experience was in gritty but dangerously alluring urban environments. Rejecting the values of post-war America, many looked to the city as a place to reconnect with the hustle and bustle of diverse and ethnic neighborhoods.

    This was a significant break from what might be seen as aspirational urbanism. Instead of returning to the city for economic opportunity, as had been the case since the inception of the Industrial Revolution, to the move to the city had transformed into essentially a lifestyle choice.

    In her new book Naked City: The Death and Life of Authentic Urban Places, Sharon Zukin assess the effects of this phenomenon by taking stock of her home city New York. Zukin, a Professor of Sociology at Brooklyn College, asserts that a true sense of authenticity has been lost. In the introduction she clarifies this assertion by stating

    “Authenticity is not a stage set of historic buildings as in SoHo or a performance of bright lights as at Times Square; it’s a continuous process of living and working, a gradual buildup of everyday experience, the expectations that neighbors and buildings that are here today will be here tomorrow.”

    Naked City highlights areas where gentrification has had the most impact on neighborhood character, including Manhattan’s Harlem and East Village as well as several Brooklyn neighborhoods. Despite their differences, each of these neighborhoods experienced a similar increase in real estate prices during the recent boom years. As is typically the case with gentrification, condo developers – often constructing projects far larger than commonly found in the area’s traditional landscape – descended upon these places once they had proved to be up-and-coming hip spots.

    In a sense, a neighborhood like Williamsburg has become a victim of its own success. Located conveniently across the East River from Manhattan and full of convertible industrial spaces, Williamsburg is the quintessential model for post-industrial gentrification. With a keen sociologists’ eye, Zukin observes how the influx of hipsters from out of town looking for ‘authentic experience’ has ironically made the neighborhood too costly for long time working-class residents that gave it its appealing identity in the first place.

    One of the most thought-provoking chapters of Naked City, titled A Tale of Two Globals, examines the small Brooklyn neighborhood of Red Hook – not long ago a crime-infested poor community. Red Hook’s sinister reputation subsided in large part due to the arrival of New York City’s first IKEA store in 2008. Zukin describes how the big-box store was fought tooth and nail by gentrifiers yet positively concedes that IKEA ultimately transformed a dead zone and lived up to its promise of hiring local workers.

    Not far from IKEA, a group of Central American immigrants have been serving up snacks in traditional fare at a local soccer field since the early 90s when crack was still a major problem. The pupusa street vendors originally catered to immigrant families attending soccer matches on the weekends. Zukin details how the Salvadoran vendors gained popularity with the hip crowd when the word of the delicious authentic food spread over local food blogs. With their newfound popularity, the street food vendors attracted the attention of city regulators who then proceeded to make their life difficult, coming close to shutting down their entire operations.

    The subtitle of the book alludes to urban deity Jane Jacobs, with whom Zukin shares the skill of making a compelling narrative out of describing urban development battles. Zukin is obviously influenced by Jacobs, but she also dares to be critical of her ideas. She posits that Jacobs focused too much on the built character of the street and did not give enough attention to the sociological factors effecting cities. Zukin might have a valid point: the popularity of Jacobs’ romantic notions of the city helped attract people back to the city in the first place, but in the process transformed them into idealized urban playgrounds. Jacobs’ message has even been twisted by developers and their pundit allies to the point where her ideas are used as marketing tools.

    Zukin deserves much credit for taking on the complex issue of the authenticity of cities. Yet, by the end of Naked Cities, we are left with more questions than answers. Is it really so bad that New York has been gentrified? Has gentrification and increases in living costs been one of the determining factors in helping crime rates drop to historic lows? Certainly, a lower crime rate is better for quality of life but an increased cost of living is no good for the middle and working classes. At one point in her book, Zukin discusses Union Square Park and its affiliation with the local ‘Business Improvement District’ (BID). Union Square Park is in reality a privately run zone masquerading as public space. Is this where are cities are headed? Is this good or bad? A libertarian would say fine but a socialist would probably cry foul.

    Although Naked Cities deals specifically with New York, the issues brought forth by the book are familiar to other American cities. For one, the ‘hipster’ culture, largely defined by Williamsburg in Brooklyn, has replicated itself in neighborhoods in other cities such as the Mission District in San Francisco and Silver Lake in Los Angeles. Though very different in character, the types of people attracted to these places generally share the same tastes in art, fashion and music, bringing their own form of cultural homogenization and conformity to once unique and authentic neighborhoods.

    One thing is for sure – ‘authenticity’ in the true sense of the word has probably departed large parts of New York City for good. Once a representation of new beginnings, the city is well on its way to museum status. This does not mean New York will go away – it may become to the 20th Century what Paris is to the 19th Century.

    When it comes to hope and aspiration, a true sense of ‘authenticity’ is probably best experienced in cities in the developing world such as China where opportunity abounds in urban centers. It can also be found, curiously, in suburban ethnic malls and strip-centers around Los Angeles, San Jose or Houston, or at farmer’s markets and neighborhood activities in less fashionable cities. But, increasingly, not in the once ‘authentic’ place now subsumed in what New York Mayor Michael Bloomberg has dubbed ‘the luxury city’.

    Adam Nathaniel Mayer is a native of California. Raised in Silicon Valley, he developed a keen interest in the importance of place within the framework of a highly globalized economy. Adam attended the University of Southern California in Los Angeles where he earned a Bachelor of Architecture degree. He currently lives in China where he works in the architecture profession. His blog can be read at http://adamnathanielmayer.blogspot.com/

    Photo by [charlie cravero]

  • Queensland, We’ve Got a Problem

    Queensland Premier Anna Bligh MP has a problem. Reacting to sensationalized media reports of runaway population growth as well as an infrastructure lag revealing itself in everything from mounting congestion to a lack of hospital beds, Queensland residents are starting to say ‘enough.’ The prospects of continuing population growth at around 2.5% or 100,000 people per annum, despite the economic benefits this brings, are increasingly unpopular, something that gets the attention of most politicians.

    In many ways it’s ironic for Premier Bligh to find herself in this position. She follows a succession of Premiers who managed to get away with weekly media boasts of “1500 people every week” moving into the State, drawn – it was alleged – by our climate and lifestyle. In the past, any Premier who questioned this growth would have felt the result at the ballot box.

    Bligh’s response has been (in a time honoured tradition) to convene a ‘summit of experts’ and community representatives (you can read it all here), designed to thrash out a policy accord for the future. No politician worth their salt holds an inquiry unless they have a fair idea of the outcome in advance, so it’s a fair bet the outcomes will include even more regulatory controls on urban growth, in the name of ‘sustainability’ to appease the anti-growth coalition of greens and neo-Malthusians. Pro-growth lobbies on the other hand will be promised a ‘business as usual’ attitude to economic expansion, only under more ‘responsible’ oversight.

    But the biggest irony is that attempts to contain or control growth may be too late. It is just possible that the unthinkable will happen: growth will stall, and in coming years, a future Premier will be wondering what went wrong.

    How could this happen?

    First, a bit of history. Queensland’s growth status in the Australian context has been driven over the past 30 years almost entirely from interstate migration. Low state taxes, relatively cheap housing, aggressively pro business governments (including one which famously went too far) and a ‘Florida-like’ allure of lifestyle and warm climate all combined to make the state a population magnet. “The Sunshine State” – just like Florida – was how tourism promoters labeled it. “The low tax state” was the label peddled by business promoters. Both became interchangeable.

    In contrast, international migration to Australia was largely focused on Sydney and Melbourne. The rate of natural births over deaths was barely in the positive, resurrected recently by a Federal Government baby bonus of questionable long lasting effect. This left interstate migration as Queensland’s growth driver.

    Arrivals from Victoria or Sydney could famously relocate to the south east corner of Queensland and find themselves in a better quality home, in a more convenient location, and with cash left over. They were faced with shorter commute times, lower taxes and overall a better quality of life than the one they left behind.

    But in the late 1990s this all started to change. Increasing land use controls appeared as planners sought to ‘manage’ the growth of the state better. “We can’t destroy what you came to enjoy” became a new mantra, and an urban growth boundary for the popular south east was introduced under ‘smart growth’ principles. In the 1995-2000 period, three statutory plans appeared for the south east, followed by a 10 year regional planning program in 2000 (SEQ 2021) followed by an Office of Urban Management in 2004, a South East Queensland Regional Plan in 2005 and then an updated version in 2009.

    It’s become an industry joke that we now produce more plans than houses. But the inevitable consequence of this explosion of planning regulation – matched at the same time by the surreptitious introduction of exorbitant per lot housing levies under the guise of ‘user pays’ – was to drive up housing costs rapidly while drying up new supply.

    Queensland housing construction is now at a 20 year low. The median house price, which in 1999 was half that of Sydney’s, is now 80% of Sydney prices and roughly at 8 times average incomes. A thirty year or more tradition of relatively lower cost housing in Queensland has been smashed in the space of six or seven years.

    Also over the same period, the state’s tax advantage has been eroded. Once Queensland boasted some of the lowest vehicle registration fees in the country; now it has the highest. Electricity prices, also once amongst the cheapest of any state, are now just as expensive. Land and other property taxes have rapidly caught up with other states and overshot others. According to the Institute of Public Affairs IPA, state business taxes in just one year went from being the second lowest in the country in 2008 to mid field by 2009. Roads and other infrastructure which were once enjoyed as part of the general tax contribution are separately tolled, water is priced and charged separately from council rates to residents. Overall, the general cost of living advantage compared to interstate rivals has evaporated.

    The rapid erosion of Queensland’s relative tax and cost of living advantage prompted a writer for The Australian newspaper to lament in late 2009 that: “Queensland has squandered its low-tax edge and become a public-sector spendthrift, putting at risk its long-term growth potential and ability to attract investment.”

    In fairness, maintaining low taxes and funding a generational catch up in infrastructure might be mutually exclusive. The state is now undergoing a record level of infrastructure investment, in response to the growth it has witnessed. The timing for Premier Bligh though is not good: the benefits of this new wave of infrastructure might not be felt for some years. In the meantime, residents are growing increasingly impatient and the prospects of adding to population numbers are being met with increasing hostility. Some of the more alarmist messages of green and ‘no growth’ advocates are finding traction. Even leading Australian business figure like entrepreneur Dick Smith is warning that we will soon run out of food. This in a state larger than Texas with a population of just 4 million, and in a country with five times the amount of arable land per capita than the USA.

    Faced with funding a much larger public sector plus a big infrastructure program, the state is whetting its tax appetite. Plus, the popular sentiment now turning against population growth suggests that relief from excessive land use controls on housing supply or a meaningful reduction in the level of upfront per lot levies is remote at best.

    The results are already apparent. Interstate migration – once the single biggest driver of growth in Queensland – has collapsed and now accounts for just half the level of births over deaths and only one third the level of international migration. The sun still shines in the Sunshine State but Queensland is now longer the low tax (and low cost of living) state. With lower average incomes than other states, the sums no longer add up for many people. And as birth rates slow, without the international migration tap, Queensland’s population growth overall could hit the brakes. The risk here is compounded by the increasing pressure on Prime Minister Kevin Rudd to slow down international migration to Australia (for an example, see here). If that happened, growth could fall to record low levels almost overnight.

    So while Premier Bligh prepares for the population summit and its aftermath, it could prove the ultimate irony that measures to control the rate of population growth in Queensland become quickly redundant and the very least of our worries.

    Ross Elliott is a 20 year veteran of property and real estate in Australia, and has held leading roles with national advocacy organizations. He was written and spoken extensively on housing and urban growth issues in Australia and maintains a blog devoted to public policy discussion: The Pulse.