Category: Demographics

  • What American Demographics Will Look Like in 2050

    To many observers, America’s place in the world is almost certain to erode in the decades ahead. Yet if we look beyond the short-term hardship, there are many reasons to believe that America will remain ascendant well into the middle decades of this century.

    And one important reason is people.

    From 2000 to 2050, the U.S. will add another 100 million to its population, based on census and other projections, putting the country on a growth track far faster than most other major nations in the world. And with that growth — driven by a combination of higher fertility rates and immigration — will come a host of relative economic and social benefits.

    More fertile

    Of course the percentage of childless women is rising here as elsewhere, but compared to other advanced countries, America still boasts the highest fertility rate: 50 percent higher than Russia, Germany or Japan, and well above that of China, Italy, Singapore, Korea and virtually all of eastern Europe.

    As a result, while the U.S. population is growing, Europe and Japan are seeing their populations stagnate — and are seemingly destined to eventually decline. Russia’s population could be less than a third of the U.S. by 2050, driven down by low birth and high mortality rates. Even Prime Minister Vladimir Putin has spoken of “the serious threat of turning into a decaying nation.”

    In East Asia, fertility is particularly low in highly crowded cities such as Tokyo, Shanghai, Tianjin, Beijing and Seoul. And China’s one-child policy — and a growing surplus of males over females — has set the stage for a rapidly aging population by mid-century. South Korea, meanwhile, has experienced arguably the fastest drop in fertility in world history, which perhaps explains its extraordinary, if scandal-plagued, interest in human cloning.

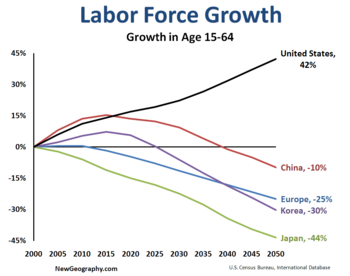
    Even more remarkably, America will expand its population in the midst of a global demographic slowdown. Global population growth rates of 2 percent in the 1960s have dropped to less than half that rate today, and this downward trend is likely to continue — falling to less than 0.8 percent by 2025 — largely due to an unanticipated drop in birthrates in developing countries such as Mexico and Iran. These declines are in part the result of increased urbanization, the education of women and higher property prices. The world’s population, according to some estimates, could peak as early as 2050 and begin to fall by the end of the century.

    Younger and More Vibrant

    Population growth has very different effects on wealthy and poor nations. In the developing world, a slowdown of population growth can offer at least short-term economic and environmental benefits. But in advanced countries, a rapidly aging or decreasing population does not bode well for societal or economic health, whereas a growing one offers the hope of expanding markets, new workers and entrepreneurial innovation.

    In fact, throughout history, low fertility and socioeconomic decline have been inextricably linked, creating a vicious cycle that affected such once-vibrant civilizations as ancient Rome and 17th-century Venice and that now affects contemporary Europe , Russia and Japan.

    Within the next four decades, most of the developed countries in both Europe and East Asia will become veritable old-age homes: a third or more of their populations will be older than 65, compared with only a fifth in the U.S. By 2050, roughly 30 percent of China’s population will be older than 60, according to the United Nations. The U.S. will have to cope with an aging population and lower population growth, in relative terms, but it will maintain a youthful, dynamic demographic.

    More Hopeful About the Future

    The reasons behind these diverging trends is complex. In some countries, a sense of diminished prospects, combined with a chronic lack of space, appear to be the root causes for plunging birthrates. As Italians, Germans, Japanese, Koreans and Russians have fewer offspring — one recent survey found that only half of Italian women 16 to 24 said they wanted to have children — they will have less concern for future generations.

    In contrast, in the United States roughly three-quarters of young people report they plan to have offspring. Such individual decisions suggest that America, for all its problems, is diverging from its prime competitors, placing its faith in a future that can accommodate 100 million more people.

    As author Michael Chabon recently wrote, “In having children, in engendering them, in loving them, in teaching them to love and care about the world,” parents are “betting” that life can be better for them and their progeny.

    This article originally appeared at AOLNews.com.

    Joel Kotkin is executive editor of NewGeography.com and is a distinguished presidential fellow in urban futures at Chapman University. He is author of The City: A Global History. His newest book is The Next Hundred Million: America in 2050, released in Febuary, 2010.

    Photo: victoriapeckham

  • Scenario Two: An Optimistic view of the United States future

    This is the second in a two part series exploring a pessimistic and an optimistic future for the United States. Part One appeared yesterday.

    A positive assessment of US prospects rests on at least seven propositions. First, the current crisis is not inherently more threatening than many others, most notably the Civil War, the Great Depression, and two World Wars. Quality leadership, building on the resilient political and economic institutions of the country, will prove sufficient to bring about needed sacrifices and transformations. We have seen this many times in the past from the Progressive Era to the New Deal, the Second World War and the winning of the Cold War, which was a uniquely bipartisan triumph.

    Second, despite the ongoing problems of racial inequality and tensions about immigration, the United States has been uniquely successful in having peacefully achieved a truly multi-racial and multi-ethnic state. It has welcomed waves of diverse immigrants, and integrated them into a broader, ever changing society. This process has culminated symbolically and literally in the election of a multi-racial president, Barack Obama.

    Third, economic corruption and financial crises have been recurring phenomena, and the nation has emerged out of these because of the sheer magnitude of talent and natural resources. This has been aided by a deep entrepreneurial capacity and willingness to take risks, and, overall, a willingness of most to work hard to improve life for themselves and their families.

    Fourth is the existence of a large and literate population, willing to work, certainly the world’s finest university system and research establishment, over and over again engendering innovations that create future economies: e.g., the computer revolution. American secondary education is still in need of great improvement, but the US University remains a beacon to talent from around the world.

    Fifth, despite the noise and uproar, despite the continuing clash between the traditional and the modern or secular, the nation, through its independent courts and helped by governmental decentralization, e.g. the Federal system, the country remains the freest society in human history. Despite the appearance of power of the religious right under the Republicans since the 1970s, serious erosion in freedom of thought has been kept to a minimum. Similarly, the cult of political correctness, although annoying, has become, if anything, less potent and increasingly the butt of jokes.

    Sixth, and perhaps most important, we have to consider demography. Despite current unemployment and despite the imminent retirement of the baby boomer generation, the United States, alone among the richest economies, will continue to have a relatively favorable ratio of wage earners to the elderly. This will enable us to afford social security and Medicare. The new generation – known as millennials – will constitute a large source of new labor, innovation and entrepreneurs needed to propel our economy.

    Finally, there are a few positive trends, including modest recovery in housing and in auto sales, hints of some pulling back from the out-sourcing of services, and continuing innovation and marketing of new products and services. On the political side, although the current anti-incumbent mood will likely reduce Democratic margins in Congress and in several states in 2010, the sheer lunacy of the “tea party“ activists, many of them unreconstructed “know nothings” may actually hurt the Republican party more than the Democrats. People are constantly being reminded why, for all the failings of the Democrats, they tossed the Republicans from power in the first place.

    An optimistic scenario rests on the historical precedent of muddling through crises and then creating new waves of innovation in products and services, and on the presence of a large labor force willing and able to work. A vital question is whether the President and Congress will have the courage to ask voters to make short-term sacrifices: higher income taxes on the rich and reduced subsidies to entrenched interests across the board that will be needed to restore fiscal health. And finally there is the big question, are the American people ready to do with less today to build a better future for the next generation?

    Richard Morrill is Professor Emeritus of Geography and Environmental Studies, University of Washington. His research interests include: political geography (voting behavior, redistricting, local governance), population/demography/settlement/migration, urban geography and planning, urban transportation (i.e., old fashioned generalist).

    Photo: elycefeliz

  • Scenario One: A Pessimistic Forecast for the United States

    This is the first in a two part series exploring a pessimistic and an optimistic future for the United States. Part Two will appear tomorrow.

    I’m an old (76) 1950s type liberal, and have lived to see the election on the nation’s first mixed-race president, as well as some remarkable social change in the general status of women and ethnic minorities. The United States has a remarkable heritage of entrepreneurship and resilience in its democratic institutions. Yet there are cogent reasons to be fearful and pessimistic about our capacity to maintain our preeminence, at least in the medium run (10-15 years). I obviously hope I’m wrong, and look forward to attempts to undermine my thesis – including, tomorrow, my own.

    Consider the numbers 17, 49 and 60. Seventeen is the real unemployment rate, not the “official” ten, when we take into account those dropping out of the labor force, or giving up. Forty-nine is the real percentage of home ownership, in our “ownership” society, not the 68 percent from the census. For mighty Los Angeles, the real number is 44 percent. The difference is the stupendous number of households whose equity in the house is less than they owe on the mortgage. This house of cards has increasingly been the engine of national growth. Sixty is the number of votes in the US Senate needed to stop a filibuster, and together with inept leadership, is responsible for the absurd failure of Congress and the effective collapse of collegial democracy.

    Economists say we are in a recovery. What recovery? The small increase in house sales is due to temporary incentives, but including speculators buying up homes, many foreclosed, for yet greater inequality. The main gains in jobs, not fully offsetting wider losses, are in temporary construction tied to government-funded projects. The growth in jobs and the economy in the last 20 years has been in services, stuff we do for each other, and the main fuel has been the pyramiding of house values. That is over. How can we restore growth through more consumption if the majority of the population no longer has the resources to invest or spend?

    By far the most destructive accomplishment of almost 30 years of restructuring has been the reestablishment of extreme inequality, the emergence and power of the ultra-rich, both “progressive” and conservative in orientation, to levels last seen before the Great Depression.

    But perhaps the greater root of our malaise, and perhaps the downfall of the American Empire, lies in excessive globalization and the loss of our capacity to make stuff, the outsourcing of, first, manufacturing and now even of services. It is instructive that this is the same story of imperial Rome, although long dependent on its empire, by the time of its collapse it imported virtually everything from its tributary states. Its finances could no longer pay the Army which was largely made up of people from outside Italy.

    I’d agree that the main hope in the economic arena is via the small entrepreneur, but they face the immense monopolistic power of ever-larger global capital. I’m proud to live in Seattle, which at least dared to fight back, as in the one and only US general strike, in 1919, and in the WTO protests in 1999. Perhaps this is not so surprising since Seattle still makes things: planes (Boeing), ships (Todd) and trucks (PACCAR).

    The saddest irony is that even as maybe half of us celebrate a Black president, we have utterly failed to follow up on the political civil rights gains on the 1960s to incorporate Black Americans into the mainstream economy. The status of the Black male is, relatively, worse in 2009 than it was in 1969. I would not be surprised to see a reprise of the 1960s race riots. But it is also relevant to reflect on the declining state of the white male, suffering increased drop-out rates from high school, declining enrollments in college, all in the face of reduced job opportunities for the less skilled and educated, plus competition from immigrants, legal and illegal. Is it any wonder that both nativism and populism is rising anew?

    One might dare to believe that large Democratic majorities in Congress would give us hope for effective responses to this national malaise. But I’d say the current Congress rivals the infamous 80th congress that Harry Truman excoriated, for its “do nothingness”. On the surface we can correctly observe that the Republican party, increasingly conservative, is more than willing to wreck the country in order to regain power.

    But part of the problem is that we no longer have a conservative and a liberal party, in an economic sense. We have two bourgeois parties, with the “new” Democratic Party increasingly dependent on the wealthy educated elite as well as well-paid public workers, it long ago abandoned the working class and did nothing to constrain globalization and the rise of the toxic financial practices. Thus we should not be surprised that the populist know-nothing uprising could bring to power large numbers of proudly uneducated folks.

    In the final analysis for this pessimistic scenario, the underlying culprit is the inexcusable failure of the US educational establishment, the astounding incapacity of our public and private schools to teach people to think and reason. And part of the reason for this incapacity is the excessive power of religion, which values belief over reason, in our culture. And this is why decadent Europe – aging and tax-burdened – could come out of this recession and malaise better than the United States. Perhaps we’ll see a reverse migration of surplus underemployed young Americans returning to their aging historic motherlands!

    Richard Morrill is Professor Emeritus of Geography and Environmental Studies, University of Washington. His research interests include: political geography (voting behavior, redistricting, local governance), population/demography/settlement/migration, urban geography and planning, urban transportation (i.e., old fashioned generalist).

    Photo: hz536n

  • New Traffic Scorecard Reinforces Density-Traffic Congestion Nexus

    Inrix, an industry provider of traffic information, has just published its third annual Traffic Scorecard, which ranks the nation’s 100 largest metropolitan areas based upon the intensity of their peak hour traffic congestion in 2009. The results provide further evidence of the association between higher urban population densities and more intense traffic congestion.

    Los Angeles, Again: Not surprisingly, Los Angeles is again the most congested metropolitan area over 1,000,000 population. In Los Angeles, roadway travel takes nearly 34.7% more in peak periods than when there is no congestion. This means that a trip that would take 30 minutes without congestion would take, on average 40.5 minutes during peak periods.

    The principal measure used by Inrix is the Travel Time Index, which was developed by the Texas Transportation Institute (TTI), for its congestion reports that started in 1982. TTI’s latest Urban Mobility Report is for 2007. The Inrix measures are developed from actual GPS vehicle readings. This information is also provided to TTI to assist in preparation of its annual Urban Mobility Report.

    Measuring Delay: In the new edition, Inrix switches from using the Travel Time Index to what it calls the Travel Time Tax. The difference between the two measures is that the Travel Time Tax measures the percentage of delay, such as 35% in Los Angeles, while the Travel Time Index would state the figure as 1.35. The new method is preferable because differences in traffic congestion are more readily apparent. . For example, a metropolitan area having a Travel Time Tax of 15% would have 50% worse traffic congestion than a metropolitan area having a Travel Time Tax of 10%. This large difference is not as obvious when comparing the Travel Time Index values of 1.15 and 1.10. The “Travel Time Tax” parlance, however, is less than optimal and this article will use “average congestion delay” instead.

    Ranking the Metropolitan Areas: The average congestion delay in Los Angeles was much worse than in the other largest metropolitan areas, just as its core urban area density is well above that of anywhere else in the US, including New York (where far less dense suburbs more than negate the density advantage in the core city). It also doesn’t help that a number of planned freeways were cancelled in Los Angeles over the last 50 years.

    Among the large metropolitan areas, Washington, DC had the second worst Average congestion delay, at 22.4%, followed by San Francisco, at 21.5%, Austin at 20.7% and New York at 19.7%. Austin may seem to have placed surprisingly high, however this was the nation’s last large metropolitan area to open a full freeway to freeway interchange and has only recently begun to develop a comprehensive freeway system, through the addition of toll roads. Austin’s late roadway development is the result of two factors. Austin was too small in 1956 to receive a beltway under the interstate highway system and an anti-freeway movement delayed construction for decades.

    Inrix also develops an average congestion delay for the worst commuting hour. Los Angeles also has the most congested worst hour, with an average congestion delay of 69%. Austin ranked second worst at 55%, while San Francisco was third at 46%, Washington, DC fourth at 45% and New York fifth at 44%.

    Honolulu: Almost as Bad as Los Angeles: Smaller metropolitan areas also exhibited intense traffic congestion. Honolulu had an average congestion delay nearly as bad as Los Angeles, at 32.4% and a worst hour average congestion delay of 64%. The core urban area of Honolulu has the highest density of any metropolitan area between 500,000 and 1,000,000 population. New York exurb Bridgeport-Stamford had a worst hour average congestion delay of 63%, with a peak period average congestion delay of 18.0%.

    Inrix: Density and Traffic Congestion: Virtually all of the congestion and most of the analyzed road mileage is in the urban areas, rather than in the rural areas that make up the balance of the metropolitan areas. The metropolitan areas with more dense urban areas tend to have worse traffic congestion, as the table below indicates.

      • Metropolitan areas with core urban densities (see Note 1) of more than 4,000 per square mile had peak period average congestion delays of 18.4%, which is more than three times that of metropolitan areas with core urban densities of less than 2,000 (5.9%).

      • Metropolitan areas with core urban densities of more than 4,000 per square mile had worst peak hour average congestion delays of 37.5%, which is nearly 2.4 times that of metropolitan areas with core urban densities of less than 2,000 (15.9%).

    These relationships are similar to those indicated in the Texas Transportation Institute data for 2007.

    Traffic Congestion & Urban Density in the United States: 2009
    Core Urban Area Density (2000) Peak Period Average Congestion Delay: 2009 Compared to Least Dense Category Worst Hour Average Congestion Delay: 2009 Compared to Least Dense Category
    Over 4,000 18.4% 3.26 37.5% 2.36
    3,000-3,999 10.0% 1.76 22.3% 1.41
    2,000-2,999 7.3% 1.30 17.7% 1.12
    Under 2,000 5.6% 1.00 15.9% 1.00
    Density: Population per square mile
    Travel Time Tax: Additional travel time required due to traffic congestion
    2000 population density is the latest reliable data
    Calculated from INRIX & 2000 Census data

    Sierra Club Data Also Shows Nexus: Moreover, the association between higher densities and greater traffic congestion is indicated by the ICLEI-Local Governments for Sustainability Density-VMT Calculator, which is based upon Sierra Club research. According to the Calculator, under the “smart growth” scenario, residential housing would be 15 units per acre, as opposed to its “business as usual” scenario at a typical density of four housing units per acre. The density of traffic (vehicle miles per square mile) under the higher density “smart growth” strategy would be 2.5 times as high as under the “business as usual” scenario (Figure).

    The Inevitable Comparisons: Invariably, analysts (smart growth advocates and me) like to point out relationships between Portland, with its “smart growth” policies and Atlanta, the least dense major urban area in the world. The Inrix data shows Portland to have an average peak hour delay of 12.2%, which is 15% worse than Atlanta (10.6%). Portland is nearly twice as dense as Atlanta, while Atlanta’s traffic congestion is made worse by one of the most decrepit freeway and arterial systems in the nation.

    A National Vision: Inrix has also developed a monthly national congestion delay factor. Inrix notes that traffic congestion had been improving as driving declined due to the Great Recession. However, Inrix refers to reduction in driving as “lucky,” and notes that without a “national vision” that “includes addressing congestion as a national priority,” greater traffic congestion will result.

    There is indeed good reason to address traffic congestion. As David Hartgen and M. David Fields have shown, there is a strong relationship between the higher levels of mobility that occur with less congestion and greater economic growth. Obviously that relationship extends to higher urban densities, which are associated with economically counter-productive levels of traffic congestion.

    But there is more than jobs and the economy. More intense traffic congestion produces more intense air pollution as well as more greenhouse gas emissions. It is well to remember that public health was the rationale for air pollution regulation. Air pollution’s negative impacts are so local that they are measured in the quality of life of individual people, especially those in close proximity to unnecessarily overcrowded roads. It is ironic that the higher density promoted by smart growth advocates exposes urban residents to more intense air pollution.


    Note 1: 2000 core urban area (urbanized area) population densities are used in this analysis because there is no later reliable information. The next reliable urban area density data will be a product of the 2010 census. The Federal Highway Administration (FHWA) produces later urban area density figures, many of which are substantially inconsistent with those of the United States Bureau of the Census, which is the primary source of such information. For example, as late as 2005, FHWA reported the Houston urban area to have 1.3 million fewer people than the Bureau of the Census, while reporting a land area nearly 250 square miles larger than the census had measured. Of course, this is a physical impossibility. The result was that Houston’s density was overstated by 45%.

    Note 2: Inrix also ranks metropolitan areas using an “overall congestion” measure, which is simply all congestion added up. As a result, the overall congestion measure is heavily weighted by population. This is illustrated by comparing Los Angeles and Honolulu. These metropolitan areas have very similar average congestion delays, as noted above. This means that drivers encounter similar traffic delays during peak in Los Angeles and Honolulu. However, Honolulu’s overall congestion measure is 95% less than that of Los Angeles, principally driven by the fact that Honolulu’s population is 93% less. As such, the overall congestion measure is of little relevance to people in their day to day commute or as a comparative measure of the intensity of congestion between areas.

    Photograph: Los Angeles City Hall.

    Wendell Cox is a Visiting Professor, Conservatoire National des Arts et Metiers, Paris. He was born in Los Angeles and was appointed to three terms on the Los Angeles County Transportation Commission by Mayor Tom Bradley. He is the author of “War on the Dream: How Anti-Sprawl Policy Threatens the Quality of Life.

  • Decentralize The Government

    From health care reform and transportation to education to the environment, the Obama administration has–from the beginning–sought to expand the power of the central state. The president’s newest initiative to wrest environment, wage and benefit concessions from private companies is the latest example. But this trend of centralizing power to the federal government puts the political future of the ruling party–as well as the very nature of our federal system–in jeopardy.

    Of course, certain times do call for increased federal activity–legitimate threats to national security or economic emergencies, such as the Great Depression or the recent financial crisis, for example.

    Other functions essential to interstate commerce–basic research, science education, the guarantee of civil rights, transportation infrastructure, as well as basic environmental health and safety standards–also call for federal oversight. Virtually every modern president, from Roosevelt and Eisenhower to Reagan and Clinton, has endorsed these uses of centralized government.

    But what is happening now goes well beyond the previously defined perimeters of the federal government’s powers. Obama seems to possess a desire not so much to fix the basic infrastructure of the country but to re-engineer our entire society into the model championed by liberal academia.

    There also seems to be a conscious design to recreate the country as a European-style super-state. Forged by an understandable urge to minimize chaos after a century of conflict, the super-state generally favors risk management through centralization of authority. This has traditionally been accomplished by ceding regulatory powers to national capitals, though lately more and more powers have been ceded to the European Union.

    Initially the administration had hopes of imposing similar controls through acts of Congress. However, with the shifting political mood, this seems less and less possible. With its latest action the administration sends the message that it will now impose the desired results through the bureaucracy. Under the proposal, private firms that do not raise wages will be bullied into doing so through the manipulation of federal contract awards.

    This marks a departure from our basic traditions. For most of our history the burden of expanding opportunity has rested with the private economy, albeit in conjunction with often necessary protections for workers and consumers. Now the overall control of the economy is shifting to Washington–from government contracts to ownership shares in companies like General Motors and much of the financial sector.

    This new order would transform the very nature of American capitalism. Now the economic winners will not be those working for the most agile or profitable companies, but those who gain the blessings of the federal overlords. In some senses this extends the corrupt, largely failed political economy of Chicago politics to a bastard American form of French dirigisme.

    Climate change provides another critical and necessary rationale for the expansive federal role. With the “cap and trade” system all but dead, the administration now wants to regulate energy and land use through the gentle graces of a largely unaccountable EPA apparat. As a result, we may see energy use, land use and transportation–as is increasingly the case in California–controlled by the whims of the unelected bureaucracy.


    Such command and control approaches have their advantages in making people do what the mandarins demand. This is one reason there are so many admirers of Chinese autocracy now. In that regime, unlike our messy democracy, you can be forced to be green in precisely the way they tell you. There are always firing squads for those who go off the program.

    Of course, even the most passionate centralists don’t advocate adopting the Chinese model. But the notion of an enlightened super-state has long appealed to those disgusted with American-style muddling through. In some ways, the current fashion recalls Americans’ attraction for the Soviet Union or even fascist Italy during the troubled 1930s.

    Fortunately, most Americans do not appear ready for unbounded autocracy. This is particularly true outside the coastal urban centers. The Tea Party may have some cranky–even ill-advised–ideas, but they reflect a genuine–and broader–American preference for solving problems at the state or local level.

    Indeed, Americans, including some on the left, are instinctive decentralists. We express this tendency physically, first in our decades-old movement to the suburbs, and increasingly to smaller towns and cities as well as rural areas. Even in cities like New York or Los Angeles, local neighborhood identity trumps ties to more grandiose visions of City Halls or regional bodies. The rise of the Internet and social networks has enhanced this decentralizing trend by providing instant linkages and helping ad hoc organization among neighbors.

    Economic evolution mirrors this trend. Over the past few decades U.S. employment has shifted not to mega corporations but to smaller units and individuals; between 1980 and 2000 the number of self-employed individuals expanded 10-fold to include 16% of the workforce. The smallest businesses–the so-called micro enterprises–have enjoyed the fastest rate of growth, far more than any other business category. By 2006 there were some 20 million such businesses, one for every six private sector workers.

    America’s entrepreneurial urge, in contrast to developments elsewhere, has actually strengthened. In 2008 28% of Americans said they had considered starting a business–more than twice the rate for French or Germans. Self-employment, particularly among younger workers, has been growing at twice the rate of the mid-1990s.

    The remarkable volatility within even the largest companies has exacerbated this trend. Firms enter and leave the Fortune 500 with increasing speed. More and more workers will live in an economic environment like that of Hollywood or Silicon Valley, with constant job shifts, changes in alliances between companies and the growth of job-hopping “gypsies.” Although hard times could slow new business formation, historically recessions have served as incubators of innovation and entrepreneurship.

    Much of the most dynamic and meaningful change takes place under the radar of both big business and government. The shift to greater localism can be seen in the growth of local, unaffiliated community churches, regional festivals and farmers markets. Bowling clubs and old men’s clubs may be fading, but volunteerism has spiked among millennials and seems likely to surge among baby boomers. In 2008 some 61 million Americans volunteered, representing over a quarter of the population over 16.

    No other major country exhibits this kind of localized, undirected activism. Such vital grassroots may become even more important as the country becomes more diverse. In the coming decades we will have to accommodate an expanding range of locally preferred lifestyles, environments, ethnic populations and politics. One size determined by mandarins in Washington increasingly will not fit all. South Dakotans and San Franciscans will prefer to address similar problems in different ways. Within the limits of constitutional rights, we should let them try their hand and let everyone else learn from their success (or failure).

    Ultimately, we do not want to recreate the expansive mandarin state so evident in many foreign countries. Instead, we should focus more on family, community, neighborhoods, local jurisdictions and voluntary associations–what Thomas Jefferson called our “little republics”–as the most effective engines driving toward a better future.

    This article originally appeared at Forbes.com.

    Joel Kotkin is executive editor of NewGeography.com and is a distinguished presidential fellow in urban futures at Chapman University. He is author of The City: A Global History. His newest book is The Next Hundred Million: America in 2050, released in Febuary, 2010.

  • Why Millennials are Economic Liberals and What to Do About It

    The Obama administration celebrated the anniversary of the passage of the American Recovery and Reinvestment Act, or economic stimulus, by pointing out the gradual recovery of the United States economy has resulted in “saving or creating two million jobs.” But young Americans continue to bear the brunt of what is still America’s worst recession since the Great Depression.

    From December 2008 to December 2009, the employment of 16-24 year olds in the U.S. fell by 1.78 million, or a third of the total estimated drop in employment of 5.4 million. Only 41% of Millennials are working full time, a drop of 9 percentage points in the last few years, even as the proportion of older workers employed full time remained fairly stable.

    The experience with hard times of Millennials, born 1982-2003, is one of the main reasons why they strongly support the classic liberal solution of effective government intervention in the economy. Recent Pew research, for example, indicates, that far more than older generations, a large majority of Millennials (71%) agrees that the government should guarantee that every citizen has enough to eat and a place to sleep. Millennials are also the only generation in which a majority (54%) disagrees with the contention that if something is run by the government it is usually inefficient and wasteful and a plurality (49%) rejects the belief that the federal government controls too much of our daily lives.

    A recent study by UCLA professor Paola Giuliano, and her colleague Antonio Spilimbergo, clearly documents the impact of recessions on people who are between 18 and 25, “during which most beliefs on how society and the economy work are formed.” Their research found that individuals who experienced recessions much milder than our current Great Recession during these formative years believe that “luck rather than effort is the most important driver of individual success, support more government redistribution, and have less confidence in institutions.” Other research shows that people who think luck is the primary driver of success are more willing to increase taxes to pay for a more activist government. Giuliano and Spilimbergo’s findings support the observation that lies at the heart of William Strauss and Neil Howe’s generational cycle theory, namely that the “values, attitudes and world-views” acquired during this period of early socialization “become fixed within individuals and are resistant to change.”

    The research of Giuliano and Spilimbergo also suggests that the Millennial Generation’s economic liberalism comes with a healthy dose of skepticism about the ability of institutions to help them meet their profound economic challenge. To fully restore Millennial confidence, government will need to take effective action to deal with the economy and reaffirm America’s tradition of economic mobility and rising middle class incomes. Beyond whatever short-term benefits President Obama’s stimulus program has provided, longer term more structural changes in the economy will need be made — starting with education.

    Higher education remains an important antidote to low wage employment in such economic circumstances, but only if students complete their chosen field of study. Yale economist Lisa Kahn has found that “the labor market consequences of graduating from college in a bad economy are large, negative and persistent,” resulting in lower wages, in less prestigious jobs for extensive periods of time. Her research suggests that even college graduates fortunate enough to get a job still suffer a 6 to 7 percent initial loss in income for every one percent drop in employment. Even though the differential diminishes over time, her research found such unlucky graduates still experiencing a statistically significant 2.5% loss of wages fifteen years later.

    Even so, those who get a four year college degree earn on average 35% more than those who leave college without getting a degree. Getting one or two years of post-secondary education and receiving an associate’s degree from a community college or a certificate from a career college also boosts wages above what they would have been without such a degree. One Florida study found that holders of certificates in particular occupations such as health care or IT earned 27% more than those who attended, but failed to complete, college. Associate degree holders earned 8% more than those who had no post-secondary education.

    One major reason students aren’t able to get a degree or certificate is that three-fourths of associate degree or certificate seekers end up working to help cover their education and living costs. Meanwhile federal support for higher education has failed to keep up with rising costs so that more and more students find themselves financing their education with student loans of one type or another. In Indiana, for instance, 62 percent of those who do manage to graduate carry student loan debt averaging $23,264 per student. The loan burden in that state is even higher for graduates of for-profit, private colleges who leave school with an average debt burden of $32,650.

    Increasing Pell Grant funding and the value of college tuition tax deductions are two steps government could take to address this problem. Reforming the student loan program to eliminate subsidies to banks as President Obama has advocated, and including student loans under any consumer protection agency that might be created as part of financial regulatory reform would also help address this problem that would fit with Millennial’s liberal perspectives.

    The other major reason students fail to complete their post-secondary education is the inadequate preparation for college, especially in math and science, they receive in high school. This is something that parents of Millennials will tolerate no longer. As Neil Howe points out, “when these Gen-X “security moms” and “committed dads” are fully roused, they can be even more attached, protective and interventionist than Boomer [parents] ever were. . .They will juggle schedules to monitor their kids’ activities in person. . . [and] will quickly switch their kids into – or take them out of – any situation according to their assessment of their youngsters’ interests.”

    These “stealth-fighter parents” have already begun to move one of the largest and most consistently poorly performing school districts in the country, Los Angeles Unified, forcing the district to grant them more say in school curriculum and governance. Their success led California’s usually dysfunctional legislature to pass a “parent trigger” law empowering a majority of parents in a demonstrably failing school attendance area to fire the principal and half the teachers as part of a turnaround initiative. Congress should incorporate this very interventionist idea into its reauthorization of the framework federal education law when it comes up for renewal this year. It should also expand funding for the Obama administration’s innovative Race to the Top initiative, which rewards schools that improve student learning performance rather than simply subsidizing mediocrity.

    All of these ideas will be resisted by those who believe that individual success is solely based upon effort and initiative and don’t believe in the efficacy of government efforts to revive the economy. Others with a stake in the status quo will argue against some of these ideas. But Millennials, whose lifetime of liberal economic beliefs have been forged by their experience with the Great Recession, will resist entreaties from those who offer only laissez faire economic policies or who try to delay dealing with these problems. They want government to act quickly and effectively, before they and their siblings are doomed to never enjoy the American Dream.

    Morley Winograd and Michael D. Hais are fellows of the New Democrat Network and the New Policy Institute and co-authors of Millennial Makeover: MySpace, YouTube, and the Future of American Politics (Rutgers University Press: 2008), named one of the 10 favorite books by the New York Times in 2008.

  • Young People Living Off the System in Sweden

    There are those who believe that Sweden has a low level of unemployment. This is far from the truth. The combination of high taxes, generous government benefits and a regulated labor market has led to many Swedes to rely on handouts rather than work. The system does succeed in one thing: hiding the true unemployment.

    A few years ago, the Swedish economist Jan Edling noted that the number of people on sick leave and early retirement tended to correlate strongly with unemployment figures. The reason, Edling explained, was that many of the unemployed were hidden from the statistics through these measures.

    Far from being a right-leaning economist, Edling at the time worked for LO – an influential labor union with strong official and unofficial ties to the then-ruling Social Democratic party. The claim that the Swedish welfare state hid actual unemployment through various measures was unpopular among Swedish socialists. So unpopular in fact that Edlings report was not published, causing him to resign after 18 years faithful service.

    Four years ago a center right government was elected with the promise to reduce visible and hidden unemployment. The government has had some success in this, at last before the financial crisis hit and again raised unemployment. Tax cuts and reduced generosity of government benefits have promoted work over dependence. However, among one group reliance on government has not decreased: young people who are relying on early retirement for their living.

    The concept of relying on early retirement among the relatively youthful might sound a bit strange. Swedish politicians have even changed the term “early retirement” into “activity and sickness compensation” to make it sound more acceptable. And it has oddly enough become more or less an accepted fact that many young Swedes who cannot find a job instead rely on early retirement – often on a permanent basis.

    Since 2004 close to 70,000 Swedes in the ages 20-39 have been supported by early retirement. This represents close to three percent of the total population among this age group living in the country. In the Stockholm region, where the labor market is strong, two percent of the young population is living on early retirement. In regions where jobs are scarcer, the figure is four percent. Even among the youngest group – those between 20-24 years – more than two percent of Sweden’s population is being supported by early retirement.

    One reason for the popularity of early retirement is because of the increasing troubles for young Swedes to find employment. According to Statistics Sweden, the unemployment amongst those between 15-24 years was fully 24 percent in the beginning of 2009. Although Sweden does not have minimum wages set by the government, the vast majority of the employers have to follow labor union contracts and the contracts in turn include very high effective minimum wages.

    Not only is the price of youth labor set too high for demand to meet supply, but employers find it too risky to hire inexperienced youth since rigid labor market regulation make it difficult to fire those who do not perform well on their job.

    The high unemployment amongst youth is not only an economical, but also a social issue. Many young people feel depressed since they cannot find a meaningful purpose and cannot contribute to society. This feeling, strong among the youth who are not even officially employed, but rather hidden from the statistics through early retirement, sick leave or other systems.

    The OECD measures the percentage of those who are officially declared to be outside of the workforce but view themselves as being unemployed. This group is referred to as “discouraged workers”. In countries such as Denmark, Germany and the United Kingdom only 0.1 percent of the labor force of 15-24 year olds is composed of discouraged workers. In Sweden, the figure is almost a hundred times higher.

    The Swedish welfare system is seen as many as a role model. When it comes to creating opportunities for the youth however, Sweden could learn much from free-market systems. Or for that matter it could learn from neighboring welfare state Denmark, which has combined welfare mechanisms with a dynamic labor market. The combination, coined by previous Social Democratic Prime Minister Poul Nyrup Rasmusson as “flexicurity”, is far superior to the system of high effective minimum wages and rigid labor regulations introduced by the Social Democrats and their labor union allies in Sweden.

    Nima Sanandaji is the CEO of Swedish think tank Captus, and author of a report on early retirement among the youth for the think tank Timbro.

    Photo: by Claudio.Ar

  • The 10 Percent Solution to Urban Growth

    What if we achieved the urbanist dream, with people deciding en masse to move back to the city? Well, that would create a big problem, since there would be no place to put them. Many cities hit their peak population in 1950, when the US total was 150 million. Today it is over 300 million, with virtually all the growth taking place in the suburbs.

    So where would these new urbanites reside? With the enormous losses in our urban housing stock, our cities lack the residences to hold even their 1950 population. A recent survey found that one third of all the lots in Detroit are now vacant, for example. And even if all the old housing was rebuilt, declines in household sizes, particularly in urban areas, has reduced the effective carrying capacity of the old urban fabric even at historic densities.

    But there’s an even bigger challenge to wholesale urbanization from future population growth. The Census Bureau estimates that the US will add nearly 100 million more new people by 2050. If you look at the few cities in the country that have large inhabited urban cores, they hold a relatively small percentage of the current population. New York City, Los Angeles, Chicago, Philadelphia, San Francisco, Boston, Seattle and Washington, DC combined barely hold 20 million people. Even if all these cities doubled in population by 2050, they would only be able to hold 20% of the net new growth expected over the next four decades.

    And achieving even that level of urban growth is simply not realistic. Most of the existing highly urbanized cities are already largely full of buildings. Even where land is available, zoning restricts what can be built there, and increasing densities is politically difficult. New York City has been the most aggressive on the growth front, rezoning 20% of the city under the Bloomberg administration, although many sections have actually been downzoned.

    But even this effort could accommodate a projected one million new residents by 2030. Chicago is going the other direction. When it introduced new zoning under the Daley administration, permitted densities were actually reduced in most cases, though Chicago remains perhaps the only truly urban city with large amount of vacant or underutilized land for redevelopment. Ed Glaeser calls for building skyscrapers in California, but San Francisco residents are imbued with a strong anti-development mindset and have long railed against the “Manhattanization” of their city.

    America could not be reshaped from a primarily suburban to a city-centric country without a massive shift in local political mind-sets. Rather than attempting that exercise in futility, urban advocates should adopt much more modest goals that, although limited, could be completely transformational for our cities.

    There’s been much made of the return to the city. Indeed, large tracts of the urban cores of many places have been utterly remade. But most of the cities where this has happened have been America’s largest tier one cities – New York, Chicago, Boston, etc. They have achieved the point of self-sustaining urban growth, and are well positioned to attract more residents, particularly the upscale and childless, young singles and students and recent immigrants.

    In contrast, smaller cities have seen a few hundred downtown condos and such, but not a real urban renaissance. There is still a lot of work to do in those places.

    The way to do this is to adopt the “10 percent solution”. That is, for most cities, they should develop a strategy that tries to capture somewhere between 5 and 15 percent of the net new growth in their metro areas. If a city can get more, great. But for any growing region, even 10 percent would create a dynamic of massive change in the urban core.

    Consider Indianapolis, a region with healthy regional growth that is above average but not among the nation’s leaders. The Indianapolis metro area is adding people at a rate of about 200,000 people per decade. Center Township, which is the urban core of the city, peaked in population in 1950 at 337,000 people. Today it is at 167,000, a decline of 50%, on par with America’s greatest urban collapses

    But what if the urban core managed to capture 10% of that new growth? That’s 20,000 new residents, very easy to physically accommodate within a decade. What would 20,000 new residents do to central Indianapolis? What would it do to the entire dynamic of the city? It could be completely transformational.

    Such a modest capture of new population would catapult central Indianapolis into one of the absolute top growth areas in the region. Only one suburb is on track to add that many or more people during the 2000s. Many other suburbs are considered prosperous and fast growing despite adding only a few thousand people. Even that limited influx creates a pattern of growth vs. stagnation and decline. That’s where urban Indianapolis needs to get.

    One of the great advantages of targeting 10% market share in new growth is that it frees the city to pursue a market segmentation strategy. It doesn’t have to try to convince vast numbers of suburbanites – the vast majority of whom are likely to stay in place – to make a radical lifestyle change. Rather, the core can market to specific segments that it is best positioned to attract, and put together the most compelling and differentiated product to attract them.

    One potential market is those who want an urban environment but can’t afford to live in one of the expensive tier one cities. They could market themselves to people who find themselves priced out of the biggest cities, but would settle in a smaller, but still vibrant urban environment.

    Can Indianapolis do it? As with many cities, there is already some evidence that it could. In the 2000s, decades of population decline came to an end in 2006, and Center Township started adding an estimated 400 people per year. The jury is still out on whether the estimates are confirmed by the census count and whether it can be sustained, but it still amounts to 4,000 people per decade, showing that the city is already starting to make progress.

    Cincinnati provides another example. It is a metro growing a bit less than the national average, but still adding people at a rate of about 150,000 per decade. The city of Cincinnati declined from a peak of 503,998 in 1950 to 333,336 today, a loss of 170,000 people. Again, if the city captured 100% of just regional growth, in little more than a decade it would be back to a record high population. That’s not realistic of course, but 10% of that total, or 15,000 people, would still make a tremendous impact on the city. Like Indianapolis, there’s already some sign of an inflection point, as the city population began growing again in the 2000s.

    Can this 10% solution really happen? The answer is a resounding Yes, because it is already happening in Atlanta. Its reputation as a sprawlburg overshadows the fact that it is experiencing one of America’s most impressive urban core booms. The city of Atlanta has added almost 120,000 new residents since 2000, an increase of 28%. This is a mere 10.5% of the metro area’s growth during that time – but it has totally changed the city. Atlanta lost over 100,000 people from its 1970 peak, but is now at an all time high.

    Viewed in this realistic light, there is huge reason for optimism about rebuilding the urban cores of even our Rust Belt cities. Frankly, with the required market share of growth to get there so low, there’s no excuse for not making it happen. If city leaders can’t figure out how to attract even 10% of the market, they deserve to lose. If they can do better, great. And once they’ve captured that 10% base, and restarted a growth pattern, they can figure out how to get more ambitious and expand market share.

    For regions with population decline, like Detroit and Cleveland, there’s a different and much more challenging dynamic. But for cities with even modest regional population growth, there’s all the opportunity in the world to attract new urban residents and completely change the game for their urban cores.

    Aaron M. Renn is an independent writer on urban affairs based in the Midwest. His writings appear at The Urbanophile.

    Photo: Carl Van Rooy (vanrooy_13)

  • Welcome to Ecotopia

    In this era of tea-partying revolutionary-era dress-ups, one usually associates secessionism with the far right. But if things turn sour for the present majority in Washington, you should expect a whole new wave of separatism to emerge on the greenish left coast.

    In 1975 Ernest Callenbach, an author based in Berkeley, Calif., published a sci-fi novel about enviro-secessionists called Ecotopia; a prequel, Ecotopia Rising, came out in 1981. These two books, which have acquired something of a cult following, chronicle–largely approvingly–the emergence of a future green nation along the country’s northwest coast.

    Aptly described by Callenbach as “an empire apart,” this region is, in real life, among the world’s most scenic and blessed by nature. Many in this part of America have long been more enthusiastic about their ties to Asia than those with the rest of the country. It is also home to many fervent ecological, cultural and political activists, who often feel at odds with the less enlightened country that lies beyond their soaring mountains.

    Until the election of Barack Obama, the Pacific Northwest certainly was separating from the rest of America–at least in attitude. After George W. Bush’s victory the 2004 presidential election, the Seattle weekly The Stranger published an angry editorial about how coastal urbanites needed to reject “heartland values like xenophobia, sexism, racism and homophobia” and places where “people are fatter and dumber and slower.”

    Such a narrow, cynical view of the rest of the country is in line with Callenbach’s Ecotopia novels, in which the bad guys–representatives of American government and corporations–are almost always male, overweight and clueless about everything from technology to tending to the earth.

    Of course, would-be Ecotopians have much of which to be proud. The three great cities of the region–San Francisco, Portland and Seattle–easily rank among the most attractive on the continent. They all boast higher-than-average levels of education and–at least around San Francisco and Seattle–some of the world’s deepest concentrations of high-tech companies.

    Yet for all their promise, the Ecotopian regions cannot claim to have missed the current recession. Downtown Seattle currently suffers a vacancy rate in excess of 20%, the highest in decades; last year apartment rental rates dropped 13.8%, the steepest decline among American metros. Meanwhile vacancies in the Silicon Valley area south of San Francisco have soared to above 20%. By early this year, there was enough unoccupied office space in the Valley to fill 15 Empire State Buildings.

    This may seem a bit counter-intuitive for a region that boasts the headquarters of Microsoft, Costco, Amazon, Intel and Apple. But while such companies provide lots of high-wage employment, they are no longer enough to spark much growth across the region’s economy. The San Francisco area has actually lost jobs over the past decade and shows little sign of recovering its once prodigious growth rates.

    But easily the weakest of the economies has been Portland, which lacks the presence of major anchor firms like those in greater Seattle or the Bay Area. Portland’s unemployment rate has been well over 10% since late last year.

    A wave of youthful migration has made the city a slacker haven for the past decade and, in turn, exacerbated unemployment figures. Homeless kids now crowd the downtown area, which, although far from destitute, does appear pretty grungy in places.

    Yet, like the Ecotopians in the Callenbach novels, Portland residents and politicians seem nonplussed about their anemic economic performance. After all, the city voted heavily–despite solid opposition from the rest of the state–to raise Oregon’s taxes on wealthy individuals and corporations, a move likely to deter new in-bound investment.

    “You don’t have a big focus here on economic development,” observes Stephen B. Braun, dean of the School of Management at Portland’s Concordia University. “There’s much more emphasis on quality of life than on making a living.”

    The proof: Portland may have high unemployment, but the big idea around city hall is not how to promote jobs but about investing an additional $600 million in bike lanes.

    All these places, of course, avidly endorse green jobs even if there’s little prospect they could replace the jobs being lost in the fading blue-collar sectors. A growing green job sector needs a vibrant economy that produces things and builds new buildings, notions that have little currency across much of the region.

    This anti-growth attitude reflects that of Callenbach’s Ecotopia, which favors a “stable state” economy over job or wealth creation. Ecotopian politics explicitly ban both population increases and the private automobile.

    While the mayors of Portland, San Francisco and Seattle are hardly that extreme, they could propose policies that would make driving more burdensome. And they certainly seem to do wonders in chasing would-be baby-makers out of the city. All three cities have among the lowest percentages of children of any in the U.S.

    Perhaps the toughest issue facing the Ecotopian political economy lies with the issue of class. Callenbach’s Ecotopia adopts something of an anarchic socialism; the cities of the real ecotopia have tended toward ever greater class bifurcation.

    San Francisco, for example, boasts one of the highest per capita incomes in the nation and remains a favorite destination for inherited wealth, whether among individuals or nested in nonprofits. Yet according to the Public Policy Institute of California, if the cost of living is applied, San Francisco ranks high among urban counties in terms of its concentration of poverty.

    It doesn’t help that the city’s economy has been hemorrhaging corporate headquarters and mid-range middle-class jobs for decades. High-end workers commute to Google and other Valley companies, and others work in the financial or media sectors, but many mid-range jobs have been lost, many of them to more affordable business-friendly locales in places like Colorado.

    As middle-class jobs disappear, Ecotopia’s cities increasingly resemble restrictive communities that are anything but diverse. As analyst Aaron Renn has pointed out, Portland and Seattle stand as among the whitest big cities in the nation. And San Francisco’s once vibrant African-American population has been dropping for decades.

    In the coming years this pattern will likely become more pronounced in Seattle and Portland as well. These cities continue to attract many well-educated people, particularly from California, who in turn bring with them both significant accumulated wealth and anti-growth attitudes.

    Strict “green” planning regimes are also accelerating the decline of the local middle class by driving housing prices up, greatly diminishing the once wide affordability for the middle class. Seattle’s regulatory environment, according to one recent study, has bolstered housing prices in the region by $200,000 since 1989. The percentage of families who could afford a median price home in the area has fallen by more than half.

    Many observers see a similar outcome from Portland’s widely ballyhooed planning regime. Despite the massive acceptance by planners as something of a model for the restored city, the vast majority of all job and population growth in the region has occurred at the less pricey fringes, including across the river in Vancouver, Wash., which lies outside the fearsome Portland planning regime.

    So what is the future for the region, and particularly the eco-cities? If the country starts moving toward the center, and even the right, you can expect Ecotopian sentiment to rise again, perhaps not to the point of secession but expressed in attitude.

    But this may not be all bad. As America’s population grows and other regions rise, perhaps it’s helpful for the various parts of the country to experiment with different systems. Short of civil war, there’s something to be said for relentless, even if sometimes daft, experimentation at the local level. The rest of country may not follow all their strictures, but our would-be Ecotopians could produce some interesting and even usable ideas.

    This article originally appeared at Forbes.com.

    Joel Kotkin is executive editor of NewGeography.com and is a distinguished presidential fellow in urban futures at Chapman University. He is author of The City: A Global History. His newest book is The Next Hundred Million: America in 2050, released in Febuary, 2010.

  • The Heavy Price of Growth Management in Seattle

    The University of Washington Study: Economist Theo Eicher of the University of Washington has published research indicating that regulation has added $200,000 to house prices in Seattle between 1989 and 2006. Eicher told the Seattle Times that “Seattle is one of the most regulated cities and a city whose housing prices are profoundly influenced by regulations.”

    Not surprisingly, this caused consternation in the planning community, which would prefer to minimize or dismiss any negative consequences of planning regulations on housing affordability.

    The Washington Chapter of the American Planning Association (W-APA) published a response. Admitting that “land use regulations do add costs to housing”, it criticizes the Eicher study for focusing “solely on cost” and ignoring how land use regulations add to the quality of life. (Note 1). A recent Washington Policy Center report provides a detailed critique of the W-APA report. This article evaluates Seattle housing affordability trends using basic price and income data and the Median Multiple (median house price divided by median household income), a standard affordability measure that has been recommended by both the World Bank and the United Nations.

    How Growth Management Raises House Prices: It has been established that overly prescriptive land use regulation (called growth management or smart growth) raises house prices. As the former governor of the Reserve Bank of New Zealand Donald Brash has pointed out the affordability of housing is overwhelmingly a function of just one thing, the extent to which governments place artificial restrictions on the supply of residential land.

    However, the mere adoption of growth management or smart growth polices does not increase housing costs. Where, for example, an urban growth boundary (a favored strategy of growth management) is drawn far enough from the urban area, there may be little interference with developable land values. This was the case in Portland, for example, in its early growth management days. However, as land was developed and the urban growth boundary was not moved sufficiently outward in response, land became more scarce and land prices were driven up, leading to Portland’s severe housing unaffordability.

    How Growth Management Drives Up House Prices: Land prices are driven up as market participants perceive scarcity. When government policies constrict the supply of land, developers purchase “land banks” to ensure that they have access to land inventory. Without growth management, developers and builders can purchase land when they need it, because governments have not placed artificial restrictions on its supply.

    In the more prescriptive environment, property appraisals rise and sellers are able to obtain higher prices because development is prohibited on most land. In short, sellers face less competition and can command much higher prices.

    Sometimes growth management proponents claim that their communities have sufficient land available for building. However, the interplay between land buyers and sellers creates a rigged game that leads to higher land prices. This is obvious in everywhere from Seattle and Portland to California and Florida. In these markets, there is not a sufficient supply of “affordable land” for building. A New Zealand government’s “2025 Taskforce” found the price of comparable land to be about 10 times as high if it is inside an urban growth boundary rather than outside (essentially across the road).

    Seattle’s Lost Housing Affordability Decade: During the decade of the housing bubble (1997 to 2007), the median house price increased from $169,000 to $395,000 in Seattle. In 1997, Seattle’s housing affordability was rated “moderately affordable,” with a Median Multiple of 3.3 (median house price divided by median household income). By 2007, the Median Multiple had escalated to 6.2, indicating housing unaffordability worse than any major metropolitan area between World War II and 1997. (Figure 1). Of course, other markets, particularly in California, became even more unaffordable after 1997.

    In Seattle and other more prescriptive markets, house prices exploded during the housing bubble. At the same time, many other markets experienced only modest house price increases. The easier money and profligate lending practices thus produced very different results. In more prescriptive markets, like Seattle, both underlying and speculative demand drove prices to unprecedented heights. In the more responsive markets, the generally higher underlying demand was accommodated by planning systems that permitted sufficient new housing to be built on affordable land and price escalation was far more modest (as were subsequent price losses).

    New House Example: The role of Seattle’s growth management in driving up land and house prices is obvious. According to W-APA, approximately 62% of the cost of a new house in 1999-2000 was in construction costs. A new house in 1997 costing the same as a median house price would have involved approximately $105,000 in construction costs. Based upon subsequent house cost increases and the decline in house construction costs relative to the rest of the nation in Seattle, construction costs on the same house should have risen $40,000 from 1997 to 2007 (Note 2). At the same time, the median house price in Seattle increased $225,000. Less ss than 20% of the cost escalation could be attributed to construction cost inflation. Nearly $185,000 was due to other factors, principally higher land prices.

    Comparing Seattle to Dallas-Fort Worth: Things were very different in more responsive markets, as is illustrated by Dallas-Fort Worth (Figure 2). Dallas-Fort Worth, now the nation’s fourth largest metropolitan area, trailing only New York, Los Angeles and Chicago has grown more than twice as fast as Seattle (21.2% from 2000 to 2008, compared to 9.6%). Dallas-Fort Worth’s underlying demand has been even greater relative to Seattle, as indicated by its net domestic migration. Dallas-Fort Worth has added more than 10 times as many domestic migrants (260,000 versus 23,000) and more than 5 times its 2000 population (5.0% v. 0.8%). Moreover, and perhaps surprisingly, the Dallas-Fort Worth urban area (along with Houston) is more compact (read “sprawls” less) than Seattle (Note 3). Finally, the share of sub-prime mortgages was higher in Dallas-Fort Worth than in Seattle.

    Yet, despite this huge demand, housing affordability has remained below the historic Median Multiple norm of 3.0. In 2007, the Dallas-Fort Worth Median Multiple was 2.7. The median house price increased $32,000 from 1997 to 2007 and more than 70% of the change was due to construction costs.

    In 1997, the Seattle median house price was $54,000 higher than in Dallas-Fort Worth. By 2007, the price of a median house in Seattle had escalated to nearly $250,000 more than its counterpart in Dallas-Fort Worth (Since 2007, house prices have dropped $90,000 in Seattle and $5,000 in Dallas-Fort Worth, illustrating the more intense price volatility of tightly regulated markets. Even so, Seattle housing affordability remains materially worse than before).

    Driving Households out of the Home Ownership Market: If 1997 housing affordability (using the Median Multiple) had been retained, 50% of Seattle households would have been able to qualify for a mortgage on the median priced house. However, by 2007 only about 20% of Seattle households could have qualified for a mortgage on the median priced house in 2007 at present FHA underwriting standards (Note 4).

    Impact on Minority Households: The highest price, however is being paid by Seattle’s minority households (Figure 2).

    • The share of African-American households able to qualify for a mortgage on the median priced house declined nearly 70% compared to 1997 affordability (Median Multiple). At 1997 housing affordability, more than 25% of African American households would have been able to qualify for a mortgage on the median priced house in 2007. In reality, by 2007, less than 10% of African-American households could have qualified for a mortgage on the median priced house.
    • The share of Hispanic households able to qualify for a mortgage on the median priced house declined more than 70% compared to 1997 affordability (Median Multiple). At 1997 housing affordability, more than 35% of Hispanic households would have been able to qualify for a mortgage on the median priced house in 2007; by 2007 than number had plunged to less than 10%.

    The High Price of Growth Management in Seattle: The 10-year trend of house prices increases in the Seattle metropolitan area supports Eicher’s analysis. We readily admit to the charge of evaluating housing affordability “solely on price.” There is still the dubious W-APA claim that land regulation adds to the quality of life. But whose quality of life? As housing affordability declines, the quality of life may be raised for some, but only by keeping others down.


    Notes:

    (1) The W-APA report makes the common error of presuming that land use restraints were not a factor in the house price escalation of Phoenix and Las Vegas. In fact, the Brookings Institution ranks both metropolitan areas as toward the more restrictive end of the regulatory spectrum. These overly prescriptive regulatory environments are exacerbated by the fact that in both metropolitan areas much of the developable suburban land is owned by government, and is being auctioned, though at a rate less than demand. These factors combined to drive auction prices per acre up nearly 500% in Phoenix and nearly 400% in Las Vegas during the housing bubble. Despite their high building rates, these land restrictions denied sufficient affordable land for development to keep house prices from rising rapidly. Further, W-APA refers to Phoenix and Las Vegas as having “relatively unfettered sprawl,” yet both are more compact than Seattle. In 2000, the Las Vegas urban area (area of continuous urban development) was 62% more dense than Seattle and the Phoenix urban area was 28% more dense than Seattle (calculated from US Bureau of the Census data).

    (2) There are no reliable sources for median new house prices at the metropolitan area level. Generally, however, US Bureau of the Census data indicates that in the West, the median priced new house costs have averaged 6% more than the median priced house in the 2000s. Construction cost escalation (national and Seattle) is calculated from R.S. Means Residential Square Foot Costs (1997 and 2007 editions).

    (3) In 2000, the Seattle urban area had a density of 2,844 persons per square mile. Dallas-Fort Worth had a density of 2,946 and Houston had a density of 2,951. All three were relatively close to Portland (3,340), but well behind Los Angeles (7,069), which is the most dense major urban area in the nation.

    (4) Estimated assuming a FHA “front end ratio” of 29%, (mortgage, property tax and homeowners insurance divided by gross annual income) and a 10% down payment. Calculated using 2007 American Community Survey income data for the Seattle metropolitan area.


    Wendell Cox is a Visiting Professor, Conservatoire National des Arts et Metiers, Paris. He was born in Los Angeles and was appointed to three terms on the Los Angeles County Transportation Commission by Mayor Tom Bradley. He is the author of “War on the Dream: How Anti-Sprawl Policy Threatens the Quality of Life.