Category: Demographics

  • Housing Unaffordability as Public Policy: The New Demographia International Housing Affordability Survey

    The just released 6th Annual Demographia International Housing Affordability Survey shows some improvement in housing affordability, especially in the United States and Ireland but a continuing loss of housing affordability, especially in Australia.

    The Survey, co-authored by Hugh Pavletich of Performance Urban Planning, covers 272 metropolitan markets in 6 nations (the United States, the United Kingdom, Canada, Australia, Ireland and New Zealand). The Survey estimates housing affordability using the “Median Multiple,” which is the median house price divided by the median household income. As recently as the late 1980s, the Median Multiple virtually everywhere was 3.0 or below. Over the past 10 to 20 years, however, the Median Multiple has risen worryingly in all major markets of the United Kingdom, Australia, New Zealand and Ireland and in some markets in the United States and Canada.

    Housing affordability is rated on a four category scale, from “affordable” to “severely unaffordable” (Table 1).

    Table 1
    Demographia Housing Affordability Rating Categories

    Housing Affordability Rating

    Median Multiple

    Severely Unaffordable

    5.1 & Over

    Seriously Unaffordable

    4.1 to 5.0

    Moderately Unaffordable

    3.1 to 4.0

    Affordable

    3.0 or Less

    Affordable Markets: The Survey found affordable markets in both the United States and Canada. This included fast-growing markets, such as Atlanta, Dallas-Fort Worth and Houston, which have had the highest underlying demand of any metropolitan areas with more than 5,000,000 population in the high-income world. It also includes the “Rust Belt” metropolitan areas, such as Detroit, which has experienced severe declines in demand in the Great Recession. There were also a number of additional metropolitan areas that are neither fast growing nor in dire economic straits, such as Indianapolis, Kansas City and Cincinnati (Table 2).

    Table 2
    Affordable Major Markets: 2009: Third Quarter
    Affordability Rank Nation Market Median Multiple
    1 United States Detroit, MI 1.6
    2 United States Atlanta, GA 2.1
    3 United States Indianapolis, IN 2.2
    4 United States Rochester, NY 2.3
    5 United States Cincinnati, OH-KY-IN 2.4
    5 United States Cleveland, OH 2.4
    5 United States Las Vegas, NV 2.4
    8 United States Buffalo, NY 2.5
    9 United States Columbus, OH 2.6
    9 United States Kansas City, MO-KS 2.6
    9 United States Phoenix, AZ 2.6
    9 United States Pittsburgh, PA 2.6
    9 United States St. Louis, MO-IL 2.6
    14 United States Dallas-Fort Worth, TX 2.7
    14 United States Jacksonville, FL 2.7
    16 United States Memphis, TN-AR-MS 2.8
    16 United States Minneapolis-St. Paul, MN-WI 2.8
    16 United States Louisville, KY-IN 2.8
    19 United States Houston, TX 2.9
    20 United States Oklahoma City, OK 3.0
    20 United States Riverside-San Bernardino, CA 3.0
    20 United States Tampa-St. Petersburg, FL 3.0

    Severely Unaffordable Markets: There were also 18 severely unaffordable markets, in five nations. The least unaffordable market was Vancouver (Canada), with a Median Multiple of 9.3. Sydney (Australia) was the second least affordable market (9.1), followed by Melbourne (8.0) and Adelaide (7.4). The most unaffordable markets also London (GLA or inside the greenbelt), with a Median Multiple of 7.1, San Francisco (7.0), New York (7.0), Perth, Australia (6.9), Brisbane, Australia (6.7), Auckland, New Zealand (6.7) and the London Exurbs (outside the greenbelt), at 6.7. Los Angeles-Orange County, which was the most unaffordable metropolitan area in the first four Surveys, remained severely unaffordable, at 5.7 (Table 3).

    Table 3
    Severely Unffordable Major Markets: Third Quarter: 2009
    Unaffordability Rank Nation Market Median Multiple
    1 Canada Vancouver 9.3
    2 Australia Sydney 9.1
    3 Australia Melbourne 8.0
    4 Australia Adelaide 7.4
    5 United Kingdom London (GLA) 7.1
    6 United States New York, NY-NJ,-CT-PA 7.0
    6 United States San Francisco, CA 7.0
    8 Australia Perth 6.9
    9 Australia Brisbane 6.7
    9 New Zealand Auckland 6.7
    9 United Kingdom London Exurbs 6.7
    12 United States San Jose, CA 6.4
    13 United Kingdom Bristol-Bath 6.1
    14 United States San Diego, CA 6.0
    15 United States Los Angeles-Orange County, CA 5.7
    16 United Kingdom Stoke on Trent & Staffordshire 5.3
    17 Canada Toronto 5.2
    18 United Kingdom Newcastle & Tyneside 5.1

    Severely Unaffordable Markets: There were also 18 severely unaffordable markets, in five nations. The least unaffordable market was Vancouver (Canada), with a Median Multiple of 9.3. Sydney (Australia) was the second least affordable market (9.1), followed by Melbourne (8.0) and Adelaide (7.4). The most unaffordable markets also London (GLA or inside the greenbelt), with a Median Multiple of 7.1, San Francisco (7.0), New York (7.0), Perth, Australia (6.9), Brisbane, Australia (6.7), Auckland, New Zealand (6.7) and the London Exurbs (outside the greenbelt), at 6.7. Los Angeles-Orange County, which was the most unaffordable metropolitan area in the first four Surveys, remained severely unaffordable, at 5.7 (Table 3).

    Summary by Nation: As in the five previous Surveys, there is a close relationship between housing unaffordability and categories of land use regulation. Virtually all severely unaffordable markets are characterized by “more prescriptive” land use regulation policies (also called “compact city,” “urban consolidation,” “growth management,” or “smart growth”). At the same time, the affordable markets overwhelmingly have “more responsive” land use regulation, in which new residential development is demand driven.

    Australia: The most extreme housing unaffordability has evolved in Australia. Australia’s overall Median Multiple was 6.8, with a housing affordability rating of severely unaffordable. A recent Bank West report also noted the deteriorating housing affordability and indicated housing affordability was a thing of the past for “key workers.” This is a dramatic turnaround; housing had been affordable widely in Australia in the late 1980s, with a Median Multiple of under 3.0 and remained under 3.5 until the late 1990s. All but one of Australia’s 23 markets were severely unaffordable, with one being seriously unaffordable. All of Australia’s major markets (over 1,000,000 population) have strong “urban consolidation” policies that have resulted in unaffordable land on the urban fringe and a substantial decline in house construction, despite the highest national population growth rate among the surveyed nations.

    Canada: Canada has an overall Median Multiple of 3.7 and is thus rated moderately unaffordable. Housing had been affordable in Canada in the late 1990s, with a Median Multiple of 3.0. Canada has 5 affordable markets and 4 severely unaffordable markets. Thirteen markets were rated moderately unaffordable, while 6 were rated seriously unaffordable. Like the United States, land use regulation is under the control of sub-national governments and thus ranges from demand driven to plan driven regimes.

    Ireland: Ireland has experienced a substantial improvement in its housing affordability. Ireland has a Median Multiple of 3.7, and is rated moderately unaffordable. Housing had been affordable as late as the middle 1990s, with a Median Multiple below 3.0.

    New Zealand: New Zealand’s overall Median Multiple was 5.7, for a severely unaffordable rating. Housing had been affordable in the early 1990s, with a Median Multiple of under 3.0. Five of the 8 markets were rated severely unaffordable, while 3 markets were seriously unaffordable. As in Australia, more prescriptive land use regulation is pervasive.

    United Kingdom: The overall Median Multiple in the United Kingdom was 5.1, for a severely unaffordable rating. Housing had been affordable in the late 1990s, with a Median Multiple of under 3.0. Despite the recent house price declines, 19 of the 33 surveyed markets were rated severely unaffordable and 14 were rated seriously unaffordable. The connection between the UK’s housing unaffordability and its plan-driven regulation has been documented in Labour government commissioned report by Kate Barker, a member of the Monetary Policy Committee of the Bank of England.

    United States: The United States is the first nation in Survey history to have achieved an overall affordable rating, with a Median Multiple of 2.9. The recent house price declines have restored national housing affordability to the below 3.0 historic norm (last achieved in the early 2000s), as the price bubble burst in many markets. There were 98 affordable markets, most of which experienced an increase in demand. There were also 58 moderately affordable markets. Even with the price decreases, however, house prices remain far above historic norms in some markets. Eight of the markets were seriously unaffordable, while 11 were severely unaffordable. Plan-driven land use regulation is in place in all of the major markets with severely unaffordable housing affordability.

    Comparing Sydney, Melbourne, Dallas-Fort Worth and Atlanta

    Australia: A Nation in Mortgage Stress: The Survey includes a comparison of four similar markets, Sydney and Melbourne in Australia to Dallas-Fort Worth and Atlanta in the United States. In the early 1980s, Sydney had a higher population than Dallas-Fort Worth and Melbourne had a higher population than Atlanta. Since that time, the two US metropolitan areas have passed the Australian metropolitan areas in population, having added more people than Australia’s five largest metropolitan areas combined (Sydney, Melbourne, Brisbane, Perth and Adelaide). At the same time, despite their far higher demand, housing affordability has improved in Dallas-Fort Worth and Atlanta, while it has deteriorated markedly in Sydney and Melbourne (Figure 1). During this period, “plan driven” or more prescriptive land use policies were strongly enforced in Sydney and Melbourne in contrast to the “demand driven” land use policies in place in both Atlanta and Dallas-Fort Worth.

    Australian government agencies consider any household paying more than 30% of its gross income for housing to be in “housing stress.” At this point, a median income household in Sydney or Melbourne would pay more 50% or more of its gross income annually for a new mortgage on a median priced house. In Brisbane, Perth and Adelaide, the figure is above 40%. (Figure 2). By comparison, in Dallas-Fort Worth and Atlanta, however, the median income household would pay less than 20% of its income for the mortgage. Not surprising then is the huge loss in housing affordability in Australia, and a decline in home ownership rates from 72% to 68% between 1995 and 2008.

    Unaffordable Housing as Public Policy: It is clear that much of the cause for the differences in affordability lies with contrasting public policy approaches. The strong intervention in land markets under plan-driven regulation raises the price of land inordinately. Governments appear to have, however unwittingly, established unaffordable housing as an objective of public policy. Yet despite this, there is pressure – including from the US Obama administration, to adopt plan-driven regulation throughout the United States, despite the substantial economic disruption that such policies produced in the US bubble markets. Besides making houses unaffordable for many households, this could set the stage for even more housing bubbles in the future.

    If this trend continues, future generations will pay far more for their housing than did their parents. This seems likely to stunt economic growth and job creation, while facilitating higher levels of poverty and class stratification throughout the English speaking world.

    Wendell Cox is a Visiting Professor, Conservatoire National des Arts et Metiers, Paris. He was born in Los Angeles and was appointed to three terms on the Los Angeles County Transportation Commission by Mayor Tom Bradley. He is the author of “War on the Dream: How Anti-Sprawl Policy Threatens the Quality of Life.

  • The Kids Will Be Alright

    America’s population growth makes it a notable outlier among the advanced industrialized countries. The country boasts a fertility rate 50% higher than that of Russia, Germany or Japan and well above that of China, Italy, Singapore, North Korea and virtually all of eastern Europe. Add to that the even greater impact of continued large-scale immigration to America from around the world. By the year 2050, the U.S. population will swell by roughly 100 million, and the country’s demographic vitality will drive its economic resilience in the coming decades.

    This places the U.S. in a radically different position from that of its historic competitors, particularly Europe and Japan, whose populations are stagnant. The contrast between the U.S. and Russia, America’s onetime primary rival for world power, is particularly dramatic. Some 30 years ago, Russia constituted the core of a vast Soviet empire that was considerably more populous than the U.S. Today, even with its energy riches, Russia’s low birth and high mortality rates suggest that its population will drop to less than one-third that of the U.S. by 2050. Russian Prime Minister Vladimir Putin has spoken of “the serious threat of turning into a decaying nation.”

    An equally dramatic and perhaps more critical demographic shift is taking place in East Asia. Over the past few decades a rapid expansion of their work force fueled the rise of the “East Asian tigers,” the great economic success stories of the late-20th and early-21st centuries. Yet that epoch is coming to an end, not only in Japan and Korea but also in China, where the one-child policy has set the stage for a rapidly aging population by mid-century.

    Within the next four decades, most of the developed countries in both Europe and East Asia will become veritable old-age homes: A third or more of their populations will be over 65, compared with only a fifth in America. Like the rest of the developed world, the U.S. will certainly have to cope with an aging population and lower population growth, but in relative terms the county will boast a youthful, dynamic demographic.

    As many other advanced countries become dominated by the elderly, the U.S. will have the benefit of a millennial baby boom as the “echo boomers” start having offspring in large numbers later in this decade. This next surge in growth may be delayed if tough economic times continue, but over time the rise in births will add to the work force, boost consumer spending and allow for new creative inputs.

    The differing demographic trajectories create a diverse set of issues for 21st-century America than those facing its rivals. The key challenges the European Union, Japan and Korea will contend with in the coming decades involve coping with a rapidly aging population, filling labor shortages and finding ways to invest in growing economies. In contrast, the U.S.’s greatest priority will be to create opportunities for its ever-expanding population. The New America Foundation estimates the country needs to add more than 125,000 jobs a month simply to keep pace with population growth in 2010. What the U.S. does with its “demographic dividend”—that is, its relatively young working-age population—will largely depend on whether the private sector can generate the incomes among the young to meet the needs of a larger aging population.

    Entrepreneurialism and America’s flexible business culture—including the harnessing of entrepreneurial skills of aging boomers—will prove critical to meeting this challenge. Many of the individuals starting new firms will be those who have recently left or been laid off by bigger companies, particularly during a severe economic downturn. Whether they form a new bank, energy company or design firm, they will do it more efficiently—with less overhead, more efficient use of the Internet and less emphasis on pretentious office settings.

    “People are watching their companies go under. Therefore you get three vice presidents who get laid off but know their business,” says Texas entrepreneur Charlie Wilson. “They start a new company somewhere cheap that is more efficient and streamlined. These are the new companies that will survive and grow the next economy.”

    It is here—at the grassroots level—that you can best glimpse the essential sources of American resiliency. American society draws most of its adaptive power not from its elite precincts but through the efforts of communities, churches, entrepreneurs and families.

    You can see this in the resurgence of once-declining Great Plains cities like Fargo, N.D., where high-tech now joins agriculture and manufacturing to form one of the country’s strongest local economies. Or you can visit the emerging immigrant hotbeds, such as the San Gabriel Valley east of Los Angeles or the Sugarland area, just west of Houston, with their plethora of new churches, temples, companies and ethnic shopping malls.

    Immigrants represent a critical component of our next wave of new dynamism. Between 1990 and 2005, immigrants started one quarter of all venture-backed public companies. Large American firms are also increasingly led by people with roots in foreign countries, including 14 of the CEOs of the 2007 Fortune 100.

    But much of the energy will come from more obscure enterprises. Recent newcomers have already distinguished themselves as entrepreneurs, forming businesses from street-level bodegas to the most sophisticated technology start-ups.

    What drives immigrants is their optimism in America’s future. California developer Dr. Alethea Hsu, in explaining why she opened a new Asian-oriented shopping center in Orange County, cited the entrepreneurial energy of both affluent and working class immigrants which, she said, will allow them to thrive through the recession and beyond. “We are leased up, and we think the supply of shopping still is not enough,” Ms. Hsu said in early 2009. “We feel great trust in the future.”

    This entrepreneurial urge also extends beyond the immigrant community. In 2008, 28% of Americans said they had considered starting a business, more than twice the rate for French or Germans. Self-employment, particularly among younger workers, has been growing at twice the rate as in the mid-1990s. In the most recent Legatum Prosperity Index, the U.S. ranked at the top among all countries in terms of entrepreneurship and innovation.

    Most important of all will likely be the rise of the millennial generation—a group of Americans who will start reaching their prime earning years late in the next decade. Surveys identify them as strongly family- and community-oriented. The millennials will be America’s new entrepreneurs, workers and consumers in the coming decades. They will provide the kind of resource our major competitors are destined to run short on.

    The millennials also will help shape an increasingly culturally diverse America which by 2050 will be roughly half made up of ethnic minorities. This emerging post-ethnic future contrasts dramatically with the ethnic politics common among the nation’s chief global rivals. Even famously politically correct nations as Sweden, Denmark and the Netherlands have turned against immigration. Switzerland just banned the construction of minarets, while France is considering banning some forms of Islamic garb.

    Our prime Asian rivals—China, Japan, and Korea—remain even more culturally resistant to diversity. Chinese xenophobia, in particular, is deeply entrenched, notes Martin Jacques, author of “When China Rules the World.” A Chinese world superpower would be both racially homogenous and far from tolerant of newcomers. Recently the appearance of a mixed-race Shanghai girl on a national talent show sparked a surge of racist invective.

    The very diversity of the emerging America makes many wonder what will hold the country together. Ultimately, this unique society will find its binding principle in the notions that have long differentiated it from the rest of world: a common belief system, a sense of a shared destiny and an aspirational culture.

    As the British writer G. K. Chesterton once put it, the U.S. is “the only nation…that is founded on a creed.” This faith is not, and was not initially meant to be, explicitly religious; rather, it is a fundamentally spiritual idea of a national raison d’être.

    Of course, this optimistic scenario depends on intelligent and energetic actions by central and local governments, as well as community organizations. But the road to the American future will be primarily laid not by the central state but by families, individuals and communities. During the industrial age Ralph Waldo Emerson once observed, “The age has an engine, but no engineer.” Much the same may be said in the coming decades.

    This article first appeared at The Wall Street Journal.

    Joel Kotkin is executive editor of NewGeography.com and is a distinguished presidential fellow in urban futures at Chapman University. He is author of The City: A Global History. His next book, The Next Hundred Million: America in 2050, will be published by Penguin Press February 4th.

    Photo: jcolman

  • The War Against Suburbia

    A year into the Obama administration, America’s dominant geography, suburbia, is now in open revolt against an urban-centric regime that many perceive threatens their way of life, values, and economic future. Scott Brown’s huge upset victory by 5 percent in Massachusetts, which supported Obama by 26 percentage points in 2008, largely was propelled by a wave of support from middle-income suburbs all around Boston. The contrast with 2008 could not be plainer.

    Browns’s triumph followed similar wins by Republican gubernatorial contenders last November in Virginia and New Jersey. In those races suburban voters in places like Middlesex County, New Jersey and Loudoun County, Virginia—which had supported President Obama just a year earlier—deserted the Democats in droves. Also in November, voters in Nassau County, New York upset Nassau County Executive Thomas Suozzi, an attractive Democrat who had carefully cultivated suburban voters.

    The lesson here is that political movements ignore suburbanites at their peril. For the better part of a century, Americans have been voting with their feet, moving inexorably away from the central cities and towards the suburban periphery. Today a solid majority of Americans live in suburbs and exurbs, more than countryside residents and urbanites combined.

    As a result, suburban voters have become the critical determinants of our national politics, culture, and economy. The rise of the Republican majority after 1966 was largely a suburban phenomenon. When Democrats have resurged—as they did under Bill Clinton and again in 2006 and 2008—it was when they came close to splitting the suburban vote.

    But now, once again, things have changed. For the first time in memory, the suburbs are under a conscious and sustained attack from Washington. Little that the administration has pushed—from the Wall Street bailouts to the proposed “cap and trade” policies—offers much to predominately middle-income oriented suburbanites and instead appears to have worked to alienate them.

    And then there are the policies that seem targeted against suburbs. In everything from land use and transportation to “green” energy policy, the Obama administration has been pushing an agenda that seeks to move Americans out of their preferred suburban locales and into the dense, transit-dependent locales they have eschewed for generations.

    As in so many areas, this stance reflects the surprising power of the party’s urban core and the “green” lobby associated with it. Yet, from a political point of view, the anti-suburban stance seems odd given that Democrats’ recent electoral ascendency stemmed in great part from gains among suburbanites. Certainly this is an overt stance that neither Bill nor Hillary Clinton would likely have countenanced.

    Whenever possible, the Clintons expressed empathy with suburban and small-town voters. In contrast, the Obama administration seems almost willfully city-centric. Few top appointees have come from either red states or suburbs; the top echelons of the administration draw almost completely on big city urbanites—most notably from Chicago, New York, Los Angeles, and San Francisco. They sometimes don’t even seem to understand why people move to suburbs.

    Many Obama appointees—such as at the Departments of Transportation and of Housing and Urban Development (HUD) and at the Environmental Protection Agency (EPA)—favor a policy agenda that would drive more Americans to live in central cities. And the president himself seems to embrace this approach, declaring in February that “the days of building sprawl” were, in his words, “over.”

    Not surprisingly, belief in “smart growth,” a policy that seeks to force densification of communities and returning people to core cities, animates many top administration officials. This includes both HUD Secretary Shaun Donovan and Undersecretary Ron Sims, Transportation undersecretary for policy Roy Kienitz, and the EPA’s John Frece.

    Transportation Secretary Ray LaHood revealed the new ideology when he famously declared the administration’s intention to “coerce” Americans out of their cars and into transit. In Congress, the president’s allies, including Minnesota Congressman James Oberstar, have advocated shifting a larger chunk of gas tax funds collected from drivers to rail and other transit.

    In addition, the president’s stimulus—with its $8 billion allocation for high-speed rail and proposed giant increases in mass transit—offers little to anyone who lives outside a handful of large metropolitan cores. Economics writer Robert Samuelson, among others, has denounced the high-speed rail idea as “a boondoggle” not well-suited to a huge, multi-centered country like the United States. Green job schemes also seem more suited to boost employment for university researchers and inner-city residents than middle-income suburbanites.

    Suburbanites may not yet be conscious of the anti-suburban stance of the Obama team, but perhaps they can read the body language. Administration officials have also started handing out $300 million stimulus-funded grants to cities that follow “smart growth principles.” Grants for cities to adopt “sustainability” oriented development will reward those communities with the proper planning orientation. There is precious little that will benefit suburbanites, such as improved roads or investment in other basic infrastructure.

    But ultimately it will be sticks and not carrots that planners hope to use to drive de-suburbanization. Perhaps the most significant will be new draconian controls over land use. Administration officials, particularly from the EPA, participated in the drafting of the recent “Moving Cooler” report, which suggested such policies as charging tolls on the Interstate Highway System, charging people to park in front of their homes, and steering some 90 percent of all future development into the most dense portions of already existing urban development.

    Of course, such policies have little or no chance of being passed by Congress. Too many representatives come from suburban or rural districts to back policies that would penalize a population that uses automobiles for upwards of 98 percent of their transportation and account for 95 percent of all work trips.

    But the president’s cadres may find other ways to impose their agenda. New controls, for example, may be enacted through the courts and regulatory action. There is already precedence for this: As EPA director under Clinton, current climate czar Carole Browner threatened to block federal funds for the Atlanta region due to their lack of compliance with clear air rules.

    Such threats will become more commonplace as regulating greenhouse gases fall under administrative scrutiny. As can already be seen in California, regulators can use the threat of climate change as a rationale to stop funding—and permitting—for even well-conceived residential, commercial, or industrial projects construed as likely to generate excess greenhouse gases.

    These efforts will be supported by an elaborate coalition of new urbanist and environmental groups. At the same time, a powerful urban land interest, including many close to the Democratic Party, would also support steps that thwart suburban growth and give them a near monopoly on future development over the coming decades.

    Glimpse the Future

    One can glimpse this future by observing what takes place in most European countries, including the United Kingdom, where land use is controlled from the center. For decades options for new development have been sharply circumscribed, with mandates for ever-smaller lots and smaller homes more the norm for single-family residences.

    In Britain the dominant planning model is widely known as “cramming,” meaning forced densification into smaller geographic areas. Over the past generation, this has spurred a rapid shrinking of house sizes. Today the average new British “hobbit” house, although quite expensive, covers barely 800 square feet, roughly one-third that of the average American residence. Even in quite distant suburbia many of the features widely enjoyed here—sizable backyards, spare bedrooms, home office space—are disappearing.

    But these suburban hobbits will be living large compared to the sardines who would be forced to move into inner cities. In London, already a densely packed city, planners are calling for denser apartment blocks and congested neighborhoods.

    This top-driven scenario may be playing soon in America. Following the proposed edicts of “Moving Cooler,” the urban option increasingly would become almost the only choice other than the countryside. Unlike their baby boomer parents, the next generation would have few affordable choices in comfortable, low- and medium-density suburbs and single-family homes.

    Ownership of a single-family home would become increasingly the province only of the highly affluent or those living on the fringes of second-tier American cities. Due to the very high costs of construction for multi-family apartments in inner cities, most prospective homeowners would also be forced to remain renters. Although widely hailed as “progressive,” these policies would herald a return to the kind of crowded renter-dominated metropolis that existed prior to the Second World War.

    Are Suburbs Doomed?

    The anti-suburban impulse is nothing new. Suburbs have rarely been popular among academics, planners, and the punditry. The suburbanite displeased “the professional planner and the intellectual defender of cosmopolitan culture,” noted sociologist Herbert Gans. The 1960s counterculture expanded this critique, viewing suburbia as one of many “tasteless travesties of mass society,” along with fast and processed food, plastics, and large cars. Suburban life represented the opposite of the cosmopolitan urban scene; one critic termed it “vulgaria.”

    Liberals also castigated suburbs as the racist spawn of “white flight.” But more recently, environmental causes—particularly greenhouse gas emissions as well as dire warning about the prospects for “peak oil”—now drive much of the argument against suburbanization.

    The housing crash that began in 2007 added grist to the contention that the age of suburban growth has come to an end. To be sure, the early phases of the subprime mortgage bust were heavily concentrated in newer developments in the outer fringes. In part due to rising home prices, a disproportionate number of new buyers were forced to resort to sub-prime and other unconventional mortgages.

    The outer suburban distress attracted much media attention and delighted many who had long detested suburbs. One leading new urbanist, Chris Leinberger, actually described suburban sprawl as “the root cause of the financial crisis.” Leinberger and other critics have described suburbia as the home of the nation’s future “slums.” The favorite images have included McMansions being taken over by impoverished gang-bangers and other undesirables once associated with the now pristine inner city.

    Others portray future suburbs as serving at best as backwaters in a society dominated by urbanites. In contrast to a brave new era for “the gospel of urbanism,” the suburbs are expected to contract and even wither away. According to planner Arthur C. Nelson’s estimate, by 2025 the United States will have a “likely surplus of 22 million large lot homes”—that is, residences on more than one sixth of an acre.

    City boosters, however, largely ignore the real-estate crisis impact on urban condo markets throughout the country. Like the new developments on the fringe, the much hyped apartment complexes in central cities such as New York, Miami, Los Angeles, Chicago, and Denver came on line precisely as the housing market crashed, with similar devastating effects. Many remain unoccupied and others have been converted from high-end condos to more modest rentals.

    Yet fundamentally the attack on suburbia has less to do with market trends or the environment than with a deep-seated desire to change the way Americans live. For years urban boosters have proposed that more Americans should reside in what they deemed “more livable,” denser, transit-oriented communities for their own good. One recent example, David Owens’ Green Metropolis, supports the notion that Americans should be encouraged to embrace “extreme compactness”—using Manhattan as the model.

    Convinced Manhattanization is our future, some “progressives” are already postulating what to do with the remnants of our future abandoned. Grist, for example, recently held a competition about what to do with dying suburbs that included ideas such as turning them into farms, bio-fuel generators, and water treatment plants.

    What Do the Suburbanites Want?

    In their assessments, few density advocates bother to consider whether most suburbanites would like to give up their leafy backyards for dense apartment blocks. Many urban boosters simply could not believe that, once given an urban option, anyone would choose to live in suburbia.

    Jane Jacobs, for example, believed that “suburbs must be a difficult place to raise children.” Yet had Jacobs paid as much attention to suburbs as she did to her beloved Greenwich Village, she would have discovered that they possess their own considerable appeal, most particularly for people with children. “If suburban life is undesirable,” noted Gans in 1969, “the suburbanites themselves seem blissfully unaware of it.”

    Contrary to much of the current media hype, most Americans continue to prefer suburban living. Indeed for four decades, according to numerous surveys, the portion of the population that prefers to live in a big city has consistently been in the 10 to 20 percent range, while roughly 50 percent or more opt for suburbs or exurbs. The reasons? The simple desire for privacy, quiet, safety, good schools, and closer-knit communities. The single-family house, detested by many urbanists, also exercises a considerable pull. Surveys by the National Association of Realtors and the National Association of Home Builders find that some 83 percent of potential buyers prefer this kind of dwelling over a townhouse or apartment.

    In other words, suburbs have expanded because people like them. A 2008 Pew study revealed that suburbanites displayed the highest degree of satisfaction with where they lived compared to those who lived in cities, small towns, and the countryside. This contradicts another of the great urban legends of the 20th century—espoused by urbanists, planning professors, and pundits and portrayed in Hollywood movies—that suburbanites are alienated, autonomous individuals, while city dwellers have a deep sense of belonging and connection to their neighborhoods.

    Indeed on virtually every measurement—from jobs and environment to families—suburban residents express a stronger sense of identity and civic involvement with their communities than those living in cities. One recent University of California at Irvine study found that density does not, as is often assumed, increase social contact between neighbors or raise overall social involvement. For every 10 percent reduction in density, the chances of people talking to their neighbors increases by 10 percent, and their likelihood of belonging to a local club by 15 percent.

    These preferences have helped make suburbanization the predominant trend in virtually every region of the country. Even in Portland, Oregon, a city renowned for its urban-oriented policy, barely 10 percent of all population growth this decade has occurred within the city limits, while more than 90 percent has taken place in the suburbs over the past decade. Ironically, one contributing factor has been the demands of urbanites themselves, who want to preserve historic structures and maintain relatively modest densities in their neighborhoods.

    Multicultural Flight

    Perhaps nothing reflects the universal appeal of suburban lifestyles more than its growing ethnic diversity. In 1970 nearly 95 percent of suburbanites were white. Today many of these same communities have emerged as the new melting pots of American society. Along with immigrants, African-Americans have moved to the suburbs in huge numbers: between 1970 and 2009, the proportion of African-Americans living in the periphery grew from less than one-sixth to 40 percent.

    Today minorities constitute over 27 percent of the nation’s suburbanites. In fast-growing Gwinett County outside Atlanta, minorities made up less than 10 percent of the population in 1980; by 2006 the county was on the verge of becoming “majority minority.” In greater Washington, D.C., the Northeast’s most dynamic region in economic and demographic terms, 87 percent of foreign migrants live in the suburbs, while less than 13 percent live in the district, according to a 2001 Brookings Institution study.

    Perhaps most intriguingly, this diversity is itself diverse, including not only African-Americans but also Latinos and Asians. Suburban areas such as Fort Bend county, Texas, and the city of Walnut, in the San Gabriel Valley east of Los Angeles, already have among the most diverse populations in the nation. And this is not merely a California phenomenon: Aurora (outside Denver), Bellevue (the Seattle suburb), and Blaine (outside Minneapolis) are becoming ever-more diverse even as the nearby city centers become less so. By 2000 well over half of mixed-race households were in the suburbs, a percentage that continues to grow.

    Today the most likely locale for America’s new ethnic shopping centers, Hindu temples, and new mosques are not in the teeming cities but in the outer suburbs of Los Angeles, New York, and Houston. “If a multiethnic society is working out in America,” suggests California demographer James Allen, “it will be worked out in [these] places  . . . The future of America is in the suburbs.”

    A War Not Worth Fighting

    If most Americans clearly prefer suburbs then why would our elected representatives choose to pick a fight with them? Perhaps the most widely used explanation lies with densification as a means of reducing greenhouse gases. But this rationale itself seems flawed, and could reflect more long-standing prejudice than proven science.

    For example, a recent study by the National Academy of Sciences found that a nationally imposed densification policy would at best cut greenhouse gas emissions between less than 1 and 11 percent by 2050. Other research suggests that, by some measurements, low-density development can use less energy than denser urban forms.

    Although automobile commuting now consumes more energy resources than well-traveled traditional urban rail systems, the future generation of low-mileage cars may prove more efficient than often underutilized rail systems that are now seen as critical elements of fighting climate change. A public system running at low capacity—commonplace in many regions—may actually produce more emissions than the coming generation of personal vehicles.

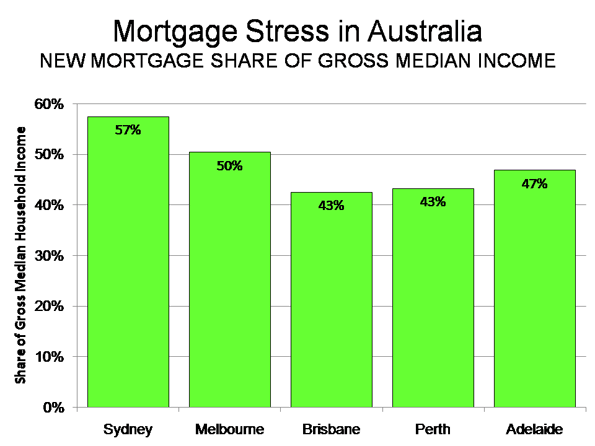
    Moreover, tall buildings may not be as green as some advocates suggest. Recent studies out of Australia show that townhouses, small condos, and even single-family homes generate far less heat per capita than the supposedly environmentally superior residential towers, particularly when one takes into account the cost of heating common areas and the highly consumptive lifestyle of affluent urbanites (with their country homes, vacations, and frequent flying). In terms of energy conservation, the easiest and least expensive option may be to retrofit single-family houses and wood-shaded townhouses.

    Two- or three-story homes or townhouses often require only double-paned windows and natural shading to reduce their energy consumption; one Los Angeles study found that white roofs and shade trees can reduce suburban air conditioning by 18 percent. Such structures are particularly ideal for using the heat- and water-saving elements of landscaping: after all, a nice maple can cool a two-story house more efficiently than it can a ten-story apartment.

    Of course, density advocates can and do produce their own studies to justify their agenda. But there seems enough reasonable doubt to focus on more efficient, and less intrusive, ways to create greener communities by improving energy efficiency of automobiles and changing the way suburbs fit into metropolitan systems.

    Turning Deadwood into Greenurbia

    The “green” assault on suburbia also largely ignores changes already taking place across the suburban landscape. In a historical context, the latest suburban “sprawl” may be compared to Deadwood. That rough-and-ready mining town on the Dakota frontier was developed quickly for the narrow purpose of being close to a vein of gold. But over time these towns developed respectable shopping streets, theaters, and other community institutions.

    One change already evident can be seen in commuting patterns. Density advocates and the media often characterize suburbanites as people who generally take long commutes to work compared to the shorter rides enjoyed by city-dwellers. But with the continuing dispersion of work to the suburbs over the past two decades, suburban work locations actually enjoyed shorter commutes than their inner city counterparts in virtually all the largest metropolitan areas.

    This is true even in New York. Although Manhattanites enjoy short commutes and can even walk to work, most people who live in New York City and work in Manhattan suffer among the longest commutes in the nation. In fact, residents of Queens and Staten Island spend the most time getting to work of all metropolitan counties. Residents in suburbs and particularly exurbs actually endure generally shorter commutes, in large part because of less congestion and closer proximity to employment.

    Such pairing of jobs and housing will shape the suburban future and represents among the easiest ways to cut transportation-related emissions. Even more promising has been the continuing rise in home-based employment. According to Forrester Research, roughly 34 million Americans now commute at least part time from home; by 2016 these numbers are predicted to swell upwards to 63 million.

    Oddly, despite these tremendous potential environmental benefits, the shift toward cyberspace has elicited little support from smart-growth advocates. Indeed most reports on density and greenhouse gases virtually ignore the consideration of telecommuting and dispersed work.

    One reason may be that telecommuting breaks with the prevailing planning and green narratives by making dispersion more feasible. The ability to work full time or part time from home, notes one planning expert, expands metropolitan “commuter sheds” to areas well outside their traditional limits. In exchange for a rural or exurban lifestyle, this new commuter—who may go in to “work” only one or two days a week—will endure the periodic extra long trip to the office.

    Yet although it may offend planning sensibilities, the potential energy savings—particularly in vehicle miles traveled—could be enormous. Telecommuters drive less, naturally; on telecommuting days, average vehicle miles are between 53 percent and 77 percent lower. Overall a 10 percent increase in telecommuting over the next decade will reduce 45 million tons of greenhouse gases, while also dramatically cutting office construction and energy use. Only an almost impossibly large shift to mass transit could produce comparable savings.

    Ultimately, technology will undermine much of the green case against suburbia. If we really want to bring about a greener era, focusing attention on low-density enclaves would bring change that conforms to the preferences of the vast majority of people.

    Think Twice Before You Act

    Ultimately, the war against suburbia reflects a radical new vision of American life which, in the name of community and green values, would reverse the democratizing of the landscape that has characterized much of the past 50 years. It would replace a political economy based on individual aspiration and association in small communities, with a more highly organized, bureaucratic, and hierarchical form of social organization.

    In some ways we could say forced densification could augur in a kind of new feudalism, where questions of land ownership and decision making would be shifted away from citizens, neighbors, or markets, and left in the hands of self-appointed “betters.” This seems strange for an administration—and a party—whose raison d’être ostensibly has been to widen opportunities rather than constrict them.

    Indeed it is one of the oddest aspects of contemporary “progressive” thought that it seeks to undermine even modest middle class aspirations such as living in a quiet neighborhood or a single-family house. This does not seem a winning way to build political support across a broad spectrum of the populace.

    Of course suburbia is not and will not be the option for everyone. There will continue to be a significant, perhaps even growing, segment of the population which opts for a dense urban lifestyle or, for that matter, to live further in the countryside. But unless we see a radical change in human behavior and social organization, the majority will likely settle for a suburban or exurban existence.

    Given these realities, it seems more practical not to work against such aspirations but instead to evolve intelligent policies that would reconcile them with our long-term environmental needs. Suburbanites like their suburbs but would also like to find a way to make them greener as well as more economically and socially viable. Right now neither party has developed such an agenda, and so the suburbs, now clearly leaning right, remain up for grabs. To win suburbanites over, politicians first have to respect the basic preferences while offering a realistic program for improvement. This remains a key to building a sustainable electoral majority, not just for the next election, but for the decades to come.

    This article first appeared at The American.

    Joel Kotkin is executive editor of NewGeography.com and is a distinguished presidential fellow in urban futures at Chapman University. He is author of The City: A Global History. His newest book is The Next Hundred Million: America in 2050, released in Febuary, 2010.

  • China’s Heartland Capital: Chengdu, Sichuan

    On May 12, 2008, Chinese architect Stepp Lin was focusing intensely on his professional licensing exam in a testing center in central Chengdu when suddenly he felt someone bumping his desk. By the time he looked up to see what it was, most of the other exam takers were frantically fleeing for the exit. It turns out that what he was feeling were the tremors of what was to be the most devastating earthquake to hit China in recent memory.

    China’s heartland province of Sichuan was overtaken by an 8.0 earthquake that rocked the region that day. The quake was so powerful that it was felt as far away as Beijing. Graphic images broadcast around the world showed the devastation caused by the powerful tremor. All in all, it is estimated that more than 60,000 people perished in the Sichuan earthquake.

    During the aftermath, the response from both within China and abroad in terms of aid was highly encouraging. Unfortunately, the footage of primary schools reduced to rubble resulting in the deaths of thousands of children and the subsequent scandals regarding culpability denial and cover-up did not bode well for China’s new image.

    Surprisingly, Sichuan’s capital and largest city, Chengdu, escaped from the earthquake largely unscathed. Most of the serious damage took place in rural areas where buildings, due to lack of sufficient funding and regulation, had not been constructed to safety standards. Building safety codes have since been updated and are now rigorously enforced.

    Perhaps more importantly, the 2008 Sichuan earthquake managed to highlight the growing disparity between the rich and poor, urban and rural areas of China.
    Unlike the United States, where suburbanization has managed to blur the line between rural and urban, the contrast remains stark in the Middle Kingdom.

    It is no secret that within the framework of rapid development, China is urbanizing at unprecedented rates. Beijing and Shanghai continue to lead the country politically and economically, but a group of ‘second tier’ cities is now being targeted by China’s planners for increased new investment. Included in this group are up-and-coming cities like Nanjing, Dalian, Tianjin and Chongqing.

    Yet perhaps no other second tier city represents the future of China more than Chengdu (pronounced chung-doo). Strategically located at the geographic heart of China, Chengdu bridges the gap between the country’s booming eastern seaboard and the still largely mysterious far west.

    Chengdu is one of China’s oldest cities, with continuous settlement dating back to the ancient Kingdom of Shu. Today, the city is renowned for its local spicy cuisine and famous Panda Breeding Center. It is also a popular launching-off point for international trekkers heading onto Tibet. Within China, Chengdu is reputed for its leisurely atmosphere where friendly locals often take off work early to sip tea and relax over a game of mahjong.

    Sitting at an elevation of about 1,600 feet on the western portion of the Sichuan Basin, Chengdu’s climate is mildly humid-neither too hot in the summer nor too cold in the winter. Yet one drawback is the presence of the pervasive fog that hovers low in the sky year-round, making Chengdu one of least-sunny cities in China.

    Similar to Beijing, Chengdu is concentrically organized with ring roads circling the city. At the center of the city is Tianfu Square-a pleasant public space featuring larger-than-life water fountains and a large statue of Chairman Mao. Nearby is the Jin River, which flows through the middle of the city, dividing it in half.

    Despite the slower pace of life, at least in comparison with the rest of China’s hyper urbanity, the Central Government has recognized the city’s advantages. Being the western-most big city in China, Chengdu is China’s gateway to central Asia. As such, the city has been identified as an air traffic hub. Already, Chengdu International airport is one of the busiest in the mainland. Next year, Air China inaugurates its new Chengdu-Los Angeles route: the first direct flight from the city to the United States.

    The new Air China route to LA reflects the growing presence of U.S. firms in the area. Technology companies like Microsoft and Intel have realized the competitive advantages of opening research and development facilities in an area of the country where the cost of doing business is still relatively low. These firms have located their offices in an area in the south of Chengdu that has been designated as the ‘Hi-Tech Zone’ by China’s Ministry of Science and Technology.

    Along with becoming western China’s high tech center, the city is grabbing a foothold on the country’s aviation industry. Chengdu Aircraft Industrial Group (CAC), which was contracted out by Dallas-based Vought Aircraft, supplied the rudder for Boeing’s new 787 ‘Dreamliner’ jet. CAC also supplies parts for Boeing’s 757 series.

    To accommodate the new business, the city is going through a construction boom. Although Chengdu had a late start on its eastern counterparts, the city is attracting high-profile developers like New York-based Tishman Speyer and Singapore’s CapitaLand – both of whom currently have large-scale commercial and retail projects being built in the city. Chengdu has even recruited Hong Kong businessman Allan Zeman to develop a version of Hong Kong’s popular nightlife district, Lan Kwai Fong, scheduled to open in March.

    The city’s development would not be complete without an overhaul of its transportation system. One word summarizes the current state of Chengdu’s roads: chaos. The traffic on the streets remains an assortment of bicycles, motorbikes, automobiles and buses. Yet, as incomes rise and more people purchase cars, the congestion on the streets is becoming unbearable. Furthermore, the fact that the streets do not follow a formal grid pattern, but rather array out from the center of the city, adds another degree of complexity to Chengdu’s traffic dilemma.

    Thankfully, the city’s first subway line is slated to open in 2010. As additional underground lines become operable, it will also give the city a better sense of cohesiveness as the limited number of surface level crossings of the Jin River currently contributes to both a physical and psychological divisiveness.

    In discussing the rise of Chengdu as a hotbed of economic activity, it is worth mentioning the city’s relationship with its closest rival, Chongqing. Chongqing, which was separated from Sichuan Province in 1997 to become an autonomous provincial-level municipality, lies just over 200 miles to the east. The city has the advantage of direct access to the Yangtze River, providing a strategic connection to the river’s terminus of Shanghai.

    Chongqing’s urban development is limited by the surrounding mountainous terrain-thus the reason for the dense high-rise jungle rising in the skyline. Chengdu, in contrast, has an abundance of land for growth and is more likely to sustain long-term development. Also, the fact that Chongqing has been plagued by corruption and local mafia activity in recent years means that foreign firms may be more attracted to safer Chengdu.

    That is not to say that there is not room for both cities in China’s future. In fact, the two cities are likely to form what will become the Chengdu-Chongqing mega-region – the economic powerhouse of western China. Already, other mega-regions in China like the Bohai Bay Rim (Beijing, Tianjin and Dalian), the Yangtze River Delta (Shanghai, Hangzhou, Nanjing and Suzhou) and the Pearl River Delta (Guangzhou, Dongguan, Shenzhen, and Hong Kong) are setting groundbreaking standards in the history of global urbanization.

    The Sichuan earthquake of 2008 managed to bring about an awareness of the major issues still facing China. In stark contrast to the days of the Cultural Revolution when urban areas were viewed as pariahs, the Sichuan quake solidified the triumph of the city over the countryside. As the city on the frontier, Chengdu is likely to become a key player as thousands of migrants arrive from Sichuan and adjacent provinces. How these newcomers are incorporated represents a great challenge for China as it shifts from a largely rural to a predominately urban country.

    Adam Nathaniel Mayer is a native of California. Raised in Silicon Valley, he developed a keen interest in the importance of place within the framework of a highly globalized economy. Adam attended the University of Southern California in Los Angeles where he earned a Bachelor of Architecture degree. He currently lives in China where he works in the architecture profession.

  • Urbanity Drives Gay Rights Victory in Washington

    If anyone were to doubt that there really are two Washingtons, that the Seattle metropolitan core (and its playgrounds) are another world from most rural to small city Washington (especially east of the Cascade crest), a look at the maps for the vote on Referendum 71 last November should be persuasive. These are not subtle, marginal differences, but indisputable polarization in what political and cultural researchers may call the modernist-traditional divide.

    Referendum 71 passed by a 53 to 47 percent vote, and revealing the power of the King County electorate, which alone provided a margin of 204,000, compared to a statewide margin of 113,000! To overcome the problem of variable size of precincts, and the need to suppress too small numbers, I aggregated precincts to census tracts, which have the added advantage of permitting comparison of electoral results with social and economic data from the census.

    Looking at the statewide map, about 85 percent of the territory of the state (95 % in Eastern WA, 70 % in western WA) voted NO. But the strong no vote came from overwhelmingly rural areas and small towns. The only core metropolitan census tracts that voted a majority no were in Richland-Kennewick area, Yakima and Longview. The heart of traditionalist, and arguably, of anti-gay sentiment lies in the farm country of eastern Washington, especially wheat and ranching areas in Adams, Douglas, Garfield, Lincoln, Walla Walla and Whitman counties, but extending also to the rich irrigated farmlands of Grant, Franklin, Benton and Yakima counties. The highest no votes in western Washington were far rural stretches, and most interesting, Lynden, home to many Dutch descendants, members of the conservative Christian Reformed Church. Not surprisingly the census tracts in eastern Washington which supported Referendum 71 were the tracts dominated by Washington State University in Pullman, around Central Washington university in Ellensburg, the mountain resorts tracts in western Okanogan (Mazama, Twisp), and a few tracts in the core of the city of Spokane.

    Across western Washington majorities against Ref 71 prevailed over a sizeable contiguous southeastern area, from northern Clark and Skamania through urban as well as rural Lewis county (reinforcing the county’s reputation of being the anti-Seattle!) into much of southeastern Pierce county. A lesser vote against 71 occurred in the rest of rural small town western Washington, including most of rural Snohomish county.

    The zone of strong support, voting over 60 percent in favor, flowed largely from Seattle and its inner commuting zone, its spillover playgrounds and retirement areas of Port Townsend and the San Juans, and college and university dominated tracts around Western Washington in Bellingham, the Evergreen State College, Olympia, plus the downtown cores of Vancouver, Tacoma and Everett. Weaker but still supportive were rural spillover, retirement and resort tracts, often in coastal or mountain areas of Pacific, Grays Harbor, Jefferson, Clallam, Skagit and Whatcom counties.

    Looking at the detailed map of central Puget Sound, we can see revealing contrasts between the two camps. Support levels of over 75 percent almost coincides with the city of Seattle boundaries (not quite so high in the far south end), and its professional commuting outliers of Bainbridge and Vashon, plus the downtown government core of Olympia and tracts around the University of Puget Sound and the UW Tacoma.

    Moderately high support (60 to 75 percent) surrounds the core area of highest support, most dominantly in the more affluent and professional areas north of Seattle through Edmonds and east to Redmond, Issaquah and Sammamish (Microsoft land). Weak but still positive votes occurred in the next tier of tracts, around Olympia, north and west of inner Tacoma, most of urban southwest Snohomish county and much of exurban and rural King county (quite unlike most rural areas). But on the contrary, the shift to opposition is remarkably quick and strong in southeastern King and especially in Pierce county, in northern and eastern Snohomish county, and, not surprisingly, in military dominated parts of Kitsap county (e.g., Bangor) and Pierce (Fort Lewis).

    The temptation to compare the voting levels of census tracts with social and economic conditions of those tracts is too great to resist. Here are the strongest correlations (statewide).

    Washington State Correlations with voting in favor of Ref 71
    % Use transit 0.75 %  Drive SOV -0.54
    % Non-family HH 0.65 % HW families -0.45
    % Single 0.48 Average HH size -0.53
    % Same sex HH 0.57
    % aged 20—39 0.43 %  under 20 -0.55
    % foreign born 0.28 % Born in Wash. -0.4
    % College grad 0.65 % HS only -0.62
    % Black 0.27 % white -0.13
    % Asian 0.42 % Hispanic -0.22
    Manager-Profess 0.53 % Craft occup -0.46
    % in FIRE 0.34 % laboring occup -0.47

    These statistics reflect the profound Red-Blue division of the American electorate, in both the geographic differences (large metropolitan versus rural and small town), as well as the modern versus traditional dimension (socially liberal or conservative). The strongest single variable is not behavioral, but transit use is a surrogate for the metropolitan/non-metropolitan split. The critical social characteristic lies in the nature of households: the traditional family versus non-families (partners, roommates, singles). This is a powerful tendency, and useful to describe differences in areas, but of course many in families – often more educated and professional – support Ref 71, and many singles – often elderly, or opposite sex partners – opposed it, especially in more conservative parts of the state.

    The next strongest set of variables, clearly visual from the maps, lay in the strong split of the electorate according to the predominant educational level of the tracts. The tendency of the more educated to support 71 represents the key statistic of the “modern” vs “Traditional” dimension, and is closely related to the differences by occupation and industry. Managers and professionals, and those working in finance, and information sectors tended to be supportive of 71, while those in laboring and craft occupations, and in manufacturing, transport and utilities, tended to oppose. (South King county and much of Pierce county have high shares of blue collar jobs).

    Finally differences by race exist, but are not so strong as, say, in the presidential election in 2008 (although the correlation of the percent for Ref 71 and for Obama was .90).

    Yes, greater Seattle is indeed very different than the rest of Washington and much of America as well.

    Richard Morrill is Professor Emeritus of Geography and Environmental Studies, University of Washington. His research interests include: political geography (voting behavior, redistricting, local governance), population/demography/settlement/migration, urban geography and planning, urban transportation (i.e., old fashioned generalist).

  • Obama’s Elite Power Base

    Looking back at President Obama’s first year in office, this much is clear: Obama first enraged the right wing by seeming to veer far left, then turned off the left by seeming to abandon them. Even as Fox News fundamentalists rail against “socialism,” self-styled progressives like Naomi Klein scream about a “blown” opportunity to lead the nation from the swamp of darkest capitalism.

    Both right- and left-wing critics fail to consider the fundamental nature of the Obama regime. This presidency represents not a traditional ideology but a new politics that mirrors the rise of a new, and potentially hegemonic class, one for which Obama is a near-perfect representative.

    Every president and political movement, of course, brings to power an often-hoary group of grasping interest groups. Under the conservatives and George W. Bush, the favored classes included standbys like the fossil-fuel energy companies, Big Agriculture, suburban homebuilders, and the defense industry.

    Rather than the “good old boys,” Obama’s core group hails from what may be best described as the “creative class” – the cognitive elite, or, to borrow from Daniel Bell’s The Coming of Postindustrial Society, the “hierophants of the new society.” They come not from traditional productive industry, but the self-conscious “knowledge” sectors – such as financial services, the software industry, and academia.

    From early on, Barack Obama attracted big-money people like George Soros, Warren Buffett, and JP Morgan’s Jamie Dimon far more effectively than his opponents in either party. As The New York Times’ Andrew Sorkin put it back in April, “Mr. Obama might be struggling with the blue-collar vote in Pennsylvania, but he has nailed the hedge-fund vote.”

    Other bastions of support could be found in Silicon Valley, where Google Chairman Eric Schmidt and venture capitalist John Doerr were all early backers. Obama, the former law school professor, also did exceedingly well with academics, and many of his pivotal wins in the Midwest rested heavily on both votes and volunteers from college constituencies.

    Finally Obama gained the early support of public-sector unions, now arguably the dominant power within the Democratic Party. Together, these groups now enjoy the lion’s share of influence inside the administration.

    In contrast, the representatives of traditional Democratic sectors such as industrial labor unions, Latinos, or even many African Americans were slow to join the Obama bandwagon. Even after they joined his electoral coalition, they have received little in the way of succor from the president and the administration.

    Indeed, for most of these voters, the past year has been an awful one. Unemployment for Latinos, blacks, and blue-collar workers has skyrocketed, particularly among males. For them, Obama’s economic plan has done very little – unsurprising given its primary focus on sustaining public-sector employment and large financial institutions.

    In contrast, the core Obama constituencies appear to have ridden out the recession in fine shape. Mega-patron George Soros, for example, has boasted openly about how he was having “a very good crisis.” Much the same can be said of the largely pro-Obama hedge funds and investment bankers, for whom Paulson to Bernanke to Geithner has provided a double-play combination for the ages.

    Academia has also emerged as a big winner. This administration is crammed with professors from Science Adviser John Holdren and Energy Secretary Steven Chu to former Harvard President Larry Summers, the director of the National Economic Council. More broadly, academics have reaped massive windfalls from the stimulus, both in terms of direct support for universities and funding for research projects.

    One place where the priorities and class interests of the cognitive elite coalesce most has been on “climate change.” In contrast to manufacturers, farmers, or fossil-fuel firms, investment bankers, software companies, and university professors have little to fear from the rash of “green” policy initiatives.

    In fact, for these groups, “climate change” often means a once-in-a-lifetime bonanza. Wall Street sees the administration’s “cap and trade” proposals as opening a whole new frontier to enjoy yet more profit. University researchers – particularly those with the right spin on the climate issue – have been big winners in the tens of billions of dollars being handed out by the Chu-led Energy Department and other federal agencies.

    Overall, subsidized “alternative energy” – largely excluding both nuclear power and natural gas – also provides Silicon Valley with federal backing for ventures in everything from luxury electric cars and dodgy geothermal developments to “smart” energy grids. And, of course, all this increased federal spending also plays into the public-sector unions, for whom an ever-expanding government represents the ultimate growth industry.

    In the short term, Obama’s loyalties have gained him political credit even in hard times. Support from Wall Street and Silicon Valley assures access to big-money sources and influences the upper echelons of the establishment press, particularly in New York. Meanwhile, the academy and the public bureaucracy provide a cadre of political shock troops who may be needed to rouse an increasingly disaffected Democratic base in the 2010 elections.

    But Obama’s class strategy also poses considerable longer-term risks. The cognitive elites – clustered in places like Washington, New York, Boston, or Silicon Valley – tend to only talk to and listen to each other. This often makes them slow to recognize shifts in grassroots opinion on such issues as the health plan or global warming.

    That risks continued erosion of support from many hard-pressed middle-class voters around the country more concerned with economic growth and holding onto their home than saving the planet. These are precisely the voters, not the tea party activists or their leftist analogues, who likely will determine the political winners in 2010 and beyond.

    Official White House Photo by Pete Souza.

    This article originally appeared at The Daily Beast.

    Joel Kotkin is executive editor of NewGeography.com and is a distinguished presidential fellow in urban futures at Chapman University. He is author of The City: A Global History. His next book, The Next Hundred Million: America in 2050, will be published by Penguin Press early next year.

  • New Geography Top Stories of 2009

    As we bring to a close our first full calendar year at NewGeography.com, we thought readers may be interested in which articles out of more than 350 published enjoyed the widest readership. It’s been a solid year of growth for the site; visits to the site over the past six months have more than tripled over last year and subscribers have increased by a factor of six. The list of popular articles is based both on.readership online and via RSS.

    15. Joel Kotkin’s piece, Numbers Don’t Support Migration Exodus to “Cool Cities”, makes the case that places considered “cool” by many in media and economic development circles are actually losing net migrants to other U.S. regions. In almost every case, he argues, your local resources are better spent focused on skills upgrades for your local residents or hard and soft infrastructure upgrades for industries already successful in your region. This article originally appeared on Forbes.com

    14. The British Labour Party is no example for American Progressives. Legatum Institute Senior Fellow Ryan Streeter’s piece just in time for the 4th of July, View from the UK: The Progressive’s Dilemma, dissects Britain’s high social spending, increasing debt load. Streeter contends that the UK is danger of mortgaging its future.

    13. Breaking down Obama’s first year and looking forward. In two equally popular pieces from this fall, Joel Kotkin outlines a five point plan to improve Obama’s presidency (Obama Still Can Save His Presidency which originally appeared in Forbes.com. In the second piece he takes encouragement from signs that the President may be retuning his policy back towards America – “a big, amazingly diverse country with an expanding population” – and away from the “Scandinavian Consensus” model (Is Obama Separating from His Scandinavian Muse?) . This article originally appeared on Politico.com.

    12. State of the economy June 2009. Susanne Trimbath says it may be a while before the average citizen will actually see tangible improvements in the economy. As is often the case, Susanne’s predictions have turned out so far to be all too accurate.

    11. Questioning the stimulus plan. In February’sStimulus Plan Caters to the Privileged Public Sector, Joel Kotkin calls the stimulus plan “a massive bailout and expansion of the public-sector workforce as well as quasi-government workers in fields like health and education” yet “as little as 5% of the money is going toward making the country more productive in the longer run – toward such things as new roads, bridges, improved rail and significant new electrical generation.” This article originally appeared in Forbes.com

    10. Is California’s economic malaise leaking into Oregon? After years of strong migration flows of former Californians heading to Oregon, Joel Kotkin and California Lutheran University economist Bill Watkins point out that the state’s oppressive tax policies and red tape may be leaking into Oregon as well in California Disease: Oregon at Risk of Economic Malady. The article originally appeared in The Portland Oregonian.

    9. Tracking housing decline. Wendell Cox broke down the comparative national housing market in two widely read pieces. In the first he points out that the downturn can be broken into two phases, one mirroring the explosive growth in many overvalued markets, and another second phase were markets are declining across the board: Housing Downturn Moves Into Phase II. In the second, Wendell uses his median multiple calculation for the 49 largest metropolitan regions to show that prices in many place still have much farther to fall to reach historic norms: Housing Downturn Update: We May Have Reached Bottom, But Not Everywhere.

    8. Public debt is looming. Susanne Trimbath lists public debt levels of the most highly leveraged sovereign nations and explains why this debt and the credit default swaps purchased against it could create a looming public catastrophe: The Next Global Financial Crisis: Public Debt.

    7. Washington, DC is flourishing in the recession. NYU Professor and urban commentator Mitchell Moss explains how Washington is the one city benefiting from the government stimulus. He argues this is stimulating the DC economy, from increased lobbyist activity to web designers benefiting from the government’s new interest in digital communications: Washington, DC: The Real Winner in this Recession.

    6. Californa’s Decline. Three equally widely read pieces track the drastic shift in California from economic vibrancy to stagnancy: Kotkin’s “Death of the California Dream which ran first in Newsweek and The Decline of Los Angeles from February on Forbes.com. The third piece by economist Bill Watkins examines California’s domestic migration net losses using an old coal mining metaphor: In California, the Canary is Dead.

    5. Housing Affordability Rankings. The most read housing piece this year was Wendell Cox’s release of his annual housing affordability rankings based on median multiple calculations (ratio of median housing price to median household income in a given market). “Housing Prices Will Continue to Fall, Especially in California” lists median multiple calculations for each metropolitan region in the U.S. of more than 1,000,000 population.

    4. Detroit as a model for urban renewal. In a widely linked piece across the blogosphere, Aaron Renn points out that the decline in Detroit could be a platform for residents to get creative with urban re-development. This piece is full of stunning imagery of formerly dense neighborhoods now full of greenspace that sent me on a two hour Google Earth binge exploring the area. Detroit: Urban Laboratory and the New American Frontier.

    3. ”Alternative” Geography. New Geography publisher Delore Zimmerman’s run down of odd and quirky maps that redefine borders of the U.S. proved very popular on social bookmarking sites. “Borderline Reality”: “Sometimes maps can inspire and motivate us by helping to more fully understand the geography of our economic and demographic challenges and opportunities. Perhaps most importantly thematic maps tell a story about places.”

    2. Portland isn’t a model for every community. Easily our most widely discussed, shared, and linked piece this year was Aaron Renn’s “The White City.” The piece sparked a fair amount of criticism with some looking to poke holes in the racial breakdowns and others taking the piece as an affront to liberal politics instead of an examination of urban planning policy. Many of the most vehement critics failed to address the central point of the piece: Portland is a unique place with a unique disposition and composition, yet it is held up by many community leaders in other regions as the ultimate in public policy. Instead of holding up Portland as a model, cities and regions need to do a better job of looking at themselves and defining policy based upon local community identity. Be who you are.

    1. Best Cities Rankings. Overall, our most read content at New Geography this year was the Best Cities Rankings, released in April with Forbes. Our rankings are purposefully focused just on a combination of measures of one metric, employment change. We leave out all of the more qualitative measures thinking that all contribute to the output of a shifting employment landscape.

    Where are the Best Cities for Job Growth? (Summary Piece)
    2009 How We Pick the Best Cities for Job Growth
    All Cities Rankings – 2009 New Geography Best Cities for Job Growth

    It’s been a good year at New Geography, one of steady growth and, we believe, increased influence. We welcome your comments, participation, and submissions. Thanks for reading.

  • Don’t Give Up On The U.S.

    If the U.S. were a stock, it would be trading at historic lows. The budget deficit is out of control, the economy is anemic and the political system is controlled by academic ideologues and Chicago hacks. Opposing them is a force largely comprised of know-nothings–to call them Neanderthals would be too complimentary.

    Not surprisingly, many Americans have become pessimistic. Two in three adults now fear their children will be worse off than they are. Nearly 40% think China will become the world’s dominant power in the next 20 years, as indicated by a recent survey.

    Yet, in spite of everything, I would still place my long-term bets on the U.S. Here’s why:

    1. The U.S. is the only advanced country in the world with viable demographics. By 2030, all our major rivals, save India, will be declining, with ever-larger numbers of retirees and a shrinking labor force. By 2050 Germany, Japan and South Korea could approach having twice as many people over 65 per capita as the U.S. By then, the U.S. will have 400 million people, which may be more than the entire EU and three times the population of our former archrival Russia.

    2. In terms of energy resources, the U.S., combined with Canada, is the second richest region in the world after the Middle East. The country possesses vast resources of natural gas, about 90 years’ worth, as well as strong areas for wind power. Given America’s past profligacy, the country could derive considerable savings with even modest conservation efforts.

    3. America remains the world’s agricultural superpower, with the most arable land on the planet. With another 3 billion people expected on the planet by 2050, the U.S. should enjoy a continuing boom in food exports.

    4. Military power matters now and in the future. We are not living in a Star Trek future of earthly harmony. The U.S. leads in military technology and, yes, our martial spirit remains a positive factor, despite the portrayals from Hollywood. For all its missteps, the U.S. military has achieved its strictly war-fighting missions–in Iraq and Afghanistan, as well as a host of smaller conflicts–over the past 20 years. Meanwhile, Europe and Japan have taken themselves out of the military game, and it will be decades before China will be ready for a head-to-head challenge.

    5. There is no large country that comes close to the U.S. as an entrepreneurial hotbed (Taiwan, Israel and Hong Kong come close but are far smaller). The recent Legatum Prosperity Index showed the U.S. remains by far the largest generator of new ideas and companies on the planet.

    Of course, all these critical advantages could be squandered by fecklessness. The empowered American left–in sharp contrast to the tradition that runs from Franklin Roosevelt and Harry Truman all the way to Bill Clinton–often envisions the U.S. as a country headed into the dustbin of history, and deservedly so.

    Leftist historian Immanuel Wallerstein, for example, asserts that the U.S. has been “a fading global power” since the 1970s. The only question now, he suggests, is “whether the United States can devise a way to descend gradually, with minimum damage to the world, and to itself.” Another leading liberal analyst, Parag Khanna, envisions a “shrunken” America that is lucky to eke out a meager existence between a “triumphant China” and a “retooled Europe.”

    The traditionally pro-American right increasingly shares this pessimism, albeit for different reasons. With Obama and the Democrats in power, many conservatives, including such keen observers as Charles Krauthammer and Victor Davis Hanson, believe the country has hit the historical skids.

    Yet declinism is often overstated. Today, only someone delusional would suggest that once widely feared Japan, soon to fall to third place (behind China) as an economic power, constitutes a serious threat to American preeminence. However, the fantasy of a European resurgence remains deeply embedded among American policy wonks and academics. It is a firmly held belief despite the continent’s decades of slow growth, demilitarization, disastrous demographics and mounting budget woes, particularly on its southern and eastern fringes.

    On the other hand, China and India represent true ascendant economies of the next decade and beyond. China’s rise has led one writer, the Guardian’s Martin Jacques, author of When China Rules the World, to suggest that America must “learn to bow” before the great power of the 21st century.

    Yet for all their impressive growth, neither China nor India possesses either the institutional strengths or natural resources of the U.S. China’s current boom has much to do with an orgy of money-printing that would make Barack Obama blush. Real estate in some places is turning bubblish. There are reports of vacancy rates as high as 50% in Shanghai’s commercial market.

    India, as anyone who has spent time there knows, remains a highly fragmented and largely impoverished country. It will be a great power of the future, but a very poor one, which will take many decades, even a century, to approach even a decent fraction of America’s current per capita income.

    Often overlooked as well is America’s unique advantage as an inclusive multiracial society. Over the past decade America has produced two African-American Secretaries of State and one President. America remains unique in its ability to absorb different races, religions and cultures, an increasingly critical factor in maintaining global preeminence.

    What Americans need most now is to develop policies that build on our essential strengths. Some tech enthusiasts and members of the Obama Administration claim that “the age of infrastructure is over.” However, in reality there is no way to assure a decent future for the next 100 million Americans without a major investment in everything from roads and broadband to transmission lines, water systems and basic skills training

    Some conservatives may oppose such a domestic surge, but the investment reflects a strong American tradition. The critical issue will be to make sure a commitment to infrastructure does not morph into a Washington-led industrial policy that would inevitably reward the well connected and stunt our innovative edge.

    In the end, Americans must remain true to our individualist traditions. Compared with Europeans, who instinctively look to government for guidance, the vast majority of Americans still believe that hard work is the key to self-improvement. Our primary economic asset continues to lie with entrepreneurial spirit and adaptability.

    In the coming decade, American success will require precisely this blend of public support and private initiative. If the U.S. stays true to its unique traditions, it will remain the world’s best investment for decades to come.

    This article originally appeared at Forbes.com.

    Joel Kotkin is executive editor of NewGeography.com and is a distinguished presidential fellow in urban futures at Chapman University. He is author of The City: A Global History. His next book, The Next Hundred Million: America in 2050, will be published by Penguin Press early next year.

  • The Good News in Florida’s Bad Times

    By Richard Reep

    2009 was ugly. A swirl of dispiriting events stalled over much of the world this year, and Florida was no exception: state depopulation and tourism decline hit the state’s only two legitimate growth industries.

    Yet the bad times contain within them some good news. This end of an era meant that economic planners might finally turn to productive industries to generate jobs and revenue, just like the rest of the nation.

    First the bad news. For the first time since Florida became a state in 1845, more people moved out of the state than in, as reported by the University of Florida Bureau of Economic Research in August. In other states, this might not be news, but in Florida this has been viewed as nothing short of catastrophic. Growth is one of the state’s two primary industries, and with the last 163 years, growth was taken for granted (1945 saw depopulation as military personnel went home).

    Florida’s other traditional support, tourism, collapsed in 2009, as jittery tourists stayed close to home or went elsewhere in search of vacation. Since growth and tourism were the state’s only economic activity, this pretty much tanked it for the year; without a state income tax, the government is starved for tax money and is taking a hatchet to basic services in an effort to stay afloat. Meanwhile, it’s easy to get a parking space at the beach, hotel rooms are cheap and plentiful for a change, and the weather is as beautiful as ever.

    With private development dead, government desperate for income, and the professional class seeking jobs elsewhere, it will be easy for outsiders to write off the future prospects for the Sunshine State’s towns and cities. On the ground, however, a slightly different story emerges, a stoic sort of acceptance and the glimmerings of a change or two in the individual outlooks of citizens who stay. A few foreboding trends also cloud the horizon.

    Miami, a city not known to shy away from risks, this year replaced its Euclidean zoning code with a form-based code in a grand experiment with the public process. Voters who had enough of corruption and greed decided to endorse a visually appealing future of their city. Whether or not the outcome produces a better city, the 500+ public meetings did spark a badly needed public/private dialogue that should help Miami reshape itself into its new vision.

    Those who do stay in Florida and stick it out are getting more involved. As the outside world stopped supplying capital and residents, a sense of new localism sprang up almost overnight, with people gravitating away from the big brands and status symbols of a once-proud consumerist lifestyle. Sure, many turned to global brands like Wal-mart, but many more are supporting local food co-ops, farmer’s markets, independent eateries, and home industries in an effort to beat the system.

    If restlessness and discontent are the first necessities of progress (as stated by Thomas Edison), citizens of Florida cities like Tampa, Jacksonville, Orlando and Miami are ripe for progress. Consumer culture took a pause, but people still need to eat. Like the rest of the nation, this rediscovery of local goods and services has flowered, upon which a newfound sense of identity is being built through face-to-face exchange without the invisible army of middlemen that our commercial culture has spawned.

    With earnest public debate about the urban future in one of our nation’s largest cities, we can be assured that Florida citizens do care about the quality of life in their community. With neighborhoods spawning local markets and co-ops, we can be assured that urbanites do care about their local producers – and know a bargain when they see one. Both factors will contribute to a citizenry emerging stronger out of the state’s economic turmoil.

    Left to its own devices, Florida may sort itself out. Agriculture and manufacturing, two key industries faintly alive in Florida, have a chance to come back. Affordability and quality of life could lure the right kind of talent and encourage local entrepreneurs. Florida is poised to develop industries with health research and digital media where our lower costs and attractive climate could prove decisive.

    Yet this localist trend and greater attention to fundamentals could be altered by more meddling from Washington. The state returned Washington’s check for a train set not once, but twice, causing a concerned Secretary Ray LaHood to make a personal visit to see what was wrong. After some gentle persuasion – after all, Obama’s nationwide high speed rail vision could easily bypass this state with jobs and cash – Florida’s elected officials quickly jumped back to the politically correct side of the fence, and passed a bill to bring commuter rail to Central Florida. Now LaHood must deliver on the promise to prioritize Florida’s high speed rail construction.

    For the future, if the past is any guide, the upcoming war with Afghanistan could prove a boon to Florida. World War 2 saw an influx of servicemen and women, and the opening of multiple military bases, supply depots, and runways, partly due to its mild weather and partly due to its political stature. By adding this industry to offset its growth and tourism losses, Florida can benefit from the fulfillment of arguably President Obama’s most dangerous campaign promise.

    Doubts about these guns and trains leave more than a few Floridians worried about the strings attached to big brother’s largesse. It would be far more constructive to place more faith on the citizen’s renewed interest in the public process and the individual’s support of localism, two trends that seem destined to stay and become ingrained in our lifestyles. If Florida must accept Washington’s command economy for now, then at least the state will be left with increased transportation options and more exposure to service personnel who just might want to come back to stay after the war is over.

    But the more important work will, in the end, be done locally. If Floridians can capitalize on genuine public/private dialogue, such as happened in Miami 21, then there is a chance the state can pull from behind and surge ahead as a place where the future can still be sunny.

    Richard Reep is an Architect and artist living in Winter Park, Florida. His practice has centered around hospitality-driven mixed use, and has contributed in various capacities to urban mixed-use projects, both nationally and internationally, for the last 25 years.

    Photo:

  • The Decade of the South: The New State Population Estimates

    Much has been made – particularly in the Northeastern press – of the slowing down of migration to the South and West as a result of the recession. But in many ways this has obfuscated the longer term realities that will continue to drive American demographics for the coming decade.

    Americans have been moving from the Northeast and Midwest to the West and South for decades (see US region map). In the first four decades after the Second World War, the warm, dry climates of coastal California were a significant factor. As the nation became more mobile – aided by such things as inexpensive air travel and the interstate highway system and the spread of air conditioning – the larger migration pattern went towards the South. There were, of course, other factors. Business costs, particularly the costs of labor, were often lower in the West and especially the South. Personal taxes in some states were lower than in the Northeast and Midwest. Surely the period from the end of World War II to 2000 could be called the demographic “half-century” of the West and South.

    The New State Census Estimates: The latest (July 1, 2009) Bureau of the Census release of state population estimates indicates a fundamental shift in migration patterns. Yes, even at recession-depressed rates, the Northeast and Midwest continue to export domestic migrants, but they are almost exclusively going to the South now, and not the West (See Table).

    Net Domestic Migration by State
    2009 Rank Net Domestic Migration Rank 2000-2009
    State 2009 2000-2009
    1 Texas    143,423       838,126 2
    2 North Carolina      59,108       663,892 4
    3 Washington      38,201       239,037 9
    4 Colorado      35,591       202,735 10
    5 South Carolina      31,480       306,045 7
    6 Georgia      26,604       550,369 5
    7 Tennessee      20,605       259,711 8
    8 Oklahoma      18,345         42,284 19
    9 Virginia      18,238       164,930 12
    10 Oregon      16,173       177,375 11
    11 Arizona      15,111       696,793 3
    12 Louisiana      14,647      (311,368) 45
    13 Alabama      11,044         87,199 14
    14 Utah        8,623         53,390 17
    15 Wyoming        7,192         22,883 25
    16 Kentucky        6,268         81,711 15
    17 Arkansas        5,298         75,163 16
    18 West Virginia        4,510         17,727 26
    19 District of Columbia        4,454        (39,814) 37
    20 Massachusetts        3,614      (274,722) 44
    21 New Mexico        3,366         26,383 24
    22 Delaware        2,580         45,424 18
    23 Montana        2,410         39,853 21
    24 South Dakota        1,619            7,182 27
    25 Idaho        1,555       110,279 13
    26 North Dakota        1,375        (18,071) 31
    27 Pennsylvania        1,346        (33,119) 34
    28 Alaska           979          (7,360) 29
    29 Missouri          (124)         41,278 20
    30 Nebraska          (956)        (39,275) 36
    31 Vermont          (975)          (1,505) 28
    32 Kansas       (1,242)        (67,762) 41
    33 Iowa       (2,135)        (49,589) 40
    34 New Hampshire       (2,602)         32,588 22
    35 Maine       (2,937)         29,260 23
    36 Nevada       (3,801)       361,512 6
    37 Hawaii       (5,298)        (29,022) 33
    38 Mississippi       (5,529)        (36,061) 35
    39 Wisconsin       (5,672)        (11,981) 30
    40 Rhode Island       (6,172)        (45,159) 38
    41 Indiana       (6,805)        (21,467) 32
    42 Connecticut       (7,824)        (94,376) 42
    43 Minnesota       (8,813)        (46,635) 39
    44 Maryland    (11,163)        (95,775) 43
    45 Florida    (31,179)    1,154,213 1
    46 New Jersey    (31,690)      (451,407) 47
    47 Ohio    (36,278)      (361,038) 46
    48 Illinois    (48,249)      (614,616) 49
    49 Michigan    (87,339)      (537,471) 48
    50 New York    (98,178)  (1,649,644) 51
    51 California    (98,798)  (1,490,105) 50
    Derived from US Bureau of the Census data.

    Moving to the South: Between 2000 and 2009, the South attracted 90% of domestic migrants from other states, with the West accounting for only 10% (see chart below). In 2001, the South attracted 71% of domestic migration but its share rose to 86% in 2002 and accounted for virtually all net migration by 2007. In that year, not only did the Northeast and Midwest lose domestic migrants, but also the West. By 2009, the South’s share of inbound domestic migration fell back to 94%.

    Throughout the decade, the small share of domestic migration that did not go to the South went to the West, while the Northeast and Midwest continued to lose residents. The 2000s are best characterized as the demographic “decade of the South” because the vast majority of Americans moving between states moved South.

    Nearly all states in the South gained domestic migrants during the decade. Only Mississippi, Maryland and Louisiana, along with the District of Columbia, lost domestic migrants. Even before Hurricanes Katrina and Rita, Louisiana was losing domestic migrants. Perhaps the big surprise is Florida, which has led the nation in domestic in-migration for years and has attracted 1.1 million from other states during the 2000s.

    Florida’s peak came in 2004 and 2005, when more than a net 260,000 domestic migrants moved to Florida from other states. Things have changed markedly, however, with Florida rapidly losing domestic migrants in 2008 and 2009, very likely due to the impact of the housing bubble and an overreliance on inbound retirees to drive its economy.

    However, Florida’s recent decline does not weaken the near-monopoly position of the South as the dominant destination of movers. Florida’s rapidly declining domestic migration has been largely replaced by a new domestic migration champion: Texas. In the early 2000s, Texas generally attracted from 30,000 to 50,000 net domestic migrants. Migration from Louisiana from Rita and Katrina propelled Texas to the top in 2006 and the state appears to have consolidated its position as the leader in domestic migration. In 2009, with domestic migration at more modest levels nationally, the Texas gain was more than any year except for 2006 with Hurricanes Katrina and Rita. But it’s not just a Lone Star story. Seven of the top ten states in domestic migration remained in the South in 2009. Throughout the entire decade, 6 of the top 10 states were from the South and 4 from the West. However, most of the gains in the West were simply from moving around (and from California); there was relatively little inter-regional domestic migration.

    Moving Around the West (and Away from California): Most states in the West have also gained domestic migrants in the 2000s, with the exceptions of Alaska, Hawaii and California. California is the real story in the West, having lost nearly 1.5 million domestic migrants, a population greater than that of the city of San Diego. In 2000, California lost nearly 100,000 domestic migrants and for the fourth year in a row led the nation in net domestic out-migration. This includes 2006, when not even Louisiana’s catastrophic hurricanes could drive as many people away as California. During the first year of the decade, California lost only 45,000 net domestic migrants. By 2007, as the center of the worldwide housing bubble, California’s losses were 7 times that amount. In 2009, even with depressed migration rates associated with the recession, out migration more than doubled between 2001 and 2009.

    California is simply not the draw that it used to be. There was a time, in the late 1930s, that the state tried to bar “Okies” from moving to the state, legislation wisely declared unconstitutional by the Supreme Court. Things have certainly changed. The latest Internal Revenue Service data indicates that every year during the 2000s, Oklahoma gained net domestic migrants from California.

    Outside California, there has been healthy domestic in-migration in the West. However, California’s losses cancelled out more than 80% of the West’s gains during the decade. Much of the movement within the region was internal, with Californians shifting to markets where housing was less expensive (but still expensive), such as Arizona, Nevada, Washington and Oregon. More recently the movement to the housing bubble ground zero states of Arizona and Nevada, have all but disappeared, with far smaller gains in Arizona and a small net loss in Nevada in 2009.

    In one year (2007), California lost more domestic migrants than all of the other states of the West gained. Domestic migration in the West remains largely about households moving around within the region: from California to other states, with a far smaller number arriving from elsewhere in the nation.

    Escape from New York (and the Northeast): Domestic migrants continue to leave the Northeast, just as they have for decades. In the Northeast, only New Hampshire and Maine gained domestic migrants in the 2000s. However, it was a bit different in 2009. Both New Hampshire and Maine lost, while Massachusetts and Pennsylvania gained.

    Pennsylvania has been the subject of more than one “what’s wrong with Pennsylvania” report as analysts inside and out decry its competitive position. In fact, by the ultimate measure of competitiveness, where people choose to move to or from, Pennsylvania has done relatively well in the 2000s. Pennsylvania’s modest loss of 33,000 domestic migrants pales by comparison to the net 2.5 million people who have moved away from neighboring New York, New Jersey, Maryland and Ohio. Like Texas, Georgia and many other states, Pennsylvania largely missed the housing bubble, which probably accounts for some of this surprising phenomenon.

    But the relative success of Pennsylvania should not be touted, as the mainstream media would tend to, as a sign of general Northeastern resurgence. New York alone lost 1.65 million over the 2000-2009 period. This is, in absolute numbers, more than California and a larger percentage loss than Louisiana with Katrina and Rita. Critically, data through 2008 shows that most of the domestic migration losses came from New York City and to a lesser extent its suburbs. Upstate New York, which also missed the housing bubble, experienced comparatively modest domestic migration losses, as Ed McMahon and I showed in an Empire Center policy report earlier this year.

    Hollowing out the Heartland: Domestic migrants are also deserting the Midwest, though in somewhat smaller numbers than in the Northeast. Only Missouri and South Dakota gained domestic migrants in the 2000s, although in 2009, Missouri experienced a small loss and was replaced by North Dakota as a gainer. But it is not a region-wide phenomena. Nearly 90% of the loss in the Midwest was in Illinois and the economic basket case states of Michigan and Ohio.

    Slowing Migration: One of the principal stories out of this year’s Census release is that interstate domestic migration declined markedly in 2009. Indeed, domestic migration was lower than in any other year in the decade, but not by that much. In 2009, 500,000 people migrated between the states, compared to between 570,000 and 620,000 annually from 2001 to 2003. Then, from 2003 to 2007, interstate domestic migration was up to 1.25 million and averaged more than 900,000. The anomaly is not so much that domestic migration is down, but rather that domestic migration got so high in the middle part of the decade, at the very same time that house price differences reached unprecedented heights. It’s no wonder people were moving.

    The Future? What comes next after the chaotic decade of the 2000s? As is suggested above, much of the variation in domestic migration is explained by differences housing prices and trends. Indeed, the price of housing may be a surrogate for the cost of living, which varies principally between areas based upon housing cost differences. This is likely to continue. In coastal California, house prices remained above historic norms, even at the largest “bubble burst” losses,” and there are recent indications that unhealthy price escalation has resumed. Much of the West and most of the country is far more affordable. This would suggest that coastal California’s domestic migration losses will continue and rise in the future.

    By contrast, in much of the rest of California and the other “ground zero” states of Florida, Arizona and Nevada house prices have returned to historic norms, which suggests that after the recession, strong domestic in-migration could resume.

    The future looks very bright for Texas and other states in the South that have done so well (such as North Carolina, South Carolina, Georgia, Tennessee, Oklahoma and even Arkansas). Their biggest challenge will be to resist the siren songs to become more like California, with its disastrous policies appreciated only by proponents and a fawning media.

    Wendell Cox is a Visiting Professor, Conservatoire National des Arts et Metiers, Paris. He was born in Los Angeles and was appointed to three terms on the Los Angeles County Transportation Commission by Mayor Tom Bradley. He is the author of “War on the Dream: How Anti-Sprawl Policy Threatens the Quality of Life.