Category: Demographics

  • World Capitals Of The Future

    For most of those which were great once are small today; And those that used to be small were great in my own time. Knowing, therefore, that human prosperity never abides long in the same place, I shall pay attention to both alike

    –Herodotus, Fifth Century B.C.

    If the great Greek chronicler and “father of history” Herodotus were alive today, he would have whiplash. In less than a lifetime, we have seen the rapid rise of a host of dynamic new global cities – and the relative decline of many others. With a majority of the world’s population now living in cities, what these places do with their new wealth ultimately will shape this first truly urban century.

    Just 25 years ago, when you walked down the Bund in Shanghai, there were few cars and no modern towers. The rough sidewalks expanded into the streets to accommodate a mass of poorly dressed pedestrians. A decade later, Moscow was in the midst of a particularly grungy interlude, filled with stolid people waiting in lines for shoddy consumer goods. You could hail a cab, and pay for it, with a pack of Kents.

    Today, these two cities have emerged from their socialist shackles with scores of high-rise projects either already up or on the drawing board. This, of course, has come with a price; Moscow hotel accommodations – cheap if dingy a quarter century ago – last year ranked as the world’s most expensive. Shanghai, meanwhile, has bustling traffic, a new subway and a 100-story office tower; it is about to begin construction on another that tops out at 121 stories.

    Also remarkable: the rise of other great cities – Mumbai, Bangalore and Hyderabad in India; Beijing; Sao Paulo, Brazil; and Dubai – that a quarter century ago were either obscure or better known for their destitution than their rapid construction.

    Of course, none of these cities’ wealth or economic power have passed leading global centers like Tokyo, London, Paris, New York, Chicago, Los Angeles, Seoul, Singapore and Hong Kong. But our list of emerging global cities is clearly gaining on them – and with remarkable speed.

    The main reason lies in economic fundamentals. Over the past 25 years, per capita income, based on purchasing power parity, grew by over 400% in India and a remarkable 1,500% in China. The bulk of that wealth came from urban centers like Mumbai and Shanghai, while the largest concentrations of poverty remained in the countryside. In that same period, U.S. per capita income grew by 245%; growth in most Western European nations was less than that.

    The nascent recovery in the world economy will certainly amplify these trends. China, as opposed to the U.S., is leading the economic resurgence, drawing in commodities from its rising business partners in all continents.

    For the most part, basic industries lead the way. Manufacturing has propelled the rise of the great Chinese cities. In Brazil, Sao Paulo’s growth spans everything from shoes and aerospace to technology. The city also dominates Brazil’s growing energy sector, both renewable and traditional. Energy – overwhelmingly of the fossil fuel variety – has powered the rise of Moscow and Dubai. It’s not always pretty. As the old Yorkshire saying has it, where there’s muck, there’s brass.

    Of course, the past year’s drop in oil prices has set back things a bit. California real estate investor Bob Christiano notes that more than half of the construction projects in the United Arab Emirates – worth $582 billion total – were put on hold in 2008. But now that the price of oil seems back on the rise, you can expect things to perk up in places like Dubai, Moscow and Sao Paulo.

    Not all our emerging cities are in the developing or former Communist world. North America boasts at least three genuine emerging world cities: Calgary, in Canada, and Houston and Dallas. These regional economies have been built around energy and expanding industrial power. They also have enjoyed rapid population growth. Last year, Houston and Dallas grew more than any other metropolitan region in the country; over the past decade, their populations have increased six times more rapidly than New York, Los Angeles, Chicago or San Francisco.

    But it’s not all a demographic game; cities like Phoenix and Las Vegas have similarly enjoyed rapid growth but do not fit on the rising global cities list. The key difference lies in the Texan cities’ rising corporate power. Houston, with 27 Fortune 500 firms, has passed Chicago in the number of Fortune 500 companies, while Dallas, with 14, ranks third. Together, the two Texan cities account for about as many Fortune firms as New York, once home to almost a third of the nation’s largest companies.

    Similarly, Calgary has become Toronto’s main challenger for corporate headquarters in Canada, a move sparked not only by oil wealth but lower taxes and regulation. The region now easily boasts the highest per capita income in the country. Its long-term main rival in growth may prove to be provincial cousin Edmonton, which sits closer to Alberta’s massive oil sands deposits.

    In Australia, Perth, located on the Indian Ocean and close to critical commodities such as iron ore, has also emerged in a big way. Australia’s richest city has become a major urban threat to long-established Sydney and Melbourne, with growth driven both by domestic as well as foreign migration and development.

    These emerging world cities also have survived the housing crisis much better than their national competitors. The growth of India and China has created an ever-richer market for commodities, as well as expertise residing in places like Perth, Calgary, Dallas and Houston, much of it built around commodity and resource extraction. The evolving ties between burgeoning world cities also spill over into the growing tourism industry in Perth and the expanding medical service complex in Houston.

    Another group flocking to the developing world’s super-stars: architects and civil engineers, many of them from more established first-world cities like New York, London, Los Angeles and San Francisco. Over the past 25 years, most of the biggest rail, road, airport and sanitation systems have been built not in Europe or America, but in East and South Asia, the Middle East and Brazil. Even as the West tries to work through its housing crisis, residential real estate prices are on the rise in cities like Mumbai, Bangalore, Beijing and Shanghai.

    The lure is irresistible, particularly for the young and ambitious. Just last month, Adam Mayer, a 20-something formerly employed architect from San Francisco, relocated to Beijing. He sees the chaos around him, but has plunged into the opportunity. “As I wait for our economy to recover,” he told me, “I am enjoying the ride as I witness perhaps one of the most compelling urban development stories of the 21st century.”

    High-rise office buildings have emerged as the biggest signs of the new order among global cities. Shanghai is already the fourth-tallest city in the world, with 21 buildings over 700 feet. Of the world’s 10 tallest buildings, only one – the former Sears (now Willis) Tower in Chicago – resides in the U.S. or Europe. There are now more tall buildings in Asia than in North America, and of the tallest 10 completed in 2006, four were in China and four in the Middle East. When completed, the Burj Dubai will stand as the world’s tallest.

    Although less awesome, the shift in skylines can also be seen in Russia. Until recently, Moscow had no buildings higher than the 787 feet of Moscow State University. Now, the Kremlin city has 14 towers complete or on the way, including one that will replace the current Naberezhnaya Tower; it will be Europe’s tallest building. Another project, a billion-dollar Chinatown, is being proposed with investors from China.

    Even with their rapid growth and increasingly modern gloss, these cities don’t tend to make the usual lifestyle-based “best cities” lists. Munich, Zürich, Copenhagen and Vancouver may be somnolent compared to Beijing or Bangalore, but they tend to be far wealthier, better organized, cleaner and safer – and they have far less poor people. Even our current global metropolises like Tokyo, London and New York have been able to hone the cultural amenities that make for a gracious urbanity.

    In contrast, by their very nature, boomtowns often give shorter shrift to the environment, the aesthetics of place and the more important aspects of community. Shaghai’s “tofu like” soil may not be ideal for massive high-rise buildings, just as some of Dubai’s buildings, some believe, may be helping to erode the Persian Gulf coastline.

    These upstarts are often too busy building and trying to impress the rest of the world to focus on architecture or plan niceties to make the heroic routine of everyday life more pleasant, notes London-based architect Eric Kuhne, who has worked on major projects in Moscow, Dubai and other Persian Gulf cities. Such places tend to be “abrupt and rude” in their development, but also “honest in every way” – they are the new kids on the block, with more money and power than seasoning.

    Like parvenus throughout history, Kuhne adds, these burgeoning power centers harbor “a desire to be seen as relevant, as ‘modern’, as shockingly new. In the stampede for a shining presence on the horizon, they both have been mesmerized…perhaps hypnotized…by their own profligacy of uncontrolled development.”

    Yet, Kuhne reminds us, you could have said the same thing about now-reigning world capitals like New York, London, Tokyo, Chicago or Los Angeles. These cities also “experienced a similar riot-panic in the post-war boom years of the ’50s. We destroyed the intricacy of centuries of urbanism [and] sacrificed community and family fabric for home ownership and autonomy.”

    Ultimately, the salvation for these cities may lie, Kuhne suggests, not in mimicry of Western ways but in drawing inspiration from their own ancient traditions. After all, Chinese, Arabs and Russians are not newcomers to city-building. But however they decide to build their new cities, these countries will be providing the blueprint for all of our urban futures.

    This article originally appeared at Forbes.

    Joel Kotkin is executive editor of NewGeography.com and is a presidential fellow in urban futures at Chapman University. He is author of The City: A Global History. His next book, The Next Hundred Million: America in 2050, will be published by Penguin early next year.

  • Millenial Generation Myths

    1. Young people think and behave the same at all times. One generation is just like the one before it and the one that follows. False: Each generation is different from the one before it and the one that follows. Today’s young people, the Millennials (born 1982-2003), are a “civic” generation. They were revered and protected by their parents and are becoming group-oriented, egalitarian institution builders as they emerge into adulthood. Millennials are sharply distinctive from the divided, moralistic Baby Boomers (born 1946-1964) and the cynical, individualistic Gen-Xers (born 1965-1981), the two generations that preceded them and who are their parents.

    2. Millennials are narcissistic, self-indulgent kids who think they are entitled to everything. False: Millennials have a deep commitment to community and helping others, putting this belief into action with community service activities. Virtually all Millennial high school students (80%) participate in a community service activity. Two decades ago when all high school students were Gen-Xers, only a quarter (27%) did so.

    3. Millennials volunteer and serve because they are “forced” to or are trying to polish their college application resume. False: Millennials volunteer for community and public service in large numbers long after their “required” initial high school experiences. In 2006, more than a quarter (26%) of National Service volunteers were Millennials, at a time when Millennials comprised no more than 15% of the adult population. By contrast in 1989 when all young adults were members of Generation X, only 13% of National Service volunteers were in this age cohort.

    4. Millennials became Democrats and liberals because they are hero worshipers of Barack Obama. False: Millennials identified as Democrats and liberals well before Obama emerged as a major political force with significant name identification. In 2007, Millennials identified as Democrats over Republicans by 52% to 30% and as liberals over conservatives by 29% vs. 16% (the rest were moderate). At that time, Barack Obama’s name identification was barely 50%, well below that of Hillary Clinton and John Edwards, his chief competitors for the Democratic presidential nomination.

    5. Millennials will become more conservative as they age. False: Party identification and ideological orientation are formed when people are young and are retained as they age. Prior “civic” generations, with similar belief systems to Millennials, kept that philosophy throughout their lives. The only two generations that gave John Kerry a majority of their votes over George W. Bush in 2004 were the first sliver of Millennials eligible to vote and the last segment of members of the GI Generation, all of whom were at least 80 and many of whom were casting their final presidential vote.

    6. Millennials, like all young people, are apathetic and uninterested in voting. False: Young people’s proclivity to vote or not is not based upon their age but their generation’s belief in the efficacy of voting. Millennials are members of an activist and politically involved “civic” generation. They have voted heavily in the past and will continue to do so in the future. According to CIRCLE, an organization that examines youth political participation trends, 6.5 million people under 30 voted in presidential primaries and caucuses in 2008, double the youth participation rate of 2000. Fifty-three percent of Millennials voted in the 2008 general election (59% in the competitive battle ground states), up from 37% in 1996 when all young voters were member of Generation X.

    7. Like Boomers and Gen-Xers before them, Millennials are cynical and disillusioned by the problems facing them and America. False: In spite of the fact that they are far more likely to be unemployed and far less likely than older Americans to have health insurance, Millennials are more optimistic than older generations. A May 2009 Pew survey indicates that about three-quarters of Millennials in contrast to two-thirds of older generations are confident that America can solve the problems now facing our country.

    8. Millennials care only about what happens in their own country, community, and lives and not on what goes on in the rest of the world. False: Most Millennials have visited foreign countries and through social networking technology, are connected to friends around the world. They are open to working with people in other countries to solve the problems of the world community. Millennials are far more likely than older generations to support free trade agreements like NAFTA (61% vs. 40%) and far less likely to believe in military solutions to international concerns (39% vs. 58%). Millennials are also about three times more likely than seniors to have opinions on major international concerns like Israeli/Palestinian relations.

    9. Millennials, like all generations, are rebels who are hostile to civic institutions and government. False: Millennials have significantly more positive attitudes toward government and its activities than older Americans. Millennials are much less likely to believe that if the government runs something, it is usually wasteful and inefficient (42% vs. 61%) or that the federal government controls too much of our daily lives (48% vs. 56%). They are much more likely to feel that government is run for the benefit of all (60% vs. 46%).

    10. Millennials are more focused on trivialities such as celebrities than on the big issues facing America. False: Unlike some previous generations, Millennial celebrities and musical tastes are more acceptable to and compatible with their parents’ values because they reflect the generation’s love of teamwork and service to the community rather than rebellion. For example, a recent Pew survey indicates that rock music is the preferred genre of Millennials, Gen-Xers, and Boomers. Rock, the music of rebellion in the 1950s and 1960s, is now mainstream. Moreover even as early as 2006, two years before Barack Obama’s candidacy, more than twice as many Millennials had voted for president than had voted on American Idol.

    Morley Winograd and Michael D. Hais are co-authors of Millennial Makeover: MySpace, YouTube, and the Future of American Politics published by Rutgers University Press.

  • Beijing is China’s Opportunity City

    “What the Western fantasy of a China undergoing identity erasure reveals is a deep identity crisis within the Western world when confronted by this huge, closed, red alien rising. There is a sense that world order is sliding away from what has been, since the outset of industrialization, an essentially Anglo-Saxon hegemony, and a terrible anxiety gathers as it goes.” – Adrian Hornsby, “The Chinese Dream: A Society Under Construction”.

    One year after the conclusion of what may have been the most bombastic Olympic Games ever staged, the host city of Beijing has solidified its position as a growing influential global metropolis. While the rapid pace of change and development in China is well-documented by the Western media, the foreign consensus regarding The Middle Kingdom’s ascendancy to global super power remains decidedly ambivalent. Yet a closer look at China’s second largest city may yield a different, more promising outlook for this gigantic yet mysterious country.

    Much like London was to England in the 19th Century and Los Angeles was to the U.S. in the 20th Century, Beijing is today ground zero for opportunity in China. Shanghai holds on to its reputation as the country’s most cosmopolitan city and banking center, but Beijing continues to strengthen its role as political and cultural hub of China.

    To call Beijing an ‘opportunity city’ is counterintuitive based on its monumental physical characteristics and history as imperialistic capital. Home to the massive Forbidden City and the adjacent Tiananmen Square, the city is defined by a tradition of architectural pomposity. Continued today in buildings like the Olympic Bird’s Nest Stadium and the ominous CCTV Building, subtlety and grace are not Beijing’s strongest suits. Yet underlying these iconic structures is a restless population of 17 million, including many newcomers eager about the prospect of upward mobility.

    As construction of new buildings came to a screeching halt in the U.S. late last year, I also heeded the call of opportunity and headed to Beijing myself. My story is not unique in this regard as the phenomenon of recent American graduates moving to China for jobs was documented earlier this month in an article from the New York Times. Now working with a young, up-and-coming Chinese architecture firm, I am bearing first-hand witness to phenomenal changes.

    Problems exist of course, but criticizing Beijing or the rest of China from afar for its poor air quality or the rampant destruction of its old neighborhoods is too easy. The reality underlying these problems is much more complex, much of it depending on varying perspectives of how Westerners as opposed to Chinese view the country’s direction.

    For instance, Western planners and architects lament the razing of the charming alley and courtyard Hutong neighborhoods as significant losses of urban history. Yet most Chinese people view the process of destruction and rebuilding as a necessary piece of the modernization of their country. As 21-year-old film student and native Beijinger Ashley Zhang observes, “Although the loss of the Hutongs is sad, the reality is that most people would prefer to live in modern buildings where they do not have to go outside and use a shared bathroom or live in an old structure where they are going to be cold during the winter.”

    Other Beijingers have noted how owners of homes in Hutongs are more than willing to trade in their digs for large paydays. Ms. Zhang went on to explain to me that a “change in accommodations will not necessarily alter the spirit or the culture of the Chinese people”. This presents a markedly different perspective from the Western view on the relative importance of permanence in the built environment.

    It could be argued that a true sense of Chinese-ness exists more in the tradition of language and cuisine than in the built form. As such, the new and prolific building and infrastructure projects of China represent more a desire to join the modern world rather than to celebrate its architectural history.

    Yet to say that there is no urban planning in Chinese cities would be off the mark. As put forth by the Beijing Municipal Commission of Urban Planning in 2004, the ‘Beijing 2020 Masterplan’ calls for high intensity development eastwards towards Tianjin and low intensity development westward towards the mountains. The ‘Two Axes, Two Corridors – Multicenters’ Plan’ aims at relieving congestion towards the historic center of Beijing by strengthening outlying polycenters.

    Lisa Friedman of the New York Times recently lambasted the city’s development pattern as Beijing locking itself into a pattern of Los Angeles-type sprawl. In fact, Beijing’s polycentric development can be attributed to the fact that the historic core of the city is already well defined and remains off-limits to new development.

    Also, contrary to most American cities, the designated ‘Central Business District’ lies east of the center of the city. Concentrations of jobs form other business ‘nodes’ in all directions around Beijing. This is not due to any desire to copy Los Angeles per se but rather because the city is gaining tremendously in population and must ‘sprawl’ in order to accommodate these newcomers. In addition, businesses prefer to set up shop in places where land is cheaper.

    Detractors of rapid urban development like to note how sprawl creates unbearable automobile traffic. Yet they forget that the first great exemplars of “sprawl” – London and Los Angeles – did so with massive commuter rail systems long before the rise of LA’s freeway system or London’s ring roads.

    In fact what you have in Beijing is sprawl abetted by a Metro system that would be the envy of American public transportation enthusiasts. There are currently six subway lines operating in the city and in addition, 10 new lines which are under construction are all slated to be completed by 2015. In the end, Beijing’s rail network will constitute 350 miles of track. Compare that to Los Angeles, which destroyed its own huge rail system in favor of buses, where a planned ‘subway to the sea’ consisting of a mere 14 miles of rail is estimated to not be completed until the year 2036.

    Beijing is well on its way to ‘megacity’ status. Along with the city of Tianjin, about 70 miles southeast of Beijing, the Beijing-Tianjin mega-region will be one of the largest in the world. Tianjin, as the fifth-largest city in China and boasting a population of about 11.5 million residents, is going through a building boom of its own. Acting as Beijing’s main port, the two cities together form an economic powerhouse. The marriage between the two cities was consummated a year ago with the opening of the 350 km/h (217 mph) Beijing-Tianjin Intercity Rail – reducing travel time to a mere 30 minutes. I rode this train myself recently and had to cover my eyes from the constant flashbulbs going off recording the speedometer on the monitor in the front of our car.

    China has come a long way since the days of Chairman Mao’s ‘Great Leap Forward’. Although still ‘Communist’ in terms of a political system of one-party rule, traversing the streets of Beijing gives the impression that China may in fact be the most capitalist place on earth. From weather-worn women selling fruit to crafty young men hawking fake watches and pirated DVDs, no piece of the city is off-limits to commerce.

    There’s a huge generation gap between the younger generations and those who were unfortunate enough to have lived through the Cultural Revolution. But I would warn Westerners to not be fooled into thinking that China will forever be just a ‘cheap place to manufacture things’. The country is still very young, and as more young people get educated and travel abroad, China will evolve into an important player in everything from architectural design to green technology and the arts. At that point in time, sadly, there will no longer be any need for ‘Western experts’ like me. But for the time being, as I wait for our economy to recover, I am enjoying the ride as I witness perhaps one of the most compelling urban development stories of the 21st Century.

    Adam Nathaniel Mayer is a native of the San Francisco Bay Area. Raised in Silicon Valley, he developed a keen interest in the importance of place within the framework of a highly globalized economy. Adam attended the University of Southern California in Los Angeles where he earned a Bachelor of Architecture degree. He currently lives in Beijing, China where he works in the architecture profession.

  • High Cost of Living Leaves Some States Uncompetitive

    Late this spring, when voters in California emphatically rejected tax increases to close the state budget gap, they sent a clear message to state policymakers. They were tired of California’s high taxes, which according to the non-partisan Tax Foundation, consumed 10.5 percent of state per capita income last year. This compared with a national average of 9.7 percent, making California the sixth most heavily taxed state in the nation.

    But if Californians were tired of paying an additional 0.8 percent of their income in state and local taxes, what would they make of research by economists at the federal Bureau of Economic Analysis that estimated that the cost of living in California, based on 2006 data, was a whopping 29.1 percent above the national average? Obviously, from an economic point of view, the state’s high cost of living has a much greater impact on the average person’s standard of living than taxes do.

    Cost of living is not an issue that we typically think about, when it comes to voting and politics. That needs to change. Cost of living estimates provide a valuable tool for making accurate comparisons of economic performance. Moreover, they provide the best available, if indirect, measure of the costs imposed by regulation. And with Congress debating potentially dramatic changes in how we regulate energy and health care, costs of this kind clearly deserve close scrutiny.

    Let’s begin with economic performance, starting with California. According to 2006 census estimates from the American Community Survey, the median household income in California was $56,645. In terms of ranking, that made California the sixth most prosperous state in the nation. But how did California fare, once the cost of living was taken into account? The answer is not very well. The economists who published the 2006 data, Bettina Aten and Roger D’Souza, did not deflate income data by the full 29.1 percent when calculating the real effect of cost of living. Rather, they exempted certain components of income, such as government transfer payments. Using this attenuated calculation, real median household income in California in 2006 was $47,988. In terms of ranking, that dropped California down to 31st place. (Were the data deflated by the full 29.1 percent, the state would have fallen all the way to 48th place.)

    California is not the only state afflicted with an exorbitant cost of living. Bluer than blue New York State, according to the Aten and D’Souza data, had an even higher cost of living, estimated at 31.8 percent above the national average. And not surprisingly, it fared particularly badly, once the cost of living was taken into account. Again using an attenuated calculation, the median household income in New York dropped from $51,384 in nominal dollars down to $42,744 in cost of living adjusted dollars. In terms of rankings, this dropped New York from 17th place down to 49th place. (Were the data deflated by the full 31.8 percent, the state would have fallen to last place, almost 10 percent lower than the next poorest state, Mississippi.)

    What cost of living estimates taketh away from some, however, they also giveth to others. Consider, for example, Utah and Minnesota. In the case of Utah, median household income in 2006 stood at $51,309 in nominal terms. But according to the Aten and D’Souza estimates, the cost of living in Utah was 13.5 percent below the national average. Using the attenuated calculation, cost of living adjusted income in Utah was $57,147, the second highest in the nation.

    In the case of Minnesota, median household income in 2006 stood at $54,023 in nominal terms. But according to the Aten and D’Souza estimates, the cost of living was 7.4 percent below the national average. The attenuated calculation put the Minnesota a cost of living adjusted income at $57,140, third highest in the nation.

    As a general rule, the states with the lowest cost of living are states in the South and to a lesser degree the Mountain West. Among the states of the Old South, only Virginia had a cost of living above the national average. Dynamic states like North Carolina had a cost of living 13.1 percent below the national average. In Georgia, the figure was 12.1 percent. In the Mountain West, Idaho had a cost of living 17.3 percent below the national average. In New Mexico, the figure was 16.5 percent.


    Besides affecting the true measure of economic performance, cost of living differentials have other, important implications as well. Federal taxes are one example. Consider New York. For years, it has been recognized that New York State sends more in taxes to Washington, D.C. than it receives back in the form of federal outlays. Recently, there has been some disagreement about the size of this deficit, but in the past it was generally agreed that it amounted to approximately two percent of Gross State Product. If New Yorkers were truly rich, this would not be a great burden. But as shown already, that is not the case. By failing to control its cost of living, New York ends up subsidizing other states that in real terms are doing much better.

    Another implication of cost of living differentials has to do with population. All things being equal, people will live where they can maximize their standard of living. Not surprisingly, states that have seen the largest population growth in recent decades tend to be those with a low cost of living, notably in the South and in the Mountain West. On the other hand, states with a high cost of living have typically seen population growth lag. This is particularly true among certain Northeastern states that should have boomed, if nominal income were the best guide of how well a state is doing. Examples include Massachusetts, Connecticut and to a lesser degree, New Jersey, which has the second highest median household income in the nation.

    In sum, the cost of living says a great deal about a state, its politics and its future.

    Eamon Moynihan is the Director of the Cost of Living Project in New York. The purpose of the project is make New York City and State more competitive, with a particular focus on the costs imposed by regulation. A former government official at both the City and State level, he most recently served as Deputy Secretary of State for Public Affairs and Policy Development. An interactive website for the project can be accessed at thecostoflivingproject.org.

  • Hypocrisy? Conservative Anti-government Folks are Also at the Public Trough

    Frequent news stories tell of folks who protest and rant about “socialism” and government handouts, especially recently in the “debate” over health care reform, but who turn out to live on social security and depend on Medicare, and sometimes don’t even know they are public programs! This likely tells us about the astounding power of the religious right and of the economic illiteracy of much of the population.

    Statistics of possible interest and value include data on the balance between federal tax receipts and federal outlays for the states and variation in “dependency” or the shares of unearned income/transfer payments by states (social security, public assistance, etc).
    Is there any evidence of more “liberal” Obama-voting in states which actually pay more in taxes than they get back, or which have lower rates of dependency?

    Yes, but the relations are not strong, because there are some very confounding factors, like size of state, age of the population, or presence of federal institutions.

    Still, here is a list of states that support the hypocrisy argument about the balance of receipts versus outlays.

    Get/Give Ratio Share of Obama Vote Get/Give Ratio Share of Obama Vote
    State Low High   State High Low
    NV 65 55 MS 202 43
    NJ 66 57 AK 184 38
    CT 69 61 LA 178 40
    NH 71 54 WV 176 45
    MN 72 54 AL 166 39
    IL 75 62 SD 153 45
    DE 77 62 KY 151 41
    CA 78 61 MT 147 47
    NY 79 63 AR 141 39
    CO 81 54 OK 136 34
    MA 82 62 SC 135 45
    WI 86 56 ID 121 36
    WA 88 57 AZ 119 45
    MI 92 57 KA 112 42
    OR 93 57 WY 111 33

    But some states are exceptions, notably the following group with both high outlays relative to receipts and high concentrations of Obama voting:

    Get/Give Ratio Share of Obama Vote
    State High High
    NM 203 57
    VA 151 53
    HI 144 72
    ME 141 58
    MD 130 62

    Except for Maine, these states have a large federal presence.

    Now is there evidence of states with higher shares of the populace depending on unearned income and transfer payements voting more Republican? Again, yes, but even less strongly, and the dependency share are never really very high.

      Dependence Obama State Dependence Obama
    States High Low     Low High
    OK 7.3 34 MD 4.1 62
    AL 7.2 39 MA 5.0 62
    AR 8.3 39 IL 5.2 62
    KY 7.5 41 CT 4.9 61
    MS 7.7 43 CA 4.8 61
    ND 7.5 45 WA 5.3 57
    WV 10.5 45 NJ 4.9 57
    MT 7.9 47 NV 5.2 55
    NH 5.1 54
    MN 5.1 54
    CO 4.0 54

    But some states are exceptions, coming in high in both categories or low in both categories, notably:

    Dependence Obama State Dependence Obama
    States High Low     Low High
    RI 6.7 63 TX 4.8 44
    VT 6.5 67 UT 4.8 34
    HI 6 72 AK 3.2 38
    ME 7.3 58 GA 4.5 47
    NM 6.8 57
    PA 7.5 54
    IA 7.3 54
    FL 7.8 51

    These “high high” states have very high shares of the elderly.

    States on both lists supporting the hypocrisy theory include the Republican voting states sitting at the trough: WV, AL, KY, MT, AR and OK on the one side, and Democratic voting states showing less dependency on various federal sources: MA, NV, NJ, CT, NH, MN, IL, CA, CO and WA on the other. HI and ME are contrary on both lists. Note that most of the other states have around average values and show no consistent patterns. They are mapped but not discussed.

    Richard Morrill is Professor Emeritus of Geography and Environmental Studies, University of Washington. His research interests include: political geography (voting behavior, redistricting, local governance), population/demography/settlement/migration, urban geography and planning, urban transportation (i.e., old fashioned generalist)

  • California Disease: Oregon at Risk of Economic Malady

    California has been exporting people to Oregon for many years, even amid the recession in both states.

    Indeed, the 2005 American Community Survey report shows that California-to-Oregon migration was 56,379 in 2005, the sixth-largest interstate flow in the United States. The 2000 census showed a five-year flow of 138,836 people, the eighth-largest over that time period. Until two years ago, Oregon was managing to absorb this population with mixed results, but generally as part of an expanding and diversifying economy. But that pattern has ended, at least for now.

    So now what will Oregon do with a suddenly excess population? California, at least, can say its emigres over time will reduce unemployment and reduce out-of-whack property prices. The immediate net benefits for Oregon are harder to discern.

    California’s massive economic collapse — which has resulted in 926,700 jobs lost from July 2007 through June 2009 and an unemployment rate of 11.6 percent — is now becoming Oregon’s problem. As Californians, largely for lifestyle and cost reasons, head north across the border, they have helped swell Oregon’s ranks of both unemployed and, perhaps equally important, underemployed.

    Our analysis of California migrants has shown a gradual reduction in their earnings over what they were earning in the Golden State. There also are less quantifiable impacts. Portland, a city attractive to many unemployed and underemployed younger Californians, could well be becoming the “slacker” capital of the world.

    There’s another major problem with the continuing California migration. Along with young people, newcomers to the state also include large numbers of the retired and semi-retired. These people generally have little interest in economic growth, whether for longtime state residents or their fellow, often younger emigres. Instead what they bring with them are political attitudes that could slow down the state’s economic recovery.

    Some might call this California disease. This refers to a chronic inability to make hard decisions as well as a general disregard for business and economic activity.

    California’s inability to plan or create new public infrastructure affects every part of the state’s economy. California was once a leader in building infrastructure, but that was in Pat Brown’s gubernatorial administration in the 1960s when California last planned a major infrastructure project.

    There are consequences to California’s inability to deal with infrastructure. Its freeways are parking lots. Its water problems are threatening the viability of Central Valley agriculture, one of the key drivers of the state’s economy. Its electrical system is so bad that every summer brings the fear of interruptions in the supply of electricity. Its universities are in decline. Its prisons are overcrowded.

    Another symptom of California disease is regulation and red tape that increases the uncertainty for any project and raises the cost.

    California projects can be in planning for years, and at the end of that planning process they may still be denied. The long delays are expensive. And as many would-be California developers will tell you, the uncertainty is a strong detriment to economic activity and development.

    We also see symptoms of California disease in tax policy. California no longer has the United States’ highest income tax rate. Big deal. With a top income tax rate of 10.3 percent, sales taxes that can reach 10.25 percent and a 33.9 cents-per-gallon gas tax, its total taxes are among the highest in the country.

    California’s regulatory climate also reflects the disease. Even as the state endures its most brutal recession in decades, it persists in unilaterally imposing new regulation, making the state less competitive with other states.

    In short, California is whistling past the graveyard, hoping that its economy will rebound, “because it always has.”

    Key symptoms of California disease are forgetting that quality of life begins with a job and negative domestic migration.

    With all the influx of Californians, it’s not surprising that Oregon shows some signs of California disease. It recently increased its tax rates so that Oregon’s highest-income taxpayers face marginal tax rates that match Hawaii’s for the highest in the nation. Oregon’s land-use planning had been extremely centralized for some time. Indeed, Oregon’s land-use planning may be the most centralized in the United States. This makes it harder for communities to control their own destinies, whether they want to grow or not.

    If Oregon does have California disease, the malady is surely not as advanced as it is in California. Oregon has lower gasoline taxes and lower property taxes than California. Oregon, in contrast with California, enjoys net positive domestic migration. It is also a good sign that a significant percentage of the people moving to Oregon from California are young folks. While it seems to many that the typical California immigrant is a wealthy aging baby boomer, the data show that he (or she) is still most likely a young person in his 20s or 30s, and often married with children. They are people who, if the economy grew, could have something to contribute to the economy as well as the cultural development of the state.

    But Oregon’s relationship with California remains a double-edged sword. On the one hand, Oregon has benefited from the inflow of cash and skilled workers. On the other hand, Oregon’s relationship with California has led to the current situation where at 12.2 percent for the month of June, Oregon has one of the highest unemployment rates in the United States.

    Oregon may be at a crossroads. The state is richly endowed with many of the components of a high quality of life. People want to live in Oregon, and they are moving to Oregon even in hard times. Yet as the population swells, there’s no concurrent growth in businesses and employment. Over time, this could pose serious problems. Remember, quality of life begins with a job, preferably a rewarding, well-paying job.

    However, Oregon must avoid making many decisions that led to California’s current situation. The costs of California disease are more than those reflected in the economic statistics. Devastated communities and families, and wasted opportunities, could infect this fair state for years to come.

    Joel Kotkin is author of “The City: A Global History.” Bill Watkins is director of the Center for Economic Research and Forecasting at California Lutheran University.

  • Woodstock Generation Going Up the Country

    They might not have known it but Canned Heat’s classic Going Up the Country at the now 40 year-old festival was prognostic – at least in terms of where the Woodstock generation would be moving in the 2010s. John Cromartie and Peter Nelson’s recently released USDA report – Baby Boom Migration and Its Impact on Rural America – says that the baby boomers have already shown more affinity for moving to rural and small town destinations than older or younger cohorts. As many boomers end child-rearing duties, enter peak employment earnings and ponder retirement options they are now poised to significantly increase the population of 55-75 year olds in rural and small town America through 2020, with major social and economic implications for their chosen locations.

    Between 2010 and 2020 boomers will make more than 200 million residential moves, most being within or between metro regions, where 80 percent of this cohort now reside. However, net migration to core metro counties is projected to decline by 643,000 during the 2010s, a dramatic shift from a population gain of 979,000 during the 90s. In the countryside the population of 55-75 year olds will increase two-thirds, from 8.6 million to 14.2 million between 2000 and 2020.

    The big winners of course are those rural places with high levels of natural amenities and affordable housing that are already popular as second-home destinations. For these areas the economic future looks good as a potential influx of spending power and seasoned, footloose talent boosts development prospects.

  • Report: Florida Losing Population

    This should be filed with other improbable stories under the subject “beach running out of sand.” The St. Petersburg Times reports that Florida has lost population for the first time since 1946. University of Florida demographers are due to release a report that the state lost 50,000 residents in the year ended April of 2009. This is in stark contrast with the state’s addition of more than 300,000 residents in every year of the decade through 2006

    The article cites housing price increases as driving out families with children and the resulting housing contraction with driving out construction workers. Florida’s housing bubble related price increases were perhaps the highest in the nation, following California.

    There had already been ominous signs, with the United States Bureau of the Census reporting net outward domestic migration in 2008. As late as 2005, there had been a net gain in domestic migration of 267,000.

  • Is the Stage Set for Another Housing Bubble?

    Both the world and the nation remain in the midst of the greatest economic downturn since the Great Depression. But with all the talk of “green shoots” and a recovery housing market, we may in fact be about to witness another devastating bubble.

    As we well know, the Great Recession was set off the by the bursting of the housing bubble in the United States. The results have been devastating. The value of the US housing stock has fallen 9 quarters in a row, which compares to the previous modern record of one (Note). This decline has been a driving force in a 25 percent or a $145,000 average decline (inflation adjusted) in net worth per household in less than two years (Figure 1). The Great Recession has fallen particularly hard on middle-income households, through the erosion of both house prices and pension fund values.

    This is no surprise. The International Monetary Fund has noted that deeper economic downturns occur when they are accompanied by a housing bust. This reality is not going to change quickly.

    How did the supposedly plugged-in economists and traders in the international economic community fail to recognize the housing bubble or its danger to the world economy? It is this failure that led Queen Elizabeth II to ask the London School of Economics (LSE) “why did noboby notice it?”. Eight long months later, the answer came in the form of a letter signed by Tim Besley, a member of the Monetary Policy Committee of the Bank of England (the central bank of the United Kingdom) and Professor Peter Hennessey on behalf of the British Academy.

    The letter indicated that some had noticed what was going on,

    But against those who warned, most were convinced that banks knew what they were doing. They believed that the financial wizards had found new and clever ways of managing risks. Indeed, some claimed to have so dispersed them through an array of novel financial instruments that they had virtually removed them. It is difficult to recall a greater example of wishful thinking combined with hubris.

    The letter concluded noting that the British Academy was hosting seminars to examine the “Never Again” question.

    Among those that noticed were the Bank of International Settlements (the central bank of central banks) in Basle, which raised the potential of an international financial crisis to be set off by a bursting of the US housing bubble. Others, like Alan Greenspan, noticed, telling a Congressional Committee that “there was some froth” in local markets. Others, across the political spectrum, like Nobel Laureate Paul Krugman, Thomas Sowell and former Reserve Bank of New Zealand Governor Donald Brash both noticed and understood.

    Missing the Housing Market Fundamentals: The housing market fundamentals were clear. With more liberal credit, the demand for owned housing increased markedly, virtually everywhere. In all markets of the United Kingdom and Australia, house prices rose so much that the historic relationship with household incomes was shattered. The same was true in some US markets, but not others (Figure 2).

    On average, major housing markets in the United Kingdom experienced median house prices that increased the equivalent of three years of median household income in just 10 years (to 2007). The increases were pervasive; no major market experienced increases less than 2.5 years of income, while in the London area, prices rose by 4 years of household income. In Australia, house prices increased the equivalent of 3.3 years of income. Like the UK, the increases were pervasive. All major markets had increases more than double household incomes.

    Based upon national averages, the inflating bubble appears to have been similar, though a bit more muted in the United States, with an average house price increase equal to 1.5 years of household income. But the United States was a two-speed market, one-half of which experienced significant house price increases and the other half which did not. In the price escalating half, house prices increased an average of 2.4 times incomes. The largest increases occurred in Los Angeles, San Francisco and San Diego, where house prices rose the equivalent of 5 years income. In the other half of the market, house prices remained within or near historic norms relative to incomes. A similar contrast is evident in Canadian markets. In some, house prices reached stratospheric and unprecedented highs, while in others, historic norms were maintained.

    Underlying Demand: Greater Where Prices Rose Less: The difference between the two halves of the market was not underlying demand. Overall, the half of the markets with more stable house prices indicated higher underlying demand than the half with greater price escalation. Overall, the housing markets with higher cost escalation lost more than 2.5 million domestic migrants from 2000 to 2007, while the more stable markets gained more than 1,000,000 (Calculated from US Bureau of the Census data).

    The Difference: Land Use Regulation: The primary reason for the differing house price increases in US markets was land use regulation, points that have been made by Krugman and Sowell. This is consistent with a policy analysis by the Dallas Federal Reserve Bank, which indicated that the higher demand from more liberal credit could either manifest itself either in house price increases or in construction of new housing. Virtually all of the markets with the largest housing bubbles had more restrictive land use regulation.

    These regulations, such as urban growth boundaries, building moratoria and other measures that ration land and raise its price collaborated to make it impossible for such markets to accommodate the increased demand without experiencing huge price increases (these strategies are often referred to as “smart growth”). In the other markets, less restrictive land use regulations allowed building new housing on competitively priced land and kept house prices under control. The resulting price distortions leads to greater speculation, as has been shown by economists Edward Glaeser and Joseph Gyourko.

    A Wheel Disengaged from the Rudder: The normal policy response of interest rate revisions had little potential impact on the price escalating half of the housing market, because of the impact of restrictive state, metropolitan and local housing regulations. These regulations materially prohibited building on perfectly suitable land and thus drove the price up on land where building was permitted. So, while Greenspan and the Fed saw the “froth” in local markets, they missed its cause. The British Academy letter to the Queen is similarly near-sighted. Restrictive land use regulation has left central bankers in a position like a ship’s captain trying to steer a massive vessel with a wheel that is no longer connected to the rudder

    The Bubble Bursts: When teaser mortgage rates expired and other interest rates reset, a flood of foreclosures occurred, which led to house price declines that negated much of the housing bubble price increases in the United States. The most significant of these took place in restrictive markets, especially in California and Florida. By September of 2008, the average house had lost nearly $100,000 of its value in the more restrictively regulated half of the market, and averaged $175,000 in these “ground zero” markets. These losses were unprecedented and far beyond the ability of mortgage holders to sustain. This led to “Meltdown Monday,” when Lehman Brothers collapsed and the Great Recession ensued.

    By comparison, the losses in the more stable half of the market were modest, averaging approximately one-tenth that of the price escalating half.

    Can We Avoid Another Bubble? The experience of the Great Recession underscores the importance of having a Fed and other central banks that not only pay attention, but also understand. This requires “getting their hands dirty” by looking beyond macro-economic aggregates and national averages.

    This does not require an increasing of authority of the Federal Reserve or other central banks. As Donald L. Luskin suggested in The Wall Street Journal, we “don’t want the Fed controlling asset prices.” All we really need is for the Fed and other central banks to notice and understand what is going on, not only in housing, but in other markets as well.

    A public that depends upon central banks to minimize the effect of downturns deserves institutions that are not only paying attention, but also understand what is driving the market. The Fed should use its bully pulpit, both privately and publicly, to warn state and local governments of the peril to which their regulatory policies imperil the economy.

    There are strong indications that future housing bubbles could be in the offing. Not more than a year ago, the state of California enacted even stronger land use legislation (Senate Bill 375), which can only heighten the potential for another California-led housing bust in the years to come, while reducing housing affordability in the short run. There is a strong push by interest groups in Washington to go even further (see the Moving Cooler report), making it nearly impossible for housing to be built on most urban fringe land. This is a prescription for another bubble, this time one that would include the entire country, not just parts of it.


    Note: Quarterly data has been available since 1952 from the Federal Reserve Board Flow of Funds accounts


    Wendell Cox is a Visiting Professor, Conservatoire National des Arts et Metiers, Paris. He was born in Los Angeles and was appointed to three terms on the Los Angeles County Transportation Commission by Mayor Tom Bradley. He is the author of “War on the Dream: How Anti-Sprawl Policy Threatens the Quality of Life.

  • Immigrants Are ‘Greening’ our Cities, How About Giving them a Break?

    Debate about immigration and the more than 38 million foreign born residents who have arrived since 1980 has become something of a national pastime. Although the positive impact of this population on the economy has been questioned in many quarters, self-employment and new labor growth statistics illustrate the increasingly important role immigrants play in our national economy.

    There has also been an intense debate within the environmental community about the impact of immigrants. Yet there has been relatively little research done about how immigrants get to work and where most immigrants live. As the ‘green’ movement in the U.S. has increasingly pushed for higher-density housing and transit-oriented development in order to improve public transportation (specifically rail), few have considered how immigrants use transit and what might be the best way to accommodate their needs. In fact, all too often, “green” policies advocate transit choices – favoring such things as light rail over buses – that may work against the interests of immigrant transit riders.

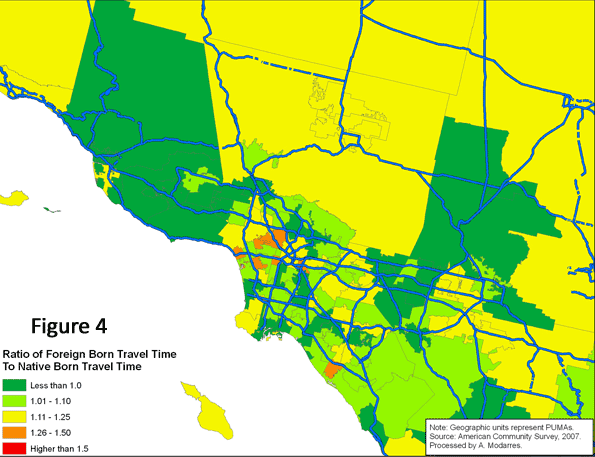
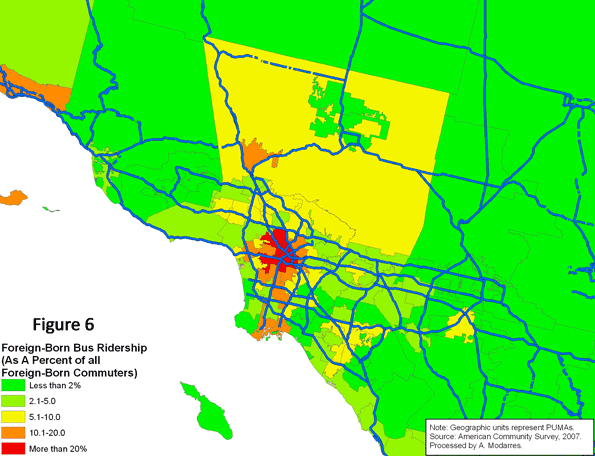
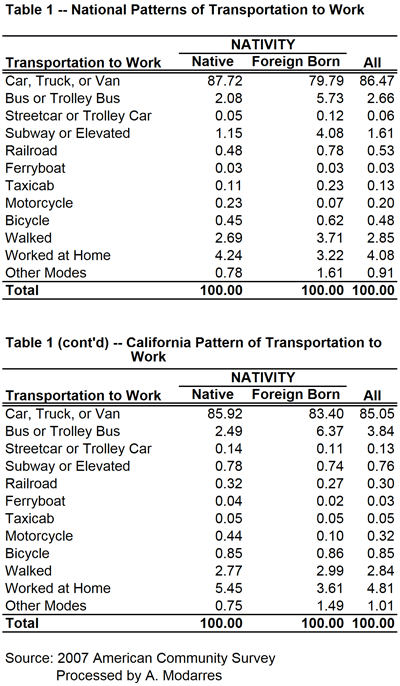
    Based on the 2007 American Community Survey, 117.3 million native-born and 21.9 million foreign-born individuals commuted to work. As Table (1) illustrates, a higher percentage of immigrants rode buses (5.7% vs. 2.1%) and subways (4.1% vs. 1.2%) and many walked to work (3.7% vs. 2.7%). A much smaller percentage drove to work (79.8% vs. 87.7%). Unfortunately, despite their higher usage of alternate means of transportation to work, or perhaps because of it, the commute to work time was on average longer for the foreign-born commuters than their native-born counterparts (28.8 minutes versus 24.7).

    Clearly in terms of using public transportation, immigrants are a bit greener than those born here. But why? Is this habit formed elsewhere? In that case, are recent immigrants even more likely to use public transportation than those who immigrated earlier? Or is it their income that affects their transportation choices?

    Table (2) provides the answer to the first question. Recent arrivals are clearly less likely to drive to work and have a higher propensity toward using public transportation, compared to all foreign-born individuals (and significantly more than the native-born). Additionally, over 6% of the immigrants who have arrived since 2000 walk to work.

    Overall, more than a quarter of the immigrants who have arrived since 2000 use an alternative mode of transportation to work. If the rest of America could do the same, we’d be a bit ‘greener’ already. However, it seems that as immigrants stay longer, they eventually tend to use cars more often because automobile usage allows for access to better jobs, better shops, and better schools. For example, immigrants who arrived in the U.S. in the 1970s (which means they have been here over three decades) drive a bit more and use public transportation less.

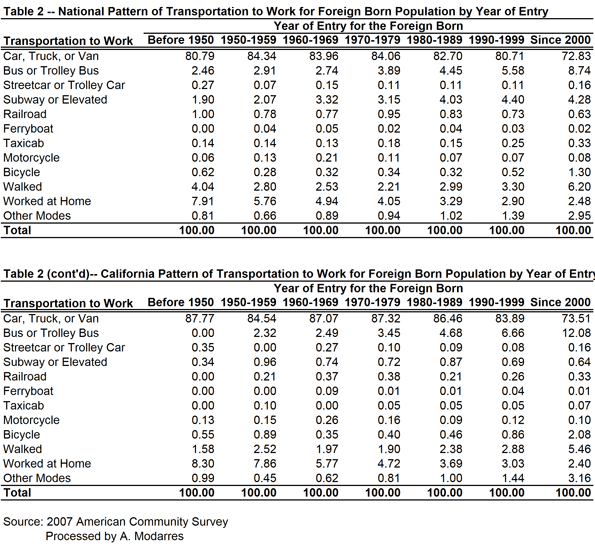
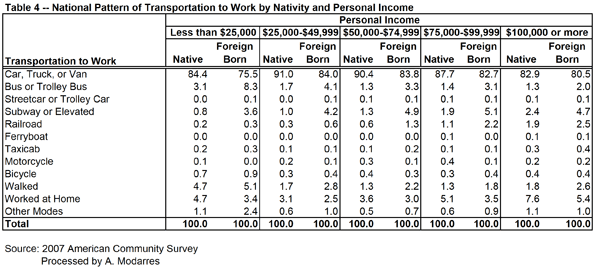
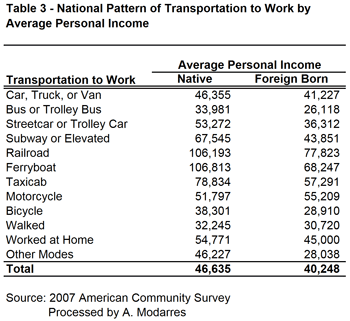
    Even so, their rates are still slightly better than the native-born (compare Tables 1 and 2). This may be in part because of their lower incomes (see Table 3) yet at every level of income they are still more likely to take transit. Table (4) illustrates this point by grouping commuters into income categories and their nativity. In every income category, immigrants use their cars less and are more likely to use public transportation, even though their car ridership increases with income.

    The message from these statistics is loud and clear. Immigrants are more likely to ride public transportation than those born in the U.S., regardless of their income. The ones arriving more recently are even more likely to do so. Overall, this suggests that familiarity with public transportation, combined with the effects of income and place of residence, has made the immigrants’ lives in the U.S. a bit ‘greener’ than those of the native-born. In fact, one factor that may contribute to their higher usage of public transportation stems from their living in neighborhoods whose densities are, on average, 2.5 times higher than those of the native-born. Immigrants, in essence, are doing precisely what planners want the rest of us to do.

    Moving to Southern California

    Southern California still stands as the icon of immigration and multiculturalism and is home to a large number of immigrants in the urban region that extends from eastern Ventura County to the southern tip of Orange County and the Inland Empire. As Figure (1) illustrates, in a number of neighborhoods in Southern California, the foreign-born population outnumbers the native-born by large margins. For example, in areas west and south of downtown Los Angeles, immigrants are more than three times as numerous as the native-born.

    A comparison of Figures (2) and (3) suggests a wide geographic difference between the native-born and the foreign-born and how long it takes them to get to work. The foreign-born population experiences much longer commutes in highly urbanized areas around downtown Los Angeles and the San Gabriel Valley. Conversely, in the more rural areas, such as northern Ventura County, the foreign-born population experiences shorter commutes compared to their native-born counterparts.

    Figure (4) provides a clear comparison of average travel time to work for both populations (visually comparing Figures 2 and 3). In all areas appearing in the darkest shade of green, the foreign-born population experienced shorter commutes compared to the native-born. These shorter commutes, however rarely occur in high density areas (compare with Figure 5). Conversely, in areas such as Santa Monica, the Wilshire corridor, East Los Angeles, and southern sections of downtown Los Angeles, the foreign-born population experiences much longer commutes than the native-born.


    Statistically speaking, there is a positive relationship between average travel time and density – i.e., the higher the density, the higher the reported average travel time. For the foreign-born population who live in higher density areas, this means much longer commutes, a problem caused by a number of factors, including their dependency on slower public transportation systems and the long distances they have to travel to reach job centers outside the city center.

    Figure (6) illustrates the geographic pattern of bus ridership among the foreign-born commuters. As with national patterns, immigrants in Southern California are more likely to settle in high density areas and use public transportation to work, but unfortunately, they also suffer much longer commutes.

    What should the policy responses be? One may be to promote increased car ownership among immigrants and low-income populations in the U.S. This may be objectionable to some environmentalists and planners, but it’s clear that those people who live by the principles of higher density and public transportation use are not rewarded and indeed suffer longer commutes.

    An even more relevant question is why advocates for public transportation focus disproportionately on rail, when buses are so frequently used by low income populations, including immigrants. In California, these riders outnumber the native-born on buses. The situation is reversed on rail and subways. An intelligent policy response to public transportation planning would suggest that buses should receive much more attention. Major metropolitan areas have become polycentric in their employment patterns, and most major employment centers are located at long distances from the central city. Specially-designed buses for reverse commutes could help alleviate transportation problems while helping working immigrants reach their destinations more quickly.

    This challenges the priorities of some public transport advocates, who tend to focus on very expensive rail projects designed primarily to draw more middle class, largely native-born riders who commute to places like downtown Los Angeles. Meanwhile those ‘new’ Americans who already live by a number of ‘green’ standards suffer from the misallocation of transit resources. Those who are already doing what we hope the middle class will do deserve better.

    Ali Modarres is an urban geographer in Los Angeles and co-author of City and Environment.