Category: Demographics

  • The Immigration Dilemma

    In often needlessly harsh ways, President Donald Trump is forcing Americans to face issues that have been festering for decades, but effectively swept under the rug by the ruling party duopoly. Nowhere is this more evident than with immigration, an issue that helped to spark Trump’s quixotic, but ultimately successful, campaign.

    Many Americans are clearly upset about an estimated 11 million undocumented immigrants, and many also fear the arrival of more refugees from Islamic countries. Perhaps no issue identified by Trump has been more divisive.

    Not surprisingly, Trump’s rhetoric has stirred bitter anger among the country’s polite establishment, right and left, as well as the progressive grievance industry. His call for a massive border wall has not only offended our neighbor, Mexico, but also created legitimate concern in Latino communities of massive raids. According to a 2012 study for the National Institutes for Health, the undocumented account for roughly one in five Mexicans and up to half of those from Central American countries.

    The weakness of the open borders position

    Anti-immigrant sentiment has a long, if somewhat nasty, history in America. It usually follows periods of great immigration, and ethnic change, as occurred in the mid-19th century and early 20th century, when immigration policies were dramatically tightened.

    Today, economics dictates some change of direction. In a country where wages for the poorest have been dropping for decades, the notion of allowing large numbers of similarly situated people into the country seems to be more a burden than a balm. In California, among noncitizens, three in five are barely able to make ends meet, according to a recent United Way study.

    In California, Gov. Jerry Brown has famously laid out a “Welcome” sign to both Mexican illegal and legal immigrants coming to the state. Many progressives consider concerns with nationality and cultural integration as vile attempts to have them “Anglo-Saxonized.” The open borders ideology has reached its apotheosis in “sanctuary” cities which extend legal protection from deportation even to criminal aliens who have committed felonies.

    Trump’s over-the-top response

    Politically, the open borders rhetoric helps Trump. Even in California, three-quarters of the population, according to a recent UC Berkeley survey, oppose sanctuary cities. Overall, more Americans favor less immigration than more. Most, according to a recent Pew Research Center study, also want tougher border controls and increased deportations. They also want newcomers to come legally and adopt the prevailing cultural norms, including English.

    But in his rants on immigration, Trump may be going too far. Only a minority favor Trump’s famous wall, and the vast majority, including Republicans, oppose massive deportations of undocumented individuals with no criminal record. Limiting Muslim immigration does better, but appeals to only roughly half of Americans.

    Trump’s restrictionist choice for attorney general, Sen. Jeff Sessions, is also on record opposing more legal immigration. This could prove ruinous to the country’s long-term future. Like most high-income countries, the United States’ fertility rate is below that needed to replace the current generation. If the U.S. cuts off its flow of immigrants too dramatically, we will soon face the labor shortages, collapse of consumer demand and drops in innovation already seen in the European Union and much of East Asia.

    An overly broad cutback in immigration would also deprive the country of the labor of millions of hard-working people, many of whom do difficult jobs few native-born Americans would do. The foreign-born, notes the Kaufmann Foundation, are also twice as likely to start a business as the native-born.

    Read the entire piece at The Orange County Register.

    Joel Kotkin is executive editor of NewGeography.com. He is the Roger Hobbs Distinguished Fellow in Urban Studies at Chapman University and executive director of the Houston-based Center for Opportunity Urbanism. His newest book, The Human City: Urbanism for the rest of us, was published in April by Agate. He is also author of The New Class ConflictThe City: A Global History, and The Next Hundred Million: America in 2050. He lives in Orange County, CA.

    Photo: JamesReyes [Public domain], via Wikimedia Commons

  • The Brooklynization of Brooklyn

    The New Brooklyn: What It Takes to Bring a City Back
    by Kay Hymowitz

    My City Journal colleague Kay Hymowitz has written a number of great articles on Brooklyn, the borough that is her home. This inspired her to write a great book on the topic of the transformation of Brooklyn called The New Brooklyn.

    It starts with a two-chapter history of the borough from its earliest settlement to the present day, followed by a series of chapters looking at Brooklyn today. This includes the transformation of Park Slope (where she and her husband moved in the early 1980s), Williamsburg, Bed-Stuy, and the Navy Yard.

    But she recognizes that Brooklyn is not all hipster gentrifiers. It is still a borough of immigrants and still too often poverty. A quarter of Brooklyn’s residents are below the poverty line. So she also presents case studies of this other face of the new Brooklyn, including the looking at the Chinese of Sunset Park, the West Indians of Canarsie and the African-Americans of Brownsville.

    There’s a lot of great details in here. For example, that there were once slaves in Brooklyn:

    It’s worth lingering over this jarring fact: when you walk past the fine townhomes and churches of Brooklyn Heights, eat at a pizza joint in Bensonhurst, or wander through the art galleries of Bushwick, you are traversing land once tilled by African slaves – and a substantial number of them, given the small size of the white population.

    Also how NYCHA income limit rules helped segregate public housing that had formerly been at least partially integrated.

    NYCHA residents were required to move out once their income surpassed a certain ceiling. That made sense; public housing was supposed to be for those who couldn’t afford to live in private developments. The problem was that most of those who reached the income ceiling were white. Antipoverty advocates argued that it was only fair to give preference to the most disadvantaged on waiting lists. Perhaps; but as a result, upwardly mobile whites were replaced by poor black refugees both from the South and the cleared slums of other parts of New York.

    There are also some passages that would give Richard Florida the tingles:

    The postindustrial crowd settling in Park Slop had a somewhat different profile from their educated suburban cousins, a profile that continues to dominate gentrified neighborhoods everywhere. They were an artsy-literary bunch; today, we would call them the “creative class”…Whatever the reasons, the original gentrifiers were in conscious retreat from suburban conformity. Though gentrifier tastes have veered back towards mid-century modern, the Tiffany lamps, stained glass and Victorian antiques that the pioneers collected were a far cry from the harvest-gold kitchen appliances and plastic chairs and dishes favored by suburbanites.

    A few of the essays were previously published in City Journal, but the majority of the book is new. The writing is very accessible and not academic. The New Brooklyn provides not just a highly readable look at the current conditions in Brooklyn, but a sense of how we got to where we are. As someone who lacks in-depth knowledge of Brooklyn, I found it very informative.

    You can also listen to Kay talk about her book in a recent episode of the City Journal podcast.

    Aaron M. Renn is a senior fellow at the Manhattan Institute, a contributing editor of City Journal, and an economic development columnist for Governing magazine. He focuses on ways to help America’s cities thrive in an ever more complex, competitive, globalized, and diverse twenty-first century. During Renn’s 15-year career in management and technology consulting, he was a partner at Accenture and held several technology strategy roles and directed multimillion-dollar global technology implementations. He has contributed to The Guardian, Forbes.com, and numerous other publications. Renn holds a B.S. from Indiana University, where he coauthored an early social-networking platform in 1991.

  • Kevin Starr, chronicler of the California dream

    “From the Beginning, California promised much. While yet barely a name on the map, it entered American awareness as a symbol of renewal. It was a final frontier: of geography and of expectation.”

    — Kevin Starr, “Americans and the California Dream, 1850-1915” (1973)

    In a way, now rare and almost archaic, Kevin Starr, who died last week at age 76, believed in the possibilities of California, not just as an economy or a center for innovation, but also as precursor of a new way of life. His life’s work focused on the broadest view of our state — not just the literary lions and industrial moguls but also the farmworkers, the plain “folks” from the Midwest, the grasping suburbanites who did so much to shape and define the state.

    His California was not just movie stars, tech moguls, radical academics, talentless celebrities and equally woeful party hacks who dominate the upper echelons. A native San Franciscan, who grew up in a contentious working-class Irish family and never forgot his roots, Kevin’s California was centered on providing, as he said in a recent interview with Boom California magazine, “a better life for ordinary people.” The diverging fortunes of our people — with many in semi-permanent poverty while others enjoy unprecedented bounty — disturbed him profoundly, and, in his last years, darkened his perspective on the state.

    Over recent years, Kevin was increasingly distraught by what he saw as “the growing divide between the very wealthy and the very poor, as well as the waning of the middle class” that now so characterizes the state. He saw San Francisco changing from the diverse city of his youth, made up of largely ethnic neighborhoods, to a hipster monoculture. With typical humor, he labeled his hometown as essentially “a Disneyland for restaurants,” a playground with little place for raising middle-class families. California has, indeed, changed over the decades, but not always in a good way.

    Kevin Starr’s California

    Kevin Starr represented another, more congenial California, one where people could still disagree on issues, but work for common goods. He was, as his wife Sheila told the New York Times, largely a man of the 1950s, a creature of consensus seekers. He served as state librarian under governors Pete Wilson, Gray Davis and Arnold Schwarzenegger. A conservative-leaning centrist Democrat, he did not fit comfortably in a state that has drifted from a vibrant two-party culture to a dominant progressive monoculture with little more than a Republican rump.

    In today’s hyperpartisan environment, the Golden State must either be a dystopia (the conservative view) or an emerging paradise on earth (the common progressive mantra). Starr, as a fair-minded historian, saw both realities — not only today but through time. In his multipart “California Dream” series, Starr both confronted reaction against ethnic change and celebrated the process of integration, whether for Latinos, Asians or Anglo Okies, whose unique presence, outside of their descendants, is all but lost in contemporary California.

    But what most separated Kevin’s view of California from many others were his humanity and empathy with the aspirations of the state’s middle- and working-class families. Many intellectuals denounce suburbs as racist and exclusionary, as well as environmentally and culturally damaging. Starr saw in them something else — what author D.J. Waldie has described as “Holy Land” — in places like Lakewood, the Bay Area suburbs and Orange County. To him, these were not only places of opportunity, but also landscapes of a reborn “more intimate America,” home to an expanding middle class.

    Read the entire piece at The Orange County Register.

    Joel Kotkin is executive editor of NewGeography.com. He is the Roger Hobbs Distinguished Fellow in Urban Studies at Chapman University and executive director of the Houston-based Center for Opportunity Urbanism. His newest book, The Human City: Urbanism for the rest of us, was published in April by Agate. He is also author of The New Class ConflictThe City: A Global History, and The Next Hundred Million: America in 2050. He lives in Orange County, CA.

    Photo: Institute of Museum and Libraries Service (IMLS website) [Public domain], via Wikimedia Commons

  • Them that’s got shall have. Them that’s not shall lose.

    My family lived in this building when I was a kid in the 1970’s. This was the door to our old apartment. It’s in a nondescript part of the San Fernando Valley in Los Angeles. There are a million places just like this all over the Southland. These beige stucco boxes are the workhorses of semi-affordable market rate housing in California. The place hasn’t changed in forty years other than the on-going deferred maintenance.

    I walked around the block to see the buildings where my friends used to live and the shops where we bought groceries and such. I can’t say I felt nostalgia. These weren’t happy times. But I was aware of the fact that the people who live here now are the same as my family was then – basically good people who are scraping by with almost no money doing the best they can with what they have. These are the minimum wage workers who do all the invisible dirty work of the city. Real incomes for these folks haven’t changed since I was a kid. But the cost of everything important from owning a home to health care to a proper education has skyrocketed.

    I want to go back to my last post about the exclusive homes in the fringe suburbs. The people who can afford to live here do so in large part so they can distance themselves from the people in my old neighborhood. Fair enough. I completely understand. I don’t want to live in my old neighborhood again either.

    But there’s that lingering problem of public infrastructure vs. the tax base of various forms of development. The city has spent almost nothing on my old block for decades. Yet those sad buildings keep spinning off revenue year after year. And there are a lot of them. Collectively they generate enough excess cash that the authorities can siphon it off to fund other activities. When it comes time to allocate resources who do you think has the most likely chance of getting what they need? The people who live in my old apartment, or the folks who live in the $700,000 homes up on the hill?

    As a society we want to believe that the poor are draining the public coffers dry. We need to blame the lower end of the working class for whatever we don’t like about the country. We want it to be true that they are undeserving compared to the better people who begrudgingly support them from a distance. Welfare. Food stamps. Section 8. But the reality – if you look at the budget and the actual numbers – is that without the poor packed tightly in their crappy apartments all working for crumbs in underfunded sections of town there could be no exclusive enclaves.

    Billie Holiday said it best. Them that’s got shall have. Them that’s not shall lose.

    John Sanphillippo lives in San Francisco and blogs about urbanism, adaptation, and resilience at granolashotgun.com. He’s a member of the Congress for New Urbanism, films videos for faircompanies.com, and is a regular contributor to Strongtowns.org. He earns his living by buying, renovating, and renting undervalued properties in places that have good long term prospects. He is a graduate of Rutgers University.

    All photos by Johnny Sanphillippo

  • Globalization’s Winner-Take-All Economy

    “If you are a very talented person, you have a choice: You either go to New York or you go to Silicon Valley.”

    This statement by Peter Thiel, the PayPal founder and venture capitalist, unsurprisingly caused a stir, given that he made it in Chicago. Simon Kuper had made a similar observation in the Financial Times when he described how young Dutch up-and-comers had their sights set on London, not Amsterdam. “Many ambitious Dutch people no longer want to join the Dutch elite,” Kuper wrote. “They want to join the global elite.”

    Populist movements in Europe and the United States have fueled talk of social and economic division, of a small class of winners at the top and a far larger group of increasingly disaffected lower-skilled workers at the bottom. This attitude seems to flow through to places as well, with global city winners like London and post-industrial losers like Flint, Mich.

    Because these divides cleave along social class, educational and cultural lines, they are clear and easy to see. But there’s another — less visible — divide cutting across the seemingly monolithic group of the successful. This one separates those who are indisputably winners from those whose success is ambiguous, more qualified and more contingent. This difference is the one between the hedge fund principal, raking in wealth seemingly effortlessly, and the young adult struggling to pay urban rent despite possessing an excellent degree and professional employment. It’s the difference between New York and Cincinnati — or even Chicago.

    The same forces of globalization that  have pulled top Midwest talent into Chicago from below are also acting on the city from above, drawing its talent further up the global city hierarchy. The knowledge economy favors the college degreed over the less educated, but those with the highest and most differentiated skills are most favored, while those whose skills are second tier — less perfectly in tune with the emerging economy — are more vulnerable to competitive pressures.

    It’s easy to see that the Flints of this world have struggled. Less visible are the stresses put on second-tier cities — the Chicagos and Cincinnatis — from a system that is disproportionately giving the greatest rewards to those at the very top of the hierarchy while threatening even the seemingly successful cities with being left behind.

    Economist Richard Florida calls this phenomenon “winner-take-all urbanism.” It’s the superstar athlete or celebrity effect transposed into the urban world. Just as A-list stars earn far more than the merely famous, the top business talent and the top cities are reaping disproportionate riches over the merely prosperous.

    This divide is harder to spot because the people and places involved are often superficially similar. The people in both possess university degrees. They share similar cultural norms, aspirations and politics. The places they live in all have their farm-to-table restaurants, tech startups, artisanal coffee roasters and bicycle commuter infrastructure. As with a sports team, they all wear the same uniform. But some are all-stars while others are role players who are more easily replaced.

    When young workers or artists struggle to find an affordable apartment in a global capital, this isn’t just proof of a failure to deregulate housing development. It’s also a marketplace sending a powerful signal that their position among the winners of society is much more precarious than they might imagine. Most would agree that there are some businesses and people who shouldn’t be in New York or San Francisco. We shouldn’t expect a peanut butter spread of talent and economic activity across the country. The nature of the industries concentrated in these places produces a higher-end specialization. So there will be some economic value line below which it isn’t viable to be there.

    There’s an argument to be made that building more housing to reduce rents can draw the line lower. But that still presumes a line. When aspirational millennials — or even older people like me — can’t afford the current rent, that’s a signal that they are near or below that line. In a time in which rewards seem to be skewed to the top, that should be worrisome to them personally, not just to the poor or working classes.

    Similarly, cities that remain a notch below the top tier should be worried. Chicago’s financial crisis, population loss, violent crime spike and other problems suggest fundamental structural challenges facing the city. And if even Chicago is not fully achieving the global-city status it craves, shouldn’t other cities be worried?

    Yet the leaders of these cities, and the ambiguously successful people who live in them, have tended to identify themselves as among the winners. They haven’t really grappled with the fact that the global economy puts them at risk. It’s not just people in Flint or Youngstown, Ohio, who are being buffeted by globalization. If these people and cities ever came to view themselves as at risk, they could become a powerful voice for reforming the system to be more equitable while retaining its fundamentally open character. They are the exact potential champions for change in a system that badly needs it so that we can broaden the pool of success.

    Unfortunately, those among the ranks of the second-tier successful have instead sided with the global capitals and the global elite to defend the economic status quo, leaving the reform fight to the populists who prefer an overly closed system. They may yet discover to their chagrin that the very system they so vigorously supported will ultimately become their own undoing.

    This piece originally appeared in Governing Magazine.

    Aaron M. Renn is a senior fellow at the Manhattan Institute, a contributing editor of City Journal, and an economic development columnist for Governing magazine. He focuses on ways to help America’s cities thrive in an ever more complex, competitive, globalized, and diverse twenty-first century. During Renn’s 15-year career in management and technology consulting, he was a partner at Accenture and held several technology strategy roles and directed multimillion-dollar global technology implementations. He has contributed to The Guardian, Forbes.com, and numerous other publications. Renn holds a B.S. from Indiana University, where he coauthored an early social-networking platform in 1991.

    Photo: Kevin D. Hartnell (Own work) [CC BY-SA 3.0 or GFDL], via Wikimedia Commons

  • The Demographics of Poverty in Santa Clara County

    Tucked away in the bottom corner of the San Francisco Bay, tech royalty make themselves at home in their silicon castles. Santa Clara County is the wealthiest county in California, and 14th in the nation, boasting an average median household income of $96,310. However, where there are kings, there must be subjects. Despite its affluence, Santa Clara remains one of the most unequal counties in the United States. The combined forces of enormous wage gaps, exorbitant housing prices, and shifts in the regional economy have compounded over recent years, resulting in a shrunken middle class and increased poverty levels.

    Santa Clara County contains just over 1.9 million people and is home to much of the Silicon Valley. The relatively recent explosion of growth in the high-wage technology industry has generated a new rank of upper-middle class to fabulously wealthy individuals. But, even in the economic miracle that is Silicon Valley, poverty remains a prevalent force and affects a disturbing number of lives in the region. Although, according to the Census Bureau, only 8.3% of Santa Clara County residents live at or below the Federal Poverty Level (FPL), this number drastically underestimates the true number of people that are experiencing financial hardship in the region. In a study conducted by United Way, it was found that the real cost budget for a family of four residing in Santa Clara County stands at $65,380 per year, or 281% of the FPL.

    High regional housing costs account for much of the discrepancy in poverty levels between the county and the nation. A study out of the California Budget and Policy Center calculated that the poverty rate in Santa Clara County soars to 18% when factoring in housing costs, meaning nearly one in five residents live in poverty.

    It is for this reason that the region has one of the largest homelessness populations in the nation, with around 7,600 homeless individuals residing within Santa Clara County. When local homeless individuals were surveyed regarding obstacles to securing housing, the top four answers were as follows: No job/income, no money for moving costs, bad credit, and lack of available housing. Of course, poverty is cyclical, and these answers affect one another to some extent: a lack of income means no money for moving costs, which may lead to bad credit and which could then lead to an inability to secure permanent housing. Around 56% of survey respondents also reported being homeless for over a year, up significantly from 47% just two years prior, indicating that the homeless in Santa Clara County continue to face significant obstacles to securing housing. High homelessness rates are symptoms of a greater trend: the fact that gross income inequalities in Santa Clara County have created a society of have’s and have not’s, separated by an income gap that shows no sign of closing.

    Housing Trends

    The most significant impediment to financial security in the county is the volatile housing market and the exorbitant cost of owning a home. According to a report conducted by the U.S. Department of Housing and Urban Development on the South Bay Area, the average price of houses sold in 2014 stood at $788,500 for an existing home and $828,000 for a new home. This is over four times the median value of homes nationally, which stands at $178,600. The disparity is even more prevalent in the areas of the region closer to large technology firms, such as Palo Alto, where the average home costs $2.43 million. San Jose also has the 7th largest share of renters in major U.S. cities, 56 percent, a rate that only continues to increase as housing costs do the same. The median gross rent in Santa Clara County stands at $1705 per month, nearly double the national average.

    Current trends indicate that the increasing housing costs show no signs of reversing, which does not bode well for residents that are already struggling financially. A study from the California Budget and Policy Center found that, in 2013, over 50% of households classified as low-income were at risk of moving out of the area due to increased housing costs.

    Net domestic migration in Santa Clara County is overwhelmingly negative.

    The result of high housing costs? Net domestic migration has been negative every year since 1996, except 2011, and appears to be dipping further, despite the fact that the population of Silicon Valley has grown continually in recent years. This can be attributed to a combination of natural births and massive foreign immigration rather than domestic migration. Therefore, negative net domestic migration suggests that a large portion of residents are leaving the area due to a lack of an income that cannot keep up with rising costs of living.

    However, for those who stay, high housing prices lead to a plethora of other disadvantages, creating a cycle of poverty that decreases social mobility in the region. A search for cheaper housing has led many to seek living arrangements in the southern and eastern parts of San Jose, where housing is cheaper, but comes at the cost of higher crime rates and worse school districts. Additionally, job growth has been concentrated in the western parts of the county. The search for cheap housing has led to an increase in overcrowded households, as residents move in with one another in order to share the costs of rent. The Santa Clara County Department of Public Health concluded in 2014 that 14% of residents were living in overcrowded households, with 5% living in severely overcrowded households. Latinos in the region are disproportionately affected, with 31% living in overcrowded households and 12% living in severely overcrowded households.

    The combination of these factors limits social mobility by undermining each individual’s access to economic opportunity. Moving into an overcrowded house in an underfunded public school district limits potential to obtain a quality education that may provide access to high-skilled, high-wage jobs.

    The Income Gap

    Inequality in the region is perpetuated by a growing income gap, and the ardent hunt for afford-able housing may be explained by the gross income disparities among residents. As housing prices have skyrocketed over recent years, incomes simply have not kept up with costs of living, particularly at the lower end of the spectrum.

    Santa Clara County’s income gap has widened considerably since 1989.

    Economic gains in the region have flowed overwhelmingly to the top quintile of income-earners, who have seen their wages increase by over 25% over the past 25 years. In a shocking comparison, income levels have declined for low-income households since 1989, a clear sign of a widening wealth gap in the region. Those at the bottom also find themselves working harder for less money: the average income for those living above the previously described real cost of living in Santa Clara County stands around $27 per hour, whereas the average income for those living below the real cost of living comes in at a bit over $10, around the current California minimum wage.

    To make matters worse, government efforts have proven relatively ineffective in remedying regional inequality. A recent study has shown that even when a family is a recipient of CalWORKS and CalFresh benefits, government-funded initiatives to provide benefits to needy families, an average family of four is still tens of thousands of dollars away from comfortably subsisting in Santa Clara County. Additionally, government benefits are not reaching populations that would benefit from them the most: a United Way study found that less than 19% of single mothers and less than 5% of immigrants statewide subscribe to these programs.

    Shifts in the Regional Economy

    Efforts to increase wages of low-paying jobs may alleviate financial hardship to a certain degree, but these actions fail to consider an underlying trend in Santa Clara County: low-skilled, blue collar jobs are disappearing. Wage increases in industries heavily populated by lower income earners matter little if those jobs do not exist. Historically, Santa Clara County was a manufacturing hub, famous for producing semi-conductors along with other components vital to the burgeoning technology industry. However, recent years have seen manufacturing jobs leaving the area in droves, either to other parts of the country or abroad.

    Sector growth in the region, percentage change, 2000-2014.

    The chart above shows that job growth in Santa Clara County has only been observed in a few sectors of the local economy. Despite this growth, total nonfarm payroll employment has decreased in the past 15 years, and the impact of this job loss may be observed across the economy. The most significant reductions of the workforce have occurred in sectors referred to as “blue-collar,” typically middle income jobs that may or may not require higher education. These types of jobs cover many of those within the goods-producing sectors, comprised here of the mining, logging, construction, and manufacturing industries.

    The rapid decline of “blue collar” jobs in the region may be attributed at least in part to the explosive growth of Silicon Valley. As the region attracts more skilled workers, increases the region’s desirability, and pays workers competitive wages capable of keeping up with costs of living, those very expenses will continue to drive upwards. As a result, workers across all economic sectors have demanded higher wages, a sentiment exemplified in the recent minimum wage hikes. Unfortunately, this drives lower-paying blue-collar industries to relocate, often out of the state, so they can lower their input costs, creating a polarized society of high-wage earners in the information sector along with low-wage earners in a service sector dedicated to the needs of the technocrats.

    Santa Clara County is a place of immense, but heavily-concentrated wealth. Multi-billion-dollar technology campuses dot the landscape like behemoths, yet the wealth and progress that accompanied the growth of the Silicon Valley has also left a significant proportion of its population behind. The environment is increasingly hostile to social mobility, the manufacturing sector has skipped town, and government efforts to mitigate the effects of these changes have proven relatively unsuccessful. Trends have shown that the region’s poor are increasingly confined to specific industries and geographies, and their freedoms restricted as they are subject to a degree of economic violence that shows no immediate signs of relenting. Significant shifts in local policy are needed to reverse the current social and economic trends and ameliorate the situation in an increasingly polarized Santa Clara County.

    Alex Thomas is currently a sophomore at Chapman University pursuing a major in Political Science. He is originally from San Jose, California, and has worked extensively within the city and surrounding areas. He hopes to further his interest in local politics through continued study and community involvement in the upcoming years.

    Photo: Coolcaesar [CC BY-SA 3.0], via Wikimedia Commons

  • The Futility of Annual Top 10 Predictions

    In every recent year, a black swan event has made top 10 lists appear quaintly naive and unimaginative. Our list is probably no better.

    This time of year, top 10 predictions are all the rage. These lists can be interesting and entertaining but how useful are they really?

    This question goes to the heart of forecasting. How futile or how useful is an attempt to forecast the economy, or technology, or world events for the next twelve months? There are three answers.

    First, not futile and somewhat useful. Projecting the trends of 2016 into 2017 is a useful exercise to identify their linear logical trajectories and end points. For example, the automation of many job functions will continue as long as robotics and artificial intelligence make progress. Or, North Korea’s ability to deliver a nuclear warhead on a long-range missile will continue to improve if unchecked.

    Second, futile and not that useful. When a desirable trend, say a decline in unemployment, is identified, policy makers will attempt to reinforce it. When an undesirable trend becomes obvious, they will work to counter it. However in both cases, the intervention can be either effective or counterproductive. It can either reinforce or roll back the trend. Human tinkering means that few trends are truly linear or logical beyond the near-term. There may be a slowdown in the spread of automation. There may be an agreement to stop North Korea’s nuclear ambitions.

    Third, neither futile nor useful but somewhat irrelevant. While forecasters are focusing their sights on the high probability of a, b and c, there are always bigger low-probability events brewing under the surface. In fact, the most important event in any given year, the one event that shakes things up and that has wide long-lasting ramifications, is usually one that few people foresaw at the beginning of that year.

         •  In 2016, Brexit and the victory of Donald Trump. A large majority of experts gave either event a low probability.

         •  In 2015, the massive refugee influx into Europe. The numbers were rising in previous years but no one saw the surge coming.

         •  In 2014, the sudden rise of ISIS after it conquered large territories in Syria and Iraq. President Obama had famously dismissed them as the JV team a few months earlier.

         •  In 2013, the Boston Marathon bombing and Edward Snowden’s revelations.

    And so on. If you look at it by decade, the most important events of the 1990s and 2000s were the collapse of the Soviet Union and the 9/11 terror attacks. Neither featured in top ten lists in any year but both had an enormous impact and repercussions that are still rippling around the world.

    So instead of a list of top 10 higher probability predictions, we should consider a list of lower probability events each of which, were it to occur, would have a very large impact on the future of politics, economics, science etc. As extensively argued by Nassim Taleb, black swan events often have a much greater impact on the future.

    Here is one attempt to compile such a list, with the caveat admission that it is only marginally better if at all than other lists and that the most important event of 2017 will likely be something else.

    Low Probability high impact events

    In no particular order:

         •  A major cyberattack that paralyzes the electric grid, payment exchanges, the stock market and/or other infrastructure. Until repaired, this would wreak havoc on daily life and the economy and would hit GDP for several quarters. It would also lead to new security measures and the attendant spending by corporations and governments.

         •  Putin removed from power. This has a low probability but it is not impossible. Referring to Putin, George Friedman recently wrote that “Russia must be led by a magician who can make small things appear large.” Through ways not always approved in the West, Putin has managed to spread Russia’s influence despite economic deterioration. But Russia has large demographic and economic challenges which could get worse after his departure.

         •  Another financial crisis starting in Europe or in emerging markets. Though regulation and oversight have increased since 2008, there was no deep overhaul of the cultural mindset at many leading financial institutions. The world is awash with credit and emerging markets are considerably weaker now than in 2008. If nothing else, moral hazard created by the bailouts means that the next crisis could be as severe as the last one, with little appetite in the public for saving the banks one more time.

         •  A joint Russia-NATO military operation against ISIS and a settlement of the Syrian war. ISIS has lost much territory in 2016 but is still effective at orchestrating terror attacks in other countries. During the campaign, Donald Trump vowed to hit them hard.

         •  A sharp economic slowdown in China. China has been a huge engine of growth for over two decades lifting its own economy and boosting commodity-based countries such as Brazil, Russia and the OPEC countries. Chinese demand also helped maintain strong demand for American and European goods at a time when growth in Western economies was sluggish or nonexistent. At the same time, China’s low-cost manufacturing and capital flows into the US lowered inflation and interest rates. A marked China slowdown could throw all of the above in reverse, lifting interest rates in the US and Europe and depressing demand for finished goods and commodities.

         •  Political turmoil in Saudi Arabia and/or Iran. Both countries have vast oil reserves and are the leading power brokers in the Middle East. Destabilization in either would have important near and long-term consequences.

         •  A coup d’état or populist revolt in an OECD country. OECD member Turkey experienced an aborted military takeover in 2016. Could it happen elsewhere? Highly improbable but not necessarily 100% out of the question, as far as black swans are concerned.

         •  The price of oil at $20 or $90 per barrel. Today oil is trading near $55 and a decline to $40 or a rise to $65 are neither here nor there in terms of their lasting impact. But a $30 to $40 rise or drop would certainly shake things up. It is not difficult to construct either scenario, improbable as it may be. For a drop, imagine China and/or the US economy weakening while production from Iran, Iraq, Libya and US shale producers surges back. For a rise, consider emerging markets recovering with a stronger India while turmoil in the Middle East threatens some production.

         •  A major terrorist attack with thousands of casualties. Unfortunately, this one will have to feature on the list every year for the foreseeable future. Though it has a low probability, its occurrence anywhere would shock and reshape the world for the several decades that follow.

         •  On the positive side, there will continue to be advances in science and medicine. Because positive developments tend to build on the previous years’ progress, they are by their nature incremental, and are therefore unlikely to generate surprise shock or awe headlines.

    These are all low probability but not zero probability events. And the impact of each would be far greater than that of any higher probability event featuring in many top 10 predictions for 2017.

    Sami Karam is the founder and editor of populyst.net and the creator of the populyst index™. populyst is about innovation, demography and society. Before populyst, he was the founder and manager of the Seven Global funds and a fund manager at leading asset managers in Boston and New York. In addition to a finance MBA from the Wharton School, he holds a Master’s in Civil Engineering from Cornell and a Bachelor of Architecture from UT Austin.

    Photo: Edvard Munch [Public domain or Public domain], via Wikimedia Commons

  • California as Alt-America

    In 1949 the historian Carey McWilliams defined California as the “the Great Exception” — a place so different from the rest of America as to seem almost a separate country. In the ensuing half-century, the Golden State became not so much exceptional but predictive of the rest of the nation: California’s approaches to public education, the environment, politics, community-building and lifestyle often became national standards, and even normative.

    Today California is returning to its outlier roots, defying many of the political trends that define most of the country. Rather than adjust to changing conditions, the state seems determined to go it alone as a bastion of progressivism. Some Californians, going farther out on a limb, have proposed separating from the rest of the country entirely; a ballot measure on that proposition has been proposed for 2018.

    This shift to outpost of modern-day progressivism has been developing for years but was markedly evident in November. As the rest of America trended to the right, electing Republicans at the congressional and local levels in impressive numbers, California has moved farther left, accounting for virtually all of the net popular vote margin for Hillary Clinton. Today the GOP is all but non-existent in the most populated parts of the state, and the legislature has a supermajority of Democrats in both houses. In many cases, including last year’s Senate race, no Republicans even got on the November ballot.

    Homage to Ecotopia

    The election of Donald Trump has expanded the widening gap. The two biggest points of contention going forward are likely to be climate change, which has come to dominate California’s policy agenda, and immigration, a critical issue to the rising Latino political class, Silicon Valley and the state’s entrenched progressive activists.

    Most of the big cities — Los Angeles, San Jose, San Francisco, Oakland and Sacramento — have proclaimed themselves “sanctuary cities,” and the state legislative leadership is now preparing a measure that would create “a wall of justice” against Trump’s agenda. If federal agents begin swooping down on any of the state’s estimated 2 million undocumented immigrants, incoming Attorney General (and former congressman) Xavier Becerra has made it among his first priorities to  “resist” any deportation orders, including paying legal fees.    

    Equally contentious will be a concerted attempt to block Trump’s overturning of President Obama’s   climate change agenda.   In recent years Gov. Jerry Brown has gone full “Moonbeam,” imposing ever more stringent environmental policies on state businesses and residents. The most recent legislation signed by Brown would boost California’s carbon reductions far beyond those agreed to by the U.S. in the Paris accord (which Trump has said he will withdraw from). All of this is being done along with a virtual banning of nuclear power, which, as the Breakthrough Institute’s Michael Shellenberger notes, remains the largest and most proven source of clean energy.

    California’s draconian climate policies have been oft-cited by Obama and environmentalists as a role model for not only America but the world. However, they will not be widely emulated in the rest of the country during the next four years. Instead, California may be opting for a kind of virtual secession, following the narrative portrayed in Ernest Callenbach’s 1975 novel, “Ecotopia,” where Northern California secedes from the union to create a more ecologically perfect state.

    Ironically, the state’s policies, which place strong controls on development, road construction, and energy production and usage, are somewhat symbolic; by dint largely of its mild climate, the state is already far more energy efficient than the rest of the country.  But to achieve its ambitious new goals,  most serious observers suggest, the state would lose at least 100,000 jobs and further boost energy prices — which  disproportionately affect the poorer residents who predominate in the state’s beleaguered, and less temperate, interior.

    The impact of these policies would be far-reaching. They have already reduced outside investment in manufacturing to minuscule levels and could cost California households an average of $3,000 annually. Such economic realities no longer influence many California policymakers but they could prove a boon  to other   states, notably Texas, Arizona and Nevada, which make a sport of hunting down California employers.   

    A ‘Light Unto the Nations’?

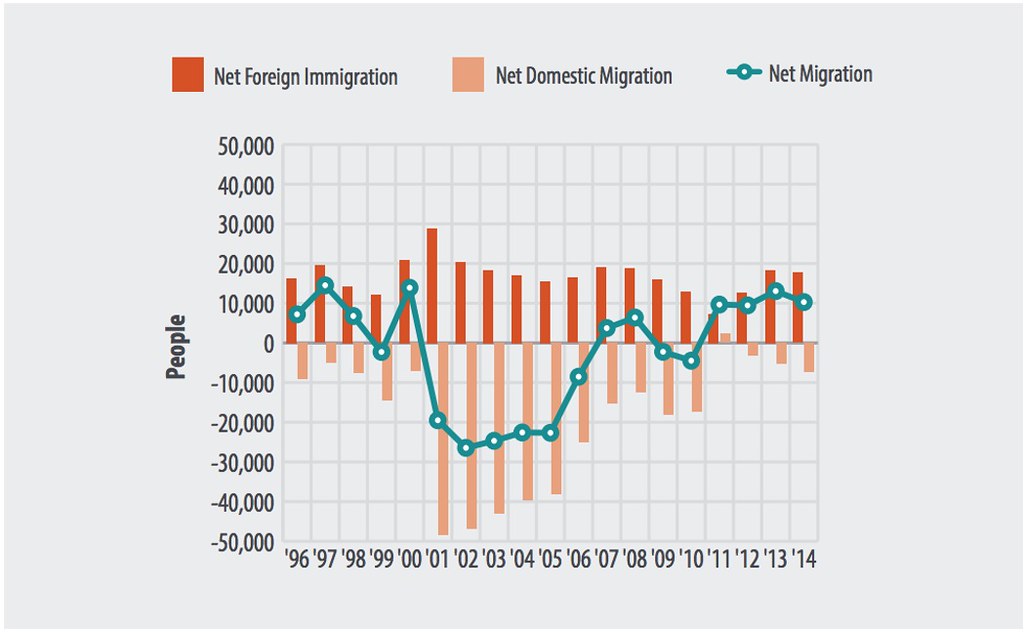
    Even with these problems, no other part of the country comes close to being as deeply progressive as California.  Illinois, President Obama’s home state, is a model for nothing so much as larceny and corruption. New York, the traditional bailiwick of the progressive over-class, is similarly too corrupt and also too tied to, and dependent upon, Wall Street. In addition, both of these states are losing population, while California, although slowing down and experiencing out-migration by residents to other states, continues to grow, the product of children born to those who arrived over the past three decades.

    California’s recent economic success seemingly makes it a compelling “alt-America.” After a severe decline in the Great Recession, the economy  has roared back, and since 2010 has outpaced the national average.  But if you go back to 2000, metro areas such as Austin, Dallas, Houston, Orlando, Salt Lake City and Phoenix — all in lower-tax, regulation-light states — have expanded their employment by twice or more than that in  Los Angeles.

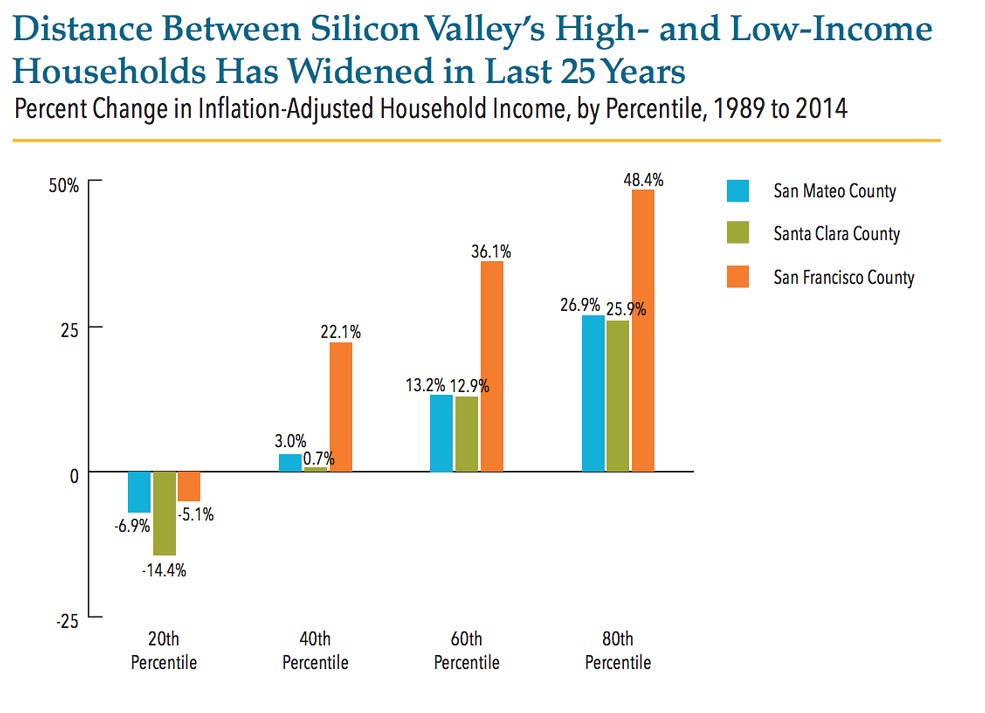
    Indeed, a closer examination shows that the California “boom” is really about one region, the tech-rich San Francisco Bay Area, with roughly half the state’s job growth recorded there since 2007 even though the region accounts for barely a fifth of the state’s population. Outside the Bay Area, the vast majority of employment gains have been in low-paying retail, hospitality and medical fields. And even in Silicon Valley itself, a large portion of the population, notably Latinos, are downwardly mobile given the loss of manufacturing jobs.

    According to the most recent Social Science Research Council report, the state overall suffers the greatest levels of income inequality in the nation; the Public Policy Institute places the gap well over 10 percent higher than the national average. And though California may be home to some of the wealthiest communities in the nation, accounting for 15 of the 20 wealthiest, its poverty rate, adjusted for cost, is also the highest in the nation. Indeed, a recent United Way study found that half of all California Latinos, and some 40 percent of African-Americans, have incomes below the cost of necessities (the “Real Cost Measure”). Among non-citizens, 60 percent of households have incomes below the Real Cost Measure, a figure that stretches to 80 percent below among Latinos.

    In sharp contrast to the 1960s California governed by Jerry Brown’s great father, Pat, upward mobility is not particularly promising for the state’s majority Latino next generation. Not only are housing prices out of reach for all but a few, but the state’s public education system ranks 40th in the nation, behind New York, Texas and South Carolina.  If California remains the technological leader, it is also becoming the harbinger of something else — a kind of feudal society divided by a rich elite and a larger poverty class, while the middle class either struggles or leaves town.

    Will America Turn to the California Model?

    The new California model depends largely on one thing: the profits of the very rich. Nearly 70 percent of the state budget comes from income tax, half of which is paid by the 1 percent wealthiest residents (the top 10 percent of earners accounted for nearly 80 percent). This makes the state a model of fiscal instability. As long as the Silicon Valley oligarchs and the real estate speculators do well, California can tap their wealth to pay its massive pension debt, and expand the welfare state inexorably for its increasingly redundant working-class population.  

    It’s highly dubious this model would work for the rest of the country. Due largely to its concentration of venture capital, roughly half the nation’s total, Silicon Valley may be able to continue to dominate whatever is the “next big thing,” at least in the early stages. Even parts of the tech community, such as Uber, Lyft and Apple, have announced major expansions outside of the state, in some cases directly due to regulatory restraints in California. Layoffs, meanwhile, are rising in the Valley as companies merge or move to other places. Google, Facebook and others, of course, will remain, keeping the big money in California, but the jobs could be drifting away.   

    Under any circumstances, the rest of the country — with the exception of a few markets such as Manhattan and downtown Chicago — could not absorb the costs for housing or the taxes California imposes on its residents and businesses. Part of the reason stems from the fact that California is indeed different; its climate, topography, cultural life cannot be easily duplicated in Kansas City, Dallas or anywhere else. People will pay for the privilege of living in California, particularly along the coast. Would they do so to live in Minneapolis or Charlotte?

    Nor, unlike during much of the postwar era, can it be said that California represents the demographic future.  The state — even the Bay Area — generally loses people to other states, particularly those in middle age, according to an analysis of IRS numbers.  Brown apologists suggest it’s only the poor and uneducated who are leaving, but it also turns out that California is losing affluent people just as rapidly, with the largest net loss occurring among those making between $100,000 and 200,000.  

    Perhaps more revealing, the number of children is declining, particularly in the Los Angeles and San Francisco areas. Children made up a third of California’s population in 1970, but USC demographer Dowell Myers projects that by 2030 they will compose just a fifth.

    Nor is help on the way. Although boomtown San Francisco has maintained its share of millennials, most large California cities have not. And the number of people in their mid-thirties — prime child-bearing years — appears to be declining rapidly, notably in the Bay Area.   Coastal California is becoming the golden land for affluent baby boomers rather than young hipsters. Surfing dudes will increasingly be those with gray ponytails.

    Instead of a role model for the future, the Golden State seems likely to become a cross between Hawaii and Tijuana, a land for the aging rich and their servants. It still remains a perfect social model for a progressive political regime, but perhaps not one the rest of the country would likely wish to, or afford, to adopt.

    This piece originally appeared in Real Clear Politics.

    Joel Kotkin is executive editor of NewGeography.com. He is the Roger Hobbs Distinguished Fellow in Urban Studies at Chapman University and executive director of the Houston-based Center for Opportunity Urbanism. His newest book, The Human City: Urbanism for the rest of us, was published in April by Agate. He is also author of The New Class ConflictThe City: A Global History, and The Next Hundred Million: America in 2050. He lives in Orange County, CA.

    Photo by Thomas Pintaric (Own work) [GFDL or CC-BY-SA-3.0], via Wikimedia Commons

  • Our Most Popular Stories of 2016

    2016 is gone, 2017 is here. Here’s a look back at the most popular stories at New Geography in 2016. Happy New Year, and thanks for reading.

    12. This is Why You Can’t Afford a House. Back in February, Joel Kotkin made the case that housing costs are a huge burden on America’s middle class and argued for more discussion on the topic at the national level. This piece was also published by The Daily Beast.

    11. Super Bowl: Super Subsidy Sunday. Just in time for last year’s Super Bowl, Matthew Stevenson outlined the massive public subsides enjoyed by pro sports franchises.

    10. The New War Between States. In this Real Clear Politics Essay, Joel points out the variation in economic DNA across different regions of the country and the need to adjust policy to leverage those differences as a national competitive advantage.

    9. What Happens When Wal-Mart Dumps You. Joel breaks down the future of the retail industry and its potential impacts on communities of all types: urban areas, suburbs, and small towns. This piece was also published by The Daily Beast.

    8. Farewell Grand Old Party. From his weekly Orange County Register column, Joel notes how the rise of Trump signals a turning point for the Republican Party.

    7. America’s Next Boom Towns: Regions to Watch in 2016. One year ago Joel and I created an index to identify some of the best-performing large U.S. metropolitan areas. This piece appeared in Forbes.

    6. Best Cities for Jobs 2016. Our annual Best Cities for Jobs index ranks all of America’s metropolitan areas according to short- and longer-term job growth performance. Follow the link to see the various topical rankings.

    5. New York’s Incredible Subway. In this piece Wendell Cox describes New York City’s subway system, unlike any other transit system in the United States.

    4. Best and Worst: 2015 International Housing Affordability Survey. Wendell’s Annual Demographia International Housing Affordability Survey is a critical comprehensive reference on worldwide housing affordability by urban area. Here’s the highlights of the report.

    3. Today’s Tech Oligarch’s are Worse than the Robber Barons. Joel argues that the political influence of high-tech business leaders are worse than the robber barons of the last century because today’s tech firms offer little to improve the lives of the middle class.

    2. An Open Letter to the Democratic National Committee from a Rural Democrat. Former North Dakota State Senator Tyler Axness offers his advice to Democratic Party leaders from the perspective of rural America.

    1. Largest Cities in the World: 2016. Wendell’s annual World Urban Areas report is perhaps the most comprehensive resource for worldwide urban population data. This April 2016 article summarizes the report.

    Mark Schill is a community and corporate strategy consultant with Praxis Strategy Group and Managing Editor of New Geography.

  • 2010-2013 Small Area Data Shows Strong Suburban & Exurban Growth

    The latest small area estimates from the Census Bureau indicate that suburban and exurban areas continue to receive the overwhelming share of growth in metropolitan areas around the country, with a single exception, New York. The new American Community Survey (Note 1) 5 year file provides an update of data at the ZCTA (zip code tabulation area), which are described below, as analyzed by the City Sector Model. The data was collected from 2011 through 2015, and can therefore be considered generally reflective of the middle year of the period, 2013.

    City Sector Model Analysis

    The City Sector Model classifies small areas into five categories based on population density, commuting mode and age of development (the criteria is described in Figure 7). There are two pre-World War II classifications, the Urban Core CBD (central business district) and the Urban Core Inner Ring. These areas are typified by substantial reliance on transit, walking and cycling for commuting and have higher population densities. There are also three post-World War II, classifications, the Early Suburbs, Later Suburbs and the Exurbs, both of which have lower population densities and substantial automobile orientation (Figure 1).

    The Overall Trends

    In contrast to the narrative that there has been a “return to the cities” (meaning the urban core, as opposed to cities in the functional sense or physical sense, which are metropolitan areas and urban areas respectively see Note 2 in a previous post), most new residents are located in the suburbs and exurbs. Between 2010 and 2013, The automobile oriented suburbs and exurbs captured 89.9 percent of the new population growth in 52 major metropolitan areas (over 1,000,000 population in 2013). By contrast, 10.1 percent of major metropolitan population growth was in the Urban Core. The Urban Core-CBD, (largely identified with the Central Business District), accounted for 0.8 percent of the growth, and the Urban Core: Ring, the neighborhoods surrounding the core, for the other 9.3 percent (Figure 2). Although the vast majority of growth is concentrated in the suburbs and exurbs, the urban core has reversed their long-term decline, after suffering a small loss in population between 2000 and 2010.

    Each of the five categories experienced population increases between 2010 and 2015 (Figure 3). However, only the Later Suburbs grew faster than its pre-existing share of the metropolitan population. The Later Suburbs had 26.9 percent of the population in 2010, yet added a much stronger 45.8 percent of the population increase from 2010 to 2013.

    The Earlier Suburbs grew faster than in the previous decade, but their 29.5 percent share of metropolitan growth was far less than their 41.5 percent population share in 2010. The Urban Core: CBD captured 0.8 percent of the growth, less than its prior 1.3 percent share, while the Urban Core: Inner Ring fell nearly one-third short of equaling its previous population share. The Exurbs, which were hit hard by the Great Recession, also fell short of gaining at the rate of their population  (Figure 4).

    New York and the Rest

     The New York metropolitan area, dominated the nation in urban core growth, with 73.2 percent of the population increase, leaving only 27.8 percent for the suburbs. Even this, however, is not likely an indication of a “return to the core city” because of apparent net domestic migration losses (Note 2) throughout the metropolitan area. In fact the city of New York was not attracting new domestic migrants at all, from the suburbs or elsewhere in the nation, with a net domestic migration loss of 400,000 between 2010 and 2015. All of the city of New York’s population gain was due to an excess of births over deaths and, as befits one of the world’s great global cities, international migration.

    New York’s domination of urban core growth was astounding in raw numbers, as well. More than one-half of all the urban core growth among the major metropolitan areas was in the New York metropolitan area. Washington was a distant second, with 11.2 percent of the urban core growth. Boston was close behind at 9.7 percent, followed by San Francisco-Oakland at 8.1 percent. The other two metropolitan areas with legacy core cities were substantially lower, with Philadelphia accounting for 4.1 percent and Chicago 3.7 percent. All of the 46 metropolitan areas without legacy core cities, accounted for only 10.6 percent of total urban core growth, one-fifth the growth in New York alone. As with so much, the story of high density urban cores in the United States is largely about New York (Figure 5).

    Nothing like New York’s domination of urban core growth over suburban and exurban growth occurred elsewhere, not even among the other five metropolitan areas with “legacy cities” (core cities). These are the metropolitan areas with the six largest central business district in the United States, and in which the core cities account for 55 percent of the national transit commuting destinations (despite having only six percent of the national employment).

    Boston, came the closest, with 39.9 percent of its growth in the urban core. There was one other metropolitan area with more than 30 percent of its growth in the urban core, Philadelphia at 36.2 percent. The Chicago urban core accounted for 29.7 percent of its growth, San Francisco for 24.5 percent and Washington for 20.8 percent. Each of these, with the exception of San Francisco, managed to have proportionally greater growth in its urban core than the population share already living there (Figure 6).

    The situation was much different in the 46 major metropolitan areas without legacy core cities. In these, nearly all population growth (98.6 percent) was in the suburbs and exurbs. This is slightly above the 94.5 percent of the population living there.

    Suburban Nation

    Using a different small area classification system, the Urban Land Institute (ULI) has reached similar conclusions on the distribution of metropolitan population and growth. Indicating that “America remains a largely suburban nation,” ULI indicates that 79 percent of the nation’s metropolitan population lives in the suburbs and that suburban areas accounted for 91 percent of metropolitan growth from 2000 to 2015. These trends are mirrored in large measure in Canada and Australia, according to work led by Professor David Gordon of Queens University in Kingston, Ontario.

    To be sure, the improvement in urban core fortunes is a very positive development. There is no question that urban cores are far nicer places than they were two decades ago and that their renewed growth makes the entire city, from the central business district to the sparsely populated exurbs, a better and more productive place. But the bulk of growth, and the preponderance of the population, remains firmly suburban.

    Note 1: The American Community Survey (ACS) uses sampling methods from which estimates are built, not actual counts like occur in the US Census every 10 years. The most reliable data is from the Census, which will be conducted next in 2020.

    Note 2: “Apparent” is used because domestic migration data is not reported below the county level (such as in ZCTA’s). However, much of the Urban Core is in the city of New York and all of the inner ring suburban counties lost domestic migrants, suggesting that net domestic migration gains could not have occurred.
    Wendell Cox is principal of Demographia, an international public policy and demographics firm. He is a Senior Fellow of the Center for Opportunity Urbanism (US), Senior Fellow for Housing Affordability and Municipal Policy for the Frontier Centre for Public Policy (Canada), and a member of the Board of Advisors of the Center for Demographics and Policy at Chapman University (California). He is co-author of the "Demographia International Housing Affordability Survey" and author of "Demographia World Urban Areas" and "War on the Dream: How Anti-Sprawl Policy Threatens the Quality of Life." He was appointed to three terms on the Los Angeles County Transportation Commission, where he served with the leading city and county leadership as the only non-elected member. He served as a visiting professor at the Conservatoire National des Arts et Metiers, a national university in Paris.

    Photo: NASA satellite view of New York’s urban core