Category: Demographics

  • SPECIAL REPORT – Domestic Migration Bubble and Widening Dispersion: New Metropolitan Area Estimates

    Returning to Normalcy

    The Bureau of the Census has just released metropolitan and county population estimates for 2008, with estimates of the components of population change, including domestic migration. Consistent with the “mantra” of a perceived return to cities from the suburbs, some analysts have virtually declared the new data as indicating the trend that has been forecast for more than one-half a century. In fact, the new population and domestic migration data merely indicates the end of a domestic migration bubble, coinciding with the end of the housing bubble.

    Metropolitan Area Growth: As usual, the metropolitan areas with more than 1,000,000 population increased above the national rate of 7.8 percent, at 9.2 percent from 2000 to 2008. Smaller metropolitan areas (between 50,000 and 1,000,000 population) grew at the national rate of 7.8 percent. Also continuing a long-standing pattern, areas outside metropolitan areas (including rural areas) grew slower, at only 0.7 percent (Table 1).

    The overall trends, however, mask significant variations. The nation’s two metropolitan areas with more than 10,000,000 population are experiencing growth rates less than one-half the national average. New York grew only 3.6 percent, while Los Angeles – which for decades experienced above average growth, could manage only one-half the national average rate, at 3.8 percent. Indeed, Chicago grew faster, at 5.0 percent. If 2000s growth rates were to continue to 2050, Dallas-Fort Worth, Atlanta and Phoenix would exceed Los Angeles in population, while Houston would pass Los Angeles shortly thereafter. This is not a prediction – population growth in these fast growing areas will likely slow as they get larger – but is merely offered to show how moribund the Los Angeles growth rate has become.

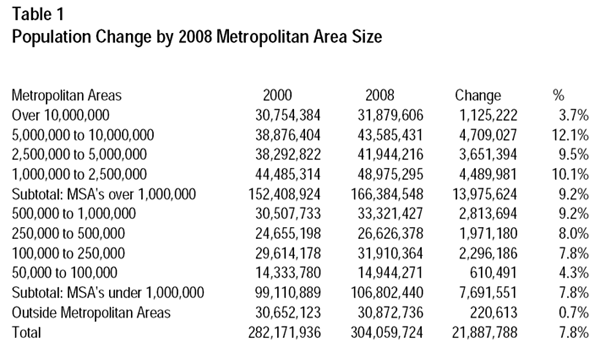
    The strongest growth was among metropolitan areas with between 5,000,000 and 10,000,000 population, which added 12.1 percent to their populations. This was driven by gains of more than 1,000,000 in Dallas-Fort Worth and Atlanta, nearly 1,000,000 in Houston and over 500,000 in Washington (DC). Philadelphia’s growth rate, however, was even less than that of New York or Los Angeles, at 2.7 percent.

    There was also strong growth (9.5%) among the metropolitan areas with between 2,500,000 and 5,000,000 population. This was driven by an increase of more than 1,000,000 in Phoenix and more than 800,000 in Riverside-San Bernardino. San Francisco (3.3 percent) and Boston (2.7 percent) grew at less than one-half the national rate, while Detroit lost population.

    The metropolitan areas with between 1,000,000 and 2,500,000 population also grew more than the national average, at 10.5 percent. The strongest growth was in Las Vegas, which added nearly 475,000 residents. Charlotte, Sacramento and Austin also added more than 300,000. Providence, Milwaukee and Hartford all experienced growth at less than one-half the national rate; while Cleveland, Pittsburgh, Buffalo and Katrina ravaged New Orleans all lost population. Tucson became the nation’s 52nd metropolitan area with more than 1,000,000 population in 2008, having added nearly 20 percent to its population since 2000.

    The largest percentage growth (35.4%) among metropolitan areas over 1,000,000 population was in Raleigh, which added 284,000 new residents (This is not Raleigh-Durham, which the Bureau of the Census calls a combined statistical area, consisting of the Raleigh metropolitan area and the Durham metropolitan area). Raleigh displaced recent perennial growth leader Las Vegas, which experienced slower growth due to the collapse of the housing bubble.

    Domestic Migration

    Much has been made of the apparent recent slow-down in domestic migration (residents moving from one county to another) as indicated in the new data. In fact, however, domestic migration was greater in 2008 than it was in 2001. The slow-down should be more appropriately viewed as a return to more normal conditions.

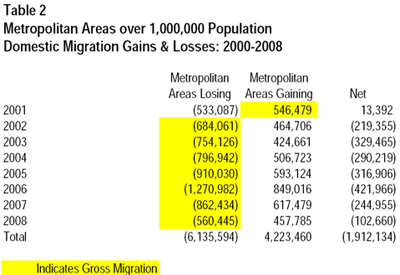
    This can be illustrated by examining the gross domestic migration between metropolitan areas over 1,000,000 population. In 2008, gross migration in the metropolitan areas of more than 1,000,000 was 560,000. This is slightly more than the 546,000 in 2001. Gross migration increased after 2001, peaking at 1,270,000 in 2006. This fell to 862,000 in 2007 and then to 560,000 in 2008 (Table 2).

    The Domestic Migration Bubble

    The domestic migration bubble that developed from 2000 through 2007 coincided with the domestic housing bubble. This is not surprising, because housing consumes a major part of household expenditures. The differences in housing costs are much greater between metropolitan areas than any other major category of personal expenditure. For example, transportation, clothing and food have similar costs among the nation’s metropolitan areas. During the bubble, however house prices doubled and tripled in some metropolitan areas relative to incomes. The housing bubble appears to have sparked its own domestic migration bubble, as people moved from less affordable areas to more affordable areas.

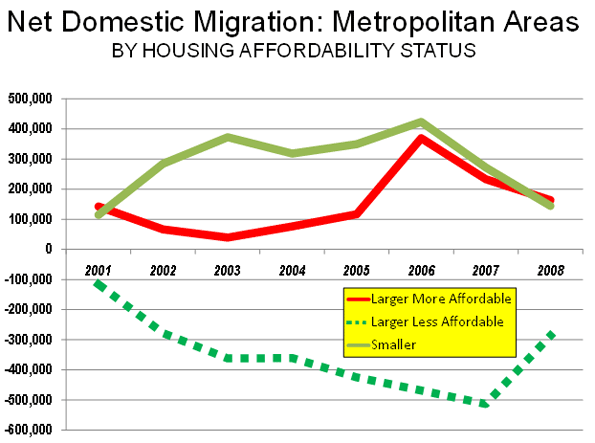
    This is illustrated by examining domestic migration trends by housing affordability. The more affordable metropolitan areas had Median Multiples at the peak of the housing bubble of 4.0 or less (The “affordable” and “moderately unaffordable” categories from the Demographia International Housing Affordability Survey) and the less affordable metropolitan areas had Median Multiples of 4.1 or above (the “seriously unaffordable” and “severely unaffordable” categories from the Demographia International Housing Affordability Survey).

    The less affordable (higher cost) metropolitan areas experienced both the largest house price increases and a spike in net domestic migration losses. Overall, the less affordable metropolitan areas lost 2.8 million domestic migrants from 2000 to 2008 (Table 3 and Figure). This started in 2001 with a modest loss of 116,000, which ballooned to 514,000 by 2007. The loss dropped to 287,000 in 2008, a figure more than 2.5 times the 2001 net domestic migration loss.

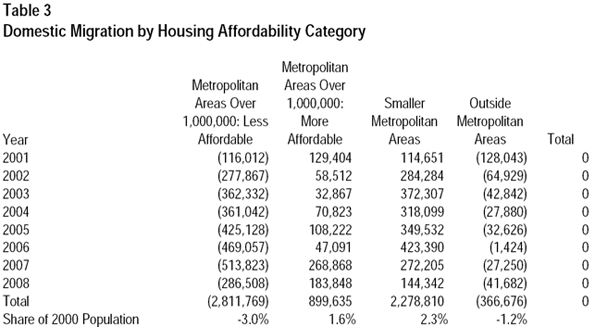
    At the same time, the affordable metropolitan areas experienced substantially lower house price escalation, while gaining nearly 900,000 domestic migrants from 2000 to 2008. In 2001, the more affordable metropolitan areas experienced a net domestic migration gain of nearly 129,000. Domestic migration gains peaked in 2007, at 269,000. Domestic migration gains fell to 184,000 in 2008 in the more affordable metropolitan areas. However, this figure was still far higher than the numbers at the beginning of the decade.

    Suburbs Continue to Gain

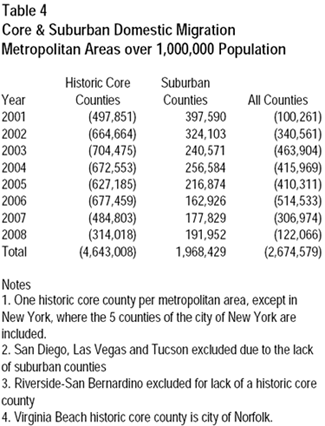
    The data also shows that people continue to move to the suburbs and move away from core areas. This can be shown from the county data, which is generally the smallest geographic area for which migration data is produced. One caveat: because many core counties contain suburban areas as well as the historic core cities, a county based migration analysis usually understates the extent of both core losses and suburban gains.

    The core counties improved their domestic migration performance in 2008, but continue to suffer losses. In 2008, the net domestic migration loss in core counties was 314,000, which compares to the 498,000 loss in 2001 and an annual average loss of 580,000 over the decade. Losses of this magnitude can hardly be characterized as a “turnaround.”

    Net domestic migration gains were down to 192,000 in the suburban counties from a 398,000 gain in 2001 and an average gain of 246,000 over the period. However, net suburban migration gains were up in 2008 from 2007 and 2006 (Table 4). Out of the 48 metropolitan areas, suburban counties performed better than core counties in net domestic migration in 42 cases, matching the figure for 2000-2008, the same as in 2007 and up from 38 in 2006. Among the six metropolitan areas where core net migration was greater than in the suburbs, core counties lost fewer domestic migrants than the suburbs (Washington and Virginia Beach), three were areas where the core county typically experiences higher net migration because of its population dominance (Phoenix, Raleigh and San Antonio) and the last was New Orleans, where the core county was much harder hit than the suburban counties by Hurricane Katrina related losses leading to greater gains in domestic migrants as it recovers (Orleans Parish, which is also the city of New Orleans). It is more than “a stretch” to interpret the new data to suggest any move to core areas from suburban areas.

    The 2008 domestic migration data does indicate a slow down or even a reversal in some more distant suburban and exurban areas. This was also to be expected because these areas had experienced a large increase in home ownership and a high volume of high risk sub-prime lending.

    As a result, exurban metropolitan areas like Riverside-San Bernardino, Stockton, Modesto and Merced experienced domestic migration reversals, while distant counties within metropolitan areas (such as Stafford County, Virginia in the Washington area and Pike County, Pennsylvania in the New York area) saw declines in their domestic migration. Much of the growth in such more distant areas occurred because of planning regulations in closer in areas made new development impossible or impossibly expensive. Thus, new housing construction was forced to “leap frog” over developable land, which also imposed higher transportation costs and longer commuting distances on the new home owners.

    At the same time, the better domestic migration performance in some core counties and “closer-in” counties occurred in large part because households no longer had a financial incentive to “cash-out” and move to lower cost areas, since they were often facing negative equity. This removed much of the incentive to move from San Francisco or Los Angeles to Las Vegas, Reno, Phoenix, Tucson or Portland, where prices were considerably lower (though still much higher than before).

    The Real Story: Widening Dispersion

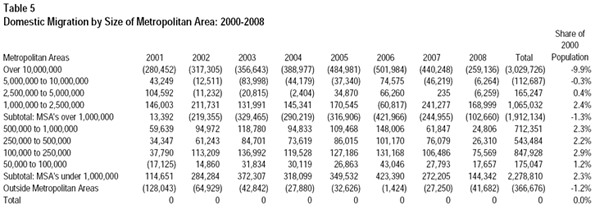
    Not only are people continuing to move from core areas to more suburban areas, but they are also moving from larger metropolitan areas to smaller metropolitan areas (Table 5). Since 2000, approximately 2,275,000 people have moved from large metropolitan areas and non-metropolitan areas to smaller metropolitan areas – those with populations of between 50,000 and 1,000,000. In 2001, the smaller metropolitan areas gained 115,000 domestic migrants. These net migration gains peaked in 2006, at 423,000. Following the national trend, net domestic migration to smaller metropolitan areas fell to 144,000 in 2008, still in excess of the 2001 number. Net domestic migration in the smaller metropolitan areas exceeded that of the larger less affordable metropolitan areas by 5.1 million over the period and exceeded that of the larger more affordable metropolitan areas by 1.4 million.

    Despite these trends, most metropolitan areas continue to add population. The domestic migration losses are more often than not made up by the natural increase in population (births minus deaths) and net international migration gains.

    However, households who already live here continue to exhibit a pattern of dispersion. Both within the same metropolitan area and between metropolitan areas, the latest Bureau of the Census data continues to show a clear trend of wider dispersal – from core counties to suburban counties and from larger metropolitan areas to smaller.

    References:Major Metropolitan Area Population & Domestic Migration 2000-2008: http://www.demographia.com/db-2008met.pdf

    Wendell Cox is a Visiting Professor, Conservatoire National des Arts et Metiers, Paris. He was born in Los Angeles and was appointed to three terms on the Los Angeles County Transportation Commission by Mayor Tom Bradley. He is the author of “War on the Dream: How Anti-Sprawl Policy Threatens the Quality of Life.

  • NEW GEOGRAPHY SPECIAL REPORT: America’s Ever Changing Demography

    America’s demography tells not one story, but many. People concerned with looking at long-term trends need to familiarize themselves with these realities – and also consider whether these will continue in the coming decades.

    Losers and Winners

    It’s common to read about rapidly growing places, but what about those that are losing? Perhaps it’s fitting in this time of economic decline first to tell the story of areas of loss of population, of out-migration and of natural decrease, more deaths than births. Such areas are not of course necessarily “losers.” They may be prosperous, with a high quality of life; they are just not “growing.”

    The map below shows the 40 percent of counties which lost population, 2000-2007. 216 lost more than 10 percent, and 1139 lost up to 10 percent. These contrast the 33 counties which grew more than 40 percent in these seven years. So overall, well over half the territory of the country lost population. The largest population losses, by far, were in and around New Orleans (Katrina), followed by the metropolitan cores of the Rust Belt axis from Pittsburgh, through Cleveland to Detroit, and extending west into Indiana, and east through Pennsylvania and western New York.

    The largest contiguous area of counties with losses remains the same as it was in the 1970s, 1980s and 1990s: the “high plains” from Mexico to Canada (actually continuing in Canada). Probably 90 percent of counties lost population, especially in Kansas, Nebraska and North Dakota, and extending into the Midwest agricultural heartland of Iowa, northern Missouri, southern Minnesota and western Illinois.

    Other traditional areas of losses which continue from the 1970s through 1990s include the coal counties of Appalachia (Kentucky, West Virginia), and the “Black Belt” from Arkansas and Louisiana through the Mississippi Delta and on through parts of Alabama, Georgia, South and North Carolina into Virginia.

    Again repeating past patterns are losses in some of the large core counties of Megalopolis, as Philadelphia and Baltimore, and elsewhere (St. Louis, Chicago, Minneapolis and even San Francisco). The highest rates of loss were again in and around New Orleans, small counties in Mississippi and Nevada, and Montana, North and South Dakota.

    The 33 rapidly growing counties are ALL suburban except for the new metropolitan area of St. George, Utah. Suburban Atlanta dominates, followed by northeastern Florida, and selected suburbs of Columbus, OH, Indianapolis, Charlotte, Chicago, Minneapolis, Washington, DC, Des Moines, Denver, Reno, Houston, Dallas, and Austin. The largest absolute gains (many areas are now hurting economically) were Maricopa (Phoenix), Harris (Houston), Riverside and San Bernardino, Clark (Las Vegas), Los Angeles, and suburbs of Dallas and San Antonio.

    Migration

    Immigration dominates the news, but there is also emigration, and the difference between these is ‘net’ international migration. Data on immigration and emigration are not very certain or reliable, as people leaving don’t have to tell anyone, and many entering are equally reticent. Yet there is a clear pattern from the map of the 416 counties. Overall the areas of net loss tend to be the same as for losses in overall population.

    Counties where immigrants greatly exceed emigrants are both the core counties of the largest metropolitan areas and their largest suburban counties, but especially in the west, Texas, Florida, and the Atlantic coast metropolitan cores from Atlanta to Boston, California, Texas, Florida, and metropolitan New York city. Mexican immigration is the largest, but there is significant immigration from the rest of Latin America, from Asia and from Eastern Europe. Most of the immigrant destinations are metropolitan, but include some rural small town areas, typically with food processing, an industry dependent on low wage immigrants (TX, AR, OK, KS, NE, IA).

    Largest absolute gains are to Los Angeles, Cook, New York City, Miami, Houston, Dallas, Orange County, Phoenix and Santa Clara, with a bias to the southwest, Florida and New York City. The highest immigration rates are in part the same, Miami, Queens, Hudson NJ, Santa Clara, but high rates also characterize Washington DC suburbs, two Kansas counties (food processing), and a Colorado county (workers for ski resorts).

    Significant numbers of non-immigrants also move, and as many as a third probably crossed county lines since 2000. In much of America the balance between in and out migration is close, but for many regions, “net” migration is the most important component of change.

    Overall two thirds of American counties reported a net loss from internal migration, 29 at a level more than 20 percent of the base population. Only 118 have high rates of net in-migration (over 20 percent). Large absolute losses characterize most large metropolitan core counties, including coastal California, Dallas, Miami, New Orleans, megalopolis core counties (from Maryland to Massachusetts), and the Great Lakes and Midwest. Smaller absolute net out-migration prevails over most rural small-town America, especially the Great Plains, and agricultural Midwest and Great Lakes, the Black Belt across the south, and includes much of the southwest.

    Internal domestic migration represents a distinctive geography. In the west many were inland smaller metropolises, as well as many rural small town environmentally attractive counties that received many of the out-migrants from the large coastal metropolises. In the Midwest and northeast gains were strongly suburban (often local flows from the core counties). In the south rapid gains continued to dominate much of Florida, and metropolitan suburbs, especially around Washington DC, Atlanta, Dallas, and Austin-San Antonio, fueled both by continuing in-region rural to urban flows and by migration from the north to the south.

    The losses include the usual suspects, the core counties of the largest metro areas, including Dallas, Miami, and Orange counties, with the native-born displaced to the suburbs and beyond. The largest absolute gains include some central counties, like Maricopa and Clark (but which are also themselves suburban), major suburban counties of Los Angeles, Dallas, Houston, Phoenix, Chicago, and a newcomer, Wake county NC (Raleigh). The highest rates of net in-migration are mostly suburban, Atlanta, Dallas, Washington DC, Denver, Chicago, but also a few smaller counties, as in Pennsylvania and South Dakota.

    The Role of Natural Increase

    One of the indicators of diversity in America is the remarkable variation in the role of natural increase (or decrease) – that is the difference between births and deaths in an area – in the story of population change.

    Almost 30 percent of US counties experience natural decrease, and only a little over 10 percent (337) have high rates of natural increase (6% or more growth in 7 years). Natural decrease is mainly a function of age structure, where the young of child-raising age have left, OR where unusual numbers of the elderly have moved in, dominating the population.

    There are four distinct regions of natural decrease. The largest, absolutely and relatively, is Appalachia, from extreme northern Georgia, through smaller parts of Tennessee and North Carolina, western Virginia, most of West Virginia, and both the greater Pittsburgh and the Scranton-Wilkes Barre region of northeastern Pennsylvania. Much is a historic region of coal (and steel) production, and often poor transport links to the rest of country. The region has suffered loss of the young, often for 40 years or more.

    The second large region of natural decrease is entirely different in character, namely mid-Florida, centered on Tampa-St, Petersburg and Sarasota, as a result of the aging in place of massive numbers of retirees from the north moving to Florida over the last 50 years.

    The third region is much more extensive, covering most of the Great Plains and rural Midwest, from Texas and Arkansas to the Dakotas, Minnesota and Montana, regions again suffering long-term loss of the young population to greater opportunities in the city.

    The last smaller region is the Michigan-Wisconsin upper peninsula, where losses can be traced to the result of declining mining and forestry. Counties in New Mexico, Arizona, and northern California are somewhat like Florida with large numbers of retirees, while those in coastal Oregon and Washington are in part like upper Michigan, but with many retirees as well.

    The 112 counties where births greatly exceed deaths, not surprisingly, reflect a very different geography. They do represent, as is often pointed out, a shift to metropolitan areas but importantly not to the core cities but the suburban hinterlands. Most prominent areas of high natural increase are primarily suburban areas around metropolitan Houston, Dallas, San Antonio, Atlanta, Washington DC, Chicago, Minneapolis and Raleigh, NC. Many of these areas are also affected by in-migration of Hispanic families.

    The other reason for high natural increase is higher fertility – families with above replacement numbers of children, often for reasons of religion or ethnicity, and also reinforced by in-migration of young adults. On the map, Native American Indian reservations stand out, as in North and South Dakota, Wisconsin, Montana, and Alaska, although these numbers are still slow. Mormon Utah and Idaho demonstrate high fertility, family size and shares of births, in rural as well as urban counties. But the dominant area of high natural increase is clearly the extensive southwestern region of Mexican heritage and in-migration over recent decades, in Texas, California, Colorado, New Mexico, Arizona, and eastern Washington, plus selected counties in the high plains, e.g., Kansas and Oklahoma. The final bastions for young families and higher natural increase are military dominated counties, as in Georgia, North Carolina and Kansas.

    In absolute losses, parts of Florida and Pennsylvania and the northern Great Plains stand out. Relative gains are highest in Hispanic, Native American Indian and Mormon counties. These are impressive numbers – the surplus of births over deaths as a share of the total population.

    Why the Differences?

    What makes counties lose or gain people? The US has a diverse and restless population. Counties vary greatly in attractiveness to immigrants from abroad or migrants from other states, broadly because of real or perceived “opportunities,” characteristics of jobs or amenities which may lure migrants from less competitive or attractive areas.

    The map divides the counties into nine sets, based on the relative importance of natural increase or decrease, emigration and immigration and in-migration and out-migration. The 1439 counties which lost population include 165 for which the main reason for loss is from natural decrease; of these one subgroup lost overall despite net immigration, the other’s loss was aggravated by net out-migration as well. The larger set of counties with population losses, 1184, are those for which the loss is mainly attributable to net out-migration, with two subgroups, one with loss despite natural increase, the other with loss magnified by natural decrease.

    On the map the “darker” green counties (89) had a large natural decrease and a smaller net out-migration; the “lighter” green (76) had natural decrease, exceeding a smaller net in-migration. These counties for which natural decrease dominates are scattered across the Great Plains from Texas to Canada, together with clusters from Appalachia (VA, WV, PA, and NY), northern MI-WI, and a few declining natural resource areas in the west.

    The “darker” blue counties (486) are dominated by net out-migration, but also had natural decrease. The “lighter” blue counties (698) had natural increases but these were much exceeded by net out-migration. These counties are often interspersed with the “green” counties, dominated by natural decrease. These 1184 counties – over one-third of counties and of US territory – constitute a large swath of the Plains and Midwest, large parts of New York and Pennsylvania, the coal counties of Kentucky and West Virginia, and the “Black Belt” across the south from Louisiana and Arkansas to southern Virginia. Finally they include sparsely populated resource counties in Alaska and parts of the west. Overall, the counties losing population tend to be non-metropolitan and interior, except for the declining industrial metropolitan counties of the “Rust Belt”.

    Gainers

    The gaining counties consist of three broad groups — 755 for which natural increase is the main contributor to growth, with subsets of 420 growing despite net out-migration, and 335 with net in-migration as well. The second consists of 104 counties for which immigration is the predominant basis for growth. Finally there are 933 counties for which net in-migration is the main contributor to growth, with subsets with natural decrease with natural increase.

    The “yellow” counties (755) gained population mainly because of natural increase; the light yellow counties (420) grew despite often substantial net out-migration; the darker yellow counties (335) also had a smaller net in-migration, and are thus among the more ”successful” more rapidly growing US counties. The former are especially prevalent in cities of the west – e.g. Los Angeles, San Diego, Houston, Dallas – with sizable immigrant populations (see the table) and higher fertility and displacement of the native-born, but yellow counties are also common in non-metropolitan and small metropolitan and suburban areas of the Great Lakes states, the outer Megalopolis, and urban industrializing parts of the south. The “dark” yellow areas are in the same regions, and are very often the areas gaining migrants from the “light” yellow areas, as can be seen in California, Arizona, Utah, Washington and Colorado.

    The “orange” counties, only 104, are those where immigration is the main source of growth. These are somewhat scattered, but especially common in New England and Middle Atlantic states, selected counties of the Plains (often with food processing plant growth) and northern Pacific Coast metropolitan regions, as the San Francisco bay region, Portland and Seattle.

    The “magenta” counties (933) are those for which net in-migration dominates growth. The lighter magenta for those with natural decrease (213), the darker magenta for those with natural increase as well. All these tend to be the most rapidly growing counties in the country, and tend to occur together. The main difference with counties with natural decrease are those with an older age structure, but which are nevertheless attractive to in-migrants. From the map these occur in two main settings: traditional areas of amenity migration, most obviously covering much of Florida, but also widespread in northern New England, northern Michigan, Wisconsin and Minnesota, the Ozarks, parts of the Tennessee valley, and across much of the west, with particular swaths in western Montana, coastal Oregon and Washington and northern California. The second setting is the exurban environs of major metropolitan areas, where new growth is invading formerly rural areas.

    The final, largest set of counties with natural increase as well as high in-migration (720 counties), are the stereotypical winners in the contemporary “growth races” – based on a combination of employment growth and metropolitan or environmental amenities. These tend especially to be southern and western metropolitan areas, small as well as large. The most dominant regions are greater Washington DC, greater Atlanta, Dallas and Houston, Portland, Denver, Phoenix, most of Florida, and – perhaps surprisingly – substantial parts of the north-south borderlands, including Tennessee, Kentucky, Arkansas, Oklahoma, and Missouri.

    What about the recession? It’s hard to judge the relative effects of the current severe recession on likely near- or longer-term growth. Clearly, the collapse of housing markets are slowing the growth of such rapidly growing places as Phoenix and Las Vegas, but this does not mean they won’t regain their general attractiveness and economic viability. The particularly severe job losses in the already hurting western Rust Belt will likely aggravate the recent pattern of decline which predated the recession and could get much worse.

    Richard Morrill is Professor Emeritus of Geography and Environmental Studies, University of Washington. His research interests include: political geography (voting behavior, redistricting, local governance), population/demography/settlement/migration, urban geography and planning, urban transportation (i.e., old fashioned generalist)

  • Sunbelt Indianapolis

    For decades, the overwhelming majority of population and economic growth has occurred in the Sun Belt – the nation’s South and West as defined by the United States Bureau of the Census. This broadly-defined area stretches south from the Washington-Baltimore area to the entire West, including anything but sunny Seattle and Portland. Any list of population growth or employment growth among the major metropolitan areas will tend to show the Sun Belt metropolitan areas bunched at the top and the Frost Belt areas (the Northeast and Midwest regions) bunched at the bottom. Since World War II, no state has experienced the growth that has occurred in California.

    However, the trends in the last decade indicate a shift, certainly away from California, which has experienced a net domestic migration (people moving to other parts of the nation). The overall loss reaches over 1.2 million people; the state’s overall population growth rate is now only little more than average. Some metropolitan areas in the Frost Belt have begun to perform better in population and domestic migration, but most continue to experience growth that is well below that of the Sun Belt.

    The exception to this is Indianapolis, which has developed growth rates that would put it right in the middle of Sun Belt metropolitan areas, if it were not in the Frost Belt.

    Indianapolis is a metropolitan area of 1.7 million population. Indianapolis added nearly 11 percent to its population between 2000 and 2007 (latest data available) and ranks 19th in population growth among the 50 metropolitan areas with more than 1,000,000 population (New Orleans has been excluded from this analysis because of the hurricane related population losses). Indianapolis is growing faster than Washington, DC or Seattle and nearly as fast as Portland or Denver. Its population growth rate has been double that of San Diego, triple that of Los Angeles or San Jose and more than six times that of San Francisco, which has seen its growth slow to a rate no better than that of Italy. Overall Indianapolis would rank 18th out of the 32 largest US Sun Belt metropolitan areas in total population growth. It is the fastest growing of the 18 largest Frost Belt metropolitan areas.

    Between 2000 and 2007, the Indianapolis metropolitan area added 55,000 domestic migrants, equal to 3.6 percent of its 2000 population. No other Frost Belt metropolitan area comes close. Columbus and Kansas City had domestic migration gains, at 1.2 percent of their population. All other Frost Belt metropolitan areas lost domestic migrants. Indianapolis, however, would have ranked 17th out of the 32 largest Sun Belt metropolitan areas trailing Portland, but leading Seattle and Denver.

    The distribution of domestic migration within the Indianapolis metropolitan area is also significant. For one-half century various analysts have predicted the decline of the suburbs. Indianapolis, like most metropolitan areas around the country, shows exactly the opposite: the suburbs continue to attract central city residents and have yet to fall into this seemingly inevitable decline.

    While the Indianapolis metropolitan area gained 55,000 domestic migrants from 2000 to 2007, Marion County, the central county which is nearly co-existent with the central city of Indianapolis, lost 46,500 domestic migrants. All of the domestic migration growth was in the suburbs, which attracted 101,800 new residents from Indianapolis/Marion County and the rest of the nation.

    What is it that has allowed Indianapolis to experience Sun Belt growth despite being in the Frost Belt? This is not the place for a full attempt to identify all of the causes, but some observations can be made.

    Perhaps it is most important to understand what is not the cause of the superior growth in Indianapolis. It is not the city’s “unigov” governance structure. In the early 1970s, to the great fanfare of urban planners, Indianapolis merged with most of Marion County, increasing the city’s population by approximately 50 percent. Proponents of local government consolidations often (and speciously) suggest that these consolidations will make metropolitan areas more attractive (this issue is discussed in detail in our Pennsylvania report on local government consolidation). Yet, Indianapolis, one of the nation’s largest consolidated local governments, is losing residents to the suburbs. It is also worthy of note that state taxpayers provided a $1 billion pension bailout to the city last year.

    One factor that clearly makes Indianapolis attractive is its housing affordability, which is the best among metropolitan areas with more than 1,000,000 residents in six nations. According to our 5th Annual Demographia International Housing Affordability Survey, Indianapolis had a Median Multiple (median house price divided by median household income) of 2.2 in the third quarter of 2008, well below the historic norm of 3.0. Indianapolis has been ranked near the top in each of the preceding four editions as well. In recent years, new suburban starter houses of 1,500 square feet have been advertised at less than $110,000, less than the price of land for a house in many metropolitan areas.

    Superior housing affordability constitutes a critical important attractor. At the height of the housing bubble, a household living in the median priced house in Indianapolis would have saved more than $1,000,000 in down payment and mortgage payments over 30 years, compared to San Diego.

    Indianapolis also has the advantage of a comfortable lifestyle. Commuters spend 2 minutes less per day than the national average getting to work, according to the 2007 United States Bureau of the Census American Community Survey. The Texas Transportation Institute indicates that traffic congestion is less severe in Indianapolis than average and that it has become better in the last 10 years. Indicating its usual irrelevance to traffic congestion, Indianapolis has the smallest transit market share of any urban area over 1,000,000 in the nation, at approximately 0.2 percent. This compares to 11 percent in New York, 5 percent in San Francisco and 2 percent in Los Angeles and Portland.

    Where does Indianapolis go from here? So far, Indianapolis has shown resiliency in the current economic crisis. The December 2009 unemployment rate was 6.7 percent, which is below the 7.2 percent national rate. Other parts of Indiana are not doing nearly as well, especially in smaller metropolitan areas that rely to a greater extent on manufacturing. For example, unemployment has reached 15 percent in Elkhart.

    To some extent, the metropolitan area’s huge advantage in housing affordability has been eroded by the collapse of prices in the most expensive Sun Belt metropolitan areas, such as in California and Florida. Yet, Indianapolis remains far more affordable, even after these losses.

    Indianapolis also has an advantages for business. In the State Business Tax Climate Index, Indiana is ranked highly, at 14th in the nation. With the prospect of higher taxes, both at the federal level and in many states, this should help Indianapolis retain an impressive advantage and continue to perform as if it were a Sun Belt metropolitan area, but without the problems associated with the housing bubble, massive congestions and growing social inequality.

    Wendell Cox is a Visiting Professor, Conservatoire National des Arts et Metiers, Paris. He was born in Los Angeles and was appointed to three terms on the Los Angeles County Transportation Commission by Mayor Tom Bradley. He is the author of “War on the Dream: How Anti-Sprawl Policy Threatens the Quality of Life.

  • Don’t Mess With Census 2010

    The announcement last week that Congressional Black Caucus members plan to press President Obama to keep the 2010 census under White House supervision, even if the former Democratic Governor of Washington, Gary Locke, is confirmed as Commerce Secretary, brought back memories of a movie I’d seen before — a bad movie.

    The statement came from Rep. William Lacy Clay, D-Mo., the caucus’ leading voice on the census, and chairman of the House Oversight and Government Reform panel, which has jurisdiction over the decennial count. His assertion that the White House needs “to be hands-on, very much involved in selecting the new census director as well as being actively involved and interested in the full and accurate count,” suggests that the partisan gap about what the census should accomplish is no closer to being closed than it was ten years ago when we last undertook the constitutionally mandated exercise in counting everyone living in America. The gap was so big last time that it helped bring about the complete shutdown of the United States government.

    When Newt Gingrich became speaker of the House he decided, in his own paranoid way, that Bill Clinton and the Democrats would use their executive authority to produce a biased census whose over-count of minorities would shift, in his opinion, twenty-four House seats from the Republicans to the Democrats after the 2000 census. Of course, it was ludicrous to think such an outcome would occur, since legislative boundaries are drawn by the party in power in each state. Whatever numbers the census produces in our decennial exercise can be manipulated to produce any outcome each state’s ruling party desires, as Congressman Tom DeLay and his Texas Republican cronies proved a few years ago. Nevertheless, Gingrich was determined to use the Congressional appropriations process to undercut any attempt by the Democrats to overstate minority populations in the several states.

    The method by which this nefarious plot was to be carried out, in the Republican party’s opinion, was by the use of a large sample of Americans to be surveyed at the same time as the actual count, or enumeration, required by the Constitution was taking place. In response to concerns about previous census inaccuracies — both overcounts and undercounts — the National Academy of Sciences had recommended that the Census Bureau use survey sampling techniques to validate not just the overall count but the individual demographic sub-groups that the census’s enumeration process would identify. But this was a hugely expensive undertaking. To gain statistical accuracy, about 1.3 million Americans would have to respond to a lengthy survey that would cost about a half a billion dollars to execute. And it was this expenditure that Gingrich refused to appropriate. When he and Clinton came to the ultimate showdown on funding the government Gingrich blinked.

    As part of the budget settlement that reopened the government after the shutdown, Clinton forced him to reinstate funding for the sample survey. But despite having established the primacy of the White House in the conduct of the census, matters actually got worse for awhile. When I became Director of the National Partnership for Reinventing Government (NPR) under Vice President Al Gore, I was asked to monitor the implementation of the census to be sure it was done as effectively and as efficiently as possible. But the first idea on how to accomplish that came straight out of the same White House partisan playbook that is now being invoked by the Congressional Black Caucus.

    In order to assure that the process was “bi-partisan,” it was suggested that a commission be established made up of equal numbers of Republicans and Democrats who would oversee the activity on behalf of the Congress. Since the commission was to be equally divided, the Clinton White House wanted to make sure that only the most partisan Democrats — those who would never concede an inch to their Republican counterparts on issues such as funding and methodology — were selected. Names like Harold Ickes, Supervisor Gloria Molina, and Congresswoman Maxine Waters were discussed as representative of the type of Democrat who would make sure the use of sampling to confirm the accuracy of the count was preserved. Fortunately, thanks to the eloquence of Rob Shapiro, the Undersecretary for the Department of Commerce who had the actual authority to supervise the Census, cooler heads in the Vice President’s office were able to prevail over their White House counterparts, and the Commission notion was abandoned.

    But that didn’t stop the two parties from continuing their warfare over the value of a sample supplemented census vs. a straight enumeration. Republicans sued the Census Bureau in federal court, demanding that only the actual count of residents as provided in the Constitution be used for any Congressional redistricting by the states. The Federal Appeals court dismissed the Republican lawsuit as none of the Court’s business. Foreshadowing the outcome of Gore v. Bush in 2000, the Supreme Court surprisingly took up the case and overturned the Appeals court ruling. As a result, all subsequent redistricting efforts have used only the enumeration count from the 2000 census. On the other hand, formulas used to allocate federal funds based on population characteristics were unaffected by the ruling and could have used the sampling process, had it not met an untimely and unnecessary death.

    As soon as George W. Bush was elected and the incredibly professional Director of the Census Bureau, Ken Prewitt, was removed from office, the Commerce Department’s new partisan Secretary, Donald Evans, determined that the sample that had been prepared over the strong objections of Congressional Republicans was not useable. Sampling, as originally conceived, was never implemented, and the country ended up relying on a very strong effort to count households and those living in them for its 2000 census. This method tends to overcount families with two houses, who respond to the census form at both of their addresses, and college students who generally answer the form from their dorm room while their parents report them as still in their household back home. And, of course, it tends to undercount less affluent populations with fewer physical ties to a specific dwelling, particularly Native Americans, and to some degree Hispanics and African Americans.

    Despite these problems, a sampling approach could not be used to help correct inaccuracies in this year’s census, even if Rahm Emanuel himself were to oversee it. We are too far along in the process to recreate it. There is, however, a substitute available that should alleviate the concerns of all but the most stubborn partisans on both sides of the issue. Under the Gore reinvention initiative, the Census Bureau conceived of a concept now known as the American Community Survey. It was designed to survey a vast quantity of households over time to acquire the kind of detailed demographic data that was usually obtained from the subset of the population, about one in ten, who were asked to complete the “long form” of the census questionnaire every ten years. Republicans hated this form and the type of questions it asked; they saw it as an unlawful intrusion on the privacy of families by the federal government. Those of us in charge of reinventing the federal government thought the ACS could be a much more scientific and efficient way of collecting this essential data, but our challenge was to keep it from becoming a political football in the partisan warfare over the census.

    Finally, it was agreed that the Clinton administration budget proposals would include a continuing increase in funds for the ACS. In order to garner Republican support, ACS would be justified as a way to eliminate the long form by 2010. The budget request was forwarded by the head of ACS directly to the Vice President’s office, which made it a priority each year, but which never publicly acknowledged any interest in the concept. The ruse worked and the project became a reality. The long form will not be used in the upcoming census because the ACS has gathered, over time, sufficient data on the demographic details of America’s population as to make it unnecessary.

    Given the existence of the ACS, those now waging a battle over sampling vs. enumeration are truly guilty of fighting today’s war with yesterday’s weapons. In this new era, those who have a legitimate interest in as complete and accurate a census as possible should instead direct their efforts to the neighborhoods where the accuracy of the count will actually be determined. During the last count, the Census Bureau formed hundreds of thousands of partnerships with community groups interested in making sure that everyone they knew got counted. Today, these programs, as well as projects such as former Detroit Mayor Dennis Archer’s “Nosy Neighbors” campaign, are the best way to ensure an accurate outcome.

    The responsibility for America’s next census does not and should not rest with the White House. But President Obama’s experience does offer some direction: neighborhood organizing is key. Let’s hope that community leaders will follow the advice to ‘pick yourself up and dust yourself off’… and undertake the huge task of ensuring that every person is present and accounted for in America’s next census.

    Morley Winograd is co-author, with Michael D. Hais of Millennial Makeover: MySpace, YouTube, and the Future of American Politics, now available in paperback. Both of them are fellows with NDN, a progressive think tank, which is also home to his blog.

  • Urban Inequality Could Get Worse

    President Obama’s stated objective to reduce inequality, as laid out in public addresses and budget plans, is a noble one. The growing income gap – not only between rich and poor, but also between the ultra-affluent and the middle class – poses a threat both to the economy and the long-term viability of our republic.

    But ironically, what seems to be the administration’s core proposal, ratcheting up the burden on “rich” taxpayers earning over $250,000, could have unintended consequences. For one thing, it would place undue stress on the very places that have been Obama’s strongest supports, while providing an unintended boost to those regions that most oppose him.

    At the heart of the matter is the age-old debate about who is “rich.” If you define wealthy as $250,000 a year for a family of four, that means different things in different places. America is a vast country, and the cost of living varies widely. What seems a princely sum in, say, red state Oklahoma City is barely enough to eke out a basic middle-class life in blue bastions like New York, Los Angeles or San Francisco.

    In the recent study on the New York middle class that I conducted with Jonathan Bowles at the Center for an Urban Future, we compared the cost of a “middle class” standard of living in New York and other cities. The report found that Manhattan is by far the most expensive urban area in the country, with a cost of living that’s more than twice the national average. (This is according to a cost of living index developed by the ACCRA, a research group formerly known as the American Chamber of Commerce Researchers Association.)

    But even Queens, the city’s middle-class haven and the only other borough included in the ACCRA analysis, suffers the eighth highest cost of living in the country.

    What does that mean? An individual from Houston who earns $50,000 would have to make $115,769 in Manhattan and $81,695 in Queens to live at the same level of comfort. Similarly, earning $50,000 in Atlanta is the equivalent of earning $106,198 in Manhattan and $74,941 in Queens. (See “New York Should End Its Obsession With Manhattan.”)

    The cost of housing constitutes one critical part of the difference. Average monthly rent in New York was $2,720 in the fourth quarter of 2007, by far the top in the nation. That total was both 55% higher than the second place city, San Francisco, where average effective rents are $1,760, and nearly triple the national average of $975.

    Even in relative boom times, such high costs have been driving many out of New York, and now it could get worse. During tough times, people’s incomes drop, so they are less able to absorb high costs and taxes, which are rising in many blue cities and states. Imposing more taxes on some label-rich New Yorkers or Angelenos, who earn $250,000 a year, won’t make them more likely to stay.

    Perhaps even worse, higher taxes probably won’t help the inequality issue. True, historically and to this day, the greatest levels of inequality occur in low-tax areas like the Mississippi Delta, the Rio Grande Valley and Appalachia. But, increasingly, this unsavory distinction is shared by big cities like New York, Los Angeles and Chicago. In contrast, the most egalitarian states are generally deep red places – such as the Dakotas, Alaska, Nebraska and Wyoming.

    Higher costs – manifested in everyday expenses like sales taxes and energy bills – now contribute in a large way to growing inequality even in the richest, most elite cities. When housing and other costs are factored in, notes researcher Deborah Reed of the left-leaning Public Policy Institute of California, deep-blue mainstays Los Angeles and San Francisco rank among the top 10 counties in America with respect to the percentage of people in poverty. Only New York and Washington, D.C., do worse.

    Worst of all, the rise of inequality in these high-cost blue cities seems to be connected to policy decisions. High taxes and strict regulations have expelled relatively well-paying blue collar jobs in manufacturing and warehousing from expensive urban areas. Without them, an extremely bifurcated economy and society forms because no traditional ladders for upward mobility remain; they are critical to a successful urbanity.

    Back in the 1960s, Jane Jacobs predicted that Latino immigrants to New York, mainly from Puerto Rico, would inevitably make “a fine middle class.” Yet four decades later, in the Bronx, the city’s most heavily Latino county, roughly one in three households lives in poverty – the highest rate of any urban county in the nation.

    At the other extreme, in Manhattan, where the rich are concentrated, the disparities between socioeconomic classes have been rising steadily. In 1980, the borough ranked 17th among the nation’s counties for social inequality; today it ranks first, with the top fifth of wage earners earning 52 times that of the lowest fifth, a disparity roughly comparable to that of Namibia.

    To an old-fashioned Truman Democrat like me, this is bad news. But some modern-day “progressives,” like Richard Florida, celebrate the concentration of rich people. They see them as guarantors that places like New York will be the winners of the post-crash economy. The losers? Goods-producing regions of the Great Plains, the industrial Midwest and, of course, those unenlightened, suburban middle-class people.

    Yet it seems more and more likely that raising taxes for urban middle-income workers will, over the long term, add to the flood of people fleeing to less costly locales with lower taxes. This will be particularly true for the growing ranks of information economy “artisans” who might find critical write-offs for home offices and other business expenses cut from their next tax return.

    None of this is necessary. The “creative destruction” resulting from the downturn might actually prove a boon to these big cities – by making them more affordable for the urban middle class. This help would be accelerated if city governments – as in Los Angeles, New York, Houston and even San Francisco during the early 1990s – nurture local businesses.

    But “growth” – a word not widely embraced in this greenest of administrations – does not seem to be a priority in either Washington or in most city halls. There are murmurs that investment in high-cost, subsidized alternative energy will create vast numbers of new jobs, but this is likely just wishful thinking for everyone but Al Gore’s business partners.

    This is not to say cities’ policies need to return to Bush-style Republicanism. Tax breaks for big-time investors and real estate speculators do not make a sustainable urban policy either. What’s needed is something closer to lunch-bucket liberalism, which focuses on productivity-enhancing initiatives and sparking entrepreneurial growth. America – its cities in particular – could do with more private-sector stimulation and a lot less high-minded social engineering.

    With policies geared toward the latter at the expense of the former, one of the great ironies of the Obama era will continue to unfold.

    By targeting the urban middle class to pay for its deficit and new social programs, the president’s plan could end up draining wealth – and boosting inequality – from our nation’s great cities, where he currently draws overwhelming support, to its hinterlands. Not exactly what the White House had in mind, no doubt, but, sadly, it’s a distinct possibility.

    This article originally appeared at Forbes.

    Joel Kotkin is executive editor of NewGeography.com and is a presidential fellow in urban futures at Chapman University. He is author of The City: A Global History and is finishing a book on the American future.

  • The Aging of Paradise in Ventura County California

    You could say that Ventura County, just north of Los Angeles, represents what is best about California. Some people believe that its amenities – beaches, gorgeous interior valleys and parks – assure perpetual economic growth for Ventura County and California. They are wrong. There is trouble in paradise.

    Ventura County has changed, and not for the better. It is aging, losing its demographic as well as economic vitality. This represents a relatively new phenomenon, the slow decline of even formerly healthy suburban areas.

    The current recession illustrates the change. In the past Ventura County suffered mild recessions even as the country and the region suffered mightily. The County saw no annual net job losses in the 2001 recession. The early 1990s recession was more painful, but Ventura County did far better than California as a whole.

    All of that has changed with the current recession. Ventura County has recently been losing jobs at a faster pace than California. In 2007, the County lost jobs while California gained jobs.

    The picture is even worse when Ventura County’s economy is compared to the Los Angeles County economy. In 2008, Ventura County’s economy shrank at a rate about five times faster than did Los Angeles’s economy.

    What is going on here? In the past, Ventura County has been buffered by its twin giants, Amgen and Countrywide. Amgen’s Ventura County growth has slowed. Countrywide has done much worse than Amgen, and its demise has been well documented.

    But you can’t blame all of Ventura County’s weakness on Countrywide. It has contributed, but it is not Ventura County’s sole source of economic weakness. The weakness is quite general, spanning the construction sector, non-durable manufacturing, retail trade and other services. Each lost over 1,000 jobs in 2008. By contrast, the finance, insurance, and real estate sectors, where Countrywide resides, lost just fewer than 900 jobs, accounting for about 4 percent of the job losses.

    My sense is the real underlying problem is demographic, and this may not go away even if the economy recovers. One clue is that more people have been leaving Ventura County than moving in from all sources, and this has been happening long enough to be a trend. It reflects still-high housing costs and limited opportunity. It implies a weak future.

    This chart shows that in exactly half of the past 16 years, migration has been negative. That is total migration, not just domestic migration.

    Think about this for a moment. More people are leaving Ventura County than are moving in. That is certainly counter to what has happened in most of the past 150 years.

    Ventura County’s net out migration has impacts beyond its effect on the size of the population. The composition of the county is also changing, away from working age people and families and towards people either close to retirement or already there.

    The above chart compares relative changes, by age cohort, in Ventura County’s population since the 2000 census with changes in the United States population since the 2000 census. The County’s population between 25 and 44 years of age and their children has been collapsing. At the same time, the County’s populations of both young adults and people over 45 have been growing as a percentage of the total population. The bulk of that growth has occurred in the over 55 cohort.

    The migration out of Ventura County has also resulted in changes to the County’s income distribution. The following chart compares changes in the County’s income distribution to changes in the United States income distribution since the 2000 census:

    The comparisons are telling. The County has been losing very-low-income people at a slower pace than has the United States. At the same time, the growth in population with incomes over $100,000 has been spectacular. The local population with incomes between $25,000 and $75,000 has fallen far more rapidly than that of the United States. The County’s population with incomes between $75,000 and $100,000 is relatively unchanged, while that of the United States has shown significant growth.

    People – particularly in the late 20s and early 30s – aren’t leaving Ventura County because amenities have suddenly disappeared. They are leaving because of a deficit in opportunity. Their leaving has consequences. Ventura County’s population is aging more rapidly than it otherwise would. The net result of these demographic changes is that Ventura County’s median real per-capita income is declining, while the County’s median age is rising. Real per-capita personal income has fallen almost $1,000 in only eight years, to $32,718 (Constant 2000 dollars) from $33,797 in 2000.

    Ventura County’s demographic changes can be easily summarized. It is losing its middle class and becoming bi-modal. The young families that provide a community’s vigor and future have been leaving. There is no reason to believe that the trend will reverse itself. Ventura County home prices are still relatively high, while opportunity is declining.

    The County is left with an aging and increasingly wealthy population along with the lower-income people that service the wealthy aged and the very-low-income farm workers. In a sense, it now resembles what we see in many expensive city cores – even if it is on the periphery!

    This creates enormous risks. Most amenities are luxury goods. Poor people don’t invest in luxury goods. Generally, the lower-income population does not have the resources to provide leadership or invest in a community’s future. They have their hands full just taking care of their families, particularly in an expensive place like Ventura County. Their children will likely join the middle class, but in someplace more affordable like Texas, Arizona, or Nevada.

    High concentrations of older people and declining incomes are often associated with deteriorating schools, amenities and increasing crime. The aged wealthy are not in Ventura County to invest in its future. They are there to consume it. They will not invest in the future – particularly if their children and relatives have gone elsewhere.

    Ventura County is not unique. It is fairly representative of Coastal California. Communities like Ventura, Goleta, and San Luis Obispo used to be middle-class communities that valued opportunity. Things are even more extreme in California’s elite playgrounds: Monterey, Malibu, and Santa Barbara. Populations in Monterey and Santa Barbara have actually declined over the past several years. Similar phenomena may be noticeable in other formerly elite suburbs within our most favored metropolitan areas.

    These changes present serious challenges to California’s workers, businesses, and those policy makers who still care about something other than greenhouse gases and public employee pensions. Something needs to be done, and quickly. But the immediate prognosis is less than encouraging. Like Ventura County, California is suffering its worst recession in decades, and policy makers don’t seem to be focusing on policies that may help the area return to its previous status as a region of opportunity.

    Portions of this essay have previously appeared in a UCSB-EFP Ventura County Forecast.

    Bill Watkins, Ph.D. is the Executive Director of the Economic Forecast Project at the University of California, Santa Barbara. He is also a former economist at the Board of Governors of the Federal Reserve System in Washington D.C. in the Monetary Affairs Division.

  • Democrats Could Face an Internal Civil War as Gentry and Populist Factions Square Off

    This is the Democratic Party’s moment, its power now greater than any time since the mid-1960s. But do not expect smooth sailing. The party is a fractious group divided by competing interests, factions and constituencies that could explode into a civil war, especially when it comes to energy and the environment.

    Broadly speaking, there is a long-standing conflict inside the Democratic Party between gentry liberals and populists. This division is not the same as in the 1960s, when the major conflicts revolved around culture and race as well as on foreign policy. Today the emerging fault-lines follow mostly regional, geographical and, most importantly, class differences.

    Gentry liberals cluster largely in cities, wealthy suburbs and college towns. They include disproportionately those with graduate educations and people living on the coasts. Populists tend to be located more in middle- and working-class suburbs, the Great Plains and industrial Midwest. They include a wider spectrum of Americans, including many whose political views are somewhat changeable and less subject to ideological rigor.

    In the post-World War II era, the gentry’s model candidate was a man such as Adlai Stevenson, the Democratic presidential nominee who lost twice to Dwight D. Eisenhower. Stevenson was a svelte intellectual who, like Barack Obama, was backed by the brute power of the Chicago machine. After Stevenson, the gentry supported candidates such as John Kennedy – who did appeal to Catholic working class voters – but also men with limited appeal outside the gentry class, including Eugene McCarthy, George McGovern, Gary Hart, Bill Bradley, Paul Tsongas and John Kerry.

    Hubert Humphrey, a populist heir to the lunch-pail liberalism of Harry Truman (and who was despised by gentry intellectuals) missed the presidency by a hair in 1968. But populists in the party later backed lackluster candidates such as Walter Mondale and Dick Gephardt.

    Bill Clinton revived the lunch-pail Democratic tradition; and the final stages of last year’s presidential primaries represented yet another classic gentry versus populist conflict. Hillary Clinton could not match Barack Obama’s appeal to the gentry. Driven to desperation, she ended up running a spirited populist campaign.

    Although peace now reigns between the Clintons and the new president, the broader gentry-populist split seems certain to fester at both the congressional and local levels – and President Obama will be hard-pressed to negotiate this divide. Gentry liberals are very “progressive” when it comes to issues such as affirmative action, gay rights, the environment and energy policy, but are not generally well disposed to protectionism or auto-industry bailouts, which appeal to populists. Populists, meanwhile, hated the initial bailout of Wall Street – despite its endorsement by Mr. Obama and the congressional leadership.

    Geography is clearly a determining factor here. Standout antifinancial bailout senators included Sens. Byron Dorgan of North Dakota, Tim Johnson of South Dakota, and Jon Tester of Montana. On the House side, the antibailout faction came largely from places like the Great Plains and Appalachia, as well as from the suburbs and exurbs, including places like Arizona and interior California.

    Gentry liberals, despite occasional tut-tutting, fell lockstep for the bailout. Not one Northeastern or California Democratic senator opposed it. In the House, “progressives” such as Nancy Pelosi and Barney Frank who supported the financial bailout represent districts with a large concentration of affluent liberals, venture capitalists and other financial interests for whom the bailout was very much a matter of preserving accumulated (and often inherited) wealth.

    Energy and the environment are potentially even more explosive issues. Gentry politicians tend to favor developing only alternative fuels and oppose expanding coal, oil or nuclear energy. Populists represent areas, such as the Great Lakes region, where manufacturing still plays a critical role and remains heavily dependent on coal-based electricity. They also tend to have ties to economies, such as in the Great Plains, Appalachia and the Intermountain West, where smacking down all new fossil-fuel production threatens lots of jobs – and where a single-minded focus on alternative fuels may drive up total energy costs on the farm, make life miserable again for truckers, and put American industrial firms at even greater disadvantage against foreign competitors.

    In the coming years, Mr. Obama’s “green agenda” may be a key fault line. Unlike his notably mainstream appointments in foreign policy and economics, he’s tilted fairly far afield on the environment with individuals such as John Holdren, a longtime acolyte of the discredited neo-Malthusian Paul Ehrlich, and Carol Browner, who was Bill Clinton’s hard-line EPA administrator.

    These appointments could presage an environmental jihad throughout the regulatory apparat. Early examples could mean such things as strict restrictions on greenhouse gases, including bans on new drilling and higher prices through carbon taxes or a cap-and-trade regime.

    Another critical front, not well understood by the public, could develop on land use – with the adoption of policies that favor dense cities over suburbs and small towns. This trend can be observed most obviously in California, but also in states such as Oregon where suburban growth has long been frowned upon. Emboldened greens in government could use their new power to drive infrastructure spending away from badly needed projects such as new roads, bridges and port facilities, and toward projects such as light rail lines. These lines are sometimes useful, but largely impractical outside a few heavily traveled urban corridors. Essentially it means a transfer of subsidies from those who must drive cars to the relative handful for whom mass transit remains a viable alternative.

    Priorities such as these may win plaudits in urban enclaves in New York, Boston and San Francisco – bastions of the gentry class and of under-35, childless professionals – but they might not be so widely appreciated in the car- and truck-driving Great Plains and the vast suburban archipelago, where half the nation’s population lives.

    If he wishes to enhance his power and keep the Democrats together, Mr. Obama will have to figure out how to placate both his gentry base and those Democrats who still see their party’s mission in terms that Harry Truman would have understood.

    This article originally appeared at Wall Street Journal.

    Joel Kotkin is executive editor of NewGeography.com and is a presidential fellow in urban futures at Chapman University. He is author of The City: A Global History and is finishing a book on the American future.

  • Death of the California Dream

    For decades, California has epitomized America’s economic strengths: technological excellence, artistic creativity, agricultural fecundity and an intrepid entrepreneurial spirit. Yet lately California has projected a grimmer vision of a politically divided, economically stagnant state. Last week its legislature cut a deal to close its $42 billion budget deficit, but its larger problems remain.

    California has returned from the dead before, most recently in the mid-1990s. But the odds that the Golden State can reinvent itself again seem long. The buffoonish current governor and a legislature divided between hysterical greens, public-employee lackeys and Neanderthal Republicans have turned the state into a fiscal laughingstock. Meanwhile, more of its middle class migrates out while a large and undereducated underclass (much of it Latino) faces dim prospects. It sometimes seems the people running the state have little feel for the very things that constitute its essence — and could allow California to reinvent itself, and the American future, once again.

    The facts at hand are pretty dreary. California entered the recession early last year, according to the Forecast Project at the University of California, Santa Barbara, and is expected to lag behind the nation well into 2011. Unemployment stands at roughly 10 percent, ahead only of Rust Belt basket cases like Michigan and East Coast calamity Rhode Island. Not surprisingly, people are fleeing this mounting disaster. Net outmigration has been growing every year since about 2003 and should reach well over 200,000 by 2011. This outflow would be far greater, notes demographer Wendell Cox, if not for the fact that many residents can’t sell their homes and are essentially held prisoner by their mortgages.

    For Californians, this recession has been driven by different elements than the early-1990s downturn, which was largely caused by external forces. The end of the Cold War stripped away hundreds of thousands of well-paid defense-related jobs. Meanwhile, the Japanese economy went into a tailspin, leading to a massive disinvestment here. In South L.A., the huge employment losses helped create the conditions conducive to social unrest. The 1992 Rodney King verdict may have provided the match, but the kindling was dry and plentiful.

    This time around, the recession feels like a self-inflicted wound, the result of “bubble dependency.” First came the dotcom bubble, centered largely in the Bay Area. The fortunes made there created an enormous surge in wealth, but by 2001 that bust had punched a huge hole in the California budget. Voters, disgusted by the legislature’s inability to cope with the crisis, recalled the governor, Gray Davis, and replaced him with a megastar B-grade actor from Austria.

    Yet almost as soon as the Internet bubble had evaporated, a new one emerged in housing. As prices soared in coastal enclaves, people fled to the periphery, often buying homes far from traditional suburban job centers. At first, it seemed like a miraculous development: people cheered as their home’s “value” increased 20 percent annually. But even against the backdrop of the national housing bubble, California soon became home to gargantuan imbalances between incomes and property prices. The state was also home to such mortgage hawkers as New Century Financial Corp., Countrywide and IndyMac. For a time the whole California economy seemed to revolve around real-estate speculation, with upwards of 50 percent of all new jobs coming from growth in fields like real estate, construction and mortgage brokering.

    As a result, when the housing bubble burst, the state’s huge real-estate economy evaporated almost overnight. Both parties in the legislature and the governor failed miserably to anticipate the impending fiscal deluge they should have known was all but inevitable.

    To many longtime California observers, the inability of the political, business and academic elites to adequately anticipate and address the state’s persistent problems has been a source of consternation and wonderment. In my view, the key to understanding California’s precipitous decline transcends terms like liberal or conservative, Democratic and Republican. The real culprit lies in the politics of narcissism.

    California, like any gorgeously endowed person, has a natural inclination toward self-absorption. It has always been a place of unsurpassed splendor; it has inspired and attracted writers, artists, dreamers, savants and philosophers. That’s especially true of the Bay Area—ground zero for California narcissism and arguably the most attractive urban expanse on the continent; Neil Morgan in 1960 described San Francisco as “the narcissus of the West,” a place whose fundamental asset was first its own beauty, followed by its own culture of self-regard.

    At first this high self-regard inspired some remarkable public achievements. California rebuilt San Francisco from the ashes of the great 1906 fire, and constructed in Los Angeles the world’s most far-reaching transit system. These achievements reached a pinnacle under Gov. Pat Brown, who in the 1960s oversaw the expansion of the freeways, the construction of new university, state- and community-college campuses, and the creation of water projects that allowed farming in dry but fertile landscapes.

    Yet success also spoiled the state, incubating an ever more inward-looking form of narcissism. Even as the middle class enjoyed “the good life” — high-paying jobs, single-family homes (often with pools), vacations at the beach — there was a growing, palpable sense of threats from rising taxes, a restless youth population and a growing nonwhite demographic. One early expression of this was the late-1970s antitax movement led by Howard Jarvis. The rising cost of government was placing too much of a burden on middle-class homeowners, and the legislature refused to address the problem with reasonable reforms. The result, however, was unreasonable reform, with new and inflexible limits on property and income taxes that made holding the budget together far more difficult.

    Middle-class Californians also began to feel inundated by a racial tide. This was not totally based on prejudice; Californians seemed to accept legal immigration. But millions of undocumented newcomers provoked fear that there were no limits on how many people would move into the state, filling emergency rooms with the uninsured and crowding schools with children whose parents neither spoke English nor had the time to prepare their children for school. By 1994, under Gov. Pete Wilson, the anti-immigrant narcissism fueled Proposition 187. It was now OK to deny school and medical services to people because, at the end, they looked different.

    Today the politics of narcissism is most evident among “progressives.” Although the Republicans can still block massive tax increases, the predominant force in California politics lies with two groups — the gentry liberals and the public sector. The public-sector unions, once relatively poorly paid, now enjoy wages and benefits unavailable to most middle-class Californians, and do so with little regard to the fiscal and overall economic impact. Currently barely 3 percent of the state budget goes to building roads or water systems, compared with nearly 20 percent in the Pat Brown era; instead we’re funding gilt-edged pensions and lifetime guaranteed health care. It’s often a case of I’m all right, Jack — and the hell with everyone else.

    The most recent ascendant group are the gentry liberals, whose base lies in the priciest precincts of San Francisco, the Silicon Valley and the west side of Los Angeles. Gentry liberalism reflects the narcissistic values of successful boomers and their offspring; their politics are all about them. In the past this was tied as much to cultural issues, like gay rights (itself a noble cause) and public support for the arts. More recently, the dominant issue revolves around environmentalism.

    Green politics came early to California and for understandable reasons: protecting the resources and beauty of the nation’s loveliest landscapes. Yet in recent years, the green agenda has expanded well beyond that of the old conservationists like Theodore Roosevelt, who battled to preserve wilderness but also cared deeply about boosting productivity and living standards for the working classes. In contrast, the modern environmental movement often adopts a largely misanthropic view of humans as a “cancer” that needs to be contained. By their very nature, the greens tend to regard growth as an unalloyed evil, gobbling up resources and spewing planet-heating greenhouse gases.

    You can see the effects of the gentry’s green politics up close in places like the Salinas Valley, a lovely agricultural region south of San Jose. As community leaders there have tried to construct policies to create new higher-wage jobs in the area (a project on which I’ve worked as a consultant), local progressives — largely wealthy people living on the Monterey coast — have opposed, for example, the expansion of wineries that might bring new jobs to a predominantly Latino area with persistent double-digit unemployment. As one winegrower told me last year: “They don’t want a facility that interferes with their viewshed.” For such people, the crusade against global warming makes a convenient foil in arguing against anything that might bring industrial or any other kind of middle-wage growth to the state. Greens here often speak movingly about the earth — but also about their personal redemption. They have engaged a legal and regulatory process that provides the wealthy and their progeny an opportunity to act out their desire to “make a difference” — often without real concern for the outcome. Environmentalism becomes a theater in which the privileged act out their narcissism.

    It’s even more disturbing that many of the primary apostles of this kind of politics are themselves wealthy high-livers like Hollywood magnates, Silicon Valley billionaires and well-heeled politicians like Arnold Schwarzenegger and Jerry Brown. They might imagine that driving a Prius or blocking a new water system or new suburban housing development serves the planet, but this usually comes at no cost to themselves or their lifestyles.

    The best great hope for California’s future does not lie with the narcissists of left or right but with the newcomers, largely from abroad. These groups still appreciate the nation of opportunity and aspire to make the California — and American — Dream their own.

    Of course, companies like Google and industries like Hollywood remain critical components, but both Silicon Valley and the entertainment complex are now mature, and increasingly dominated by people with access to money or the most elite educations. Neither is likely to produce large numbers of new jobs, particularly for working- and middle-class Californians.

    In contrast, the newcomers, who often lack both money and education, continue in the hierarchy-breaking tradition that made California great in the first place. Many of them live and build their businesses not in places like San Francisco or West L.A., but in the increasingly multicultural suburbs on the periphery, places like the San Gabriel Valley, Riverside and Cupertino. Immigrants played a similar role in the recovery from the early-1990s doldrums. In the ’90s, for example, the number of Latino-owned businesses already was expanding at four times the rate of Anglo ones, growing from 177,000 to 440,000. Today we see signs of much the same thing, though it often involves immigrants from the Middle East, the former Soviet Union, Mexico or South Korea. One developer, Alethea Hsu, just opened a new shopping center in the San Gabriel Valley this January — and it’s fully leased. “We have a great trust in the future,” says the Cornell-trained physician.

    You see some of the same thing among other California immigrants. More than three decades ago the Cardenas family started slaughtering and selling pigs grown on their two-acre farm near Corona. From there, Jesús Sr. and his wife, Luz, expanded. “We would shoot the hogs through the head and sell them off the truck,” says José, their son. “We’d sell the meat to people who liked it fresh: Filipinos, Chinese, Koreans and Hispanics…We would sell to anyone.” Their first store, predominantly a carnicería, or meat shop, took advantage of the soaring Latino population. By 2008, they had 20 stores with more than $400 million in sales. In 2005 they started to produce Mexican food, including some inspired by Luz’s recipes to distribute through such chains as Costco. Mexican food, notes Jesús Jr., is no longer a niche. “It’s a crossover product now.”

    Despite the current mess in Sacramento, this suggests some hope for the future. Perhaps the gubernatorial candidacy of Silicon Valley folks like former eBay CEO Meg Whitman (a Republican), or her former eBay employee Steve Wesley (a Democrat), could bring some degree of competence and common sense to the farce now taking place in Sacramento. Sen. Dianne Feinstein, who’s said to be considering the race, would also be preferable to a green zealot like Jerry Brown or empty suits like Los Angeles Mayor Antonio Villaraigosa or San Francisco’s Gavin Newsom.

    But if I am looking for hope and inspiration, for California or the country, I would look first and foremost at people like the Cardenas family. They create jobs for people who didn’t go to Stanford or whose parents lack a trust fund. They constitute what any place needs to survive: risk takers who are self-confident but rarely selfish. These are people who look at the future, not in the mirror.

    This article originally appeared at Newsweek.

    Joel Kotkin is executive editor of NewGeography.com and is a presidential fellow in urban futures at Chapman University. He is author of The City: A Global History and is finishing a book on the American future.

  • Does a low number of home staters mean everyone has left?

    Last week I took a look at the share of US born residents in each state born in their current state of residence. Some on other blogs wondered if a low share of native born in a state meant that everyone has left or if instead that state is a big lure to out-of-staters. Aside from a few outliers, it seems to be the latter. Take a look at this quick analysis: states with a low share of native born tend to have high net inmigration and states with many born in state tend to have high outmigration.

    It makes sense that in tougher times (evidenced by net outmigration) those with deeper roots find a reason to stick around – or maybe they are just tied down.

    High net inmigration, low native born states tend to be high in natural amenities (read: mountains) or recent boom states in the west – many of which may have capitalized on the exodus from California. Note that North and South Carolina, Georgia, and Tennessee have similar numbers.

    Most interesting is the grouping towards the upper right: states with both above average number of those born in state and positive or near positive migration. Could this signal a return of the diaspora to states like Texas, Kentucky, Alabama, Utah, or even Wisconsin and Pennsylvania?

  • Don’t Politicize the Census Bureau

    The recent decision by the Obama Administation to place the Census under the control of the White House represents a danger – not only to the integrity of the process but to the underlying assumptions that drive policy in a representative democracy. It is something that smacks of the worst anti-scientific views of the far right, or the casual political manipulation of the facts one expects in places like Russia or Iran.

    Let me be clear: I love the Bureau of the Census. I have been an avid consumer of its data since the second grade. I used to wait with anticipation for the decennial results – the 10 year population counts for states, counties and cities. Anyone who has spent any time on the Demographia websites knows the respect with which I treat Census data.

    The United States established one of the first regular censuses and it has been conducted every 10 years since 1790. The United Kingdom followed in 1801 and France in 1807, though both nations suspended their counts during World War II.

    Over the past couple of decades, the Bureau of the Census has made annual estimates widely available, so it was no longer necessary to wait for the 10 year results. This was an important step in the right direction for people interested in demographics. But, there was a more basic purpose than amusing people who make their living with numbers. As federal programs that allocate money to local jurisdictions based upon their population have become more widespread, interim annual census estimates became a necessity.

    Before the interim estimates, all sorts of “cheerleading” estimates were published, like the more than 1,000,000 population estimate I discovered for Washington, DC in the 1950s (the city never exceeded 800,000 by much). The great thing about the Bureau of the Census was that you could trust the numbers.

    Trust and accuracy were precisely what the framers had in mind when they wrote the regular decennial Census enumeration (count) into the US Constitution. The principal purpose, of course, was to apportion seats in the House of Representatives. A genuine democracy depends on ensuring all are represented equally and thus depends upon the integrity of its census.

    Recently, however, the process has become ever more politicized. The Bureau of the Census has allowed counties, cities and other local jurisdictions to challenge their annual census estimates. The incentive, of course, is that if the challenge results in a higher population estimate (and it can be expected that no jurisdiction challenges an estimate it feels is too high), more federal money is the reward.

    I became aware of the problem in watching the recently developing annual challenge ritual by the nearby city of St. Louis, which has lost more of its population than any city since the Romans sacked Carthage. No large local jurisdiction in the world, not even New Orleans, has lost as much of its population as St. Louis, which has experienced a 60 percent decline since 1950.

    So not surprisingly, the city of St. Louis has become a frequent challenger. St. Louis has successfully challenged the Bureau of the Census estimate of its population five of the seven years from 2001 to 2007 (the most recent estimate). The total of additions from census challenges adds up to 43,000 people. This is a not insubstantial 12.4 percent relative to the approximately 348,000 2000 Census count for the city.

    I began to wonder what the success rate was in census challenges. I asked the appropriate Bureau of the Census officials for a list of rejected challenges. The quick and polite response was “We do not have a list of the rejected challenges.” This seemed a strange answer, since the Bureau of the Census website lists all of the successful challenges. Moreover, my internet search for news stories about rejections of census challenge rejections yielded nothing.

    I performed an analysis of the successful challenges posted on the internet. Approximately 200 general purpose local jurisdictions have filed challenges. Nearly 40,000 have not.

    Many of the upheld challenges are in large urban cores, such as 236,000 in the city of New York and more than 100,000 in Atlanta’s core Fulton County. Among the larger jurisdictions, Fulton County added the largest to its 2000 population by challenges, at 13.5 percent.

    However, the challenges are by no means limited to urban cores. Salt Lake City suburbs West Valley City, West Jordan and Sandy challenged their counts, but not core city Salt Lake City. Nearby Provo, no urban jungle, had the largest addition to its population of any jurisdiction over 100,000 population, at 15.2 percent. The Bureau of the Census missed about 2,000 residents between Skokie and Hoffman Estates, headquarters of Sears Roebuck, but not a one in nearby Chicago, which has 25 times as many people as the two suburban jurisdictions combined.

    Overall, 47 jurisdictions with more than 100,000 population in 2000 have successfully challenged census estimates, many in more than one year. The total population addition from these challenges is 1.24 million, though there may be some duplication in city and county numbers. Overall, the census challenges have added a total of nearly 1,600,000 people, which is likely, with duplications, to exceed the population of two Congressional districts. All of the challenging jurisdictions combined had a population of less than 35 million in 2000, or less than 15 percent of the population.

    All of this raises questions. Beyond the questions about rejected challenges, if there have been any, are fundamental questions about Bureau of the Census methods. How can it be that the Census misses by so many people? Why did it presumably miss 15 percent of the population in Provo, 3 percent in New York City and 30 percent in Bazine City, Kansas, while apparently being so accurate in the remaining 85 percent of the nation that no one was missed?

    Why was the Bureau of the Census estimate so erroneous in New York, Boston and San Francisco, yet so accurate in Los Angeles, Philadelphia and Phoenix, where there were no errors?

    Then there is the more fundamental question – have there been any rejections?

    It is possible that everything is on the “up and up” with respect to the Bureau of the Census challenge program. On the other hand, there appears to be plenty of potential for mischief, as some jurisdictions have become experts at challenging and the Bureau may find rejections difficult, given the pressure that could be received from members of Congress.

    But politicization of the Census is a terrible risk. That’s why the Obama administration’s decision to move authority for the Census to the White House from the Department of Commerce is so concerning. It is hard to imagine a function of government so crucial to the genuine working of democracy becoming subject to the whims of people like White House chief of staff, Rahm Emmanuel – or down the road to a similarly partisan figure in the other party, like a Karl Rove.

    The good news is that a bill introduced by New York Democratic Congresswoman Carolyn B. Maloney would assure the census’s integrity. Last year, she introduced the “Restoring the Integrity of American Statistics Act of 2008,” with co-sponsors Henry Gonzales of Texas, Henry Waxman of California and William Clay of Missouri. Congresswoman Maloney’s bill would remove the Bureau of the Census from the Department of Commerce and establish it as an independent federal agency, insulated from the political process. According to the Congresswoman:

    This action will be a clear signal to Americans that the agency they depend upon for unbiased monthly economic data as well as the important decennial portrait of our nation is independent, fair, and protected from interference

    The bill has been endorsed by all seven living former directors of the Bureau of the Census, appointed by Presidents Nixon, Ford, Carter, Reagan, Clinton and both Bushes.

    This is the direction we need to go. The Administration has made much of its commitment to science and open inquiry. Preserving the sanctity of the census process would seem to confirm that commitment. In contrast, putting it under the control of White House political operatives represents a brazen act of political gamesmanship and a shameful turn in the wrong direction. It is to be hoped that the rising political firestorm and the recent withdrawal of Senator Judd Gregg from consideration for the post of Commerce Secretary might lead to a policy reversal.

    Successful Census Estimate Challenges: 2001 to 2007
    State Jurisdiction
    2000 Census Popuation
    Total Population Added in Census Challenges
    Percentage
    OVER 100,000
    NY New York City                   8,008,278                 236,120 2.9%
    TX Houston                    1,954,848                   84,364 4.3%
    NY Suffolk County                   1,419,369                   58,503 4.1%
    NY Nassau County                   1,334,544                   46,528 3.5%
    TX Dallas                    1,188,580                   25,873 2.2%
    MI Detroit                        951,270                   47,728 5.0%
    NY Westchester County                       923,459                     6,912 0.7%
    MD Montgomery County                       873,341                   10,678 1.2%
    AZ Pima County                       843,746                   29,504 3.5%
    GA Fulton County                       816,006                 109,983 13.5%
    CA San Francisco County                       776,733                   34,209 4.4%
    MD Baltimore                        651,154                   75,410 11.6%
    NJ Monmouth County                       615,301                     5,891 1.0%
    WI Milwaukee                        596,974                   29,424 4.9%
    MA Boston                        589,141                   51,540 8.7%
    DC District of Columbia                       572,059                   31,528 5.5%
    TN Davidson County                       545,524                   32,152 5.9%
    LA Orleans Parish                       484,674                   48,989 10.1%
    LA Jefferson Parish                       455,466                   16,819 3.7%
    GA Atlanta                        416,474                   12,440 3.0%
    UT Utah County                       368,536                   25,814 7.0%
    FL Miami                        362,470                   14,943 4.1%
    MO St. Louis                        348,189                   43,012 12.4%
    OH Cincinnati                        331,285                   22,582 6.8%
    OH Toledo                        313,619                   21,822 7.0%
    NY Rockland County                       286,753                     3,208 1.1%
    TX Lubbock County                       242,628                     1,678 0.7%
    VA Norfolk                        234,403                     9,720 4.1%
    VA Arlington County                       189,453                   15,634 8.3%
    NC Winston-Salem                        185,775                     8,184 4.4%
    TN Knoxville                        173,890                     4,317 2.5%
    MA Worcester                        172,648                     1,555 0.9%
    AL Huntsville                        158,216                         424 0.3%
    TN Chattanooga                        155,554                   13,103 8.4%
    MA Springfield                        152,082                     1,404 0.9%
    VA Alexandria                        128,283                   11,687 9.1%
    SD Sioux Falls                        123,975                     5,848 4.7%
    NY Jefferson County                       111,738                   11,631 10.4%
    IL Springfield                        111,454                     1,020 0.9%
    WA Bellevue                        109,569                     4,442 4.1%
    UT West Valley                        108,896                     6,011 5.5%
    UT Provo                        105,166                   16,003 15.2%
    PA Erie                        103,717                     2,608 2.5%
    Subtotal                 28,595,240             1,241,245 4.3%
    Smaller Jurisdictions                 345,025
    All Jurisdictions             1,586,270

    Wendell Cox is a Visiting Professor, Conservatoire National des Arts et Metiers, Paris. He was born in Los Angeles and was appointed to three terms on the Los Angeles County Transportation Commission by Mayor Tom Bradley. He is the author of “War on the Dream: How Anti-Sprawl Policy Threatens the Quality of Life.