Category: Demographics

  • California’s Racial Politics Harming Minorities

    Across the country, white voters placed Donald Trump in office by a margin of 21 points over Clinton. Their backing helped the GOP gain control of a vast swath of local offices nationwide. But in California, racial politics are pushing our general politics the other direction, way to the left.

    Some of this reflects California’s fast track toward a “minority-majority” state. Along with a few other states — Hawaii, Texas and New Mexico — California is there now, with minorities accounting for 62 percent of the population, compared to 43 percent in 1990. The shift in the electorate has been slower but still powerful. In 1994, registered Democrats held a 12 percentage-point margin over Republicans. By 2016, the margin had widened to 19 points.

    The racial shift does much to explain why Trump lost some largely affluent suburban areas like Orange County, where 53 percent the population is Latino or Asian, up from 45 percent in 2000. Perhaps most emblematic of potential GOP problems was Trump’s — and the GOP’s — loss in Irvine, a prosperous Orange County municipality that is roughly 40 percent Asian.

    California’s unique racial politics

    Ideology plays a critical role in California’s emerging politics of race. Hispanic and Asian voters outside California — for example, in Texas — have tended to vote less heavily for Democrats. In 2014, Republican Gov. Greg Abbott won 44 percent of Texas Latinos. Florida’s Gov. Rick Scott garnered 38 percent of the Latino vote in his successful re-election campaign. In contrast, that same year, Neel Kashkari, Jerry Brown’s Republican opponent, won only 27 percent of the Latino vote in California. Only 17 percent of California Asians voted for Trump, nearly 40 percent lower than the national rate (27 percent).

    These differences, ironically, have become more evident as California has become relatively less attractive to immigrants. Since the 1980s and 1990s, as California’s economy has become increasingly deindustrialized, the immigration “flood” has slowed, particularly among Hispanics. By the 2010s, other cities — notably Dallas-Fort Worth and Houston — were emerging as bigger magnets for newcomers.

    Read the entire piece at The Orange County Register.

    Joel Kotkin is executive editor of NewGeography.com. He is the Roger Hobbs Distinguished Fellow in Urban Studies at Chapman University and executive director of the Houston-based Center for Opportunity Urbanism. His newest book, The Human City: Urbanism for the rest of us, was published in April by Agate. He is also author of The New Class ConflictThe City: A Global History, and The Next Hundred Million: America in 2050. He lives in Orange County, CA.

    Wendell Cox is principal of Demographia, an international public policy and demographics firm. He is a Senior Fellow of the Center for Opportunity Urbanism (US), Senior Fellow for Housing Affordability and Municipal Policy for the Frontier Centre for Public Policy (Canada), and a member of the Board of Advisors of the Center for Demographics and Policy at Chapman University (California). He is co-author of the “Demographia International Housing Affordability Survey” and author of “Demographia World Urban Areas” and “War on the Dream: How Anti-Sprawl Policy Threatens the Quality of Life.” He was appointed to three terms on the Los Angeles County Transportation Commission, where he served with the leading city and county leadership as the only non-elected member. He served as a visiting professor at the Conservatoire National des Arts et Metiers, a national university in Paris.

  • Obama’s not so glorious legacy

    Like a child star who reached his peak at age 15, Barack Obama could never fulfill the inflated expectations that accompanied his election. After all not only was he heralded as the “smartest” president in history within months of assuming the White House, but he also secured the Nobel Peace Prize during his first year in office. Usually, it takes actually settling a conflict or two — like Richard Nixon or Jimmy Carter — to win such plaudits.

    The greatest accomplishment of the Obama presidency turned out to be his election as the first African American president. This should always be seen as a great step forward. Yet, the Obama presidency failed to accomplish the great things promised by his election: racial healing, a stronger economy, greater global influence and, perhaps most critically, the fundamental progressive “transformation” of American politics.

    Racial healing

    Rather than stress his biracial background, Obama, once elected, chose to place his whiteness in the closet and identified almost entirely with a particular notion of the American black experience.

    Whenever race-related issues came up — notably in the area of law enforcement — Obama and his Justice Department have tended to embrace the narrative that America remains hopelessly racist. As a result, he seemed to embrace groups like Black Lives Matter and, wherever possible, blame law enforcement, even as crime was soaring in many cities, particularly those with beleaguered African American communities.

    Eight years after his election, more Americans now consider race relations to be getting worse, and we are more ethnically divided than in any time in recent history. As has been the case for several decades, African Americans’ economic equality has continued to slip, and is lower now than it was when Obama came into office in 2009, according to a 2016 Urban League study.

    The economic equation

    On the economy, Obama partisans can claim some successes. He clearly inherited a massive mess from the George W. Bush administration, and the fact that the economy eventually turned around, albeit modestly, has to be counted in his favor.

    Yet, if there was indeed a recovery, it was a modest one, marked by falling productivity and low levels of labor participation. We continue to see the decline of the middle class, and declining life expectancy, while the vast majority of gains have gone to the most affluent, largely due to the rising stock market and the recovery of property prices, particularly in elite markets.

    At the same time, Obama leaves his successor a massive debt run-up, doubling during his watch, and the prospect of steadily rising interest rates. Faith in the current economic system has plummeted in recent years, particularly among the young, a majority of whom, according to a May 2016 Gallup Poll, now have a favorable view of socialism. Economic anxiety helped spark not only the emergence of Bernie Sanders, but later the election of Donald Trump.

    Read the entire piece at the Orange County Register.

    Joel Kotkin is executive editor of NewGeography.com. He is the Roger Hobbs Distinguished Fellow in Urban Studies at Chapman University and executive director of the Houston-based Center for Opportunity Urbanism. His newest book, The Human City: Urbanism for the rest of us, was published in April by Agate. He is also author of The New Class ConflictThe City: A Global History, and The Next Hundred Million: America in 2050. He lives in Orange County, CA.

    Photo: The Official White House Photostream (originally posted to Flickr as P012109PS-0059) [CC BY 2.0 or Public domain], via Wikimedia Commons

  • How Post-Familialism Will Shape the New Asia

    Surprisingly, the modern focal point for postfamilial urbanism comes from eastern Asia, where family traditionally exercised a powerful, even dominant influence over society. The shift toward post-familialism arose first in Japan, the region’s most economically and technologically advanced country. As early as the 1990s sociologist Muriel Jolivet unearthed a trend of growing hostility toward motherhood in her book Japan: The Childless Society? –a trend that stemmed in part from male reluctance to take responsibility for raising children.

    The trend has only accelerated since then. By 2010 a third of Japanese women entering their 30s were single, as were roughly one in five of those entering their 40s – that is roughly eight times the percentage seen in 1960 and twice that seen in 2000. By 2030, according to sociologist Mika Toyota, almost one in three Japanese males may be unmarried by age 50.

    In Japan, the direct tie between low birth rates and dense urbanization is most expressed in Tokyo, which now has a fertility rate of around one child per family, below the already depressed national average. Some of the lowest rates on earth can be seen elsewhere in eastern Asia, including those in Seoul, Singapore and Hong Kong, which are now roughly the same as the rate in Tokyo.

    As more of Asia becomes highly urbanized like Japan, this kind of ultra-low fertility will spread to other parts of the continent. Most critically, this dynamic has already spread to mainland China, or at least to its larger cities, where fertility rates have dropped well below 1.0. In 2013, Shanghai’s fertility rate of 0.7 was among the lowest ever reported – well below the “one child” mandate removed in 2015 and only one-third the rate required to simply replace the current population. Beijing and Tianjin suffer similarly dismal fertility rates.

    This pattern of low fertility, notes demographer Gavin Jones, suggests that rapid urbanization has already made the notion of the one-child policy antiquated. Now, even with fertility policies being loosened, many Chinese families are opting not to take advantage, largely due to the same reasons cited in other parts of the world: the high cost of living and high housing costs.

    Perhaps no city better reflects Asia’s emerging urban paradigm than Seoul, the densest of the high-income world’s megacities outside of Hong Kong. The Korean capital is more than 2.5 times as crowded as Tokyo, twice as dense as London and 5 times as crowded as New York. No surprise then that self-styled urban pundits love the place, as epitomized by a glowing report in Smithsonian magazine that painted Seoul as “the city of the future.” Architects, naturally, joined the chorus. In 2010 the International Council of Societies of Industrial Design named Seoul the “world design capital.”

    Ultimately, Seoul epitomizes the retro-urbanist fantasy: a city that is dense and dominating, rapidly turning the rest of the country into depopulating backwaters. Seoul has monopolized population growth in Korea, accounting for nearly 90% of total growth since 1970. Seoul also currently holds nearly 50% of the country’s population, up from 20% in 1960.

    Seoul’s development has come at the expense of not just its own hinterlands but also its own humanity. Its formerly human-scaled form of housing, known as a hanok , which was one story tall and featured an interior courtyard, has been largely replaced with tall, often repetitive towers that stretch even into the suburbs. While architects and planners celebrate this shift, they rarely consider whether this form of urbanization creates a good place for people, particularly families.

    When you consider the trends in similar cities, it’s unsurprising that Korean sociologists have noted the shift to high-density housing as being unsuitable for families with children.

    Over time the impact of these housing policies will be profound. By 2040 Korea’s population will join those of Japan and Germany as one of the world’s oldest. This will occur despite determined government efforts to encourage childbearing, efforts that may well be doomed by the government’s similar commitment to a dense, centralized urban form.

    What will happen to societies that are likely to retain extremely low rates of fertility? Japan, notes Canadian demographer Vaclav Smil, represents “an involuntary global pioneer of a new society.” Japan certainly exemplifies one way societies may evolve under diminishing birth rates.

    Projecting population and fertility rates is difficult, but the trajectory for Japan is unprecedented. The UN projects Japan’s 2100 population to be 91 million, down from 2015′s 127 million, but Japan’s own National Institute of Population & Social Security Research projects a population of 48 million, nearly 50% lower than the UN’s projection.

    Japan’s urban centralization both feeds and accelerates this trend. Rather than disperse, Japan’s population is “recentralizing.” A country with a great tradition of regional rivalries, home to an impressive archipelago of venerable cities, is becoming, in effect, a city-nation, with an increased concentration on just one massive urban agglomeration: Tokyo. This has, for the time being, allowed Tokyo to escape the worst of Japan’s demographic decline, drawing heavily on the countryside and smaller cities, both of which are losing population. From 2000 to 2013 the Tokyo metropolitan area added 2.4 million residents, while the rest of the nation declined by 2 million.

    Tokyo is now home to almost one in three Japanese. But its growth is likely to be constrained, as the last reservoir of rural and small-city residents seems certain to dry up dramatically. A projection for the core prefecture of Tokyo indicates a 50% population cut by 2100 to a number smaller than it was at the beginning of World War II; 46% of that reduced population will be over 65.

    This suggests it is time, in high-income countries at least, to shift our focus from concerns about overpopulation to a set of new and quite unique challenges presented by rapid aging and a steadily diminishing workforce. Even birth rates in developing countries are tumbling toward those of wealthy countries. As British environmental journalist Fred Pearce puts it, “the population bomb’ is being defused over the medium and long term.”

    Some, like Pearce, see the Japanese model as an exemplar of a world dominated by seniors – with very slow and even negative population growth – that will be “older, wiser, greener.” Following the adolescent ferment of the 20th century, Pearce looks forward to “the age of the old” that he claims “could be the salvation of the planet.”

    Yet, if the environmental benefits of a smaller, older and less consumptive population may be positive, there may be other negative ramifications of a rapidly aging society. For one thing, there will be increasingly fewer children to take care of elderly parents. This has led to a rising incidence of what the Japanese call kodokushi , or “lonely death,” among the aged, unmarried and childless. In Korea, Kyung-sook Shin’s highly praised bestseller, Please Look After Mom, which sold 2 million copies, focused on “filial guilt” in children who fail to look after their aging parents and hit a particular nerve in the highly competitive eastern Asian society that seems to be drifting from its familial roots.

    Additionally, an aging population will certainly diminish demand for both goods and services and likely would not promote a vibrant entrepreneurial economy.

    China will face its own version of “demographic winter,” although sometime later than Japan or the Asian Tiger states. The U.S. Census Bureau estimates that China’s population will peak in 2026 and then will age faster than any country in the world besides Japan. Its rapid urbanization, expansion of education and rising housing costs all will contribute to this trend. China’s population of children and young workers between 15 and 19 will decline 20% from 2015 to 2050, while that of the world will increase nearly 10%.

    In China the consequences of the rising number of elderly will be profound. Demographer Nicholas Eberstadt, for example, sees the prospect of a fiscal crisis caused by an aging and ultimately diminishing population. China, he notes, faces “this coming tsunami of senior citizens” with a smaller workforce, greater pension obligations and generally slower economic growth.

    It seems likely, as has occurred in Japan already, that rising costs associated with an aging population, and a dearth of new workers and consumers, will hamper wealth creation and income growth. Societies dominated by the old likely will become inherently backward-looking, seeking to preserve the existing wealth of seniors as opposed to creating new opportunities for the increasingly politically marginalized younger population.

    The shift to an aging population also creates, particularly in Asia where urbanization is most rapid, the segregation of generations, with the elderly in rural areas and the younger people in cities. Around the world, the results of this shift are likely to resemble those seen in Japan, with cities becoming home to an ever expanding part of the population, while people in the countryside are destined to grow older and ever more isolated. It is not clear how the expanding senior population, which was traditionally cared for by younger generations, will fare with fewer children to support them and in the absence of a well-developed welfare state.

    Later this century these same challenges will even be felt in many parts of the developing world. In rapidly urbanizing, relatively poor countries such as Vietnam, the fertility rate is already below replacement levels, and it is rapidly declining in other poorer countries such as Myanmar, Indonesia and even Bangladesh. In parts of Latin America, especially Brazil, fertility rates are plunging to below those seen in the United States. Brazil’s birth rate (4.3 in the late 1970s and now 1.9) has dropped not only among the professional classes but also in the countryside and among those living in the favelas. As one account reports, women in Brazil now say, “Afábrica está fechada”–the factory is closed.

    Excerpted from The Human City: Urbanism for the Rest of Us, by Joel Kotkin (B2 Books, 2016)

    This piece first appeared in Forbes.

    Joel Kotkin is executive editor of NewGeography.com. He is the Roger Hobbs Distinguished Fellow in Urban Studies at Chapman University and executive director of the Houston-based Center for Opportunity Urbanism. His newest book, The Human City: Urbanism for the rest of us, was published in April by Agate. He is also author of The New Class ConflictThe City: A Global History, and The Next Hundred Million: America in 2050. He lives in Orange County, CA.

    Photo: John Gillespie, CC License

  • Generation X’s Moment Of Power Is Almost Here

    It certainly seems as if boomers are in charge in America now, with Donald Trump about to move into the White House and members of the generation in the majority in Congress. Meanwhile, huge attention has been paid over the past few years to the emergence of the boomers’ children, the millennials, on the national scene. But relatively little thought has been accorded to the group sandwiched between the two mega-generations: Generation X.

    Referred to by some pundits as a “lost generation,” the Xers, born between the mid-1960s and 1980, may be less numerous than either the boomers or millennials, the latter of whom now slightly outnumber them in the workforce, but Gen X seems likely to dominate the near future. Not only do they now make up the majority of of managers at U.S. companies, they are far more entrepreneurial than millennials, both at early ages and now. Their rate of startup formation is roughly twice that of millennials, and on the way up, while the younger generation’s rate has been on the decline. 

    Financially, they are clearly the ascendant generation. According to analysis by the Deloitte Center for Financial Services, they now have 14 percent of the nation’s wealth compared to just 4 percent for millennials and 50 percent for the boomers. But by 2030, as the boomers finally start to fade from the picture, Xers will dominate the nation’s wealth, accounting for 31 percent, twice the projected share of millennials.

    Politically they also seem destined to take power next. They are gradually replacing the aging boomers in Congress. Their politics are neither as conservative as the boomers nor as liberal as millennials: younger Xers tilted slightly to Clinton in the last election, older ones favored Trump. Right now there are 117 Xers in Congress compared to five millennials, with the most prominent being House Speaker Paul Ryan; it will likely take a generation or more for the millennials to challenge the Xers.

    To be sure, millennials will dominate the future eventually, but the question is when. Boomers are living, and working, longer than ever. Over time, though, millennials’ overlords will come from the smaller but more aggressive X generation. Unlike the millennials, who received participation trophies and “good job” plaudits, notes generational analyst Morley Winograd, the Xers were the original “latch-key” kids who were forced to make their way in a county dominated by Boomers.

    Critically, however much millennials may talk about changing the world, as a group they are entrepreneurial laggards, in large part responsible for America’s current depressed startup rates, the lowest in a quarter century. It’s the Xers — less coddled, with less college debt and just enough experience — who are starting and running more of the economy. In a word, they are tough, used to adversity and their time is coming. 

    X-Strong Metropolitan Areas

    With all these considerations in mind, we decided to take a close look at which metropolitan areas have been gaining the largest shares of 35 to 49 year olds, currently the Xers. This is critical not only because of their economic influence, but also because they are the ones who have the most children. If a metro area’s share of this age group is growing, it is likely to have more young people as well. 

    Using Census data from 2000 to 2015, we found that the share of 35 to 49 year olds grew most dramatically in the affordable Sun Belt. This makes sense as this is the age when home ownership is most critical and people are looking for the maximum income relative to costs. Being in your late 30s to 50 does not mean you have lost the ability to dream, but it does make addressing reality far more imperative than when in your 20s.

    Many of the metropolitan areas where the 35-49 population has grown the most are precisely those that have topped most of our best city lists. At the apogee is Austin, whose 35 to 49 year old population has expanded a remarkable 44.9% since 2000, compared to a 6.6% national decline in this age range over that period. This suggests that although the bar scene and liberal politics appeal to many, other characteristics — such as relatively low housing prices, attractive suburbs and good-paying jobs — seal the deal for 35 to 49 year olds. 

    Housing and rent differentials have been particularly determinative for today’s 35 to 49 year olds. They suffered the most from the housing bust of 2007 and are only now entering the market with full force. They may not be able to afford the high prices of houses owned by coastal boomers, but they seem to be entering aggressively less expensive markets. Another reason they may be heading to these areas is to buy bigger houses than the small units now in vogue among millennial-craving builders. 

    Virtually all the other places that have experienced the biggest shift in this age group follow this pattern. No. 2 Raleigh-Durham’s population of 35-49s grew 40.1 percent, or 50.1 percent compared to the national rate, for many of the same reasons as Austin. Other places that attract these ages are generally low-priced dynamos, including No. 3 Las Vegas, No. 4 Charlotte, No. 5 Phoenix, and No. 8 Salt Lake City. Texas dominates the list here with four of the top ten, including No. 7 Houston, No. 9 Dallas-Ft. Worth and No. 10 San Antonio. 

    If we tighten of measurement to the years 2010 to 2015, the pattern is largely the same except for the emergence in the top 10 of such tech havens as metropolitan Denver and Portland, which have done very well during the tech boom. Yet surprisingly the 35 to 49 year old population share has remained stagnant in the epicenter of the “new economy,” the San Francisco and San Jose areas, although these areas continue to attract people of millennials age. Housing prices may be playing a big role with roughly a third of Bay Area residents considering leaving, largely for this reason. Silicon Valley and San Francisco may remain great places to start, but are far from the easiest places to settle down for the long term.

    Gallery: Top 1o Gen X Cities

     Yet Silicon Valley is a veritable 35 to 49 magnet compared to most of the country’s big cities. Los Angeles, New York, Boston, Chicago and Philadelphia areas have all seen declines in their 35 to 49 shares both since 2000 and, more revealingly, since 2010 as well. In terms of 35-49s, these greatly hyped metropolitan areas actually do, however, much better than Rust Belt cities such as Detroit, Cleveland, Hartford, Pittsburgh and Rochester, which experienced a survey worst 9.5 percent decline relative to the national rate in Xers since 2010 and a 19.2 percent decline since the beginning of the new millennium.

    Xers: The New Suburban Generation 

    In the popular press, youth (stretched liberally as high as 50) are widely associated with the much heralded “return to the city.” Yet in reality, all generations continue to head primarily for the suburbs, with this trend most evident among those aged 35-49. 

    Using the “city sector model” to analyze metropolitan areas by such factors as density, age of housing, transit use and housing forms, we have looked at where 35-49s have been moving over the past 11 to 15 years. Peope aged 35-49 have shown little inclination to stay in the urban core, moving out in considerable numbers to suburbs and exurbs. 

    Indeed since 2000 the percentage of Xers living in the urban core has dropped by one percentage point, while the percentage living in new suburbs and exurbs has grown by six percentage points. By 2015 over 80 percent of Xers in the 52 largest metropolitan areas lived in suburban areas, although they have in more recent years favored older suburbs (built before 1980) over exurbs.

    This reflects one of the basic demographic realities: as people age, and start families, they tend to move further out. Generally speaking, notes economist Jed Kolko, the peak years for urban living take place between ages 18 and 30. After that there’s generally a steep decline as people start families and head to the suburbs. Kolko calculates that while almost a quarter of people under 30 live in urban neighborhoods, by age 40 the urban share drops well below 20 percent, and stays there well into their 70s.

    The reasons for this move are not surprising. Suburban real estate tends to be cheaper than in good urban areas, and offers the kind of housing — single family — preferred by the vast majority of consumers. They also tend to be much safer (the rate of violent crime  in core municipalities remains almost four times higher), and have much better schools and less poverty than urban areas, things that tend to matter to people starting families and raising children.

    What It Means For Other Generations 

    The increasing importance of Xers will, of course, impact other generations. Boomers, who have had a very long run in control of just about everything, are likely to see their influence reduced as Xers hit their prime earning years. This will be accelerated by the digital revolution; the average age of venture capital-backed founders, notes the Harvard Business Review, is in their late 30s and early 40s, which puts them deep in X territory. Just as boomers had to adjust to the work culture of the previous generations, the millennials will now have to fit their careers into patterns developed by their Xer overlords. 

    For the millennials, the experience of the Xers may also presage their future lifestyle choices. Like the Xers, millennials are beginning to move into the suburbs, contradicting all claims to the contrary. Like the Xers, they too are looking for more space, something not likely to lead them to the city. Similarly they are also increasingly moving to the same lower cost cities, largely in the Southeast and Intermountain West. Since 2010, the biggest gains in millennial share have been Orlando, Austin and San Antonio. 

    Ultimately, rather than focus on boomers, the millennials will need to figure out how Xers think — their independence and entrepreneurialism — since Xers will be both their bosses and their role models. Generation X may be relatively small, and largely unsung, but what it does, and where it moves, may do more to shape the country in the next decade than the more celebrated groups born before and after them.

    Gallery: Top 1o Gen X Cities

    This piece first appeared at Forbes.

    Joel Kotkin is executive editor of NewGeography.com. He is the Roger Hobbs Distinguished Fellow in Urban Studies at Chapman University and executive director of the Houston-based Center for Opportunity Urbanism. His newest book, The Human City: Urbanism for the rest of us, was published in April by Agate. He is also author of The New Class ConflictThe City: A Global History, and The Next Hundred Million: America in 2050. He lives in Orange County, CA.

    Wendell Cox is principal of Demographia, an international public policy and demographics firm. He is a Senior Fellow of the Center for Opportunity Urbanism (US), Senior Fellow for Housing Affordability and Municipal Policy for the Frontier Centre for Public Policy (Canada), and a member of the Board of Advisors of the Center for Demographics and Policy at Chapman University (California). He is co-author of the “Demographia International Housing Affordability Survey” and author of “Demographia World Urban Areas” and “War on the Dream: How Anti-Sprawl Policy Threatens the Quality of Life.” He was appointed to three terms on the Los Angeles County Transportation Commission, where he served with the leading city and county leadership as the only non-elected member. He served as a visiting professor at the Conservatoire National des Arts et Metiers, a national university in Paris.

    Photo by Caleb Smith; Office of the Speaker of the House [Public domain], via Wikimedia Commons

  • Back to the Future: Moving Interstate Again, to the South and West

    New data from the Census indicates that population growth and domestic migration patterns have continued to move away from the East and the Midwest to the South and West, at accelerated rates. Equally important, pre-Great Recession interstate mobility rates have been restored.

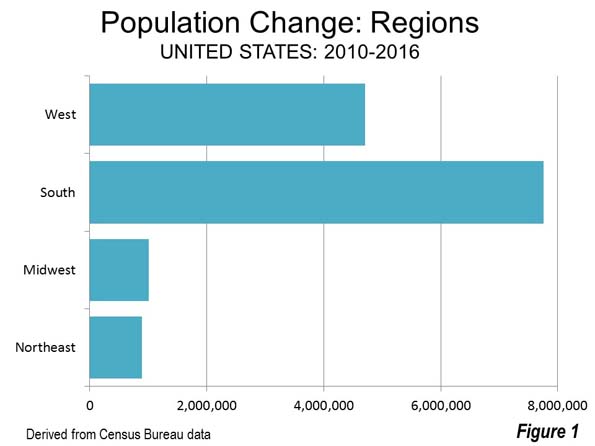
    The just released Census Bureau population estimates for the nation, states and the District of Columbia indicate a population increase for the South of 7.7 million between 2010 and 2016. The West gained 4.7 million. By contrast, the Midwest grew 1.1 million, while the East was even lower, at 900,000 (Figure 1). 

    Combined, the South and West accounted for 87 percent of the national growth. In 2011, the South and West captured 82 percent of the national growth. By 2016, the South and West had risen to 94 percent of the national population increase. The South, alone had 57 percent of the growth, up from 52 percent in 2011. The West also had a strong gain, from 31 percent in 2011 to 36 percent in 2016.

    Domestic Migration

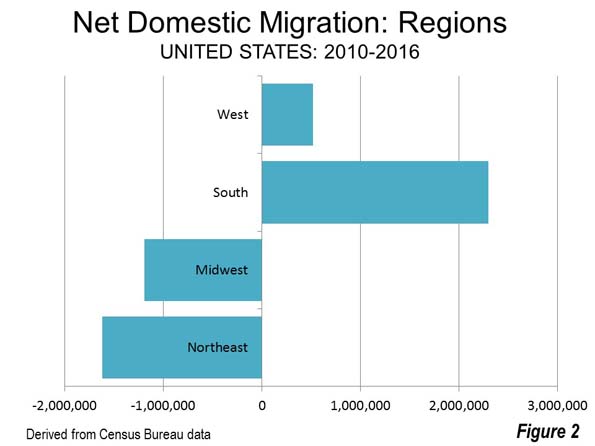
    Not surprisingly, the South and West also dominated net domestic migration — the movement of residents from one state to another (Figure 2). The South attracted 2.3 million people from other regions, more people than live in the cities (municipalities) of Philadelphia and Boston combined. The South dominated domestic migration even more than population growth, attracting more than four times the new residents as the West, which had a net inflow of more than 500,000.  The Northeast lost 1.6 million domestic migrants, nearly as many people as live in Rhode Island and Vermont. The loss in the Midwest was 1.2 million, more people than live in the cities (municipalities) of Minneapolis, Cleveland and St. Louis combined.

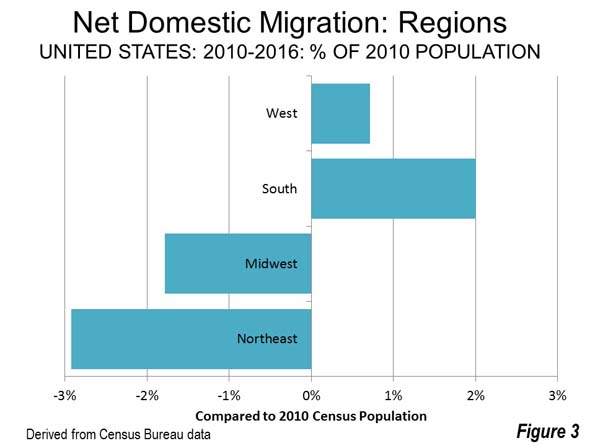
    The South also led in the percentage of net domestic migrants in relation to the 2010 population, at 2.0 percent, nearly three times that of the West (0.7 percent).  The net loss in the Midwest was 1.8 percent, while the East sustained a loss of 2.9 percent (Figure 3)

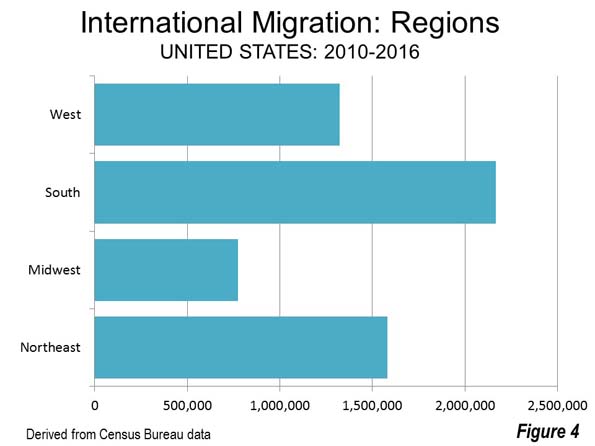
    Perhaps most surprisingly, the South also led in population gains from immigration. Between 2010 and 2016, the South added 2.2 million foreign migrants. The East added 1.6 million, the West 1.3 million and the Midwest 800,000 (Figure 4).

    State Population Trends

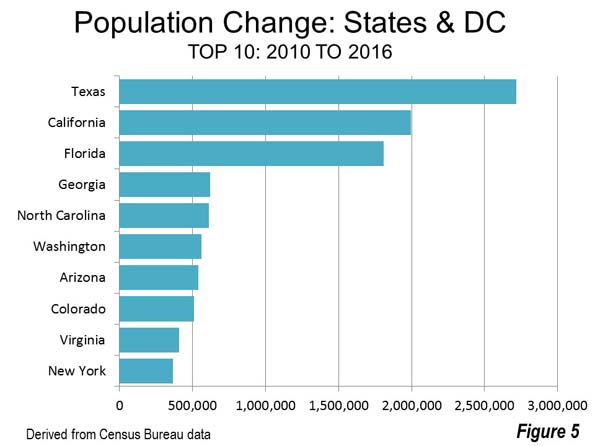
    Texas has led the nation in total population growth. Total population growth includes the natural change (births minus deaths), international migration and net domestic migration.  Texas added 2.7 million residents, a 10.8 percent increased compared to its 2010 population. This is more than double the national rate of 4.7 percent. California was well behind, with a gain of 2.0 million, despite having started the decade with a 50 percent higher population. California’s growth rate was 5.3 percent.

    Florida added the third largest number of new residents, at 1.8 million, for a 9.6 percent growth rate from 2010. After that the gains were much less. Georgia and North Carolina gained somewhat more than 600,000. Washington, Arizona and Colorado added between 500,000 and 600,000 residents. Virginia and New York rounded out the top ten (Figure 5). New York generated large numeric, but small proportional increases early in the decade (1.9 percent), the result of its fourth largest population, after California, Texas, and Florida.

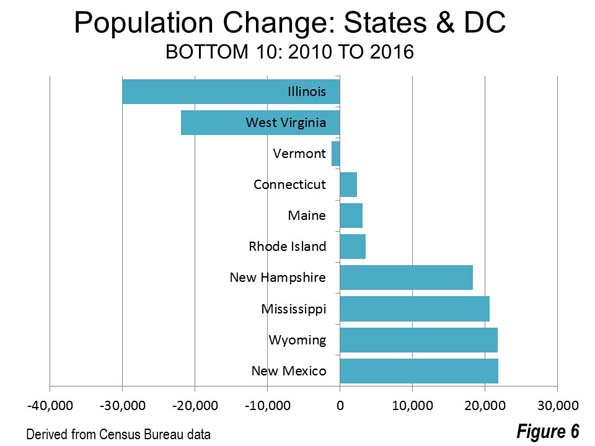
    Three states suffered population losses over the period. Illinois lost 30,000 residents and West Virginia lost 20,000. Vermont lost 1,000 and was joined by New England neighbors Maine, New Hampshire, Connecticut and Rhode Island in the bottom 10. However, Maine has begun to gain again (below). The bottom 10 included one southern state, Mississippi and two western states, Wyoming and New Mexico (Figure 6)

    State Domestic Migration Trends

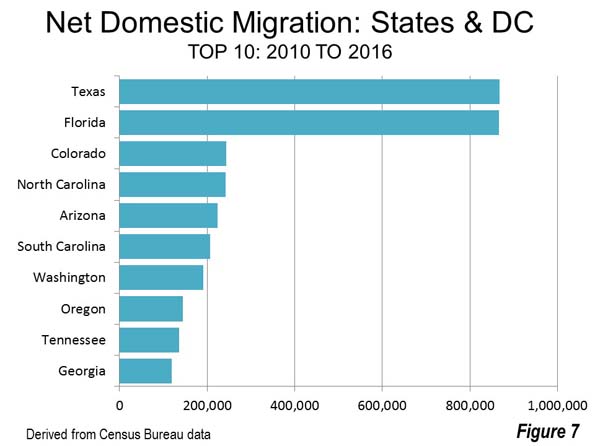
    Throughout the decade, Texas has led in net domestic migration. But the race is much closer, with the Longhorn state leading second ranked Florida by only 500. Both states have gained between 866,000 and 867,000 net new residents from domestic migration since 2010 (Figure 7). Perhaps due to the energy downturn, domestic migration to Texas dropped by more than one-quarter, while Florida continued led the nation for the second straight year. In 2016, Florida added 207,000 net domestic migrants, compared to the Texas gain of 126,000. With the improving prospects for energy under the Trump administration, the competition could be stiff between the two states in the years to come.

    Other net domestic migration leaders added between 200,000 and 250,000, including Colorado, North Carolina, Arizona and South Carolina. Washington, Oregon, Tennessee and Georgia added between 100,000 and 200,000 net domestic migrants, as did Nevada, which ranked 11th, a remarkable turnaround. Nevada as well as Arizona, Georgia suffered serious setbacks during the Great Recession, but now show signs of significant recovery.

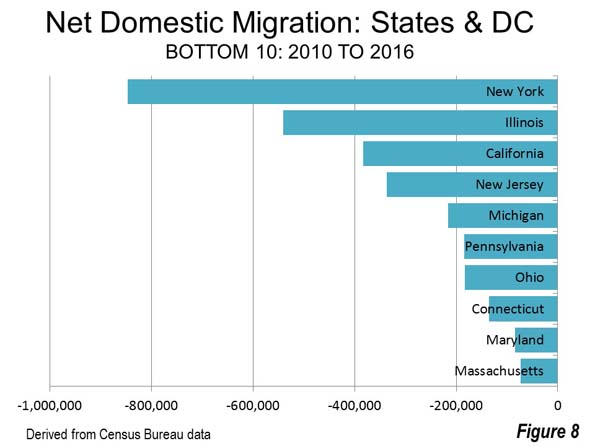
    The East and Midwest had a near monopoly on the bottom 10 in net domestic migration. New York lost 867,000 net domestic migrants, while Illinois lost 540,000. California’s loss was 383,000. New Jersey lost 336,000 and Michigan 216,000. Pennsylvania, Ohio and Connecticut lost between 100,000 and 200,000, while Maryland and Massachusetts lost between 70,000 and 100,000 (Figure 8).

    New York had the largest net domestic migration loss in 2016, at 191,000. Illinois lost 114,000, closely followed by California, at 109,000.

    Highlights

    The data also indicates significant shifts in growth rates during the decade.

    The largest drop was in the East, where the total population gain dropped 90 percent, from 245,000 in 2011 to 24,000 in 2016. In the Midwest, growth dropped from 174,000 to 103,000. Meanwhile, population rose 1,281,000 in the South, up from 1,199,000 in 2011. The West had the largest gain, from 697,000 to 822,000.

    New York’s population gain has declined every year, from 117,000 in 2011 to 27,000 in 2015 and a loss of 2,000 in 2016. Pennsylvania lost 8,000 residents in 2016, down from a 32,000 gain in 2011.

    Not all states in the West had positive trends. California gained only 256,000 in 2016, down from 344,000 in 2011. California’s gain dropped nearly 20 percent in just the last year. In 2016, California’s percentage growth trailed that of the United States for the first time in the decade (6.6 percent compared to the national rate 7.0 percent).  Between 2011 and 2015, California’s average, at 8.6 percent, was well above that of the nation (7.3 percent).

    The states to which Californians migrate in the greatest numbers gained as a result. Nevada’s population gain nearly quadrupled between 2011 and 2016, Idaho, Oregon and Arizona approximately doubled, while strong improvements were registered in Washington, Colorado and Utah.

    Florida added 367,000 new residents, a strong gain from the 2011 level of 247,000, while South Carolina’s gain nearly doubled. North Carolina, Georgia, Tennessee and Texas posted healthy increases. However, Maryland’s growth fell by more than one-half (55,000 to 21,000), while Virginia saw its gain drop from 84,000 in 2011 to 44,000 in 2016.

    Pervasiveness of Declining Growth

    At the national level, the annual growth rate continues to trend downward. In 2011, the United States added 0.75 percent to its population. By 2016, the rate had dropped to 0.70 percent. In 30 states, plus the District of Columbia, the growth rate dropped between 2011 and 2016.

    On the other hand, 20 states had stronger growth rates in 2016 than in 2011. Given the utter domination of the trends by the South and West, it is surprising that seven of these states are outside the West.

    In the East, the New England states of Maine, New Hampshire and Rhode Island had higher growth rates in 2016. At the same time, Vermont, where similar trends might be anticipated, slipped from modest growth in 2011 to a decline in 2016.

    Four Midwestern states also grew faster in 2016 than in 2011. These include Michigan, Missouri, Nebraska and Ohio. Michigan, the only state to reach more than 10 million and then fall below, has gained four years in a row, though remains below 10 million.

    Among these seven states, only Nebraska exceeded the national growth rate in 2016.

    Natural Increase Down, Mobility Up

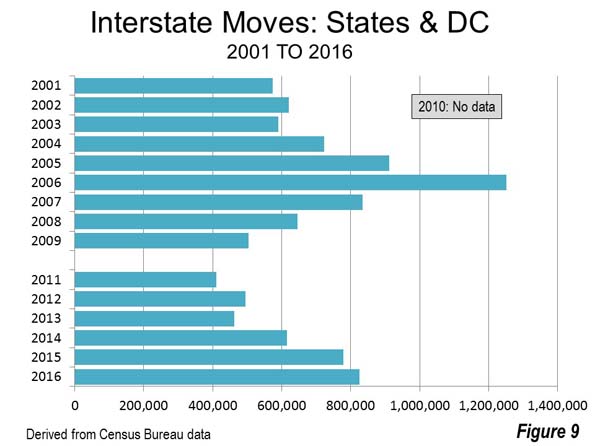
    The natural population growth rate (births minus deaths) dropped from 4.7 percent in 2011 to 3.8 percent in 2016. At nearly 20 percent (18.8 percent), this is a huge reduction in just five years. At the same time the Great Recession-interrupted interstate mobility seems to have recovered. In 2016, there were 825,000 interstate moves, more than double the post-2000 low of 411,000 in 2011. The 2016 interstate move figure was greater than all but the three largest Housing Bubble years, 2005, 2006 and 2007. The 2016 moves also exceeded the 2001 to 2009 average by more than 10 percent (Figure 9).

    Back to the Future
    As we get farther from the Housing Bust and the Great Recession, population growth and domestic migration seem to be increasingly restored to prior trends around the nation.

    Wendell Cox is principal of Demographia, an international public policy and demographics firm. He is a Senior Fellow of the Center for Opportunity Urbanism (US), Senior Fellow for Housing Affordability and Municipal Policy for the Frontier Centre for Public Policy (Canada), and a member of the Board of Advisors of the Center for Demographics and Policy at Chapman University (California). He is co-author of the “Demographia International Housing Affordability Survey” and author of “Demographia World Urban Areas” and “War on the Dream: How Anti-Sprawl Policy Threatens the Quality of Life.” He was appointed to three terms on the Los Angeles County Transportation Commission, where he served with the leading city and county leadership as the only non-elected member. He served as a visiting professor at the Conservatoire National des Arts et Metiers, a national university in Paris.

    Photo of Zion National Park in Utah, the nation’s fastest growing state by Tobias Alt – Own workGFDLLink

  • The Mainstream Media Will Rise Again

    The news media was flattened on November 8th, but its recovery has already started.

    One of the striking features in all the commentary on Facebook about Donald Trump’s victory is the number of times that the words I, me and my appeared in member posts. For example, “I am proud”, “I am optimistic”, or “I am fearful”, “I am worried”, etc. The comments celebrating or lamenting the event were mostly about the way the writer felt about the event, not about the event itself. That looks like a subtle difference but it reveals a demarcating line between an introverted reaction vs. an extroverted one.

    None of this is too surprising because even in normal times, Facebook’s format and primary raison d’être are to enable people to talk about themselves and to update their friends on their comings and goings. On any given day outside of an election period, the blue bannered webpage seems to be 80% introversion (photos and news of one’s own family, or one’s own meal, or one’s own travels, challenges and accomplishments) and 20% extroversion (posts of articles about third parties).

    Anatomy of a Crash

    It was surprising however to observe the same I, me, my phenomenon in the columns of major newspapers in the immediate aftermath of the election. Leading columnists were unusually introspective, if not introverted. Writing in the first person, they felt homeless in America, were horrified, struggled to absorb the impossible and vowed to fight back.

    Of course, columnists are often media superstars and their extensive use of the first person may come from a deliberate effort by the newspaper editors to render the news commentary more personal. That coloring was certainly in full relief in the angst-ridden I haven’t slept in my room since the election and Trump’s election stole my desire to look for a partner among others.

    Nonetheless, whether deliberate or incidental, the I me my device can be seen as a sign that leading dailies, or at least their op-ed pages, have over the years drifted from extroverted to introverted, from objective analysis to star-studded opinion.

    In reality, the op-ed pages need not be so full of personal opinion and subjective thoughts and feelings. Opinion can be objective analysis, and as such can become an arms length discussion of facts without necessarily pointing the reader towards the author’s own views. The op in op-ed then becomes an invitation and encouragement to the reader to form his own opinion, instead of a presentation of the writer’s opinion. Fairly or unfairly, the value placed on the latter has been in steady decline for many years.

    The presentation of facts in support of this new approach requires the inclusion of more soft and hard information and data. As W. Edwards Deming was fond of saying, “without data, you are just another person with an opinion”, or, at his more whimsical, “in God we trust; all others must bring data”. Data in an op-ed does not have to be numerical, so long as the tone and content are objective and analytical. Of course there is some subjectivity in choosing one set of data or facts vs. another but a writer will not be credible if the scope of his analysis is too narrow. An article is enriched by the addition of more and more data. It should be as full of data as possible and as short as necessary to make it a compact and quick read.

    This is painting with a broad brush and we should recognize that the leading dailies still produce outstanding content, including on the op-ed page. But it is fair to say that, in reflecting and understanding the general mood of the country, these papers were blindsided by the more recent upstarts of the internet age and even by savvy Twitter users like Mr. Trump himself and others.

    Social media has revalued upwards the opinion of every person with a computer or smartphone and simultaneously devalued professional opinion leaders such as newspaper columnists, academics and others. Remember that Time Magazine’s Person of the Year in 2006 was YOU. Perhaps it is the new competition from you and from bloggers and micro-bloggers that has led these columnists to emphasize the first person in their writings as if to remind us that their credentials far outweigh those of the random blogger across town. Indeed they do. But in today’s free for all media, opinions are increasingly judged on their own merits, and not as much by the identity of the writer.

    Here is the key to understanding the news media’s endless travails. Of course, digital and social media have played a big role in the decline of advertising at major newspapers, but so has each paper’s own approach to news and commentary. A good first step towards recovery would be to excise or minimize I, me, my from the op-ed page and to shift the whole tenor from introversion to extroversion. With data and facts presented in a rigorous and coherent manner, a columnist becomes much more than “just another person with an opinion”.

    Scraping the Bottom

    At first blush, the current state of play is not that encouraging. In the world of the internet, of blogging, of Facebook and BuzzFeed, it has become more difficult for legacy newspapers to keep up with a changing audience. Millennials may be more interested in short articles that combine news and entertainment than in the type of long form articles and analyses that are the hallmarks of the New York Times and other leading dailies.

    To gauge the prevailing mood, consider the table below which shows the results of several Google searches on November 18th, a randomly chosen date. Although cronyism is arguably a real scourge of our time, there were on Google only 348,000 results for “Hillary cronyism” and 423,000 results for “Trump cronyism”. What is important in the table is how these numbers compare to other searches. Some serious crises like “Flint Michigan water” log in at less than two million results, but the distracting “Trump Rosie” has over 9 million and the promised “Trump build a wall” nearly 35 million, while itself only one tenth of the ubiquitous mega blockbuster “Trump Twitter”.

    Clearly, the more important items are under-covered while the ephemeral and insubstantive get a ton of coverage. It is possible however that this trend towards the superficially satisfying has run its course and that traditional news can regain some advantage. As with any downward spiral, recovery seems more plausible after hitting bottom. Strong brands in any sector can be tarnished for a while but in most cases they can adapt and enjoy a lasting rebound under altered circumstances.

    Although no one can make this prediction with high confidence, there is a nebulous long-observed propensity for big trends to reverse themselves once they have reached an extreme point, as the devaluation of the media has on November 8th. There is also an increasing desire among news consumers to gravitate back to the great time-tested brands in order to gain some immunization against the so-called post-truth world.

    Note for example that since the election, The New York Times has seen a ten-fold increase in daily subscription sign-ups, a signal that many readers are returning to more established brands at a time when fake news is spreading over the internet. Yet this surge may prove short lived if real reforms are not implemented in the wake of the election surprise.

    At any rate, a total subscription count of 2.5 million at the Times seems exceedingly low for what is one of the top news brands in the world. Further, the market value of the New York Times company at $2.4 billion, though it has risen 30% since the election, still underestimates the full potential of the brand.

    Sami Karam is the founder and editor of populyst.net and the creator of the populyst index™. populyst is about innovation, demography and society. Before populyst, he was the founder and manager of the Seven Global funds and a fund manager at leading asset managers in Boston and New York. In addition to a finance MBA from the Wharton School, he holds a Master’s in Civil Engineering from Cornell and a Bachelor of Architecture from UT Austin.

    Photo: ‘New York Times’ photo Copyright © 2016 populyst.net.

  • Trump and California’s Economy

    Defenders of California’s status-quo claim to be proud of California’s economic growth and worry about what Trump will do to that growth. If you are so impolite as to mention that this has been California’s slowest recovery in 70 years, as the following chart shows, you will be told that slow growth is good. It avoids the excesses of previous business cycles.

    That’s nonsense. Slow growth is anti-poor and anti-minority. Here’s a simple way to analyze economic policy: Ask how the policy changes the probability of a young person finding a job. If the policy increases their chances, it’s good policy. If it decreases the probability, it’s bad policy.

    I go farther than that. To me, deliberately enacting a policy that reduces a young person’s prospects is immoral.

    California, and the nation, have lots of policies that reduce young people’s job prospects. So, there are lots of opportunities to increase economic growth. Certainly, it’s possible to present a set of policy proposals that would increase California’s economic growth.

    Evaluating Trump’s economic plan is difficult, though. So far, it’s a mixed bag. It has policies that would increase economic growth. It also has some that would decrease economic growth. I think the best way to evaluate the impact is to look at his major proposals for their growth impact and probability of becoming law.

    Trump has promised to reduce American business’s regulatory burden. That would reduce costs, encourage domestic production and jobs, and provide a strong economic boost. Some of that overhead was created by executive action and can be reversed by executive action. The probability of reversing those regulations is high, as are the economic benefits.

    He’s also promised to eliminate or “fix” Dodd-Frank and the Affordable Healthcare Act. Exactly what he intends to do, fix or eliminate, depends on the tweet of the day. It’s also not clear what fix means. Still, any real change will face significant hurdles, even with a Republican controlled Congress. To be conservative, we need to assume that he will be unsuccessful in his attempts to significantly change these laws. If he does, and it’s done in a way that reduces costs, it will be a happy plus.

    Then there is his immigration policy, if you can figure out what it is. He’s been all over the map, from shipping out all undocumented residents to only shipping out the criminals. Of course, if he is able, as some fear, to move millions of our workers, the economic impact would be seriously negative.

    Realistically, the most he is likely to accomplish is exporting criminals and slowing immigration. The numbers of undocumented criminals is small enough to have no measurable impact on the economy. Decreasing immigration tends to slow economic growth, but it may reduce inequality a bit by reducing competition faced by our low-productivity workers. Overall, Trump’s immigration policies will likely have modest negative economic impacts.

    As in all things Trump, his trade proposals are inconsistent and vague. One thing has been consistent. Trump wants to reduce trade. We can only hope that he’s unsuccessful. The economic impacts of reducing trade would be large and negative. Presumably, Congress will effectively resist his most egregious proposals.

    Reducing trade would particularly hurt California’s economy, as a large percentage of what the United States exports and imports goes through California’s ports, which are a significant portion of the state’s limited remaining industrial assets.

    Taxes are one area of Trump policy clarity. He wants to reduce corporate taxes and reduce the tax impediments to repatriating foreign corporate earnings. By themselves, these would provide an economic stimulus. Repatriating foreign earnings has no obvious downside. By contrast, without some action somewhere else, reducing corporate taxes could increase the severity of our already severe budget challenges. Eliminating deductions, as proposed, would lessen the budget impacts, as would taxing repatriated earnings at the suggested 10 percent rate. These, combined with increased economic activity, potentially brings the long-run budget impact to near zero. Supply-siders would argue that the package would reduce deficits. That’s probably a stretch, although the combination of regulatory reform and tax reform could very well reduce the deficit.

    Trump proposes a stimulus package that appears to be another public capital spending spree. This would add to our budget challenge, but it’s far worse than cutting taxes to businesses. Cutting taxes at least has the benefit of generating new economic activity to offset some of the budget impact. Public capital spending at the national level is non-stimulative and inefficient. Given the budget impacts, zero economic impact is the best we can hope for.

    Some California leaders worry that Trump will retaliate economically for California giving Hillary Clinton a popular-vote victory. I don’t believe that the presidency has enough power for a vindictive new president to exact revenge by economically punishing states that voted for his opponent. If he does, the presidency is way too powerful.

    Overall, it’s likely that Trump’s economic impacts will be a small positive, but with an increase in an already too-large budget deficit. California’s impact could be smaller, or even negative, depending on Trump’s success reducing trade.

    Whatever Trump’s impacts on the national economy, they are likely to be far less for California, as his program will be swamped by California’s own unilateral deindustrialization. While the rest of the nation will be enacting a program intended to be pro-business and pro-job, California is firmly embarked on an agenda that promises to be anti-business and anti-job, with increased regulation and costs for businesses and consumers.

    Examples of California’s anti-business agenda are easy to come by. Governor Brown has recently asked the Federal Government to ban all offshore oil and gas drilling off of California. In the most recent election, Californians renewed their commitment to environmental purity, embracing carbon emissions targets 40 percent below 1990 levels by 2030. Nothing is beyond the reach of California’s environmentally devout. They’ve already regulated cow flatulence, which could lead to backpacks and plumbing to collect cow gas. More likely, it will lead to fewer cows in California, but more in other places and no change in global bovine emissions.

    While it’s entertaining to speculate what California regulates after cow flatulence, there are serious consequences to the state’s regulatory enthusiasm. Unless the rest of the country embraces California’s agenda, very unlikely under a Trump administration, its economy and the nation’s will eventually diverge, even with California’s location, climate, and tech advantages. This will lead to slower economic growth and increased migration out of the Golden State.

    Bill Watkins is a professor at California Lutheran University and runs the Center for Economic Research and Forecasting, which can be found at clucerf.org.

    Photo: Wendell, Flickr

  • “There Can’t Be a Successful Indianapolis Without a Successful Indiana”

    Back in 2008 or 2009 I gave a Pecha Kucha presentation in Indianapolis in which I said:

    “Cities can’t survive on gentrification alone. The broad community has to be a participant in its success. That’s why I’m somewhat down on the notion of the creative class. It’s good as far as it goes, but it’s a self-consciously elitist vision. Where’s the working class in that?

    Arguing among ourselves [city vs. suburbs] is like beggars fighting over table scraps. We need to build the city up without tearing the suburbs down.

    There can’t be a successful Indianapolis without a successful Indiana….While [metro] Indy has 25% of the states’ population, it has 60% of the state’s population growth and 80% of its economic growth. That’s not healthy. Like it or not, we’re dependent on the state for critical infrastructure funds and other things. So our challenge is how to bring the rest of the state along with us.”

    I’ve long been an advocate for the restoration what I call the commonwealth, the idea that we rise and fall together as a people and all have skin the game. This idea has gone by the wayside to say the least.

    It may well be that American society has become irredeemably tribalized. I hope not. At a minimum, there are significant sized groups with fundamentally incompatible ideas of the public good. There’s a lot to unpack in that statement, but not today.

    Richard Florida has talked about a “great reset” of the economy. Clearly we need some sort of institutional reset to contain or resolve these differences. We’ve done this before in creating the original Constitution to replace the Articles of Confederation, fighting a Civil War and redefining the federalism of that constitution, the New Deal era changes, and perhaps others.

    What that looks like, I don’t know. But if we are to reach it without even more severe upheavals, it’s likely to involve some renewed form of federalism, agree to disagree, live and let live, etc – and on durable basis, not just an opportunistic and self-interested one.

    This will involve painful change and difficult decisions. One of them is that we must be willing to give others the freedom to make choices for themselves and their communities that we fundamentally disagree with.

    To the extent that we believe all of the big decisions of our society are morally determined, and thus not properly the subject of political debate, this means we are in a winner take all world. If you want that world, you’d better be really sure you are right and sure you are going to win – because you face ruination if you’re wrong on either count.

    It also means that we need to figure out how to have both love and accountability towards all of our citizens. Right now that means that rural white Republicans in victory cannot ignore the continued urgent need to integrate urban black America into full participation in middle class success and to address other aspects of what Richard Florida has labeled the “new urban crisis.”

    It also means that working class whites must be challenged to change. I have made no secret in these pages that these communities too often have sabotaging traits that really aren’t necessary to cling to – such as the disparagement of ambition for better.

    But urban and left leaning populations, including minority groups, need to likewise address travails of the white working class, and be willing to make painful changes of their own.

    To be honest, I’m not optimistic. But I am hopeful. The future hold possibilities for ill that we cannot know – but it likewise holds the possibility for good things we can’t yet imagine.

    Aaron M. Renn is a senior fellow at the Manhattan Institute, a contributing editor of City Journal, and an economic development columnist for Governing magazine. He focuses on ways to help America’s cities thrive in an ever more complex, competitive, globalized, and diverse twenty-first century. During Renn’s 15-year career in management and technology consulting, he was a partner at Accenture and held several technology strategy roles and directed multimillion-dollar global technology implementations. He has contributed to The Guardian, Forbes.com, and numerous other publications. Renn holds a B.S. from Indiana University, where he coauthored an early social-networking platform in 1991.

    Photo: By Daniel Schwen (Own work) [CC BY-SA 4.0], via Wikimedia Commons

  • The Evolving Urban Form: Houston

    Houston is a city (metropolitan area) of superlatives. The most recent Brookings Institution data shows that Houston has the seventh strongest per capita economy (gross domestic product) in the world (Figure 1). This places Houston above New York and more surprisingly, perhaps, other cities perceived to have strong economies are far below Houston and outside of the top 10, such as London, Tokyo and Chicago.

    The recently released COU Standard of Living Index also ranked Houston just behind San Jose in real pay per job for households entering the housing market (Figure 2).

    Distribution of Population Growth

     Houston is among the newer of the world’s great cities. It  has experienced sustained growth in every decade since the turn of the 20th century. The area constituting its metropolitan region (combined statistical area) has grown at more than 1.5 percent in each decade since 1900. In the 1920s and the 1980s, Houston grow at a rate of more than 3.5 percent annually at has grown an average of 2.2 to 2.3 percent annually since 2000. It took until 1950 for Houston to reach 1 million residents. By 1980, the population was 3.3 million and by 2015 had doubled to 6.8 million.

    As is typical for a growing city, the strongest early growth was in the core municipality (Houston) and then gradually shifted to the nearby suburbs and outer suburbs (Figure 3)

    At this point, near parity has been reached. The municipality of Houston, the suburbs within the core Harris County (the county also home to most of the city) and the outer suburbs, beyond Harris County have nearly equal populations, at approximately 2.3 million each (Figure 4).

    Like other cities that have experienced most of their growth since World War II, most of Houston is suburban. Between 2000 and 2013, the greatest growth was in the Later Suburbs and Exurbs. There was also growth in the Earlier Suburbs (Figures 5 and 7).

    Large Centers and Decentralization

    There was a similar pattern of growth in employment. The greatest growth was in the Later Suburbs and there was also strong growth in the Exurbs and the Earlier Suburbs (Figures 6 and 7). The central business district (downtown) ranks eighth in total employment in the nation and also experienced growth. The Texas Medical Center is the largest life sciences center in the world. The center is located south downtown and rivals some of the nation’s largest central business districts, larger than Minneapolis and nearly as large as Denver ,, with more than 100,000 employees (see photograph above). There are other large centers, such as the Port of Houston, the Galleria (Uptown) and the Energy Corridor. Houston is one of the best examples of a decentralized city, with major employment centers throughout.

    Higher than Average Urban Density

    Houston is often characterized as a “sprawling” urban area. In fact, however, Houston has a higher than average urban density for the United States (by eight percent) and an urban density approximately 75 percent higher than Atlanta and Charlotte and denser than Philadelphia and Boston. Even Portland, with its carefully cultivated international reputation for high density is only 18 percent denser than Houston (Figure 8). Of course, all US urban areas are less dense by international standards than their foreign counterparts.

    Attracting the Most New Residents

    Since 2010Houston has led the 53 metropolitan areas with more than 1,000,000 population in net domestic migration. In that time Houston has attracted 255,000 new residents from elsewhere in the nation, followed closely by in-state rival Dallas-Fort Worth (241,000). The four largest Texas metropolitan areas with more than 1,000,000 population were among the six attracting the largest net domestic migration, with fourth ranked Austin attracting 159,000 and sixth ranked San Antonio adding 122,000. Only third ranked Phoenix and fifth ranked Denver were from outside Texas. Eight of the top ten were from the South (Figure 9).

    There are at least two important keys to Houston’s attractiveness. Obviously, its strong job-creating economy has opened career opportunities for people from other parts of the country. In addition, Houston’s favorable housing affordability has been an important factor. Seminal recent academic research has pointed to the importance of housing affordability in attracting domestic migrants (such as Ganong and Shoag).

    Enviable Improvement in Relative Traffic Congestion

    Houston has been more successful in controlling traffic congestion than many other cities. In 2015, Houston tied with Boston for the 11th worst traffic congestion in the United States, according to the TomTom Traffic Index (Figure 10). This is a far better rating than in the middle 1980s, when the Texas Transportation Institute ranked Houston as having the worst traffic congestion in the nation.

    Since that time, Houston has managed to have spectacular population growth, yet has kept up with it by expanding its freeway and arterial systems, along with traffic management improvements. Los Angeles, San Francisco, Seattle, San Jose, New York, Honolulu, Miami, Portland, Washington and Chicago have seen their traffic congestion become worse than in Houston over the same period. Houston is larger in population than all but three of these nine metropolitan areas (New York, Los Angeles and Chicago), more than twice the size of San Jose and Portland and nearly seven times that of Honolulu. Further, exhibiting the association between greater traffic congestion and higher population density, all cities ranked worse than Houston have higher urban densities.

    World’s Energy Capital Poised for Employment Growth

    Houston is widely acclaimed as the energy capital of the world. Urbanscale.com says that “The only other U.S. city that rivals Houston’s domination of a single industry is New York’s preeminence in the financial sector.” Of course, Houston’s energy industry has faced considerable challenges over the past couple of years as Organization of Petroleum Exporting Countries (OPEC) have driven the price of oil down by producing more oil. However, the “good times” could return soon for Houston, as there are indications that OPEC will reduce its production. Further, and perhaps even more importantly, Houston could benefit from the new Trump administration’s commitment to a more consumer oriented energy policy, appearing likely to generate substantial employment and growth in the newly unleashed sectors.

    Photo: Texas Medical Center (by author)

    Wendell Cox is principal of Demographia, an international public policy and demographics firm. He is a Senior Fellow of the Center for Opportunity Urbanism (US), Senior Fellow for Housing Affordability and Municipal Policy for the Frontier Centre for Public Policy (Canada), and a member of the Board of Advisors of the Center for Demographics and Policy at Chapman University (California). He is co-author of the “Demographia International Housing Affordability Survey” and author of “Demographia World Urban Areas” and “War on the Dream: How Anti-Sprawl Policy Threatens the Quality of Life.” He was appointed to three terms on the Los Angeles County Transportation Commission, where he served with the leading city and county leadership as the only non-elected member. He served as a visiting professor at the Conservatoire National des Arts et Metiers, a national university in Paris.

  • How Silicon Valley’s Oligarchs Are Learning to Stop Worrying and Love Trump

    The oligarchs’ ball at Trump Tower revealed one not-so-well-kept secret about the tech moguls: They are more like the new president than they are like you or me.

    In what devolved into something of a love fest, Trump embraced the tech elite for their “incredible innovation” and pledged to help them achieve their goals—one of which, of course, is to become even richer. And for all their proud talk about “disruption,” they also know that they will have to accommodate, to some extent, our newly elected disrupter in chief for at least the next four years.

    Few tech executives—Peter Thiel being the main exception—backed Trump’s White House bid. But now many who were adamantly against the real-estate mogul, such as Clinton fundraiser Elon Musk, who has built his company on subsidies from progressive politicians, have joined the president-elect’s Strategic and Policy Forum. Joining Musk will be Uber’s Travis Kalanick, who half-jokingly threatened to “move to China” if Trump was elected.

    These are companies, of course, with experience making huge promises, and then changing those promises to match new circumstances. Uber, for instance, touted itself as a better deal than a cab for both riders and drivers before it prepared to tout a better deal for riders by replacing its own soon-to-be obsolete drivers with self-driving cars.

    Silicon Valley and its leading mini-me, the Seattle area, did very well under Barack Obama, and expected the good times to continue under Hillary Clinton. Tech leaders were able to emerge as progressive icons even as they built vast fortunes, largely by adopting predictably politically correct issues such as gay rights and climate change, which doubled as a perfect opportunity to cash in on Obama’s renewable-energy subsidies. Increasingly tied to the ephemeral economy of software and media, they felt little impact from policies that might boost energy costs or force long environmental reviews for new projects.

    No wonder Silicon Valley gave heavily to Obama and then Clinton. In 2016, Google was the No. 1 private-sector source of donations to Clinton, while Stanford was fifth. Overall the electronics and communications sector gave Democrats more than $100 million in 2016, twice what they offered the GOP. In terms of the presidential race, they handed $23 million to Hillary, compared to barely $1 million to Trump.

    Yet, there is one issue on which the Valley has not been “left,” and that is, predictably, wealth. It may have liked Obama’s creased pants and intellectually poised manner, but it did not want to see the Democrats become, God forbid, a real populist party. That is one reason why virtually all the oligarchs favored Clinton over Sanders, who had little use for their precious “gig economy,” the H-1B high-tech indentured-servants program, or their vast and little-taxed wealth.

    Jeff Bezos, the Amazon founder with a net worth close to $70 billion, used his outlet, The Washington Post, to help bring down Bernie, before being unable, despite all efforts, to stop Trump. So now Bezos sits by Trump’s side, hoping perhaps that the president-elect’s threats to unleash antitrust actions against Amazon will be conveniently forgotten as an artful “deal” is struck.

    For these and other reasons, there’s little doubt that the tech elite would have been better off under Clinton, who likely would have, like Obama, disdained antitrust actions and let them keep hiding untaxed fortunes offshore. Now, they will have to share the head table with the energy executives they’d hoped to replace with their own climate-change-oriented activities.

    The tech oligarchs have long had a problem with what many would consider social justice. Although the tech economy itself has expanded in the current period, its overall impact on the economy has been less than stellar. For all of its revolutionary hype, it’s done little to create a wide range of employment gains or boost worker productivity.

    To be sure, there have been large surges of employment in the Bay Area, Seattle, and a handful of other places. California alone has more billionaires than any country in the world except China, and nearly half of America’s richest counties.

    But for much of the country, notably those areas that embraced Trump, the tech “disruption” has been anything but welcome news. This includes heavily Latino interior sections, home to many of America’s highest employment rates. Overall, the “booming” high-wage California economy celebrated by progressive ideologues like Robert Reich does not extend much beyond the Valley. In most of California, job gains have been concentrated in low-wage professions.

    Despite its vast wealth, California has the highest cost-adjusted poverty rate in the country, with a huge percentage of the state’s Latinos and African Americans barely able to make ends meet. California metropolitan areas, including the largest, Los Angeles, account for six of the 15 metro areas with the worst living standards, according to a recent report from demographer Wendell Cox. Meanwhile, the middle and working class, particularly young families, continue to leave, with more people exiting the state for other ones than arriving to it from the, in 22 of the past 25 years.

    Even in Silicon Valley itself the boom has done little for working-class people, or for Latinos and African Americans—who continue to be badly underrepresented at the top tech firms as many of those same firms aggressively promote diversity. A study out of the California Budget and Policy Center (PDF) concluded that with housing costs factored in, the poverty rate in Santa Clara County soars to 18 percent, covering nearly one in every five residents, and almost one-and-a half times the national poverty rate. Since 2007, amidst an enormous boon, adjusted incomes for Latinos and African Americans in the area actually dropped (PDF).

    Much of this has to do with change in the Valley’s industrial structure, which has shifted from manufacturing to software and media. The result has been a kind of tech alt-dystopia, with massive levels of homelessness, and housing costs that are prohibitive to all but a small sliver of the local population.

    With a president whose base is outside the Bay Area, and dependent on support in areas where jobs are the biggest issue, the tech moguls will need to find ways to fit into the new agenda. The old order of relentless globalization, offshoring, and keeping profits abroad may prove unsustainable under a Trump regime that has promised to reverse these trends. In some senses the Trump constituency is made up of people who are the target of Silicon Valley’s “war on stupid people.” Inside the Valley, such people are seen as an obstacle to progress, who should be shut up with income supports and subsidies.

    So can Silicon Valley make peace with Donald Trump, the self-appointed tribune of the “poorly educated”? There are two key areas where there could be a meeting of minds. One is around regulation. One of the great ironies of the tech revolution is that the very places that are home to many techies—notably blue cities such as San Francisco, Austin, and New York—also tend to be the very places most concerned with the economic impacts of the industry.

    Opposition to disruptive market makers in the so-called sharing economy like Uber, Lyft, and Airbnb is greatest in these dense, heavily Democratic cities. What’s left of the private-sector union movement and much of the progressive intelligentsia is ambivalent if not downright hostile to the “gig” economy. Ultimately, resistance to regulations relating to this tsunami of part-time employment could be something that Trump’s big business advisers might share in common with the techies.

    More important will be the issue of jobs. It may not work anymore for firms to lower tech wages by offshoring jobs or importing lots of foreign workers under the H-1B visa program, since Trump has denounced it. IBM’s Ginni Rometty, who had been busily replacing U.S. workers with ones in India, Brazil, and Costa Rica, has now agreed to create 25,000 domestic jobs. Other tech companies—including Apple—have also been making noises shifting employment to the United States from other countries. Trump may well feel what “worked” with Carrier can now be expanded to the most dynamic part of the U.S. economy.

    If the tech industry adjusts to the new reality, they may find the Trump regime, however crude, to be more to their liking than they might expect. Companies like Google may never again have the influence they had under Obama, but many techies may be able to adjust. As long as the new president “deals” them in, the techies may be able to stop worrying about Trump and begin to embrace, if not love, him.

    This article first appeared on The Daily Beast.

    Joel Kotkin is executive editor of NewGeography.com. He is the Roger Hobbs Distinguished Fellow in Urban Studies at Chapman University and executive director of the Houston-based Center for Opportunity Urbanism. His newest book, The Human City: Urbanism for the rest of us, was published in April by Agate. He is also author of The New Class ConflictThe City: A Global History, and The Next Hundred Million: America in 2050. He lives in Orange County, CA.

    Photo by Gage Skidmore from Peoria, AZ, United States of America (Donald Trump) [CC BY-SA 2.0], via Wikimedia Commons

    Photo: MCR World