Category: Demographics

  • Where America’s Highest Earners Live

    The mainstream media commonly assumes that affluent Americans like to cluster in the dense cores of cities. This impression has been heightened by some eye-catching recent announcements by big companies of plans to move their headquarters from the ‘burbs to big cities, like General Electric to Boston and McDonald’s to Chicago.

    Yet a thorough examination of Census data shows something quite different. In our 53 largest metro areas, barely 3% of full-time employed high earners (over $75,000 a year) live downtown, according to Wendell Cox’s City Sector Model, while another 11.4% live in inner ring neighborhoods around the core. In contrast, about as many (14.1%) live in exurbs while suburbs, both older and new ones, are home to 71.5% of such high earners.

    New county-level research by Chapman University researcher Erika Nicole Orejola also sheds light on the geography of wealth. Orejola ranked the nation’s 136 largest counties by the proportion of full-time workers in the population who earned over $75,000 in 2015, which represented the 77th percentile of incomes then, and by the share of households earning over $200,000.

    She found that 16 of the 20 counties with the largest share of full-time employed residents earning over $75,000 were functionally suburban, with most people driving to work and living in low to moderate density environments. The other four, interestingly enough, are among the most urbanized parts of the country, including Manhattan and San Francisco.

    Where The High-Wage Earners Are

    The very top of this pyramid consists largely of two archetypes, elite “superstar” cities, but more so well-located suburbs, often near the most dynamic cores. Many are areas that have benefited the most from the post-Great Recession boom in technology as well as in the much larger business and professional services sector.

    Ranking first is New York County, otherwise known as Manhattan, where a remarkable 49.2% of all full-time workers earn over $75,000. That’s up from 40.2% in 2006. Other big counties with high concentrations of high earners include No. 3 San Francisco (49.1%), No. 7 Washington, D.C. (44.9%, up sharply from 29.5% in ’06), and No. 14 King County, Wash. (41.3%), which includes Seattle and its closer in suburbs.

    Virtually all the rest are counties that are primarily suburban, usually close to high-wage core cities. These include, not surprisingly, the California counties of Santa Clara (fourth place) and San Mateo (ninth), which make up Silicon Valley. (In Santa Clara, a whopping 21% of households have annual incomes over $200,000, tops in the country.) Several New York suburbs make the top 20, including Monmouth, N.J. (eighth), Westchester, N.Y. (10th), Fairfield, Conn. (11th), and Nassau County, N.Y. (Long Island) (13th).

    There are also strong pockets of high-wage workers in suburban counties surrounding Boston, including Norfolk (fifth) and Middlesex (12th). Washington, D.C., is flanked by wealthy suburban Fairfax County, which ties with Manhattan for the highest percentage of resident full-time workers making over $75,000 (49.2%) – we gave Manhattan the top ranking for its greater population (1.63 million vs. 1.13 million for Fairfax). Another D.C. suburb, Montgomery County, Md., ranks sixth. And outside Philadelphia, Chester County ranks 17th.

    The pattern holds away from the East and West coasts. The Houston suburb of Fort Bend County ranks 18th and the Dallas suburb of Colin County ranks 19th. Near Chicago, DuPage County ranks 24th and Lake County 27th. Oakland County outside of Detroit ranks 25th, and 29th-ranked Johnson County, Kan., is the most dynamic part of the Kansas City regional economy.

    Counties housing some of the nation’s largest cities don’t fare well in this ranking, but that isn’t necessarily because the wealthy aren’t there. The nation’s largest county, Los Angeles, ranks a mere 74th, with 24% of the full-time employed population earning over $75,000; in nearby suburban Orange County the proportion is 33.8%. But that’s because L.A. is much larger– L.A. County has more than double the number of high earners as Orange Country, 808,000 vs. 360,000. Similarly Cook County in Illinois, which includes Chicago and its closer in suburbs, places 55th with a 27.7% share of high earners, but it’s still home to 499,350 people making over $75,000, 2.3 times as many as live in higher-ranked DuPage and Lake County combined, and the high earner population in Cook County has been growing faster. Kings County, N.Y., aka Brooklyn, comes in 66th with 25.4% of the full-time working population making over $75k, but that’s still 221,000 high earners, and it’s had the second fastest growth rate in its high earner population of any large county since 2006.

    The Bronx, long a poster child for urban poverty, clocks in 132nd, fourth from the bottom, but it ranks 11th for the growth rate in the proportion of its population that earns high incomes, up from 7.2% in 2006 to 12.3% in 2015.

    Households Over $200,000 Income: The Suburban Connection

    Much the same pattern applies to households with incomes over $200,000 annually. The same four urban core counties rank highly: San Francisco is third with 20.4% of households making over $200,000 a year, more than double the proportion in 2006, New York County is fifth, Washington, D.C., ranks 16th and the mixed suburban-urban core of the Seattle area, King County, Wash., places 20th. All the rest of the top 20 are firmly suburban, led by Santa Clara, where 21% of households earn $200,000 a year, followed closely by the D.C. suburb of Fairfax County, Va.

    So what gives here? The Center for Demographics and Policy at Chapman University just completed a national survey, fielded and tabulated by The Cicero Group, of 1,191 professionals aged 25-64 with household incomes greater than $80,000, and who work in education, healthcare, information technology, finance or other professional services jobs. What we found may help us understand what high income professionals are looking for in terms of location.

    The survey found priorities for actual high-end workers do not largely follow the “hip and cool” agenda so promoted by some urban pundits and inner city developers. In fact, the biggest factors influencing location, the respondents told us, are such prosaic factors as housing costs — generally the number one issue — jobs for a spouse, commute times, proximity to family, and K-12 quality.

    Features commonly cited as reasons for an urban revival, like cultural amenities and nightlife, are not so critical with this demographic. In our survey, nearly 40% cited housing costs and 30% commute times as reasons why they would choose not to move to a place. In contrast, barely 5% prioritized “access to culture” or “nightlife.”

    The needs of families seem paramount. There are certain factors that are “must haves , such as affordable housing, jobs for spouses and reasonable commute times,” notes the survey’s designer, Chapman University analytics expert Marshall Toplansky.

    The message for cities and counties seeking to lure professionals may be, think parks and playgrounds rather than edgy music venues — focus on the basics that shape quality of life for families.

    The Future

    Where are these folks likely to go in the coming years?

    There may be some good news here for central cities. Some of the biggest increases in the proportion of high earners in the population took place in places like Kings (Brooklyn) and Queens counties, which have been prime areas for gentrification over the past decade as Manhattan has become extraordinarily pricey. Since 2006, Kings has seen its number of high income earners soar by almost 94% while Queens saw a jump of 78%.

    Other urban core counties have seen some impressive gains, although from a low base, including Baltimore and Philadelphia counties. But here too some suburban areas have shown strong increases, notably Snohomish County, Wash., just outside Seattle, which saw its $75k cohort grow by over 90%. Other suburban areas with strong growth trajectories including Utah County, south of Salt Lake City, Ft. Bend and Montgomery counties outside Houston, as well as several suburban counties outside Boston.

    What appears to be occurring are two things at the same time. There’s a strong concentration of affluent households both in select suburbs of major cities and another one, far more urban, that is beginning to spread, but in many older cities although still at a much lower concentration. Other hotspots appear to be in the newer suburbs of the Sun Belt. The geography of affluence is changing, but in ways that are as diverse as the country as a whole.

    This piece originally appeared on Forbes.com.

    Joel Kotkin is executive editor of NewGeography.com. He is the Roger Hobbs Distinguished Fellow in Urban Studies at Chapman University and executive director of the Houston-based Center for Opportunity Urbanism. His newest book is The Human City: Urbanism for the rest of us. He is also author of The New Class ConflictThe City: A Global History, and The Next Hundred Million: America in 2050. He lives in Orange County, CA.

    Photo: About Fairfax County website.

  • How Much Value Do Economists Assign to Having Married Parents Who Aren’t on Drugs?

    Yesterday I posted my new column from the September issue of Governing magazine in which I write:

    “There are a number of people in the national media who make the argument that things aren’t so bad, that if you look at the numbers this idea that things are horrible in much of America just isn’t true. It’s easy for me to believe this is actually the case in a quantitative sense. But man does not live by bread alone. When you have an iPhone but your community is disintegrating socially, it’s not hard to see why people think things have taken a turn for the worse.”

    Conveniently the Wall Street Journal published an op-ed last week by Harvard economist Martin Feldstein called “We’re Richer Than We Realize” that makes the kind of argument I was talking about, right down to talking about iPhones:

    “Government statistics paint an excessively grim picture of what is happening to real wages and the growth of real national income. Although most households’ take-home cash has been rising very slowly for decades, their standard of living is increasing more rapidly because those wages can now buy new and better products at little or no extra cost. The government’s measure of real incomes gives too little weight to this increase in what take-home pay can buy….First, government statisticians grossly understate the value of improvements in the quality of existing goods and services. More important, the government doesn’t even try to measure the full contribution of new goods and services.

    The other source of underestimation of growth is the failure to capture the benefit of new goods and services. Here’s how the current procedure works: When a new product is developed and sold to the public, its market value enters into nominal gross domestic product. But there is no attempt to take into account the full value to consumers created by the new product per se.

    Or consider consumer electronics. New York University economist William Easterly recently tweeted an image of a 1991 RadioShack newspaper ad and noted that all the functions of the devices on sale—clock radio, calculator, cellphone, tape-recorder, compact-disk player, camcorder, desktop computer—are “now available on a $200 smartphone.” The benefits to consumers from these advances don’t show up in GDP.”

    I don’t dispute anything Feldstein says in the article, which to me sounds completely correct. If you’re a Journal subscriber, you should read it. But it’s very incomplete.

    Feldstein says we should consider the full value of the product innovations we’ve created. He cites improvements in health, for example.

    But where is the expansive treatment of the economic value – the negative economic value – of declines in social conditions? Is the fully expansive impact of violence in some of Chicago’s neighborhoods fully counted? Is the quality of life impact of having a mother strung out on opioids, or having a father who is just plain gone? What’s the impact of going from being able to leave your keys in your car and your house unlocked to realizing that burglary is a very real possibility? And speaking of health, what is the all in effect on a community of the declining life expectancy we’ve experienced? What’s the community impact of an HIV crisis?

    The truth is that along with real economic progress there has been a parallel big degradation in the lived experience of life in much of America, a part of America largely invisible to and certainly not relatable to on a visceral level by most of those in booming sections of global cities. I’m all in favor of understanding the very real way that technology and other innovations have made our lives better, and fully capturing that in statistics. But we need to be equally as diligent in capturing and measuring the downsides of those trends, an effort I’ve read much less about in the papers.

    This piece originally appeared on Urbanophile.

    Aaron M. Renn is a senior fellow at the Manhattan Institute, a contributing editor of City Journal, and an economic development columnist for Governing magazine. He focuses on ways to help America’s cities thrive in an ever more complex, competitive, globalized, and diverse twenty-first century. During Renn’s 15-year career in management and technology consulting, he was a partner at Accenture and held several technology strategy roles and directed multimillion-dollar global technology implementations. He has contributed to The Guardian, Forbes.com, and numerous other publications. Renn holds a B.S. from Indiana University, where he coauthored an early social-networking platform in 1991.

    Photo: The house Aaron grew up in.

  • Africa: 800 Million Jobs Needed

    African economies are in a race to get ahead of the demographic boom.

    While some people in the United States are sweating the presence, against the backdrop of a demographically stagnant white population, of the 11 million undocumented immigrants or of the 30+ million other foreign-born residents, there are far bigger numbers brewing in other parts of the world, indeed numbers that are so large that they could affect decades from now the life of an American citizen far more than the rare determined Mexican or Guatemalan who manages henceforth to scale President Trump’s purportedly impenetrable border wall.


    In the next decades as was so often the case in history, the future shape of the world could once again be decided in Europe and by Europe’s and the West’s handling of Africa’s incipient demographic boom.

    In fact, if you are a generous-minded European who shares the Pope’s noble sentiment and who views the ongoing wave of migrants coming into your country as a benign and positive development; or, if you believe that borders are outdated constructs and that all refugees and other immigrants should be welcomed into the rich world; indeed, if it is your view that anyone who stands in the way of this openness is misguided by racist and nefarious motives, then it behooves you to test the strength of your belief by examining the larger demographic data coming out of Africa and Asia.

    Because it is likely that your kindness and generosity will be, in the next decades, tested to their limits (unless they are limitless like the Pope’s). Because the two million people who have entered Europe on foot or via inflatable rafts in the past few years are, in scale, only thin vapor rising out of the demographic cauldron that is boiling up in Africa and south Asia. There are potentially many many more to come.

    The Numbers

    If Africa does not get its act together to start creating jobs at a rapid rate, there may be tens of millions more such people attempting to migrate in the future. The world population in 2015 stood at 7.3 billion and, on the UN’s medium variant, was expected to rise to 9.7 billion in 2050. Half of this 2.4 billion increase would take place in sub-Saharan Africa where the population will more than double in nearly every country.

    (See at the bottom of the article region and country tables derived from the UN’s medium variant).

    Today sub-Saharan Africa has a billion people. In 2050, it will have 2.1 billion. Of more vivid concern is the fact that the working-age population, aged 15 to 64, will grow by 800 million people from 500 million to 1.3 billion. This 800 million increase is roughly equal to five times the current size of the US labor force.

    It is possible that these numbers are too high. But it should be noted that, in arriving at these forecasts, the UN Population Division has plugged into its assumptions a significant decline in fertility rates across the sub-continent, from 4.8 children per woman today to 3.1 in 2050. On a constant-fertility scenario assuming no decline in the fertility rate, the population boom would be even larger. The working age population would rise to 1.6 billion (instead of 1.3 billion under the median variant) and the increase from today would then be equal to 1.1 billion (instead of 800 million). These are unimaginable numbers that are unlikely to materialize.

    (See this article for the Total Fertility Ratio of every African country from the highest, Niger at 7.7, to the lowest, Mauritius at 1.5.)

    In some ways, the precise magnitude of the boom is unimportant, so long as we accept that it will be somewhere between large and very large. Even a sanguine scenario that would halve the increase of the working age population from 800 million to 400 million would still present a challenge that African economies are today ill-equipped to handle. Economic conditions are insufficient even today to adequately feed, dress, educate and shelter the population.

    One reason to feel some optimism is the fact that the BRIC countries (Brazil, Russia, India and China) also experienced a big rise in their working-age populations in the past thirty-five years and they managed to handle their demographic boom effectively. But this positive outcome was greatly assisted by a steep decline in China’s dependency ratio (DR) from 0.77 to 0.38. The DR is the ratio of dependents, children and the elderly, to working adults.

    By comparison, the DR of sub-Saharan Africa is projected to fall from 0.86 today to a still elevated 0.63 in 2050. The decline in the youth DR (see tables below) is somewhat offset by a rise in the old-age DR that is itself due to an expected increase in life expectancy.

    Certainly, if African fertility falls faster than median variant estimates, the total DR would decline more rapidly and there could be a faster acceleration in job creation and in GDP per capita.

    (See at the bottom of the article the change in the dependency ratio for every country).

    The Drive for Change

    Africa is a wealthy continent but its wealth is highly concentrated in the hands of a few and it is often domiciled outside of Africa, in offshore financial centers, and in real estate and other assets all over the developed world. For decades, this configuration has worked wonders for Africa’s rulers and their entourages.

    If the above numbers are correct, that configuration is not sustainable in the long run. Not only will there be many more Africans in the future than in the past, but the advances in global connectivity through the internet and mobile phones mean that these future Africans will be much more aware of the prevailing living standards in the rich world. Even now, each has in the palm of his hand a direct visual connection to Europe, the United States and other prosperous places. They have seen what a rich society looks like and they want their own place within it.

    So what are the steps that can be taken to improve conditions in Africa? They can be summed up as the following:

    • Fight corruption and cronyism. They divert capital to a small percentage of the population, capital that should be re-invested within Africa.

    • Stop or reduce capital flight from poor to rich countries. A lot of Africa’s money is parked in offshore bank vaults, real estate projects or trophy property in the West.

    • Raise confidence among foreign investors. With less corruption and clearer exit strategies, foreign money would flood into Africa.

    • Institute a more inclusive form of governance that helps spread power and wealth away from the elite and to a greater segment of the population.

    • Create or reinforce an independent judiciary, strengthen the rule of law, including respect for contract law and property rights.

    • Invest in infrastructure. Africa needs trillions of dollars for projects ranging from power generation and water treatment plants to new roads and transportation systems.

    • Boost literacy to rich-country levels, and close the gender gap in literacy. There is a strong correlation between female literacy and fertility. The greater the literacy, the lower the number of children per woman.

    • Lower fertility. There is also a strong correlation between fertility and GDP per capita. Several countries like China that experienced a sharp decline in fertility enjoyed a significant demographic dividend.

    Because there is now on the one hand an entrenched elite that may not easily let go of its privileges and on the other hand enormous demographic pressure on the economy, it is becoming clear that the current configuration is no longer sustainable. Either Africa gets on the fast road to modernization and industrialization, or the continent could suffer dislocation and instability at a near unimaginable scale.

    There is certainly a strong desire by many foreign parties to invest in Africa, but there is a lack of confidence in one’s ability to recover the investment with or without a profit. This major hurdle can be overcome by modernizing Africa’s institutions and its financial system, and as importantly by attacking corruption and cronyism.

    Tables

    The data below were compiled by populyst from the UN Population Division’s medium variant. Note that in sub-Saharan African in 2015-2050:

    • the youth population (under 15 years old) is not quite doubling.

    • the working-age population (15 to 64) is more than doubling.

    • the elderly population (over 64) is more than tripling, albeit from a low base.

    In the world overall, the under 15 number will be stagnant, the 15-64 will grow by 25% and the over 64 will more than double.

    This piece originally appeared on Populyst.net

    Sami Karam is the founder and editor of populyst.net and the creator of the populyst index™. populyst is about innovation, demography and society. Before populyst, he was the founder and manager of the Seven Global funds and a fund manager at leading asset managers in Boston and New York. In addition to a finance MBA from the Wharton School, he holds a Master’s in Civil Engineering from Cornell and a Bachelor of Architecture from UT Austin.

    Photo: Lars Rohwer (Lars Rohwer – per OTRS) [CC BY-SA 3.0], via Wikimedia Commons

  • Trouble in Trump County, USA

    By rights, Scott County, a rural Indiana community of 24,000, should be flourishing. It’s in a pro-business state. It’s part of the large, successful 1.2 million-person Louisville, Kentucky, metro area that’s been growing total jobs (75,300, or 12.9 percent) and manufacturing positions (19,600, or 31.6 percent) in the last five years. Scott County is an easy half-hour commute from downtown Louisville.

    Yet for years, Scott has struggled with severe economic and social challenges. Changes to the economy from automation and globalization eliminated many jobs and sent employers elsewhere. The Great Recession made things worse. The county is also grappling with a major public-health crisis, driven by drugs and HIV. It made national headlines in 2016 after recording 203 new cases of HIV in only about a year and a half. National media—NPR, the Wall Street Journal, and the New York Times—swooped in to cover the story. The HIV outbreak resulted from needle-sharing among drug addicts, particularly to inject the prescription opioid Opana.

    Last November, Donald Trump, who stressed economic stagnation and the drug crisis during his campaign, won two-thirds of the vote in Scott—a substantial improvement on Mitt Romney’s 52 percent take in 2012 and even more impressive in a county that often votes Democratic in state and local elections. Thus, Scott makes a good case study for understanding the working-class dynamics that drove Trump to victory—and what prospects these places have for renewal.

    Located about 30 miles north of the Ohio River, along I-65 between Indianapolis and Louisville, Scott dates its origins to 1820, when the young state of Indiana created it from portions of five other counties. Southern Scott County includes a section of the original land grant that Virginia gave to George Rogers Clark and his men for their service in capturing what became the Northwest Territory from the British during the Revolutionary War. Lexington, one of the towns originally considered for Indiana’s first capital, became the county seat. The county jail briefly held members of the infamous Reno Gang, perpetrators of the nation’s first train robbery, after the Pinkerton Detective Agency captured them. Throughout the nineteenth century, Scott remained small, with the principal excitement being frequent debates and litigation involving moving the county seat to a more central location. Ultimately, the county seat did move, to land adjacent to Centerville, along the Jeffersonville Railroad. This became Scottsburg, today the county’s largest municipality, with 6,700 people.

    Agriculture anchored Scott’s economy. The area’s plentiful produce attracted several canning companies, especially in the northern part of the county, where Austin became a quasi-company town for Morgan Foods, founded there in 1899 and still family-controlled and operating in the city today. Morgan remains a major employer, with workers making private-label soups and other products.

    Scott County was never especially prosperous and suffered repeated economic reversals. Agriculture has always been a high-risk affair. In the postwar years, automation and improved efficiency dramatically reduced local farm employment. Farmers had once worried about keeping their children on the farm after they finished school—but by the 1950s, that concern was obsolete, since there were fewer farming jobs for them to come back to. Economic changes affected other areas, too. In the early days of the car, Scott’s economy flourished along the US 31 corridor, but the construction of I-65 in the late 1950s transformed everything. William Graham, a Republican who has served as Scottsburg’s mayor since 1988, worked originally as a civil engineer and spent a decade helping build the interstate system. He says that within five years of I-65’s opening, half the businesses that had lined US 31 through town were gone; within ten years, 90 percent of them had closed. Yet it took about 20 years for the interstate interchange to develop as a commercial location.

    The community took another blow in the 1980s, when Public Service Indiana canceled its Marble Hill nuclear power-plant project in adjacent Jefferson County. The move, made in the aftermath of the Three Mile Island accident, ended construction after $2.5 billion had already been spent—the costliest U.S. nuclear power-plant project ever abandoned. Many Scott County residents had worked on it. Graham believes that as much as a quarter of the community wound up unemployed as a result.

    Like many working-class communities, then, Scott County was no stranger to economic hardship—and the Great Recession delivered more of it. The local American Steel plant, which made steel cords for tires, closed. Auto-parts supplier Freudenberg-NOK also shuttered, moving its jobs to Mexico. In 2009, Scott County unemployment soared into double digits and stayed there for four years, peaking at 15.3 percent in 2010.

    The county has since rebounded somewhat. Unemployment declined sharply, to 4.8 percent in 2016; jobs are up 16.1 percent in the last five years. But the jobless rate has dropped so substantially partly because Scott’s labor force has declined by more than 800 people, or 7 percent, since peaking in 2006. And Scott County’s per-capita income of $34,400 is only 82.1 percent of the statewide average and 71.6 percent of the national average.

    Economic woes are only part of the gloomy picture. Scott County is also reeling from a drugs and HIV crisis, fueled by the increasing availability of hard drugs. As Indiana State Health Commissioner Dr. Jerome Adams puts it, whereas people once self-medicated with moonshine, now they use drugs such as Opana.

    Changes in medical-industry practices and government policy played an important role in making such drugs more widely available. Until the 1990s, the prescribing of pain medication had been tightly regulated, but that changed as pain management became a key medical goal. In 1996, the American Pain Society declared pain “the fifth vital sign.” The federal standard hospital-patient satisfaction survey asked patients questions, including: “How well was your pain controlled?” And: “How often did the hospital staff do everything they could to help you with your pain?”

    “Only 12.2 percent of the population holds a bachelor’s degree or higher—and that’s up from just 7.3 percent in 2000.”

    The result was a major rise in the quantity of opioid pain prescriptions. Indiana is one of only a few states averaging more than one opioid prescription per resident per year. “Before, you wouldn’t give anyone any Vicodin for a dental procedure,” observes Adams. “Now we’re sending them home with 90 Vicodin. The patient takes nine, leaving 81 in the bottle in the medicine cabinet.” As a consequence, he says, “It’s actually harder [for minors] to get alcohol than it is to get pills in the community.”

    Another problem is family dysfunction. Previous eras of economic hardship took place against the backdrop of a largely intact social structure and stable homes. Divorce and out-of-wedlock births are now far more widespread. As recently as 1990, only about 20 percent of Scott County births were out of wedlock. By 2002, this figure had doubled to more than 40 percent. The causes and effects of these shifts are subject to debate, but it is indisputable that legal reforms facilitated divorce and changing social mores dramatically reduced the stigma associated with out-of-wedlock births. Americans broadly want divorce and even single motherhood to remain socially acceptable choices—yet these behaviors are associated with poor life outcomes.

    Scott County and places like it are dealing with the fallout. Conditions in the county now sometimes resemble stereotypes of the inner city, where parents are unfit or unable to raise their own kids. Graham observes: “One of the biggest changes is grandparents raising grandchildren, where you used to never see that—never.” These social changes occurred nationally but have hit communities like Scott hardest, leaving a sizable segment of the eligible population unemployable, regardless of how many jobs might be available. The problem in many working-class American communities today is as much social as economic.

    But even if they stay off drugs and graduate high school, people in these kinds of communities still face employment hurdles. Today’s jobs require increasingly sophisticated skills, but, like many rural communities, Scott County has low rates of college-degree attainment. Only 12.2 percent of the population holds a bachelor’s degree or higher—and that’s up from just 7.3 percent in 2000. Even many blue-collar jobs—from welding to computer-drive manufacturing—now require significant postsecondary-school training. The skill shortage limits access to jobs, both locally and regionally, and poses an obstacle to business recruitment.

    Taken together, the employment crisis and the social dysfunction produce a sense of malaise in some places. People almost always wave, smile, and say hello in small-town Indiana; but in Austin, for instance, only one person I saw even acknowledged my presence while I drove around. The rest just shambled about with blank stares. One local assured me that had my wife not been with me in the car, prostitutes would surely have approached me, soliciting for money to buy drugs. Scottsburg looks much better, with a healthy business district centered on its interstate interchange, but it, too, has troubles, such as significant retail-storefront vacancy on its courthouse square.

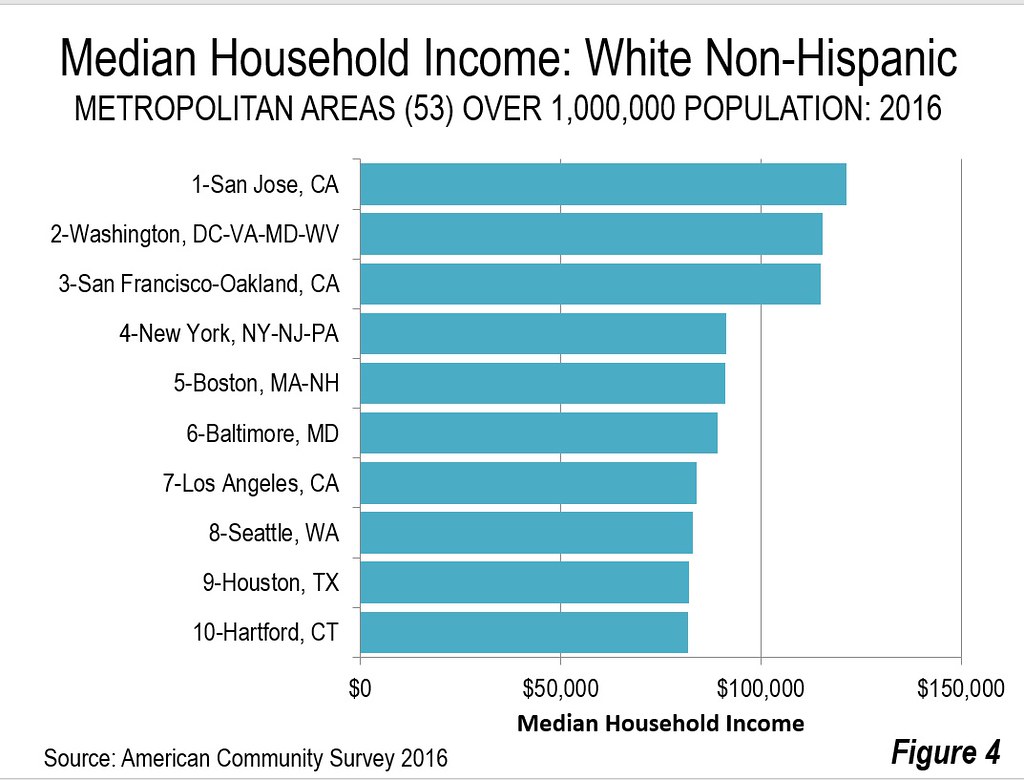
    The difficulties of communities like Scott are all the more striking, considering the region’s economic strengths. Scott is part of the federally defined Louisville metro area. The inclusion of rural areas within metro regions is not unusual. America’s metro areas are defined by commuting patterns, and they include large rural zones. To say that America is a metropolitan nation—86 percent of the country lives in metro areas—doesn’t mean that it all looks like Chicago or New York. Most of the metropolitan population is in suburban and even rural areas, and many rural areas, like Scott, are within easy commuting distance of a city. In Scott’s case, that city is the center of a bustling regional economy that is home to major corporations like Brown-Forman, Humana, and Yum! Foods (parent company of Kentucky Fried Chicken, Pizza Hut, and Taco Bell). In the last five years, the Louisville metro area added 75,300 jobs—a growth rate of 12.9 percent. Manufacturing grew 31.6 percent, adding 19,600 jobs. Ford maintains a major auto-assembly plant there, and General Electric still manufactures appliances in the city. Louisville is also the site of UPS’s primary global air hub. The shipping firm employs more than 20,000 people and supports a major distribution infrastructure.

    The state of Indiana is economically strong, too, enjoying a budget surplus—with savings equivalent to 14 percent of the state’s annual budget—and an AAA credit rating. It has the eighth-best business-tax climate in the nation, according to the Tax Foundation. It’s a right-to-work state that has implemented nearly the full panoply of state-level conservative best practices for boosting business, and it has seen solid results in many places. But smaller, working-class communities without assets like a university have continued to struggle. Even within thriving Indianapolis, working-class neighborhoods and less educated residents have also lagged behind. These results pose a philosophical challenge for conservatives, who have typically assumed that economic prosperity will follow from implementing such business-friendly policies. For Indiana, a favorable tax and regulatory climate may be a virtue, but it hasn’t been sufficient to help everyone.

    Other factors have played a role in making places like Scott County especially vulnerable to pathology and stagnation. Scott was always a more hardscrabble place than some surrounding areas. One suggestive way to compare small towns is to look at their infrastructure, especially the existence of sidewalks and the quality of the houses. More historically prosperous small towns often have sidewalks through much of the city. Sidewalks are scarce in Austin; in Scottsburg, they line the courthouse square but are otherwise not prevalent. In many surrounding towns, by contrast, sidewalks stretch throughout much of their historic areas. Nearby Seymour, hometown of John Mellencamp, doesn’t just have sidewalks but also alleys and landscaped medians in some sections. Similarly, Scottsburg and Austin boast fewer grand old Victorian houses than one often finds even in many small towns; instead, small workers’ cottages predominate.

    Demographics are another drag on the county. Much of southern Indiana, like the Ohio River Valley in general, was heavily settled by German immigrants. To this day, 24 percent of the people in Clark County, to the immediate south, list their ancestry as German. To the immediate north, in Jackson County, that figure is nearly 29 percent; there’s even a Lutheran high school in Seymour. Scott County, by contrast, is only 15.6 percent German, being more Scotch-Irish-dominated. The area saw a heavy influx of Appalachian migration, with former residents of Hazard, Kentucky, flocking to Austin, in particular, drawn by jobs at Morgan Foods. Scott’s largest listed ethnicity, at 20 percent, is “American”—an appellation commonly used by the Scotch-Irish. Appalachia has long been known for its entrenched poverty and social dysfunction. The Centers for Disease Control recently released a list of counties at high risk for HIV and hepatitis C infections, and Appalachian areas were heavily represented. J. D. Vance’s best-selling book Hillbilly Elegy describes the tragic struggles of Appalachians in the modern world. Thus, communities like Scott County have a smaller reservoir of economic and social capital to recover from the big technological, economic, and social forces acting on them.

    Still, for all its drawbacks, Scott County is working hard to improve its circumstances. The first priority was to address the HIV outbreak, and here, the state has played a vital part. The tight-knit Austin community had a long history of believing that it could solve its own problems, but the outbreak was too much to handle on its own. Even in this rural area, it turns out, many people didn’t drive or own a car, making effective treatment a struggle. So the state set up a “one-stop shop” in an Austin community center. The national media focused almost exclusively on the needle-sharing dimension. But the facility also provided HIV testing and treatment, addiction-recovery counseling, health-insurance enrollment, state identification cards, and birth certificates. The result: a dramatic decline in the rate of new infections. The drug crisis isn’t over, but tremendous progress has been made in stopping the spread of HIV.

    The one-stop shop was created by then-governor Mike Pence’s executive order. Results suggest that it could be a model for how to deal with disease outbreaks in communities similar to Scott. Adopting it might be politically contentious in red states because it would involve spending more money to open field-office locations rather than relying on regional or countywide service centers; states have preferred service consolidation in rural areas, on efficiency grounds. But that old approach might not work anymore for deeply troubled communities.

    Other developments offer hope on the addiction front. Medical and government officials are taking steps to reduce prescription opioid abuse. Last year, the American Medical Association recommended that the “pain is the fifth vital sign” concept be dropped. Washington is planning to eliminate the pain questions from the patient-satisfaction survey form. In March 2017, an FDA panel concluded that the benefits of Opana no longer outweighed the drug’s risks; the FDA is now considering whether to take regulatory action. This is just a start, though. The drug epidemic in America goes beyond Opana or OxyContin—it involves many illegal substances, including meth, fentanyl, and heroin. While reducing the scourge of legal-painkiller abuse is a worthy goal, stopping the flow of drugs like heroin will be much tougher.

    Beyond fighting back against drugs and HIV, Scott County has also made a good start on retraining workers to help them find jobs and offering inducements to attract employers. The main effort on both counts is Scottsburg’s new $10 million Mid-America Science Park, financed half from stimulus funds and half from reserves in the local Tax Increment Financing district. Despite its own serious troubles, the county generously delayed the science park’s planned 2012 opening so that it could be used as a temporary high school after a tornado destroyed nearby (Clark County) Henryville’s building. Today the science park hosts training facilities for workers and high school students. IvyTech, Indiana’s community-college system, has opened a campus there.

    Some training is employer-specific. For example, Jeffboat in nearby Jeffersonville, America’s largest inland shipbuilder, donated a special welding training machine to help people learn how to perform the extra-thick welds needed on the barges that it constructs. The science park’s goal is to become, in effect, an outsourced training department for employers—albeit one they don’t have to pay for. Mayor Graham tells local companies: “My goal is that if you need any training done, I’ll do it. You won’t have to do it.” This wouldn’t just be for new hires. “It’s also for our incumbent workers,” Graham says. “If they need to get their skills upgraded—and they do—they can come here and take some training.”

    In a community that needs jobs, Graham’s can-do attitude is admirable. But it prompts the question: Why can’t companies do their own training, as they did before? The answer, in part, has to do with globalization. Businesses still manufacturing in the U.S. face such stiff competition from foreign firms that they often can’t afford to invest in workforce development. Nor can they always pay their workers much, which helps explain the low personal incomes in Scott County. (It’s notable that Jeffboat is protected from global competition by the notorious Jones Act, which requires domestic water transportation to be done using only American-made boats.) Scottsburg did lose one major employer, Freudenberg-NOK, to Mexico, but Graham is reluctant to blame trade deals like NAFTA. “I’m not sure that any of us here are qualified to say. I question it, but I’m not going to say it’s a bad thing.” Railing against trade may play well politically, but Graham would rather focus on what he can do with the tools available to him.

    The outcome, so far, is encouraging. Globalization gave back some of what it took away when the Japanese firm Tokusen bought the shuttered wire plant and reopened it. Electronics firm Samtec merged two regional locations into one facility at the science park that will employ 300—a big jobs number in a community the size of Scott County.

    These local business expansions are important because the purpose of Mid-America Science Park isn’t only training local workers for jobs but also attracting employers. Indiana local governments rely heavily on property taxes. The state’s tax-cap system limits single-family-home taxes to 1 percent of property value; commercial property is capped at 3 percent of value. This puts a premium on attracting commercial development. So the science park includes infrastructure targeted at business attraction, including generous meeting space, ultrahigh-quality videoconferencing capabilities, and rooms certified as secure enough for secret military-related teleconferences.

    State and local government have had some success in adjusting to globalization and technology-driven disruption, but they’re weak actors in the face of broad economic forces. Only the federal government can hope to shape them fundamentally. Donald Trump was elected in part because he promised to change the status quo on globalization and the economy. The challenge will be reforming the system to help working-class communities without harming the aggregate economy. That’s not likely to be a simple task.

    Even favorable federal policies will make little difference if communities like Scott can’t do something to address their crippling social problems—especially family breakdown, which enables all the others. Job openings go unfilled in communities with high proportions of drug addicts and dropouts. If changing economic conditions is hard, reversing negative social trends is even harder. A sense of humility about what can be accomplished is wise.

    Scott County has made a good start on retraining workers to help them find jobs while offering inducements to attract employers. (MARK CORNELISON/KRT/NEWSCOM)

    Does Scott County have a long-term future? “Give me two to three years,” says Scottsburg’s Graham, on his plans to improve the struggling downtown. One key area of focus in these localities is preserving historic downtown architecture, which even hardened urbanites love. Local leaders in Scott County understand the importance of these unique districts, not only to their community’s identity but also to the long-term viability of attracting and retaining residents. But they have little money to spend on such efforts. Overall, Graham is realistic but hopeful. “Do we have a terrible situation?” he asks, referring to the HIV outbreak. “We certainly do. We’re doing something about it.”

    His confidence may seem unwarranted to outsiders, but Scott County does have a track record of coming through crises. It survived agricultural automation, the disruption of the interstate highway, the closure of Marble Hill, and other setbacks. More recently, when businesses threatened to leave over poor Internet quality in the early 2000s, small-town Scottsburg built one of America’s first wireless municipal broadband systems to provide web service after the local providers refused to upgrade the community’s capacity. And Scott County retains its significant geographic advantages.

    While Scott and other working-class American communities may never be highly prosperous or glamorous, they might yet pull through this trial, as they have through others in the past. “What makes Scott County unique?” Adams asks. “My honest answer is: absolutely nothing. There are Scott Counties all throughout the country. All of the ingredients exist in many communities.” How Scott and its brethren fare will tell us a lot about America’s fate in the Trump years.

    This piece originally appeared in City Journal.

    Aaron M. Renn is a senior fellow at the Manhattan Institute, a contributing editor of City Journal, and an economic development columnist for Governing magazine. He focuses on ways to help America’s cities thrive in an ever more complex, competitive, globalized, and diverse twenty-first century. During Renn’s 15-year career in management and technology consulting, he was a partner at Accenture and held several technology strategy roles and directed multimillion-dollar global technology implementations. He has contributed to The Guardian, Forbes.com, and numerous other publications. Renn holds a B.S. from Indiana University, where he coauthored an early social-networking platform in 1991.

    Photo source: https://www.healthline.com/health-news/opioids-problems-for-chronic-pain-patients

  • The Changing Face of Anti-Semitism

    When Donald Trump was elected president, much of American Jewish leadership reacted with something close to hysteria. To some, Trump’s presidency reflected the traditional face of the anti-Semitic right — xenophobic, nationalist and culturally conservative.

    Trump’s handling of certain events, notably the Charlottesville white nationalist rally, have revived earlier charges that the president winks at right-wing racist supporters, even considering them part of his base.

    The disdain toward Trump in the rabbinical community — often more liberal than congregants — was reflected in its cancellation of the annual New Year (Rosh Hashanah) call with the president. Yet, for all of the justifiable worries about the extreme right, the more consequential threat may well come from the left side of the spectrum.

    The European model

    I first became aware of this shift almost 15 years ago, when my wife, Mandy, and I visited the famous Nazi hunters, Serge and Beate Klarsfeld, at their offices in Paris. One would expect Serge, whose father died in the concentration camps, to focus his concern on aspiring brown shirts, but, instead, he suggested that the biggest long-term threats would come increasingly from the left and parts of Europe’s expanding Muslim immigrant communities.

    Some Jewish groups seem slow to realize how much things have changed since 1940. To be sure, the rise of right-wing nationalism across Europe is frightening, but, increasingly, the primary locus of European anti-Semitism can be found in heavily Muslim communities around cities such as Paris, as well as in Europe’s universities, where anti-Israel sentiments are increasingly de rigueur.

    Of course, one can question some Israeli policies — as I do regarding the expansion of settlements — without being an anti-Semite. But the anti-Israel focus of groups like those in the Boycott, Divestment and Sanctions, or BDS, movement clearly represents a new face of anti-Semitism. As the liberal French philosopher Bernard-Henri Lévy argues, this movement targets the Jewish state, but leaves totally unscathed far more brutal, homophobic and profoundly misogynist Muslim states. A double standard for Jews remains an enduring feature of anti-Semitic prejudice.

    Some, like the chief rabbi of Barcelona, think it’s time for Europe’s Jews to move away, as many, particularly from France, are already doing. Overall, Europe’s Jewish population is less than half of what it was in 1960.

    Nor is the immediate prospectus positive, as many leftist parties in Europe are increasingly dependent on Arab and other Muslim voters, many of whom come from places where over 80 percent of the public holds strongly anti-Jewish views. Even in the United Kingdom, opposition Labor leader Jeremy Corbyn has cavorted openly with leaders of vehemently, and openly, anti-Semitic groups like Hamas and Hezbollah. If elevated to the prime minister’s post — which is no longer inconceivable, given his strong run in the last election — the consequences for Israel and Britain’s dwindling Jewish community could prove difficult.

    Read the entire piece at The Orange County Register.

    Joel Kotkin is executive editor of NewGeography.com. He is the Roger Hobbs Distinguished Fellow in Urban Studies at Chapman University and executive director of the Houston-based Center for Opportunity Urbanism. His newest book is The Human City: Urbanism for the rest of us. He is also author of The New Class ConflictThe City: A Global History, and The Next Hundred Million: America in 2050. He lives in Orange County, CA.

    Photo: Chatham House, London [CC BY 2.0], via Wikimedia Commons

  • Update on Median Household Incomes: 2016

    Just released Survey of Current Population (CPS) indicates that median household income in the United States was $59,039 in 2016 (Note). This is four percent above the 2002 level, when the ethnic surveying system was adopted. This article provides data for each of the metropolitan areas (more than 1,000,000 population), including the overall median, and figures for the largest ethnicities (White Non-Hispanic, African-American, Asian, and Hispanic. The ethnicity of households is determined by “householder,” (formerly called “head of household”). The major metropolitan area data is shown in the table at the bottom of the article.

    Median Household Income by Largest Ethnicity

    Despite all the talk of white “privilege”, it’s actually Asian households that have by far the highest median incomes of the four largest ethnicities. It has been this way for decades, from the very earliest Census Bureau income estimates that separated out Asians. And Asians have been so successful that they are leaving the other large ethnicities “in the dust.”

    According to the Census Bureau, Asians are persons “having origins in any of the original peoples of the Far East, Southeast Asia, or the Indian subcontinent, including, for example, Cambodia, China, India, Japan, Korea, Malaysia, Pakistan, the Philippine Islands, Thailand, and Vietnam.” In 2016, Asian household median household income was $81,431, compared to $65,041 for White Non-– Hispanic households.

    Asian (alone) income has been separately estimated since 2002 when it was 12 percent higher than the median income of White Non-– Hispanic (alone) households. Even before that, from 1987 to 2001, Asian income was reported along with that of Pacific Islanders and was 14 percent above that of White Non-– Hispanic households. That gap has widened substantially and now Asian households have a median income 25 percent above White Non-– Hispanic households. The gap has increased because White Non-– Hispanic households have stagnated, rising four percent inflation adjusted terms between 2002 in 2016, while Asian incomes have increased 16 percent.

    Hispanic median household income was $47,675, an increase of eight percent from 2002. African-American (alone) median household income was $39,490, up two percent ,an even lower increase than White Non-– Hispanic four percent from 2002 (Figure 1).


    San Jose: America’s Most Affluent Metropolitan Area for Households, https://en.wikipedia.org/wiki/San_Jose,_California#/media/File:AlumRockViewSiliconValley_w.jpg (Creative Commons)

    Highest and Lowest Household Metropolitan Area Incomes: Overall

    The highest median household income is in San Jose (photo above), at $110,400 annually, according to the American Community Survey, 2016. San Jose also has the highest median household income for all four ethnicities. Nearby San Francisco has the second highest median household income, $96,700. Washington is third, at $95,800. Fourth ranked Boston is more than $10,000 lower, while fifth ranked Seattle is nearly $4,000 below Boston. However, each of these places have very high costs of living that can more than make up for their advantages relative to cities with lower incomes, lower costs of living and, in an environment of graduated income taxes, lower annual tax payments.

    The balance of the top 10 includes Baltimore, Minneapolis-St. Paul, Hartford, Denver and New York (Figure 2).

    Tucson had the lowest median household income, at $47,800. Six of the least affluent 10 major metropolitan areas were in the South, including New Orleans, Memphis, Tampa – St. Petersburg, Miami, Birmingham and Orlando. The East and Midwest each had one in the bottom 10, Cleveland and Buffalo. The West’s Las Vegas was also in the least affluent 10.

    Asians Households: The Most Affluent

    The three most affluent major metropolitan areas for Asian households duplicate the overall ratings, above, San Jose, San Francisco and Washington. Raleigh ranks fourth and Baltimore fifth, followed by Seattle, Charlotte, Boston, Dallas-Fort Worth and Cleveland (Figure 3).

    Tucson also had the lowest Asian median household income, with Buffalo and New Orleans only slightly higher. Grand Rapids was the fourth least affluent followed by Rochester. Oklahoma City, Birmingham, Jacksonville, Indianapolis and Las Vegas rounded out the least 10 affluent Asian households.

    White Non-Hispanic Households

    The top three among White Non-Hispanic households are the same as the overall and Asian rankings, though Washington is rated second, instead of third, with San Jose first and San Francisco third. New York was fourth, while Boston was fifth. The balance of the top ten for White Non-Hispanic median household incomes included Baltimore, Los Angeles, Seattle, Houston, and Hartford (Figure 4).

    Tucson had the lowest White Non-– Hispanic median household income, at $53,700. Tampa St. Petersburg, Pittsburgh, Louisville and Buffalo made up the balance of the bottom five. Rochester, Cleveland, Oklahoma City, Birmingham and Las Vegas occupy positions six through 10.

    Hispanic Households

    As with White Non-Hispanics, the highest Hispanic median household incomes were in San Jose, Washington and San Francisco. Baltimore and Seattle ranked fourth and fifth. The balance of the top 10 included Austin, Pittsburgh, Jacksonville, San Diego and Chicago (Figure 5)

    Rochester had the least affluent Hispanic households, with a median income of $28,600. The balance of the bottom five included Buffalo, Indianapolis, Providence, and New Orleans. Milwaukee, Philadelphia, Tucson Louisville and Oklahoma City were also in the bottom 10.

    African-American Households

    The highest income African-American households were in San Jose, Baltimore and San Diego, followed by Denver and Austin. The fifth through 10th positions were occupied by New York, Raleigh, Boston, Atlanta, and Riverside-San Bernardino (Figure 6).

    Buffalo had the lowest median household income among African – Americans, at $27,600. Milwaukee, New Orleans, Cleveland, and Rochester were also below 30,000. The sixth through 10th positions were occupied by Oklahoma City, Cincinnati, Pittsburgh, Indianapolis and Louisville, with incomes between $31,000 and $34,000.

    The Challenge

    The stagnation of incomes since 2002 is apparent, especially at the overall level and among African-American and White Non-Hispanic households. It is to be hoped that the future results in a return of historic economic growth, which is the only sure way of sustainably increasing the incomes of all households and all ethnicities.

    Note: Because of differing data collection approaches, the Survey of Current Population (CPS) income data is somewhat higher (2.5 percent) than that of American Community Survey (ACS) 2016 figure of $57,617. CPS data is not available for most geographies. Because the principal, national and ethnicity analysis by the Census Bureau relies on CPS data, it is used here for the national level.

    Median Household Income: 2016: Metropolitan Areas over 1,000,000 Population
    Metropolitan Area All Rank White Non-Hispanic Rank African-American Rank Asian Rank Hispanic Rank
    Atlanta, GA  $   62,613    22  $   75,435    19  $   48,161    10  $   80,209    22  $ 50,563    21
    Austin, TX  $   71,000    12  $   80,599    13  $   49,871      6  $   87,817    12  $ 56,306      6
    Baltimore, MD  $   76,788      6  $   89,329      6  $   53,231      3  $   97,252      5  $ 69,525      4
    Birmingham, AL  $   52,226    47  $   61,662    45  $   37,336    34  $   63,144    47  $ 47,083    26
    Boston, MA-NH  $   82,380      4  $   91,051      5  $   48,444      9  $   90,098      8  $ 46,708    28
    Buffalo, NY  $   53,487    45  $   60,342    49  $   27,635    52  $   45,726    52  $ 28,939    52
    Charlotte, NC-SC  $   59,979    31  $   67,742    28  $   42,108    22  $   90,291      7  $ 43,680    36
    Chicago, IL-IN-WI  $   66,020    16  $   79,865    15  $   37,258    35  $   87,469    13  $ 52,730    10
    Cincinnati, OH-KY-IN  $   60,260    28  $   65,438    34  $   32,429    46  $   86,953    14  $ 50,932    20
    Cleveland, OH  $   52,131    48  $   61,078    47  $   29,376    49  $   88,735    10  $ 41,699    43
    Columbus, OH  $   60,294    27  $   65,465    32  $   36,679    37  $   70,224    37  $ 42,820    38
    Dallas-Fort Worth, TX  $   63,812    20  $   78,994    17  $   45,588    18  $   89,177      9  $ 48,311    24
    Denver, CO  $   71,926      9  $   80,668    12  $   50,318      5  $   72,038    34  $ 51,955    15
    Detroit,  MI  $   56,142    38  $   64,620    37  $   33,558    42  $   88,045    11  $ 49,715    22
    Grand Rapids, MI  $   60,212    29  $   63,872    40  $   34,667    41  $   54,819    50  $ 41,997    41
    Hartford, CT  $   72,559      8  $   81,839    10  $   47,328    13  $   83,141    18  $ 42,200    40
    Houston, TX  $   61,708    25  $   82,015      9  $   47,588    12  $   85,527    16  $ 46,488    29
    Indianapolis. IN  $   56,750    37  $   63,826    41  $   32,696    44  $   64,404    45  $ 35,941    51
    Jacksonville, FL  $   56,840    36  $   62,373    42  $   41,007    26  $   63,473    46  $ 54,447      8
    Kansas City, MO-KS  $   61,385    26  $   67,607    29  $   36,575    38  $   68,609    41  $ 45,672    33
    Las Vegas, NV  $   54,384    44  $   61,833    44  $   37,410    32  $   65,423    44  $ 45,831    32
    Los Angeles, CA  $   65,950    18  $   84,075      7  $   45,469    19  $   75,879    27  $ 52,076    13
    Louisville, KY-IN  $   54,546    43  $   60,235    50  $   33,287    43  $   65,867    43  $ 41,628    45
    Memphis, TN-MS-AR  $   49,809    51  $   67,781    27  $   35,542    39  $   72,892    33  $ 42,244    39
    Miami, FL  $   51,362    49  $   65,176    35  $   40,239    29  $   69,547    39  $ 45,938    30
    Milwaukee,WI  $   58,029    35  $   68,540    26  $   28,942    51  $   82,121    21  $ 39,389    48
    Minneapolis-St. Paul, MN-WI  $   73,231      7  $   78,864    18  $   34,720    40  $   73,010    32  $ 51,122    18
    Nashville, TN  $   60,030    30  $   65,441    33  $   41,374    25  $   71,900    35  $ 44,503    34
    New Orleans. LA  $   48,804    52  $   64,152    39  $   29,296    50  $   46,860    51  $ 37,463    49
    New York, NY-NJ-PA  $   71,897    10  $   91,454      4  $   49,488      7  $   83,063    19  $ 47,266    25
    Oklahoma City, OK  $   55,065    42  $   61,536    46  $   31,344    47  $   59,865    48  $ 41,657    44
    Orlando, FL  $   52,385    46  $   62,218    43  $   37,356    33  $   76,575    25  $ 42,959    37
    Philadelphia, PA-NJ-DE-MD  $   65,996    17  $   79,869    14  $   39,609    30  $   74,597    28  $ 40,334    47
    Phoenix, AZ  $   58,075    34  $   64,286    38  $   42,006    23  $   73,380    30  $ 45,883    31
    Pittsburgh, PA  $   56,063    40  $   59,046    51  $   32,534    45  $   76,005    26  $ 55,641      7
    Portland, OR-WA  $   68,676    14  $   71,859    23  $   37,452    31  $   79,128    23  $ 52,507    11
    Providence, RI-MA  $   61,948    23  $   66,853    30  $   41,401    24  $   85,568    15  $ 36,639    50
    Raleigh, NC  $   71,685    11  $   79,539    16  $   49,433      8  $ 100,396      4  $ 44,346    35
    Richmond, VA  $   62,929    21  $   74,900    20  $   43,265    20  $   85,510    17  $ 51,084    19
    Riverside-San Bernardino, CA  $   58,236    33  $   64,699    36  $   47,879    11  $   77,682    24  $ 51,892    16
    Rochester, NY  $   55,134    41  $   60,441    48  $   29,527    48  $   58,907    49  $ 28,553    53
    Sacramento, CA  $   64,052    19  $   71,675    24  $   40,969    27  $   69,088    40  $ 51,555    17
    St. Louis,, MO-IL  $   59,780    32  $   66,815    31  $   36,712    36  $   68,112    42  $ 52,005    14
    Salt Lake City, UT  $   68,196    15  $   72,356    21       $   73,650    29  $ 49,637    23
    San Antonio, TX  $   56,105    39  $   72,280    22  $   46,754    15  $   71,485    36  $ 46,943    27
    San Diego, CA  $   70,824    13  $   81,431    11  $   52,715      4  $   82,136    20  $ 53,076      9
    San Francisco-Oakland, CA  $   96,677      2  $ 115,056      3  $   46,571    16  $ 105,295      2  $ 70,290      3
    San Jose, CA  $ 110,040      1  $ 121,344      1  $   65,438      2  $ 128,175      1  $ 70,999      1
    Seattle, WA  $   78,612      5  $   82,935      8  $   47,270    14  $   91,036      6  $ 59,073      5
    Tampa-St. Petersburg, FL  $   51,115    50  $   54,295    52  $   40,760    28  $   69,574    38  $ 41,767    42
    Tucson, AZ  $   47,560    53  $   53,722    53  $   43,154    21  $   45,648    53  $ 40,394    46
    Virginia Beach-Norfolk, VA-NC  $   61,805    24  $   71,553    25  $   46,209    17  $   73,191    31  $ 52,353    12
    Washington, DC-VA-MD-WV  $   95,843      3  $ 115,474      2  $   69,246      1  $ 103,746      3  $ 70,523      2
    Source: American Community Survey 2016
    Blank indicates insufficiently large sample size


    Wendell Cox is principal of Demographia, an international public policy and demographics firm. He is a Senior Fellow of the Center for Opportunity Urbanism (US), Senior Fellow for Housing Affordability and Municipal Policy for the Frontier Centre for Public Policy (Canada), and a member of the Board of Advisors of the Center for Demographics and Policy at Chapman University (California). He is co-author of the “Demographia International Housing Affordability Survey” and author of “Demographia World Urban Areas” and “War on the Dream: How Anti-Sprawl Policy Threatens the Quality of Life.” He was appointed to three terms on the Los Angeles County Transportation Commission, where he served with the leading city and county leadership as the only non-elected member. He served as a visiting professor at the Conservatoire National des Arts et Metiers, a national university in Paris.

  • Back Office Decentralization

    In my “superstar effect” series I’ve been presenting examples of where superstars (whether individuals or cities) are generating a disproportionate share of the rewards these days.

    I mentioned that I had some counter-examples and wanted to share one today. Namely that backoffice decentralization, or the move of less-than-superstar functions out of superstar cities, has benefitted a certain class of places like Denver and Salt Lake City.

    The Wall Street Journal, for example, recently wrote about the decentralization of West Coast finance out of San Francisco:

    Traditional finance hubs have yet to recover all the jobs lost during the recession, but the industry is booming in places like Phoenix, Salt Lake City and Dallas. The migration has accelerated as investment firms face declining profitability and soaring real estate costs.

    The market’s shift to low-cost passive investing compounds those difficulties, pushing firms to look for new ways to cut costs.

    Charles Schwab is emblematic. Since announcing its relocation strategy in early 2013, the company has shrunk its San Francisco headquarters to fewer than 1,300 people, a 45% decrease. Its 47-acre campus south of Denver is now Schwab’s largest office, employing almost 4,000 people. An expanded office in Austin, Texas, will be completed next year, and construction is under way on a new location near Dallas.

    Surely high end finance around tech is still in the Bay Area. But more workaday firms like Charles Schwab can’t justify a huge labor force there.

    They name some of the places benefitting from this exodus, what I’ve previous labeled “horizontal” cities (in contrast to the “vertical” superstar cities). It’s part of the sorting of the economy that has been going on.

    In some respects its better to be a horizontal than a vertical city. The costs are lower. You’re more likely to get large scale employment. And you can be more diverse.

    The problem is that there are only a limited number of these successful horizontal cities. There are plenty of places that are succeeding in neither model.

    But for places like Salt Lake City, Denver, Austin, Nashville, Columbus, etc. they don’t need to be Manhattan or San Francisco. They can still have great success without being superstar oriented.

    This piece originally appeared on Urbanophile.

    Aaron M. Renn is a senior fellow at the Manhattan Institute, a contributing editor of City Journal, and an economic development columnist for Governing magazine. He focuses on ways to help America’s cities thrive in an ever more complex, competitive, globalized, and diverse twenty-first century. During Renn’s 15-year career in management and technology consulting, he was a partner at Accenture and held several technology strategy roles and directed multimillion-dollar global technology implementations. He has contributed to The Guardian, Forbes.com, and numerous other publications. Renn holds a B.S. from Indiana University, where he coauthored an early social-networking platform in 1991.

    Photo: Mike Mozart, CC BY 2.0

  • Neighborfest: Building a Stronger, More Connected World from the Block Up

    As we write this piece, the whole world is watching in disbelief as rain and flooding wreak devastation again along the Gulf Coast and Florida. Upwards of 50 inches of rain fell in parts of Southern Texas, thousands have been displaced from their homes in Miami and Houston, and some residents may never fully recover their livelihoods and homes. The Mayor of Houston called upon neighbors to help each other while first responders did their best to respond to the thousands of calls for help. It is in the shadow of their heroism and grace that we offer the following approach to mitigating the impact of future events in your communities.

    “All disasters are local” is a phrase we hear often in the emergency management field. While the initial coverage of large events is often framed at the city level, the narrative soon shifts to the neighborhoods that experience heightened levels of damage and stress. The 9th Ward, Red Hook, and the Rockaways have all become household names due to major disasters which unfolded there. In San Francisco, the Marina district became the center of the world as the media covered the events that followed the famous “World Series” Earthquake of 1989. As the helicopters flew overhead, firefighters desperately tried to stop flames from leaping from house to house but were hampered by broken water pipes. Residents in the area leapt to action. They started guiding their vulnerable neighbors out of harm’s way and took the lead on running fire hoses from the fire boats on the bay up to the fire scene so the fire teams could do their job.

    That day, every resident became a first responder.

    Role of Social Capital in Emergency Preparedness

    Fast-forward almost 30 years, and the field of emergency management has evolved in the face of mountains of evidence that shows that, while professional personnel and gear are essential, well-connected communities that work together on both challenges and opportunities every day are better positioned to respond to times of stress, experience lower levels of impact, and recover faster to a more improved condition. In other words, they are resilient.

    Connections, also known as social cohesion or social capital, serve as the invisible fabric that connects us with our family, neighbors, and friends. These ties make up a critical but underappreciated component of strong neighborhoods and thriving cities. Having more connections and trust makes collective action more likely. We can solve problems more easily and are more likely to engage in planning meetings, attend PTA bake sales, and tackle crime and blight.

    When it comes to preparing for large disasters, we may imagine that building better roads, ports, and buildings will be enough to give our society resilience to future shocks. Unfortunately, traditional investments in the built environment to mitigate risks are important but not adequate. Research from communities around the world shows that social, not physical, infrastructure is the key to building resilient neighborhoods and cities. These neighborhoods and towns can recover from any kind of shock to residents, whether they’re extreme weather events or terrorism.

    Knowing the importance of social ties, we still must help our residents and their surrounding community get ready to meet the immediate needs of their loved ones and vulnerable neighbors. Social cohesion is great, but they still need to feed and care for each other under intense circumstances — so how do we get them to prepare for that mission without using fear based messaging?

    In San Francisco, we’ve developed an easy solution: “Throw a Block Party!”

    Introducing Neighborfest

    Preparedness messaging to date has been presented as an almost arduous checklist of things that you have to do above and beyond your existing list of tasks. While all would agree these investments make sense, they appear to be more like “homework” than anything else.

    When we unpack the phrase “All disasters are local,” it can be either perceived as a clinical assessment of what happened, or a roadmap for an approach that will ensure the health and safety of residents. And there is nothing more local than a block party.

    In 2015, the San Francisco’s Neighborhood Empowerment Network partnered with the Red Cross, SF SAFE (a community policing NGO), NERT (our local version of CERT) and the Department of Emergency Management to pilot a new community capacity building initiative that would advance a variety of capacities to increase a neighborhood’s ability to respond to a disaster with little or no support from professional first responders.

    The program was called “Neighborfest — the World’s Greatest Block Party”, and eight neighborhood watches signed up to participate. The underlying goal was to create an experiential learning event that would advance the following capabilities:

    1. Build a team of volunteers around a unifying mission.

    When our hosts come together to organize their block party, we provide them with a framework that builds on the first responder’s Incident Command System (ICS). ICS sets goals, objectives, roles, and responsibilities for times of stress. It’s a simple framework and works perfectly for pulling off a great block party.

    2. Develop an asset registry for critical resources in the immediate neighborhood.

    Block parties need a lot of different resources, including tables, chairs, bounce houses, charcoal for BBQs, and food. Neighborfest hosts learn to identify needs as a team and then crowdsource each resource from their neighbors, buy it, or get it donated. Practicing this form of asset mining will be an invaluable investment when residents need to work quickly to meet needs — and Home Depot and Safeway aren’t open, the likely situation in a large-scale disaster.

    3. Become effective conveners and generate social capital throughout their community.

    Humans have amazing potential to come together during times of stress and to help each other overcome overwhelming challenges. The critical factor for magnitude and comprehensiveness of that support is the level of connection that people have among themselves pre-event. In other words, you are more likely to offer or accept help from someone you already know. The Neighborfest program generates social capital from the moment the host committee is formed to the actual event when people are celebrating with old friends and strengthening their connection or meeting new neighbors for the first time.

    In order to onboard communities the Neighborfest Program offers the following benefits and resources to hosts:

         • A toolkit that provides them with step-by-step guidance for everything from organizing a Host     Committee to cleaning up after the event

         • A suite of tools such as a custom website that they can use to promote their event, door     hangers to reach out to nearby neighbors, and free barricades to manage traffic

         • Technical support on how to navigate the City’s permitting system and to remove fees

         • Coordination of first responder resources, police and fire, to arrive the day of the event and     engage residents

         • A professionally facilitated “Map Your Resilientville” exercise and preparedness information

         • A bin of disaster supplies comprised of gloves, helmets, vests, and first aid kits to help     neighbors help each other in the hours after an event

    The first round of pilots were a smashing success and the decision was made to run a second round of pilots in 2016. In 2017, the program was opened up to a wider range of engaged networks and over 35 neighborhoods were enrolled.

    Beyond the fantastic food that is a hallmark of a great block party, a real highlight from the last three years is the amazing range of activities that hosts created for their guests. From pinball machine competitions to belly dancing flash mobs, the residents always seem to find a way to build on the foundation of a classic neighborhood street party and add a unique cultural twist that makes it all their own. For the City, we have our own layer that advances our mission in a manner that generates deep impact with very little of the traditional logistics associated with community engagement.

    A key requirement of participating in the Neighborfest Program is that hosts allow the City, and its partners, to join the event to table and raise awareness of our programs and initiatives. A very popular activity that complements the provision of the bin of disaster supplies is the “Map Your Resilientville” exercise. This fun and easy game offers participants an opportunity to asset map their community for sources of food, water, power, medical, sheltering, and open spaces resources in their community so they can survive for 72 hours. Once the resident has written their answers on the sheet, they are offered a wide range of culturally competent preparedness information resources which they overwhelming accept. As the event winds down, the hosts bring their guests together for a group photo with their new disaster resources map and bin of supplies. The map is then rolled up and put in the bin to be retrieved at a moment’s notice to guide their response activity should times of stress arrive.

         • For cities considering adopting this program, the process for its implementation is fairly     simple. Determine what systems are in place for residents to secure permission to close a street     and engage the managing agencies to join the program as partners. (NOTE: Neighborfests are     also held in parks, plazas and parking lots)

         • Convene any and all agencies that offer programs and resources to communities and invite     them to join the initiative.

         • Use the current Neighborfest toolkit or develop your own.

         • Launch a pilot and secure the participation of reasonable number of neighborhoods that will     afford partner agencies enough activations to fine tune planning, operations and logistics     responsibilities.

         • Make any necessary adjustments to your Neighborfest strategy and open a second round of     block parties. Continue to increase the number of events in reflection of your staffing and     budgeting capacities.

    Over time, you’ll most likely develop a team of committed volunteers who enjoy engaging people about this important issue as well as being in a joyful environment where people from all walks of life come together and celebrate what they have in common — their neighborhood.

    The intent of the Neighborfest program is to be prepared for times of stress that may arrive at any time. However, the social dividends generated literally from the moment the Host Committee is convened are immediate and tangible. Almost everybody wants to live in a community surrounded by people they know and trust, and the Neighborfest program is valuable resource for achieving that goal.

    So let’s get local and have a party.

    This piece originally appeared on Medium.

    Daniel Homsey is the Director of The Neighborhood Empowerment Network (NEN) for the City Administrator’s Office of the City and County of San Francisco. A fourth generation San Franciscan who has a degree in Political Science from San Francisco State University, Mr. Homsey has spent the last 25 years as a communications professional in both the private and public sector. After a long stint in the tech sector, Mr. Homsey joined the City in 2004 and in January 2008 became the Director of the NEN which is a coalition of residents, community supported organizations, non-profits, academic institutions, and government agencies whose mission it is to empower residents with the capacity and resources to build and steward stronger more resilient communities. For more information about the NEN, please visit www.empowersf.org.

    Daniel Aldrich is professor and director of the Security and Resilience Program at Northeastern University. He has published four books, more than forty peer reviewed articles, and written op-eds for The New York Times, CNN, and Asahi Shinbun. He has appeared on popular media outlets such as CNBC, MSNBC, NPR, and HuffPost, and has a PhD in political science from Harvard. His research has been funded by the Fulbright Foundation, the Abe Foundation, and the National Science Foundation. Hee has carried out more than five years of fieldwork in Japan, India, Africa, and the Gulf Coast. His newest book, Black Wave: Connections and Governance in Japan’s 3.11 Disasters, is under review, and his articles and OpEds can be downloaded for free from http://daldrich.weebly.com/. For more on Prof. Daniel Aldrich’s work — please visit https://www.amazon.com/author/danielpaldrich. Daniel can also be reached on Twitter: @DanielPAldrich.

  • How To Deal With An Age of Disasters

    When Hurricane Harvey flooded Houston, followed by a strong hurricane in Florida, much of the media response indicated that the severe weather was a sign of catastrophic climate change, payback for mass suburbanization — and even a backlash by Mother Nature against the election of President Donald Trump.

    Yet, these assumptions are often exaggerated. Although climate change could well worsen these incidents, this recent surge of hurricanes followed a decade of relative quiescence. Hurricanes, like droughts and heavy rains, are part of the reality along the Gulf Coast and the South Atlantic, just as droughts and earthquakes plague those of us who live in Southern California.

    The best response to disasters is not to advance hysterical claims about impending doom, but rather resilience. This means placing primary attention on bolstering our defenses against catastrophic events, whether in protecting against floods, ice storms, earthquakes or droughts.

    The limits of original sin

    Days after Hurricane Harvey hit, Quartz opined that “Houston’s flooding shows what happens when you ignore science and let developers run rampant.” The Guardian’s climate columnist, George Monbiot, even portrayed the event as a kind of payback for being the world capital of planet-destroying climate change.

    In ascribing every disaster — even the Syrian civil war — to human-caused warming, we may be venturing into something more akin to the religious notion of original sin than to rational science. We should want to reduce greenhouse gases, but, as both rational skeptics like Bjorn Lomborg and true believers like NASA’s James Hansen agree, such things as the Paris climate accord are unlikely to make much of an impact on the actual climate in the near term — or even in the medium term.

    In the short run, then, who sits in the White House is pretty irrelevant. Having Barack Obama, or even Bill Nye, the “Science Guy,” in the White House would not make an appreciable difference in addressing nature’s fury.

    Read the entire piece at The Orange County Register.

    Joel Kotkin is executive editor of NewGeography.com. He is the Roger Hobbs Distinguished Fellow in Urban Studies at Chapman University and executive director of the Houston-based Center for Opportunity Urbanism. His newest book is The Human City: Urbanism for the rest of us. He is also author of The New Class ConflictThe City: A Global History, and The Next Hundred Million: America in 2050. He lives in Orange County, CA.

    Photo: Jill Carlson (jillcarlson.org) from Roman Forest, Texas, USA (Hurricane Harvey Flooding and Damage) [CC BY 2.0], via Wikimedia Commons

  • Infinite Suburbia

    The suburbs of the future are almost here. Contrary to mass media’s belief, many millennials are choosing to live in the suburbs, especially as they get older. Younger millennials, from 25 to 29 years old, are about a quarter more likely to move from the city to the suburbs as vice versa. Older millennials are more than twice as likely. Millennials are looking for places they can afford a home, which they are more likely to find in suburbia. However, this generation is looking for a new type of landscape, one that is smart, efficient, and sustainable.

    Read about what these new suburban developments will look like in Alan Berger’s New York Times piece here.