Category: Demographics

  • America’s Most Urban States

    To the untrained eye, looking at a map of metropolitan America can lead one to the conclusion that at least half the nation’s land area is covered by urbanization. This is illustrated by Figure 1 below, which is a Census Bureau map of metropolitan areas as defined in 2013. These areas cover approximately 1.675 million square miles, which represents 47 percent of the US land area.


    Metropolitan Land: More Rural than Urban

    However, someone well informed in urban geography would quickly retort that most  metropolitan areas are more rural than  are urban and, in total,  the only 3% of the nation’s land area is in urban development. This shown by data in the 2010 census, which counts as urban all settlements with at least 2,500 population (a complete list of the 3,600 urban areas is at http://demographia.com/db-uza2010.pdf).

    The difference is between two very different definitions of the city. The physical city, called the urban area in the United States, the built-up urban area in the United Kingdom, the unité urbaine in France and population center in Canada is the area of continuous urbanization (or development). The metropolitan area is a much larger geography that includes areas from which a substantial portion of the working population is employed in a core area that is, in the United States it is central counties, an area typically far larger than what was formerly called the “central city” or the “core city.” Figure 2 is a map of urban areas, which indicates the best approximation of the extent of urbanization in the United States.

    Within metropolitan areas, the area between the principal urban area and metropolitan area boundaries is largely rural, but may also include urban areas. For example, in Los Angeles, Santa Clarita, Palmdale and Lancaster are secondary urban areas located between the principal urban area and the metropolitan boundary.

    In the Riverside-San Bernardino metropolitan area, the Needles urban area also lies between the principal urban area and the metropolitan area boundary. However, Needles is more than 200 miles away from the city halls of either Riverside or San Bernardino and it would take a commuter at least three hours to reach either place, assuming no traffic congestion. In the United States, metropolitan areas are composed of entire counties and where there are larger counties, as in Riverside-San Bernardino, the metropolitan area contains much more area than represents a reasonable commuting distance. This also makes any urban research based on metropolitan area densities nonsensical, because they are driven by rural rather than urban densities.

    Urban research needs to be performed using urban densities. That can be at the metropolitan area level or even the state level.

    Highest Urban Density in California

    It may be surprising that California, which largely defined the suburbanized urban form that developed after World War II has the highest urban population density in the nation (Figure 3). California’s urban areas have an average density of 4300 per square mile. California has the three most densely populated large urban areas in the country: Los Angeles at approximately 7000 residents per square mile, San Francisco at approximately 6300 residents per square mile and San Jose with approximately 5800 residents per square mile. Indeed, San Jose, which does not even have a pre-World War II urban core (because it had too small a population at the time) is approximately 10% denser than the urban area with the nation’s largest pre-World War II urban core, New York (5300 residents per square mile).

    Even before the radical densification policies of Senate Bill 375 were implemented, California’s high density credentials were impeccable. Among all urban areas in the nation, 21 of the densest 25 are in California, including Richgrove, an urban area of less than 3000 residents in a population density of over 10,000 per square mile. Richgrove is located in Tulare County, in the San Joaquin Valley, 10 miles east of State Highway 99, in the Delano area. Not only is Los Angeles nearly twice as dense as international densification model Portland, but San Francisco, San Jose, Sacramento, Riverside – San Bernardino and San Diego are also more dense than Portland, not to mention Fresno, Oxnard, Stockton, Los Banos, Simi Valley and Modesto and, of course Richgrove (as well as others).

    New York has the second highest state urban population density at 4200 residents per square mile. Again, perhaps surprisingly, Nevada has the third highest population urban density, though well below New York at 3300 residents per square mile. Las Vegas is the fifth highest density urban area over 1,000,00 residents, at 4500 residents per square mile Only one other state, Hawaii, has an urban population density above 3000 residents per square mile (3200). Honolulu, with fewer than 1,000,000 residents, has an urban density of 4800 per square mile.

    Rather than being dominated by the states with the urban areas perceived to be the densest, in the East and Midwest, seven are in the West, which has, like California, a reputation for urban sprawl. Only New Jersey, much of which is suburban New York or Philadelphia, as well as Illinois, home of the nation’s third largest urban area, Chicago, rank in the 10 densest states for urbanization.

    Lowest Urban Densities in New Hampshire and the South

    Eight of the 10 least dense states are in the South. Two are in the East, one of which should be no surprise, Maine, where all of the urban areas are somewhat small. (Figure 4) New Hampshire, however, may be surprising, since so much of the population is located in suburban Boston. One of the least accurate urban myths is about Boston as a dense urban area. Yes, it is dense inside Route 128 (Interstate 95), but beyond that it exhibits densities about the same as Atlanta, which is the least dense urban area in the world that has more than 2 million residents.

    There were also some surprises outside the top and bottom 10. Nebraska ranked 11th in urban density, well above its Great Plains peers. Texas ranked 13th, at 2400 per square mile, nearly equaling number 12 Maryland. Connecticut, which is in the New York commuting zone ranked 38th.

    Highest Urban Land Percentages in the Northeast Corridor

    While California has the densest urbanization, it is by no means the most urbanized in terms of its amount of urban land area. Only 5 percent of California’s land area is urban, somewhat more than the national average, but 22 states have larger urbanization percentages. Four states are bunched up near the top, with between 37 percent and nearly 40 percent of their land area under urban development, New Jersey, Rhode Island, Massachusetts and Connecticut (Table).  Each of these states is in the Northeast Corridor,  home to nearly 50 million residents, that stretches from the suburbs south of Washington, through parts of 10 states and the District of Columbia, to the Boston suburbs of New Hampshire.

    However, most states are far less urbanized. The fifth and sixth most urbanized states, Delaware and Maryland, are also in the northeast megalopolis, barely have as much urban land as the top four, at approximately 20 percent urbanized. It is another big drop to number seven Florida, at 14 percent.

    Most States Have Little Urbanization

    As would be expected, Alaska has the least urbanization, covering less than 0.1 percent of its land area. Wyoming is the second least urbanized, at 0.2 percent, closely followed by Montana (also 0.2 percent), North Dakota and South Dakota (both at 0.3 percent). The tenth least urbanized state, Utah, has only 1.1 percent of its land occupied by urbanization.

    All of this indicates that the urbanization that houses more than 250 million residents in the United States covers only a much more modest share of its land than often thought (3.0 percent ). This is even truer outside the Northeast Corridor.

    Built-Up Urban Areas in the United States
    State & DC Totals: 2010
    State/District Urban Population Urban Land Area (Square Miles) Urban Density (Square Miles) Urban Density (Square KM) Urban Density Rank Urban Popu-
    lation %
    Urban Popu-
    lation % Rank
    Urban Land/ Total Land Urban Land % Rank
    Alabama      2,821,804       2,207     1,278        494         49 59.0%           42 4.3%        23
    Alaska         468,893          260     1,803        696         36 66.0%           37 0.0%        50
    Arizona      5,740,659       2,187     2,625     1,014         10 89.8%             9 1.9%        33
    Arkansas      1,637,589       1,097     1,493        576         42 56.2%           45 2.1%        32
    California    35,373,606       8,219     4,304     1,662           1 95.0%             1 5.3%        21
    Colorado      4,332,761       1,528     2,836     1,095           7 86.2%           14 1.5%        37
    Connecticut      3,144,942       1,826     1,722        665         38 88.0%           11 37.7%          4
    Delaware         747,949          407     1,838        710         35 83.3%           17 20.8%          5
    District of Columbia         601,723            61     9,857     3,806 100.0% 100.0%
    Florida    17,139,844       7,403     2,315        894         16 91.2%             6 13.7%          7
    Georgia      7,272,151       4,797     1,516        585         41 75.1%           23 8.3%        12
    Hawaii      1,250,489          393     3,181     1,228           4 91.9%             5 6.1%        20
    Idaho      1,106,370          499     2,217        856         19 70.6%           30 0.6%        45
    Illinois    11,353,553       3,946     2,878     1,111           5 88.5%           10 7.1%        15
    Indiana      4,697,100       2,525     1,860        718         34 72.4%           29 7.0%        17
    Iowa      1,950,256          953     2,046        790         25 64.0%           39 1.7%        35
    Kansas      2,116,961          973     2,176        840         21 74.2%           25 1.2%        38
    Kentucky      2,533,343       1,411     1,796        693         37 58.4%           43 3.6%        25
    Louisiana      3,317,805       1,968     1,686        651         39 73.2%           27 4.5%        22
    Maine         513,542          360     1,428        551         44 38.7%           50 1.2%        39
    Maryland      5,034,331       2,005     2,511        970         12 87.2%           13 20.5%          6
    Massachusetts      6,021,989       2,987     2,016        778         29 92.0%             4 38.1%          3
    Michigan      7,369,957       3,623     2,034        785         27 74.6%           24 6.4%        19
    Minnesota      3,886,311       1,705     2,279        880         17 73.3%           26 2.1%        31
    Mississippi      1,464,224       1,106     1,324        511         47 49.3%           47 2.4%        30
    Missouri      4,218,371       2,054     2,053        793         24 70.4%           31 3.0%        28
    Montana         553,014          297     1,861        718         33 55.9%           46 0.2%        48
    Nebraska      1,335,686          524     2,549        984         11 73.1%           28 0.7%        43
    Nevada      2,543,797          767     3,315     1,280           3 94.2%             3 0.7%        42
    New Hampshire         793,872          644     1,233        476         50 60.3%           40 7.2%        14
    New Jersey      8,324,126       2,920     2,851     1,101           6 94.7%             2 39.4%          1
    New Mexico      1,594,361          827     1,929        745         30 77.4%           21 0.7%        44
    New York    17,028,105       4,092     4,161     1,607           2 87.9%           12 8.7%        11
    North Carolina      6,301,756       4,609     1,367        528         46 66.1%           36 9.5%        10
    North Dakota         402,872          184     2,192        846         20 59.9%           41 0.3%        47
    Ohio      8,989,694       4,420     2,034        785         28 77.9%           20 10.8%          8
    Oklahoma      2,485,029       1,307     1,902        734         31 66.2%           35 1.9%        34
    Oregon      3,104,382       1,107     2,805     1,083           8 81.0%           18 1.2%        40
    Pennsylvania      9,991,287       4,705     2,123        820         22 78.7%           19 10.5%          9
    Rhode Island         955,043          401     2,384        920         14 90.7%             7 38.3%          2
    South Carolina      3,067,809       2,382     1,288        497         48 66.3%           34 7.9%        13
    South Dakota         461,247          226     2,038        787         26 56.7%           44 0.3%        46
    Tennessee      4,213,245       2,905     1,450        560         43 66.4%           33 7.0%        16
    Texas    21,298,039       8,746     2,435        940         13 84.7%           15 3.3%        27
    Utah      2,503,595          915     2,737     1,057           9 90.6%             8 1.1%        41
    Vermont         243,385          156     1,559        602         40 38.9%           49 1.7%        36
    Virginia      6,037,094       2,665     2,265        875         18 75.5%           22 6.7%        18
    Washington      5,651,869       2,375     2,380        919         15 84.0%           16 3.6%        24
    West Virginia         902,810          640     1,410        544         45 48.7%           48 2.7%        29
    Wisconsin      3,989,638       1,879     2,123        820         23 70.2%           32 3.5%        26
    Wyoming         364,993          195     1,876        724         32 64.8%           38 0.2%        49
    United States  249,253,271   106,386     2,343        905 80.7% 3.0%
    Data source: US Census Bureau.


    Wendell Cox is principal of Demographia, an international pubilc policy and demographics firm. He is a Senior Fellow of the Center for Opportunity Urbanism (US), Senior Fellow for Housing Affordability and Municipal Policy for the Frontier Centre for Public Policy (Canada), and a member of the Board of Advisors of the Center for Demographics and Policy at Chapman University (California). He is co-author of the "Demographia International Housing Affordability Survey" and author of "Demographia World Urban Areas" and "War on the Dream: How Anti-Sprawl Policy Threatens the Quality of Life." He was appointed to three terms on the Los Angeles County Transportation Commission, where he served with the leading city and county leadership as the only non-elected member. He served as a visiting professor at the Conservatoire National des Arts et Metiers, a national university in Paris.

    Photograph: Downtown Chicago from the Air (by author)

  • Super Tuesday Analysis: How Race, Class And Geography Fed Trump And Clinton’s Victories

    After Tuesday night’s primary results, the presidential race is now all but settled among Democrats, and the fractured Republican field seems far along on their suicide mission to hand the White House to Hillary Clinton, a woman who as many as two-thirds of all Americans dislike, according to a recent poll. We are moving toward, as two Republican strategists recently remarked on CNBC, a November matchup of Clinton and Donald Trump that most voters actually don’t want.

    How did we get here? Three major factors — race, class and geography — shaped the Super Tuesday results, much as they have the overall campaign, and they reinforce the prospect of even more divisive politics in the years ahead.

    The Racial Primary

    Class defined the first primaries, where white voters predominated. In the South and Southwest, racial bloc voting has sealed the deal for Hillary Clinton. African-American voters may not have done well economically over the past seven years, but their loyalty to President Obama, and to the Clintons, remains rock solid. Having provided the base for a huge win in South Carolina, on Super Tuesday, black voters sealed her victories in Georgia, Virginia and Alabama, and contributed greatly to her cause in Texas, where Latino voters also gave Hillary some 65 percent of their votes. Virtually everywhere minority votes put Clinton over the top, with weaker support from whites. In Virginia, where African-Americans constitute 25 percent of the primary electorate, eight out of 10 cast their vote for the former Secretary of State.

    In contrast Bernie Sanders, the consummate radical candidate, continued to do well largely in lily-white states, as he did to start off the campaign in Iowa (92 percent white) and New Hampshire (94 percent white). He made a strong showing in Massachusetts (80 percent white) with 49 percent of the vote, while winning Oklahoma (82 percent white), Minnesota (85 percent white) and his home state of Vermont (95 percent white). Sanders also won in Colorado, a state that is 80 percent white, with a growing, predominantly Democratic Latino population but that is only 3.8 percent black.

    Nationally, Republicans make pains to say publicly that they need to appeal to minorities, but as of 2012, 89 percent of voters who identified with the party were non-Hispanic white, compared to 60 percent of Democrats and 70 percent of independents. Even in highly diverse places like Harris County (Houston), on Tuesday almost 70 percent of GOP early voters were white compared to barely 41 percent of Democrats. Statewide exit polls put the GOP primary electorate at 82 percent white and 10 percent Hispanic; strangely, despite widespread perceptions that Trump is anti-immigrant, he didn’t do all that much worse with this demographic than favorite son Ted Cruz, with support from 26 percent of Hispanic GOP voters, versus 32 percent for Cruz.

    Overall the big winner of the white primary is Donald Trump. Like Sanders he has racked up his strongest victories in nominally liberal white states like Massachusetts, which normally might have been expected to be easy pickings for Ohio Gov. John Kasich, who came in a distant second. Trump won in the Bay State largely by sweeping the votes of poorer whites, precisely those who compete with immigrants for jobs and housing. But Trump won the support of white voters virtually everywhere by large margins. This shows that, in the Republican world at least, you can play with racial fire and not only survive, but actually thrive.

    The Class Election

    Among white voters, the big dividing line remains class. Throughout the election both Sanders and Trump have done best with those who make the least money. Among whites, Clinton has outperformed Sanders not only among seniors but also those making over $200,000. This may have helped her in places where there are many affluent whites, notably northern Virginia, where wealthy suburbanites combined with African-Americans to seal her impressive win in the state.

    Sanders did somewhat better in states where the white working class is larger, such as Oklahoma and Tennessee. Yet Sanders really does best in his native New England and across the northern tier, in places like Minnesota, where socialist ideas have had resonance for generations among working- and middle-class voters.

    But the most successful class warrior in this race remains Trump, a billionaire who is rapidly turning the GOP into the most unlikely of working-class parties. Overall working-class whites represent some 53 percent of all GOP voters. In Tennessee, according to exit polls, Trump took more than half of these voters, providing him a base that no other Republican can not match.

    And it is a riled-up base. Some 53 percent of all Trump voters in Georgia exit polls said they were angry, 10 times those who said they were satisfied. Overall throughout the country over half of those coming out to vote Tuesday in the GOP primaries also expressed extreme dissatisfaction with the political status quo. These voter came out in big numbers for the Donald.

    In contrast, Rubio does better among well-educated, more affluent voters, but they are easily outnumbered by the less well-off electorate, particularly in the south. In some states, particularly in the north, these voters have been leaving the GOP, making the party dependent on people who do not share the priorities or generally more liberal social views of the donor class. But there were at least enough moderate whites left in Minnesota to get Rubio his first victory, and allowed Kasich to come in a relatively close second to Trump in Vermont.

    Some pundits, such as Rolling Stone’s Matt Taibbi, see this white electorate as essentially “moronic,” dooming the GOP to a much deserved extinction in the wake of the triumph of “multicultural vision.” Yet don’t count the white working-class voter out yet. As liberal analyst John Judis notes, this group may be a declining share of the electorate – down from 65 percent in 1980 to about 35 percent today — but they still have the numbers to determine the November outcome not only in the South but in Northern states such as Wisconsin, Ohio, Iowa, Minnesota and New Hampshire.

    In November, geography will play a huge role, with most states either falling into the red or blue column. But in the primary season, it still helps to be a local. Ted Cruz’ victory in the Lone Star State, for example, may have less to do with the small Latino vote and more with his Texan identity; his win in Oklahoma may also have something to do with proximity, as well as the preponderance of evangelical communities.

    Similarly Bernie Sanders did best in his home state of Vermont and liberal Colorado, and was at least competitive in neighborhood Massachusetts. These states are also home to many colleges and college students — his strongest base.

    Yet the bottom line remains that, for all intents and purposes, we are about to see two largely unlikable, and untrusted, candidates running against each other. With Clinton depending on minorities and affluent liberals to get her through, and Trump running, almost exclusively, as the tribune of the angry, increasingly economically marginal white middle and working classes, we are seeing a divisive campaign whose final result is likely to please only a small minority of Americans.

    Joel Kotkin is executive editor of NewGeography.com. He is the Roger Hobbs Distinguished Fellow in Urban Studies at Chapman University and executive director of the Houston-based Center for Opportunity Urbanism. His newest book, The Human City: Urbanism for the rest of us, will be published in April by Agate. He is also author of The New Class ConflictThe City: A Global History, and The Next Hundred Million: America in 2050. He lives in Orange County, CA.

    Republican results map by Ali Zifan (Own work; Map is based on here.) [CC BY-SA 4.0], via Wikimedia Commons

  • The Effect Race Could Have on the Race

    Until now, the presidential campaign largely has been dominated by issues of class, driving the improbable rise of both Donald Trump and Bernie Sanders. But as we head toward Super Tuesday – which will focus largely on Southern states – racial issues may assume greater importance.

    In the next few weeks, you can pick your states and likely party primary winners largely by examining the ethnic profiles of the electorate. Where white voters predominate, the most radical candidate, Sanders, ironically, does best. In contrast, states that are more heavily minority favor the more mainstream Hillary Clinton. In some states, notably Texas and Florida, larger minority representation may slow Trump’s seemingly unstoppable momentum.

    What about age? Older voters are overwhelmingly white, and in states where they constitute a large share of the electorate – a full one-third of GOP caucus-goers in Nevada – the Donald is the bomb. Hillary, too, has done best with older voters, while Sanders dominates the party’s younger electorate.

    Racial gap in Democratic Party

    Racial divisions will shape the Democratic results Super Tuesday. The party’s Southern flank, weak in November but important now, tends to be dominated by African Americans and, in Texas, at least, also Latinos. In some states, like South Carolina, where African Americans constitute upward of a majority, Clinton has proven all but unbeatable.

    In contrast, Clinton did poorly in New Hampshire (94 percent white) and barely earned a tie in Iowa (92 percent white). Generally speaking, the whiter the state, the better things tend to appear for Sanders.

    Read the entire piece at The Orange County Register.

    Joel Kotkin is executive editor of NewGeography.com. He is the Roger Hobbs Distinguished Fellow in Urban Studies at Chapman University and executive director of the Houston-based Center for Opportunity Urbanism. His newest book, The Human City: Urbanism for the rest of us, will be published in April by Agate. He is also author of The New Class ConflictThe City: A Global History, and The Next Hundred Million: America in 2050. He lives in Orange County, CA.

    Bernie Sanders photo by Michael Vadon (Own work) [CC BY-SA 4.0], via Wikimedia Commons

  • “To the Suburb!” Lessons from Minorities and the New Immigrants

    This essay is part of a new report from the Center for Opportunity Urbanism called “America’s Housing Crisis.” The report contains several essays about the future of housing from various perspectives. Follow this link to download the full report (pdf).

    When I was in college the suburbs were vilified. It was the mid-2000s, and here we were, enlightened coeds having one last hurrah in the flat Midwestern expanse before finding our place in the world, and there really was only one world to find: the city.

    A lot was fueling this. Some of us were reacting to Walmart childhoods, the big box strip malls a symbol for all that embarrassed us about America – corporate consumerism, excess materiality, a primacy on efficiency over heart. Others found in urban contrasts a call to heal social divides. But whether motivated by altruism or hipsterdom, the city seemed like the only place to live a meaningful, “authentic” existence. We were taught that the suburbs were vanilla, bland, buffers for Boomers to hibernate with their own kind. Cities, by contrast, offered risk, adventure, diversity and grit.

    Fast-forward a decade, and these differences have faded and even reversed. Sure, cities in the mold of New York, San Francisco, Chicago and Los Angeles still appeal to the young and mobile. But, lately, as housing prices in the most appealing urban cores skyrocket across the country, metropolitan centers find their middle class aspirants fleeing for greener and less expensive pastures.

    Today, many suburbs are remaking themselves as formidable incubators for social mobility and globalism, their sprawl punctuated by street signs in other languages, strips of ethnic eateries, self- confident civic innovation and a fresh aura of hope.

    This suburban blossoming represents an underreported shift in settlement
    patterns of our new immigrants and minorities. Where “To the city! To the city!” was the unquestioned mantra of newcomers landing on Ellis Island in  the first wave of mass migration between 1880 and 1924, today’s Latin Americans, Asians, Africans and African Americans are voting with their feet in a new direction. “To the suburb!” – if it didn’t sound like a minivan’s whimper – would be the banner of the day.

    SOME FACTS

    It would take a hermit lifestyle not to notice the demographic sea change that’s swept the United States over the last three decades. European immigration, once the mainstay of growth for the U.S., fell 32 percent, even amidst the continent’s hard times, from 2010 to 2013. In 1980, Mexicans accounted for the most populous group of foreign-born at 2.2 million, followed by Germans at 849,000. By 2010, the Mexican population had more than quintupled while European immigrants had fallen from being 36.6 percent of the total foreign- born population in 1980 to 12.1 percent in 2010. Mainland China now follows Mexico at 2.2 million, with Indians and Filipinos close behind at 1.8 million each. Today, the sending regions with the largest numerical increases in the number of immigrants living in the United States since 2010 are East Asia (up 642,000), South Asia (up 594,000), Sub-Saharan Africa (up 282,000), the Middle East (up 277,000), the Caribbean (up 269,000), and Central America (up 268,000).

    The swell of these “new immigrants” has revived perennial American questions around national identity that ever undergird our migration policy debates. The issues touch almost every region, with suburbs and smaller cities in the country’s interior feeling them most acutely. Where Los Angeles, New York City and Chicago were once the obvious gateways to build an American life, now the cities in the South and West are increasingly attracting the foreign-born. Since 2000, 76 percent of the growth in the immigrant population has occurred in these smaller metropolises, with Pittsburgh, Indianapolis, Oklahoma City and Columbus growing the fastest. A related trend is that as of 2007, four in 10 immigrants now move directly from overseas to the suburbs, eclipsing the urban experience that had always been the landing pad.

    The Brookings Institution came out with an important report last year detailing these shifts. In 2000, more than half of the nation’s immigrants lived in the suburbs of our largest metros. According to census data from 2000-2013, that number is now up to 61 percent.

    More than a third of the 13.3 million new suburbanites between 2000 and 2010 were Hispanic, with whites accounting for a mere fifth of suburban growth in that same period. Between 2000 and 2012, the Asian population in suburban areas of the nation’s 52 biggest metro areas grew 66.2 percent, while that in the core cities grew only by 34.9 percent. African Americans have also been steadily moving from inner cities to the suburbs. The 2010 Census showed that each one of the nation’s 20 largest metro areas saw a significant decrease in their proportion of black residents, with African Americans as a group shrinking from 65 percent urban in 2000 to 49 percent in 2010.

    The regional details are even more striking. Since 2000, the suburban immigrant population has doubled in 20 metro areas. In 53 metro areas, the suburbs accounted for more than half of immigrant growth, including nine metros in which all of the immigrant growth occurred on the periphery: Chicago, Cleveland, Detroit, Grand Rapids, Jackson, Los Angeles, Ogden, Rochester, and Salt Lake City. Atlanta and Seattle, long skirted by immigrants and even now ranking outside the top 10 largest immigrant destinations, each added more immigrants to their populations than did Chicago, San Francisco, Boston, or Los Angeles. Crucially, since 2000, not one metro area has seen its foreign-born population in the suburbs decrease.

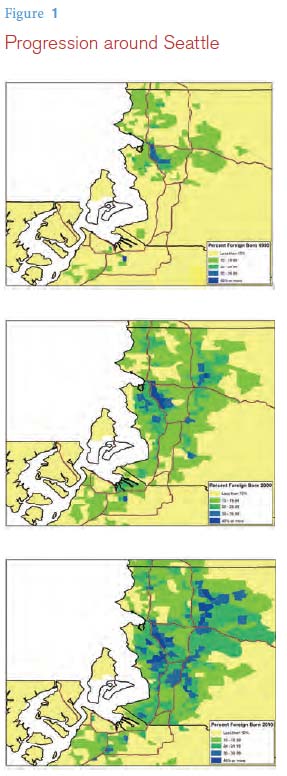
    What this means is that the suburbs as a whole are now equally, if not more diverse, than the populations living in most urban cores. They also are generally less ethnically segregated.  Go to a Starbucks in Sugar Land, Texas, and you’re more likely to stand in a line resembling the United Nations than anything you’d find in the center of Manhattan. Same goes for Fairfax, Virginia, where the demographics far out-pixelate Washington, D.C. 29.5 percent of Fairfax residents are foreign born, compared to 13 percent in D.C. 16.4 percent of Fairfax’s residents are also of Hispanic origin and 19.2 percent are Asian, compared to only 10.4 percent Hispanic and 4 percent Asian in D.C.ix Irving City and Carrollton just outside Dallas see their foreign born comprising 35 and 28 percent of their residents, respectively, while Dallas proper caps at only 23 percent. In Washington State, 34 percent of Bellevue is foreign born, while Seattle’s foreign born stands at a mere 17.7 percent.

    It’s important to note that this movement to the periphery does follow overall population settlement patterns observed since 2000 – it is not simply an immigrant or minority phenomenon. As elite urban hubs suffer from high housing prices, experiencing then a widening chasm between the very rich and the very poor, the suburbs have become a harbor for the middle class to find more reliable footing. And while my suburban-raised college classmates and I turned our noses up at their presumed provinciality, an Aspen/Atlantic poll from three months ago showed that most Americans still consider a family-oriented, suburban neighborhood closest to their “ideal” in terms of where to live, with 53 percent of whites, 53 percent of African Americans, 53 percent of Hispanics and 63 percent of Asians aspiring to this future.

    Recognizing that immigrant and minority migration patterns mirror shifts undergone by the population at large, there remains a texture to the suburban shift specific to both the contexts and the aspirations of today’s immigrant and minority groups, a texture laden with distinct promises and challenges as many pioneer lives on a more sprawling landscape. Here is a closer look at why the New America is suburbanizing, and what this may bode for the future.

    THE CASE OF HOUSTON

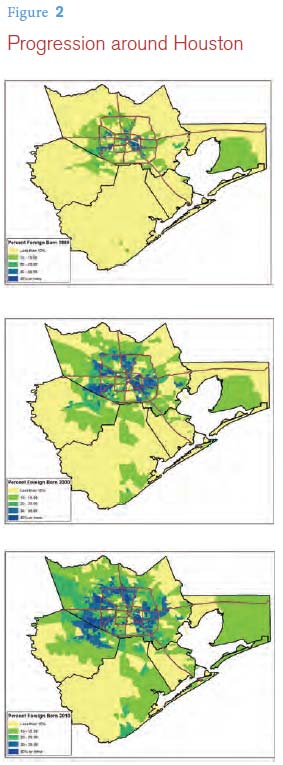
    Take a drive westward from almost any major airport today and you’ll see these worlds unfurling. In Houston, now the most ethnically diverse metropolitan area in the country, its white population is increasingly concentrated inside the inner loop (particularly millennial singletons) with everyone else settling beyond. As of 2013, over half of the city’s immigrant population—56 percent—live in Houston’s suburban municipalities, with 80 percent of the growth of the area’s foreign-born population since 2000 occurring in the suburbs.

    This diversity shapes how I live.  One recent Sunday, after waking up at 6:30 AM for a game of tennis with some Vietnamese friends who’d trekked in to Houston’s inner loop from Sugar Land, I found myself traveling the world in a zip code. The court transitioned to church at an all-black Methodist congregation 32 minutes from Houston’s downtown, followed by a Peruvian brunch at a rotisserie chicken eatery sitting just across the street from a large Indo-Pakistani shopping plaza. I then wandered over to the neighboring Hispanic mall known as PlazAmericas before taking a right on Bellaire Boulevard to peruse flavors of shaved ice at Chinatown’s Dun Huang Plaza and sampling Korean pears at the pristine Super H, with Latino shelf-stockers backing the Korean cashiers. Café Beignets, a Vietnamese interpretation of New Orleans charm, nourished with fried dough in the middle of a “Saigon Houston Plaza” that seemed to take its aesthetic cues from Pottery Barn, Asian-accented. All manner of sacred architecture beckoned from behind the strip malls, with the Buddhist Teo Chew Temple peeking out from beneath the tree tops and a dozen Spanish and African-speaking church signs within view around the corner.

    This was all a suburban version of “verges” – the vortexes where civilizations clash and conceive a fresh dynamism. Only in this case it wasn’t Istanbul; it was the Beltway crossing route 59.

    Houston rightly carries a reputation as one of the most welcoming cities in the U.S. While cultural traditions from elsewhere are invited to express themselves, the first question most Houstonians ask is not, “Where are you from?” but “Where are you headed?” The environment is future-oriented, open and adaptable. Buildings are torn down one month and rebuilt the next. There’s something for everyone, and the more outsiders come for jobs and the hope to establish a stable and happy life, the more Houston is texturizing to reflect the values and needs of the globe within it.

    “I think Houston offers people an opportunity to entrench themselves,” says John Tran, a second-generation Vietnamese lawyer in his mid-thirties, living in Sugar Land, also the town of his childhood. “It’s one of those places that gives people time to assimilate at the same time that it also gives them time to develop their own identity.”

    The sprawl invites a tension to play out between tradition and innovation, stability and risk.

    “The message is: Do it your own pace, do it your way, you have a home here,” Tran says.

    This is a great opportunity as well for the realtors and homebuilders as they reinvent the sprawling landscape to suit the aesthetic tastes of their diversifying clientele. Local architect Tim Cisneros is currently working on a $10 million dollar Indian wedding facility in Sugar Land that will be capped by a helipad and bridge built to withstand an elephant’s weight for the groom’s entrance. Cisneros serves some of Houston’s most entrepreneurial immigrants, his portfolio including a Chinese museum of history and culture (“Forbidden Gardens”), multiple Indian restaurants and a Messianic Jewish worship center.
    Each project involves an anthropological education. Cisneros recalls:

    “When I was in the running to design a Daoist temple, I had to go to this ritual. They’d put the various names of the architect candidates into a calligraphic gold pot with sparks and smoke. My job depended on whether some karma favored my name.”

    Cisneros now calls Houston his “favorite third world city,” hinting both at its development potential and the ambience that appeals to today’s new immigrants. From the tropical climate, to the zone-free real estate possibilities, to the hodge-podge aesthetic that disorients and welcomes anyone looking to make a mark, there’s both a familiarity to those coming from the developing world but also a chance to enjoy greater personal space than they were allowed in cities like Seoul, Abuja or Delhi.

    “The immigrants we work with,” says
    Cisneros, “they think they’ve died and gone to heaven. They don’t get caught up in the fact that their father’s generation wasn’t born here.” There’s opportunity, and perhaps more importantly, a sense of limitless sky.

    THE PERCEPTION OF MORE CHOICE AND OPPORTUNITY

    For most of U.S. history, immigrants have been concentrated in iconic cities. Early waves of European immigrants initially moved into neighborhoods close to the factories and shops that employed them. Go to Manhattan’s lower east side and you’ll still catch a whiff of the German, Irish and Jewish flavor that defined this neighborhood at the turn of the 20th century. As increasing numbers of immigrants have flocked to the suburbs at the turn of this century, however, it’s clear the new immigrants are reshaping the geography of opportunity.

    To dig into this, I’ve spent the last few months interviewing national migration experts and district school superintendents, exploring the growing array of suburban social services and attending a wide variety of religious services and cultural celebrations in the most diverse county in the nation—Fort Bend, just west of Houston. What’s come to the surface, amidst all the variance in regional patterns of settlement, is the issue of agency. Choice, or lack thereof, is the fault line in the nationwide trend toward suburban living. Some move because they can and choose to – the suburbs have attractive features worth pursuing. Others are forced out as they’re displaced by gentrification, changes in local labor demand, and, sometimes, black-white racial tensions.

    “You’ve got two streams of immigrants flowing out of the urban core,” says Stephen Klineberg, founder of the Houston-based Kinder Institute. “One contains the engineers, doctors and information technology professionals, many of whom are Asians and Africans that enter this country with higher educational levels than many native- born Anglos, and the other contains the poor and uneducated, most of whom are black and Hispanic. Where the upper middle class of Asians and Africans tend to go where the property values are higher, where the schools are good and the jobs plentiful, [poor] blacks and Hispanics are increasingly being clustered in low-cost areas, getting pushed farther and farther out.”

    These ethnic delineations may be too sweeping — there are many upper income Mexicans and Africans, for example — but Randy Capps of the Migration Policy Institute at least agrees on the pattern. “Your distressed communities are going to attract people who have no choice,” he says. “The poorest people are going to be increasingly transient, namely, poor blacks and Hispanics.”

    For those with the capacity to move of their own accord, choice itself explains the reasons for the suburban move. Behind the practical appeal of lower housing prices, more jobs and better schools, every immigrant I interviewed alluded to the air of untapped possibilities that they no longer sensed in dense urban cores. The growing magnetism of a city like Houston, for instance, along with other suburban cities in the South and West, is in part rooted  in the sense that you don’t have to be a part of the establishment to move up. Social mobility is possible for those with the wherewithal to climb.

    “The American Dream is alive and well here,” said one restaurant owner. “If you want to make it, you can. I haven’t been able to find that possibility in other cities.” Other suburban dwellers agreed. “Urban density doesn’t grant easy permission for the imagination,” said a Vietnamese couple. “Suburban landscapes at least invite you to try to make your own mark.”

    THE IMPORTANCE OF HOME OWNERSHIP

    If more space and choice lie at the core of most minorities’ hopes, buying a home seems the first logical step to securing them. For immigrants in particular, transitioning from renter to homeowner is an important milestone in committing to the United States. The question is: Where is this transition now possible? And are immigrants and minorities more willing to take the  leap into far-flung coordinates because owning a home is more critical to their civic credibility than it is for today’s average native citizen?

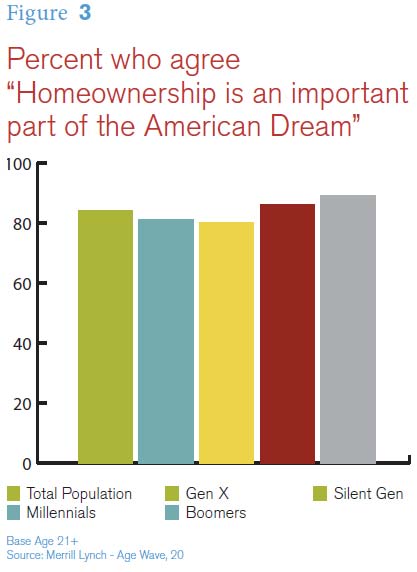
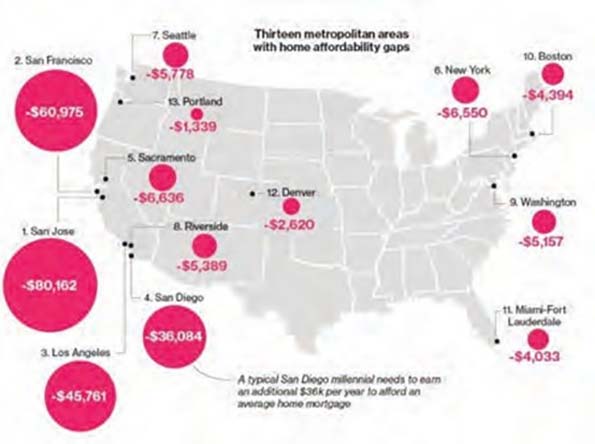
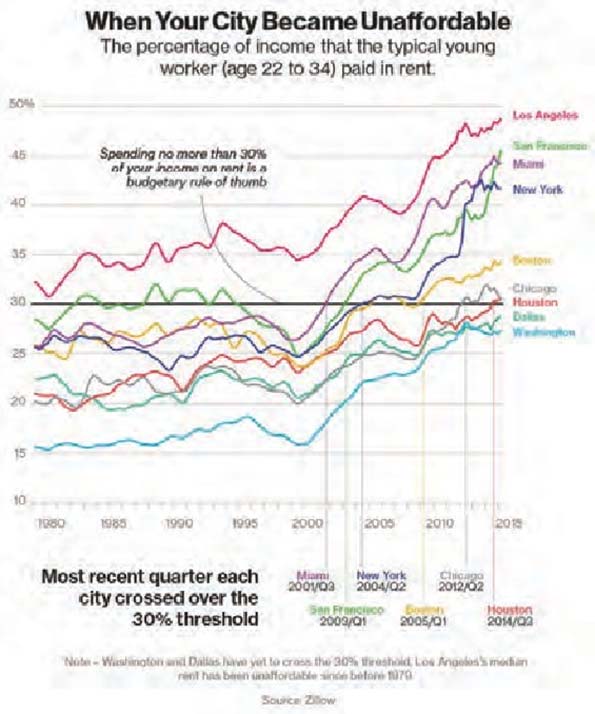
    There’s some data to suggest that in a society increasingly accepting of a “rentership” mentality, immigrants remain more likely to strain for permanence. The national homeownership rate has been declining for ten consecutive years.xii You see this pronounced especially amongst the young. Those in the prime of their adulthood, between 35 to 44 years of age, are buying homes at a low rate not seen since the 1960s. And for minorities, the numbers dip lower – the gap between white and minority home ownership is 25.5 percentage points.

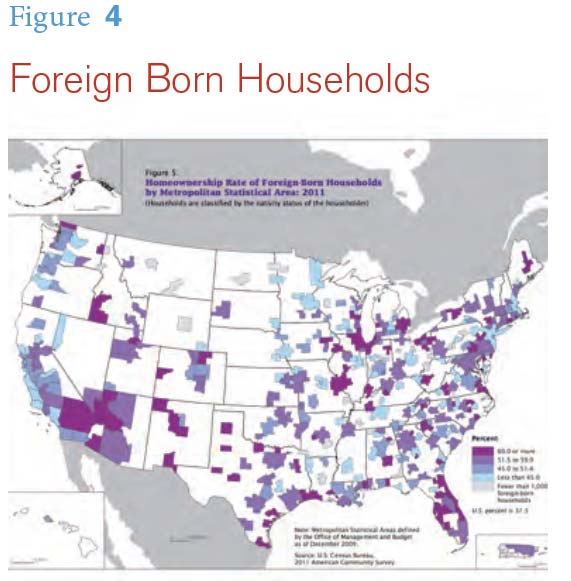
    However, when you look at the maps detailing migrations of minorities and immigrants, and where they tend to be growing, they are growing fastest in places where houses are being bought. According to a report by the Research Institute for Housing America, immigrants accounted for nearly 40 percent of the net growth in homeowners between 2000 and 2010; in the 1970s they represented just over 5 percent of the growth. Meanwhile, the foreign born have been moving towards ownership, with renting growth happening only in the states that have become tough for prospective homeowners – e.g. California, the Washington D.C. area, New York, New Jersey, Massachusetts, Connecticut and Illinois.xiv In the current decade, California and New York are projected to be the only two states where foreign-born homeowner growth declines. Texas and Florida, by contrast, are attracting foreign- born buyers in droves, with net increases of 492,000 and 342,000 projected.

    As Hispanic and Asian homeownership in particular is climbing, they’re buying in the second-ring suburbs and even exurbs where they are settling in large numbers. We can see this by looking at maps of several major metropolitan areas such as San Francisco, New York, and Chicago.

    Obviously, when home ownership is the top priority, where it can be affordably attained becomes all the more relevant. Aspiring homeowners tend to want to live around other homeowners – there’s a like-attracts-like buzz of “I want to be around other people who are making it.” Minorities also seem  to be maintaining the more traditional American idea that homeownership equals the final seal of adulthood.

    “Buying a house was important,” says Tran, the 35-year old lawyer who lives with his wife in Sugar Land, a town in Fort Bend County. “It was roots being planted, physically and emotionally. If marriage was the emotional commitment, the house was the physical aspect of that.”

    The Trans’ neighbors, an African American couple named Geoff and Robin Boykin, agree.

    “As a minority, owning a home gives you a level of credibility in the community that renting won’t,” Boykin says. “When we first moved to this neighborhood, we rented, just to be sure, and when people would come up and ask us about it, there was an underlying feeling of embarrassment. Like we were second-class citizens. Perhaps especially because we’re the only black couple in this neighborhood.”

    Geoff grew up in Brooklyn, New York, “where you don’t even think about buying.” But when he met a 24-year old who owned a house in Houston, he thought, “Wait a second. Where can you buy a house at age 24?” He moved to Texas to follow suit. Southwestern sprawl offered an opportunity to get established, cheaper.

    Suburbs have always been family- friendly, at least by brand, and as Caucasian family size continues to shrink, those Hispanic and African American still having children, even three to four, kids want to be in safer, more affordable family-oriented neighborhoods.

    “You are now more likely to have inter-generational communities in  the suburbs,” says Randy Capps of the Migration Policy Institute.

    Tim Cisneros, the architect who serves some of Houston’s most entrepreneurial immigrants, says that his clients typically want something “colonial or traditional, to show they’ve assimilated. They also want big, to host multi-families.”

    "It’s now the Indians and wealthy Mexicans building the McMansions in the exurbs,” says Cisneros. “In Sugar Land. Pearland. The Woodlands [just north of Houston] is like going to private
    Mexico now. With armies, guards, the whole nine yards of the Mexican elite.”

    If homeownership remains one of the more important seals of legitimacy for
    today’s immigrants and minorities, it’s also a tool for consumer status – in this case one’s civic and cultural status.

    “With many immigrants,” Cisneros says, “the shinier it is, the more expensive they assume it to be and thus more attractive. More ’making it’ in America.”

    On the other side of the real estate spectrum, of course, are those who are getting priced out of longstanding ethnic enclaves that lie closer to the city center. Ron Castro is a sociology and psychology teacher at Spring Woods High School in Spring Branch, a gentrifying suburb straddling Houston’s second freeway loop, and says that in 15 years of teaching, house prices have climbed from $90,000 to $400-500,000.

    “Folks I used to know can’t  afford to live here anymore,” he says. “Everyone’s saying, ’we’ll be on our way out pretty soon.’”

    “In ten years, these mini-mansions pop up. The neighbor can’t afford that. I don’t see how low-income people survive another 10 to 15 years here in Spring Branch.”

    JOBS, SCHOOLS AND AN ECONOMY AGING BACKWARDS

    Most of today’s middle class economy is now found outside of central downtowns. Suburbs and exurbs accounted for 80 percent of job growth between 2010 and 2013.
    Irvine and Santa Clara in California, Bellevue just outside Seattle, and Irving, a Dallas suburb, have higher job to resident worker ratios than their closest core municipality. The booming technology sector is adding most of its jobs to suburbanized areas like Raleigh-Durham, Dallas-Ft. Worth and Orange County, attracting high-skilled Indian and East
    Asian employees, in particular.
    And, as “live, work, play” locations proliferate, it isn’t just a matter of where the jobs are located, but also where the highest quality of integrated living – work + leisure + community – may be found.

    “Sugar Land’s Town Center has everything you need,” says Geoff Boykin, who works for Coca Cola two miles from his home. “All the amenities – restaurants, Home Depot, a movie theater, the gym – I love the convenience.”

    At the same time, many suburbs are developing multi-purpose complexes  of community and leisure that complement their growing professional class, while telecommuting is on the rise, especially amongst millennials. For younger minorities and adult children of immigrants, commuting to work is no longer a must. So long as a suburb is relatively close to a freeway entrance, other desires like strong recreational possibilities and a good night life can take the front seat. The Internet has lessened the need for many to weigh the variable of long commutes.

    Rental properties for small businesses – many of which are owned and run by immigrants – are almost universally cheaper in the suburbs. And as more and more millennials are moving to  the suburbs, businesses are noticing the outflow of their consumption habits.

    “My clientele here is getting older, less willing to spend,” says Yoichi “Yogi” Ueno, the owner of a Japanese Sushi restaurant in Rice Village inside Houston’s inner loop. A few years ago he decided to open another more casual location in Fort Bend County on Bellaire Boulevard, in part to attract the freer flow of youthful wallets.

    “The well-educated, higher income younger people are having kids and moving out to exploding suburbs like Sugar Land and Katy,” Ueno says. “They now have more vibrancy. I may move this restaurant out there one day. I think business may be better.”
    For those with kids, of course, the historic sense that the suburbs have better schools and safer streets remains true, and of acute appeal to those looking to give their offspring a secure and promising future. There’s also more educational choice in the suburbs, and with lower costs of living, the possibility to send one’s child to a private school becomes easier.

    “For many Asian families in particular,” says a Vietnamese couple with one middle schooler and two elementary-age sons, “living where the schools are ’good’ becomes the number one priority.”

    THE PRE-EXISTING CULTURAL CLIMATE

    The movement of immigrants to the suburbs draws more to the same places. Just as immigrants in the first wave of mass migration went where families had already set up house and shop, today’s suburbanizing immigrants report a stronger sense of belonging and feeling welcomed in the suburbs, compared with urban cores too entrenched in established legacies and racial histories to leave room for more. There is also more of a chance for coherence and authenticity in immigrant expression in the suburbs, manifested most obviously in ethnic restaurants and supermarkets, distinctive religious congregations and social networks.

    “In the suburbs, I can run a sushi restaurant more like they do in Japan,” says Yoichi Ueno. “Here, closer to the city, with more of an affluent and white clientele, I had to invite in a chef to introduce things like California rolls [to appease American tastes]. In Japan we don’t actually sell those rolls!”

    These commercial enclaves are attractive in both entrepreneurs and their customers.

    “I like being in a Latina neighborhood,” says high school teacher Ron Castro, who’s chosen to stay in what some consider a less desirable suburb outside the loop. “There’s a Fiesta out here. A carniceria.”

    There are also scads of religious communities in the suburbs, the spires of sacred structures peeping just behind the strip malls. With secularism predominant in elite urban hubs, faiths from all over the world are finding welcome and freedom of expression in the wide open spaces where immigrants and minorities are settling. Religion remains a central artery for those beginning new lives, providing a sense of ethnic identity and continuity, social services and social status.

    SOME BROADER OBSERVATIONS ABOUT TODAY’S SUBURBAN ECOLOGY

    As I’ve wandered through and sampled the flavors of various suburban communities in Houston and elsewhere (including Charlotte, Dallas, northern Virginia and Chicagoland), it is clear there is a more textured political climate developing there. Most minority suburban dwellers I spoke with sounded progressive on immigration and the role of government in providing social services, and conservative on business regulation. The flourishing of the family was clearly important, even in its traditional expression, but those interviewed skirted any political commentary on that front.

    The suburbs also appear to be eclipsing the city as centers for civic renewal and volunteerism, though more empirical study of this is needed. Every suburban resident I interviewed was involved in at least one local initiative, such as Moms against Drunk Driving, seasonal clean-up effort and local arts & craft festivals. This stands in stark contrast to the average single professional renting a loft downtown, most of whom are involved in loose social diasporas but otherwise see the city as a one-way consumption opportunity.

    Some of this may have to do with life stage, and the higher proportion of families in suburbs—the attendant reality being that kids naturally invite parental involvement in the milieu of their upbringings. But the sense of voluntary generosity is also a testament to the growing presence (and confidence) of immigrants in the suburbs, who show higher rates of volunteering both inside their ethnic networks and, with growing levels of affluence, beyond them.

    Finally, the influx of immigrants demonstrates how suburbs are where a strong sense of community can be built and sustained. I repeatedly noticed how rare I was as a single car-user in parking lots that otherwise saw piles of kids tickling each other in the back seat – particularly the case for lower to middle class Hispanic and African American neighborhoods. In a Peruvian restaurant in Fort Bend on a Sunday afternoon, I was the lone millennial eating lunch solo and scrolling through my iPhone, the other tables raucous with the laughter of children and grandfathers in church attire. It struck me that the suburbs, with all of their automobile dependence, remains a relative bastion of strong community feeling and sense of obligation. Contrary to the general academic and media portrayal of suburbs as hotbeds of alienation and anomie, they are becoming bastions against the seduction of a consumerist, individual autonomy.

    COMPLEXITIES AND CHALLENGES

    As stated at the outset, it is in many ways impossible to speak about “the suburbs” in a generic sense. There remain two streams of movement outward: one rooted in choice and the other in forced displacement. But there also remain important caveats to these selling points, caveats that illuminate the open questions around the future of suburban life and human flourishing within it. The first is the challenge of isolation and integration, especially as the suburbs continue pixelating in ethnic and cultural diversity.

    Houston, for instance, is a city that welcomes the stranger, but its layout is sprawling, enticing for those with gumption can prove intimidating for those torn from their native support structures (or lacking them in the first place). Social services slim down the further you get from the Beltway. Public transportation is sparse, and sustaining driver’s licenses can be tricky for the undocumented. Information is under-institutionalized and rife for predatory activity – immigration lawyers and mortgage brokers, both. For those with few resources, life can be a constant struggle.

    Public schools feel the brunt of these rapid demographic shifts, with diversifying student populations outpacing the cultural training of teachers. H.D. Chambers is the superintendent of the most diverse district in Texas – Alief – and he says the avalanche of students coming from economically disadvantaged backgrounds (800 new Burmese refugees amongst them), combined with those coming with little to no English knowledge, make providing a strong educational experience profoundly difficult.

    “I’m talking about diversity that’s deeper than color of skin,” Chambers says. “It’s about diversity of life experiences, and what these kids face when they go home. Many of their parents can’t help them. How do we teach them to interact with others? How
    do you prepare these sorts of kids for a global economy and the world at large?”

    Not all immigrants – particularly the children of the foreign born – appreciate the suburban edition of the American Dream their parents foisted upon their upbringings.

    Raj Mankad is the editor of an architecture magazine housed at Rice University, and as a child emigrated from India to a cul de sac in Mobile, Alabama. Years later, as an adult, he asked his parents why they opted for the spacious suburbs after the chaotic yet cozy density of living in India. They answered in classic 1.0 form: As an immigrant, you want to go for the opposite of what you left behind.

    “We arrived with five dollars in our pockets,” they told him. “We could not buy expensive things or houses in the best neighborhoods. And we grew up with very little, sharing bedrooms with all our siblings, sleeping on the floor, walking to school without shoes. So when we arrived in the United States, we wanted exactly the opposite.”

    Raj has since rejected a lifestyle he finds plastic for a hipper, culturally creative and environmentally conscious life with his Caucasian wife and two young kids in Houston’s Montrose corridor. He rides a bike to work and aspires to start his own spiritual community inside the loop.

    “I want my kids to understand their Hindu heritage, but the temples are in the suburbs, and I don’t want to schlep out an hour for a religious service. I want to start my own spiritual community, but not in a conservative way.”

    The price may be high compared to what his Indian American peers are choosing on the periphery, but it’s his preferred assimilation – honest, expensive, and full of uncomfortable tensions.

    CONCLUSION

    People have any number of reasons for move to suburban locales. But it’s not just the cash nexus at operation here. There’s also the emergence of more mysterious and fascinating blends of culture and community in ways that will shape our perceptions of what constitutes the best of American life.

    Suburbs used to be a device to “protect” people from the Other. No longer. Many now foster the creation of hybrid identities, tight yet pluralistic communities, alternate information loops and various commercial exper- iments. As immigration in particular plays out through the quotidian experiences of today’s suburban blends, the institutions and leaders within these communities could be critical to formulate policy reform, especially as it relates to questions around integration. More broadly, the suburbs will be the battleground where debates around home ownership, social mobility, and the promise and challenge of a pluralistic society will need to be waged.

    If you’re interested in the New America, keep an eye on your suburbs. They’re not as peripheral as the horizon would suggest, and may even be at the nexus of what is next.

    This essay is part of a new report from the Center for Opportunity Urbanism called “America’s Housing Crisis.” The report contains several essays about the future of housing from various perspectives. Follow this link to download the full report (pdf).

    Anne Snyder is a fellow at the Center for Opportunity Urbanism and covers stories within the vortex of immigration, social class and values. Prior to living in Houston she worked at The New York Times, World Affairs and the Ethics and Public Policy Center.

  • Hurdling the Obstacles to Millennial Home Ownership

    Justin Chapman contributed research and editorial assistance to this piece. This essay is part of a new report from the Center for Opportunity Urbanism called “America’s Housing Crisis.” The report contains several essays about the future of housing from various perspectives. Follow this link to download the full report (pdf).

    If the United States could remove current obstacles holding back members of the Millennial Generation from owning homes, the value of the housing market would increase by at least one trillion dollars over the next five years. Policies that would eliminate or sharply reduce financial obstacles that are currently hindering thirty somethings who want to start raising a family in the suburbs from buying a home would enable the construction and sale of as many as five million more homes between now and 2020. Residential investment represents about five percent of the country’s GDP, not counting the ancillary spending that results from such purchase. So any sound housing policy for the United States should begin and end with programs that allow these “missing Millennials” to join the ranks of America’s home owners.

    HOW WE ARE FAILING  THE NEXT GENERATION… AND OURSELVES

    The Millennial Generation (born 1982–2003), is made up of about 95 million Americans, most of whom are now in their twenties or thirties. They have been raised to think of life as a series of hurdles to be jumped with each obstacle becoming increasingly more difficult to overcome. Part of this mentality stems from the sheer size of the generation, which created enormous peer competition for success in school. Another source of this pressure to achieve came from their parents, who constantly
    emphasized the importance of going to college, doing extracurricular work in high school to improve the chances of being selected to attend the college of their choice, and spending time studying, not working, to make sure their grades were good enough. This kitchen table conversation was at least partially generated by the pressure that an increasingly global economy put on family incomes as they were growing up, with particular urgency after the Great Recession.

    Despite the investment in education the generation has made  in response to these pressures, the question remains as to whether or not Millennials will be able to fully participate in the experience of home ownership. The answer to this question will be determined both by the efforts of Millennials and also to the degree that efforts to lower the height of the hurdles in front of them are successful.

    There are some people, such as Brookings Institute researcher Matthew Chingos, who don’t believe the hurdles are unique to this generation. He has suggested, for instance, that student debt loads weren’t high enough to really impact the housing market.iv, John McManus, an award-winning editorial and digital content director for Builder magazine, suggested any delays in home ownership were due primarily to the inherent desire to wait before making decisions in the hope something better will turn up.vi Despite evidence
    of mounting student debt, declines in workforce participation, and stagnant wages, these economists believe the housing issue can solve itself within the context of existing policies and current economic growth rates.

    Yet from the perspective of most young Millennials these hurdles are both very real and huge indeed. Not addressing them will impact their lives—and the nation’s economy—for decades to come.

    LOVE AND MARRIAGE: MILLENNIAL STYLE

    From 1920 to 1940, when members of the GI Generation were about the age that Millennials are today, the median age for a first marriage was 24.4 for males and 21.3 for females, numbers that remained fairly constant until the 1980s. In the 1990s, the median age for first marriages by Generation X males rose to 26.5 and 24.5 for females.

    The early marriage age in the 50s and 60s sparked a rapid growth in suburbs; the percentage of Americans living there doubled after World War II. By 1970, 38 percent of Americans lived in the suburbs and, by 1980, 45 percent did, triple the rate of suburban home ownership than before WWII. As of 2012, nearly 75 percent of metropolitan area residents live in suburban areas. Overall, 44 million Americans live in the core cities of America’s 51 major metropolitan areas; more than half of them live in areas that are functionally suburban or exurban with low density and high automobile use. Meanwhile, nearly 122 million Americans live in the suburbs.

    Will Millennials reverse this pattern? Clearly they are marrying even later: the average age of first marriage in the United States as of 2011 was 28.7 for men and 26.5 for women. This trend has caused more to linger longer in cities and postpone home ownership until much later in their lives. Furthermore,  in line with their more urban existence,
    the fertility rate has fallen from the replacement rate of 2.1 for Generation X to 1.9 for Millennials.

    But this doesn’t mean Millennials aren’t interested in starting a family later in life.

    A Pew Research Center report found that among those who have never married and have no children, 66 percent wanted to marry and 73 percent wanted to have children. Although they may be late to the family party, the large size of the Millennial Generation, almost double that of Xers, means there are still plenty of families being formed, just not at the rate that historical precedents suggested would happen. In fact, the absolute number of household formations rose to their highest level in a decade in 2014. The trend continued in 2015 as more and more Millennials entered the prime age for getting married.

    These Millennial trends in marriage and parenting can be explained, in part, by the impact of the Great Recession and more than a decade of stagnant wages. But they are also due to “cultural changes over time… including more women in the workplace, the increased amount of higher education among members of the generation, particularly females, and greater social acceptance of premarital sex, birth control, and cohabitation before marriage,” according to Christine Elliott and Williams Reynolds III of Deloitte University Press.xv For example, one of the reasons members of the Silent Generation got married so young in the 1960s was so they could have socially acceptable sex. No such incentives exist for members of the Millennial Generation.

    Liberated from the straight jacket of gender determined roles in society, female Millennials now outnumber men in every type of higher educational pursuit. Almost 40 percent of female Millennials aged 25–34 have a bachelor’s degree and about half of them are married, a greater percentage than among any other educational attainment cohort. Whereas few if any female 25–34 year  olds had attended graduate school in 1964, 13 percent of Millennial females of that age have reached that milestone today. All of these gains outpace college educational gains among males in the same time period.

    Source:www.whitehouse.gov/sites/default/files/docs/millennials_report.pdf

    Millennial women who are not as well educatedxvi and do not have any economic stake in pursuing a career have their first babies, on average, at age 19 or 20. Well-educated moms have their first child around 28 or 29, usually after they have saved some money from their participation in the workforce. The delay in childbearing is greatest among those women with graduate degrees. Their average age for having their first child is now over 31, a full decade longer than their counterparts with only a high school degree. This represents a remarkable reversal of earlier trends over the last 25 years when more educated women were more likely to have children earlier than their less well-educated peers. In all likelihood, this phenomenon represents another kitchen table conversation about family finances with more educated females having more to lose by stepping out of the workforce and their preferred career track by having a baby than their less educated counterparts.

    In a sense, the cultural changes that society has witnessed, driven by a new set of Millennial beliefs and values about the role of women in society, has run up against the realities of today’s economy. The best solution to overcoming this obstacle would be a growing economy with wages increasing comparable to what transpired in the 1990s. Expanded parental leave policies from companies such as Facebook and Netflix introduced for both their male and female employees might also impact this trend, or at least the timing of starting a family. Other solutions designed to artificially increase wages or provide tax incentives are much less likely to overcome the strong cultural trends impacting family formation that are embedded within the Millennial psyche.

    MILLENNIALS WANT A PIECE OF THE AMERICAN DREAM, IF ONLY THEY COULD AFFORD IT

    Not only when they marry but also where these new families choose to reside will have an enormous impact on American living patterns for decades to come. Despite what some of have written about Millennials being a “sharing generation” averse to owning things, the generation’s actual attitudes or aspirations toward home ownership are remarkably similar to those of previous generations. An Urban Land Institute study, conducted at the end of 2014 of Americans between 19 and 36 years of age, found that Millennials remained determined to eventually own their home, with 70 percent of them planning to do so by 2020. “The Great Recession has not dimmed the generation’s preference for single-family homes, mostly detached,” wrote Leanne Lachman, the survey’s co-author, a real estate consultant and a Columbia Business School executive in residence, in a report outlining the survey’s findings.

    The same percentage of renters as home owners in the New York Federal Reserve’s Survey of Consumer Expectations in February 2014 thought home ownership was a good or very good investment. Almost 65% of millennials aged 21 to 34 looked at real estate websites and apps in August, and the market share of first time home buyers of existing homes increased to 32 percent from 28 percent in July of the same year. Realtor.com’s chief economist, Jonathan Smoke, found that 25–34 year olds were 70 percent more likely than the average adult to be looking for a home to buy on realtor.com. He estimated half of all home sales activity for the first half of 2015 could be attributed to first-time buyers and, according to the NAR 2015 Home Buyer and Seller Generational Trends report, Millennials comprised 68 percent of all such buyers.

    “People who believe that Millennials are disinterested in home ownership are grossly mistaken,” said Smoke. “This generation hit the job market during one of the largest recessions of all time and
    they’ve had to work hard to establish credit and save for a down payment.”

    One solution for Millennial couples unable to qualify for a mortgage is, of course, to rent a course of action many young families just starting out in life have traditionally pursued. The New York Federal Reserve study found the number one reason renters gave for not buying a home was they didn’t have enough money saved for a down payment or had too much debt. A majority also reported that their incomes were too low to support the payments on a mortgage. These responses nicely summarize the economic barriers to Millennial home ownership. As a result, the typical first-time home buyer now rents for six years before buying, up from 2.6 years in the early 1970s, according to a new analysis by Zillow. The median first-time buyer is 33—in the upper range of the Millennial generation, which roughly spans ages 15 to 34. A generation ago, the median first-time buyer was about three years younger.

    Ironically, many Millennials are being pushed into the home buying market by continuously rising rents that are making all forms of housing increasingly unaffordable. As Svenja Gudell pointed out, “We’re also finding that—given how much rental rates are currently rising—a lot of folks are having a hard time saving for a down payment and qualifying for a mortgage.” The oft violated rule of thumb says that families should not spend more than 30 percent of their budget on housing costs. But many young renters are paying more than that. “A striking 46 percent of renters ages 25 to 34—the core of the home buyer market among Millennials—spend more than 30 percent of their incomes on rent, up from 40 percent a decade earlier,” according to a report by Harvard University’s Joint Center of Housing Studies.

    Along the coast, in cities such as San Francisco, Los Angeles, New York, or Miami, rental costs exceed 40 percent of Millennials’ median income, with many paying as much as half of their budget on rent. A minimum wage worker in Orange County, Southern California’s most desirable suburban environment, would have to work 110 hours per week or over 15 hours a day to afford a one bedroom apartment where he or she worked. Inland, in cities such as Dallas, Houston, Chicago, and D.C., Millennials are spending just about 30 percent of their median income on rent. And the situation continues to worsen.

    More striking than these regional differences is the new relationship between the costs of renting versus owning a place to live. By the fourth quarter of 2014, the average mortgage cost was just 21 percent of average household income in the Dallas area, compared to an average of 28.5 percent of a family’s income being spent on rent. Across the country, it has become less costly on average for Millennials to own a home (21.4% of income) than to rent (30.1%).

    MILLENNIALS TRYING TO BUY HOMES

    For those who decide to take the plunge and buy a house, the tighter mortgage-qualification standards put in place after the Great Recession in reaction to the collapse of the financial markets when collateralized debt obligations (CDO) supposedly backed by sound mortgages turned out not to be worth the computer screens they popped up on present the first hurdle to their goal. To prevent such disasters in the future, Fannie Mae, whose reinsurance programs set the boundaries of risk that mortgage lenders will tolerate, prohibited certain types of mortgages altogether and emphasized a return to the traditional 20 percent down, thirty year term, fixed rate mortgages that had become the standard lending instrument when they were created to revive the nation’s housing market after the Great Depression.

    For a generation that has experienced falling wages and high levels of unemployment, this requirement can be seen as just too high a hurdle to even attempt to jump. Even if they can scrape up the money for the down payment, two-thirds of Millennials have a FICO score of under 680, limiting their ability to secure a government guaranteed mortgage and often saddling them with additional payments. Andrew Jennings, senior vice president and chief analytics officer at FICO said that “people in the 600 to 700 [credit score] range average have $25,000 in non-mortgage debt mostly from credit cards and student loans.” He pointed out that changes to the FICO score would make it easier for young adults with a thin credit history to qualify for a home loan. “One way to ease some households into ownership is to ease access to credit.”

    Fannie Mae’s Community Home Buyer program takes a step in that direction by lowering the down payment requirement for qualified buyers to just 5 percent. North Carolina and New Hampshire have also introduced programs that lower down payment requirements to 3 percent in an attempt to woo Millennials into buying a home in their state.xxviii More of these programs should be enacted to knock down this particular hurdle facing Millennials.


    (chart:  https://www.whitehouse.gov/sites/default/files/ docs/millennials_report.pdf)

    Much of their lack of credit worthiness stems from the lousy economic environment Millennials have experienced as they grew up.
    Americans between 18 and 34 years of age are earning less today than the same age group did in the past. The average earning of a Millennial was $33,883 (in 2013 dollars) in the four years following the recession. This represented a drop in average wages of 9.3 percent in just a decade (after adjusting for inflation) and is the lowest average wage for this age group since 1980. According to Rob Shapiro, a noted economic policy analyst, annual income gains for thirty something households (headed by Boomers) averaged 2.6 percent under Reagan and 2.4 percent under Clinton. Similarly aged households headed by members of Generation X under George W. Bush experienced income losses averaging 0.3 percent per year, followed by even greater losses averaging 1.8 percent per year among the first wave of Millennials in Obama’s first term.

    The situation is even worse for those with only a high school education. In a report written for the Brookings Institute in 2015, Shapiro showed that in the last century those with a high school education could expect their income to grow as they got older, even if it started from a lower base. This is no longer the case. In this century, those with only a high school education have actually experienced a drop in their earnings as they got older. Meanwhile, those with a college education not only start with an initially higher level of income, they can also expect to see their earnings grow in the course of their lives. College has become the ultimate hurdle in a Millennial’s life, with failure to get a degree becoming a life sentence of lower economic opportunity.

    The part about going to college that most parents worry about is not so much whether or not their child will get in and graduate, but how in the world they or their children will be able to afford to pay for their tuition bills. From 1980 to 2010 the price of tuition skyrocketed by 600 percent. In the same period, health care inflation rose by just over 200 percent. Meanwhile incomes for all but the top 5 percent of earners remained basically flat.

    In many ways this crisis has been precipitated by the unwillingness or inability of government to absorb much of the burden for higher education. This follows a notion introduced by the Carnegie Commission in the 1970s that an educated workforce was not an investment that government alone should pay for, despite its proven benefits in expanding the middle class and the country’s economy. Most people agreed with the report’s argument that those who would benefit most directly from acquiring some sort of a degree—the student and their family—should pay an increasingly large share of its cost.

    Coupled with the inability of states, particularly after the Great Recession, to subsidize the cost of college at historical levels, this policy led to families in 2014 shouldering the majority of the cost of sending their child to college for the first time in the nation’s history. Overall, the share of higher education costs paid for by students and families increased from 33 percent in 1977 to just under 50 percent in 2015.

    Faced with the need to somehow pay for school, students and their families turned to student loans as the default solution. The result has been a disaster for them and for the American economy, particularly its housing industry.

    Student loan debt doubled from 2007 to 2015. It now exceeds $1.2 trillion in the United States, more than the country has borrowed to pay for all the cars on the road today. The average debt for a college graduate in 2015 was $35,000. Eight million former college students are now in default on their student loan debt with no way to discharge that obligation in bankruptcy. Only 49 percent of Millennials manage to graduate college with less than $10,000 in debt, a major shift from the 74 percent of the Baby Boomer generation who were able to do so. According to a recent iQuantifi study, Millennials aged 21-25 shoulder an average of $13,116 in debt. Millennials in their late 20s carry $46,622 and Millennials in their 30s harbor an average of $69,552. All of this presents an enormous headwind that the first time home buyer must overcome.

    Under these circumstances, the clearest, most compelling action to grow the housing market would be to do something about Millennials’ student debt. A staggering 56 percent of Millennials between the ages of 18 and 29 who have student loan debt told Bankrate. com that they have delayed major life events because of their debt burden, with home buying the number one thing they have put off doing. Thirty percent of millennials (versus 22% of adults overall) say that student loans have forced them to delay buying a home.

    To make it easier for Millennials to leap the other hurdles to home ownership without the deadweight of student debt on their back, some have proposed to go so far as to declare a “jubilee year” and have the nation simply forgive the $1.2 billion in outstanding student loan debt. Home developers might well be a major beneficiary of such a windfall, although bailout of student loan debt at this scale is unlikely to occur any time soon for both financial and political reasons.

    A smaller and more personal solution to the problem is offered by the Public Service Loan Forgiveness program. It allows students to have their loans forgiven if they work for government or for certain not-for-profit organizations. Unfortunately, the time period under which a person must serve—ten years for the federal government, for instance— makes the actual impact of this law seem
    more like indentured servitude to those working under its provisions.

    Other solutions also exist or are under discussion. The Obama administration has greatly expanded eligibility for “income based repayment” (IBR) loans, which limit annual loan payments to a specified percentage of a person’s income, usually ten percent, and are forgiven even if the debt is not fully repaid after 20 to 25 years of payments depending on the particular terms of the original student loan. Some have proposed making IBR loans the standard for all federally guaranteed student loans, while others believe they represent too much risk for the federal government to undertake. Even if this type of loan becomes more prevalent among future home buyers, it still would mean lenders would have to take ten percent of a prospective home buyer’s income off the table when it comes to determining the buyers’ qualifications for a mortgage, thereby lowering the value of a home the buyer might consider.

    Some presidential candidates have joined the chorus in favor of allowing student loans to be refinanced, just as many people do with their home loans. About 25 million borrowers are estimated to be locked into higher rates that student loans require today. For these borrowers, such a plan, which many states have also started to explore, would reduce their loan payments by thousands of dollars early in their careers, making it more financially feasible for them to consider taking out a mortgage to buy a house.

    The states of Tennessee and Oregon have gone one step further in terms of reducing the scope of this problem in the future. The Republican governor in one state and the Democratic legislature in the other enacted laws that make their community colleges tuition-free. President Obama has proposed doing the same thing for all the nation’s community colleges in partnership with the states. Other communities from Kalamazoo, MI, to El Dorado, AR, have used personal or corporate philanthropy to make all levels of college tuition-free for their high school graduates. The idea continues to spread since the initial program was established in 2005 in Kalamazoo with over 30 cities now offering some form of this benefit to their youth in the hope of increasing the number of families who want to live in their community and stimulating their local economies.

    More directly, new home developers and lenders could begin to accept student loans as a fact of life for the Millennial market, and generate innovative new offerings to address the issue. One idea is to rent a home to Millennials under terms that lower the price if they elect to buy it  in the future, just as is done with many  car leases today. One such experiment is being offered in Miami for two unit town houses whose sales price is 21 percent lower than it would be otherwise. Another would be to find lenders willing to consolidate student debt into a larger home mortgage, with the lender trading the benefits of a loan not dischargeable in bankruptcy to a theoretically safer loan that uses the physical collateral of a house. Finally, builders and banks could take advantage of the Millennial Generation’s love of their parents and build housing designed not just for multi-generational living, but multi-generational financing, with different members of the family responsible for the mortgage payments at different times over the period of the loan.

    WHEN MILLENNIALS DO BUY, WHERE WILL THEY LIVE?

    Much has been written about where Millennials will buy a home. Some urbanists hope that Millennials will embrace the denser, less suburban lifestyle these pundits favor. Yet survey research and moves by older Millennials belie these assertions.

    According to the Urban Land Institute’s (ULI) most recent data, only 13 percent of Millennials live in or near downtowns; 63 percent live in other city neighborhoods or suburbs. The number of downtown dwellers was 12 percent in ULI’s 2010 survey. In fact, the Commerce Department reported that more Millennials moved to the suburbs from the city than vice versa in 2014. So even though some young Millennials, especially right after college, do move into urban neighborhoods, which certainly benefit temporarily from their presence, most think of the suburbs when their thoughts turn to raising a family.

    The National Association of Home Builders survey in January 2014 found that most of their Millennial respondents intended to purchase a single family home in the suburbs; another survey put the figure at 66 percent. Both studies confirmed the ULI findings that 75 percent of Millennials expected to live in a single family, detached house by the end of the decade. The myth of a new urban dwelling generation largely misreads the difference between “age related” effects and generational attitudes and beliefs.
    This misreading has impacted homebuilders who have built fewer homes that Millennials want and can afford, reducing the supply and driving up the price. The result is what economist Jed Kolko calls the “Millennial mismatch—Millennials can afford markets where they don’t live, but they can’t afford many of the markets where they do live.”

    (chart: Urban Land Institute’s Gen Y and Housing report, uli.org/wp-content/uploads/ULI-Documents/ Gen-Y-and-Housing.pdf)

    One way this lack of affordable housing manifests itself is the continuing phenomenon of Millennials living
    in their parents’ house. Despite their improving economic circumstances, a Pew Research Study found that about 42.2 million Millennials, or 67 percent, were living independently in 2014, compared with 42.7 million Millennials, or 71 percent, who did so before the recession in 2007. Since 2010, the percentage of Millennials moving back in with their parents actually increased from 24 percent to 26 percent.xlv While this behavior may temporarily balance the demand for housing with its supply, it greatly increases the number of Millennials missing from the country’s housing market.

    HOW TO GET MILLENNIALS BACK IN THE MARKET

    There are, however, some examples of what would attract these missing Millennials into the housing market. Almost all of them are successful because they have built upon the most fundamental of Millennial behaviors—the desire to share their experiences. And almost all of them make it possible for Millennials to afford a lifestyle they can share with families and friends.

    First on the frugal Millennial’s wish list is the need for the house to be affordable. According to a Rent.com survey of 1,000 Millennial renters, nearly half said they moved to a different city than the one they grew up in, mostly because of the job opportunities that city presented. Given the generation’s strong ties to their family and their friends, this finding puts an exclamation point on how important a consideration affordability is for Millennial first time home buyers.

    As Millennials continued to enter the housing market, their desire for a more affordable home became evident not just in survey data but actual buying behavior. For instance, 60 percent of those who  took out a mortgage to buy a home in August 2015 in Des Moines, Iowa were 25-34 years old. The top ten markets where Millennials dominated the home buying market that month were also ones with very affordable housing prices, with the exception of Provo, Utah. The cheapest big city in America in terms of housing prices, Pittsburgh, was the only one to make the list.

    Beyond a place they can afford, the
    next thing Millennials want is to own a home they can share with their family and friends. Millennials “want to live where it’s easy to have fun with friends and family, whether in the suburbs or closer in,” says M. Leanne Lachman, one of the authors of the Urban Land Institute’s study. “This is a generation that places a high value on work-life balance and flexibility. They will switch housing and jobs as frequently as necessary to improve their quality of life.”

    Only about 28 percent of Millennials told the Demand Institute’s Housing and Community Surveyxlix that they needed grocery stores and restaurants within walking distance of their next home, which is a common characteristic of urban environments. But more than half wanted such amenities to be within a short drive. This creates the demand for compact, livable communities that crop up in less-dense areas, but remain fundamentally suburban albeit with more options for walking, bike-riding and closer shopping. Unfortunately, these characteristics make many places in America, particularly its large coastal metropolitan areas, off limits to young Millennial families. It’s yet another hurdle they must overcome, often sacrificing their desire for shorter commutes to work and time with family to find a place to live that they can afford and safely raise their family.

    When they find the place they want to live, Millennials look for the type of housing that makes for a great living experience. It doesn’t have to be large—the most common size of a first time Millennial buyer’s home is less than 1,200 square feet. Half of all homes purchased by Millennials average less than 1,650 square feet and cost less than $148,500. But it does have to be high tech with an open floor plan, making many older homes unsuitable or strictly fixer uppers for this new generation of buyers. For instance, a generation ago, formal dining rooms may have been on every buyer’s wish list, but today they hold little appeal because of the way Millennials entertain. Millennials often convert space originally conceived as a dining room into a home office and move the food fest outside, weather permitting, or into the kitchen where the joys of cooking can be shared.

    A majority of Millennial home buyers believe the technological capabilities of a house are more important than “curb appeal.” More than 13 million Americans work from home and all signs point to that trend continuing, especially among high tech Millennial workers. Many of them see their home as a place to “do work,” not just a place to return “after work.” They want to hear about the strength of the mobile carrier’s signal in the house and its Internet speeds, not the embedded infrastructure of cable wires and land lines. Few if any of these desired attributes are present in older suburban tract housing, which further constrains the supply of houses for Millennials, presenting yet another obstacle in their path to home ownership.

    Breaking the current chicken and egg standoff between the demand and supply of Millennial style housing will require developers to stop listening to those who claim that Millennials aren’t interested in owning homes—or anything else—and focus on the market opportunity staring them in the face. Realtor.com’s chief economist Jonathan Smoke suggests that the supply of homes for Millennials is the key to igniting the next housing boom. “Despite the increased role of Millennials in the housing market, setbacks still exist and are preventing first timers from making even more of  an impact,” says Smoke. “As inventory returns to more normal levels, expect the blooming of Millennial homebuyers to turn into a boom.”

    Recent research from Zillow, for instance, found that adults age 22 to 34 were actually more eager to own a home than older Americans.lv If all the surveys of Millennial attitudes weren’t convincing enough, the actual home buying behavior of Millennials who can afford to buy a house should finally get builders off the investment fence. According to Zillow’s data, young married couples in which both partners work own homes at a rate close to or above historical norms for that demographic. Even single employed Millennials are slightly more likely to own a home than their counterparts in the 1970s, 1980s, or 1990s. All that’s needed, it would seem, to bring missing Millennials into the housing market is a larger supply of homes they want to buy. In short, build, builders, build.

    Home building, especially construction of single-family stand-alone residences, has not rebounded as much  as it should given the last few years of ultralow mortgage rates. For example, the number of single family housing starts and completions were both lower  in June than in May of 2015, even as family formations hit highs not seen in a decade. Both of the top two reasons older Millennials gave to realtor.com for not having bought a house yet had to do with the limited supply of affordable housing. It’s not up to Millennials to build the houses they want to buy, it’s up to those with the insights and market leadership skills to step in and create the supply and
    knock down this last hurdle to Millennial home ownership.

    MISSING  MILLENNIALS ARE A ONE TRILLION DOLLAR OPPORTUNITY

    A Demand Institute survey of more than 1,000 Millennial households suggests the generation will generate
    $1.66 trillion in revenue between now and 2020, using an average home sale price of $200,000, based solely on Millennials’ desire for home ownership and their arrival in the peak new starter home buying ages of 25–34 years old. If current conditions hold, it predicted the number of Millennial households would rise by 8.3 percent over the next five years, from 13.3 million to 21.6 million.

    But the Institute’s own data comparing existing home ownership  rates among Millennials based on student debt suggests that just removing the burden of student debt would increase these numbers even more. According to their findings, debt elimination would increase the number of home owners among 25–34 year old college graduates by 24 percent, 16 percent among 25–29 year olds, and eight percent for 30–34 year olds.lix Based on the cohort’s current population that would represent over five million more homeowners or $1 trillion in new home purchases. But some portion of that population would actually be forming joint households. If 60 percent marry each other, that would still mean an additional three million new home buyers, or a roughly $600 billion dollar increase in market sales over five years from just this one barrier-busting move.

    A separate analysis by John Burns Consulting argued that just the hurdle of student debt cost the U.S. housing market $83 billion dollars in sales last year. They estimate that every $250 in monthly student loan payments decreases home borrowing and purchasing power by $44,000. The number of households
    headed by those under 40 who owe at least $250 in monthly student loan payments has tripled since 2005 to 5.9 million. Multiplying those numbers times an average home sale price of $200,000 leads to their $83 billion conclusion—or $415 billion over five years.

    Others put the impact on the housing market of missing Millennials at more than twice that level by taking a look at the entire panoply of financial hurdles the generation faces, not just student debt. A Ned Davis Research report suggested these hurdles caused a drop in demand  for housing from Millennials of three million homes, for an annual market impact of $600 billion. Their estimate suggests “missing Millennials” represent more than a 1.3 trillion dollar market opportunity over the next five years. Whether the housing market will enjoy that type of revenue growth depends a great deal on how hard it focuses on the hurdles facing this critical home buying cohort.

    Although no one is going to wave a magic wand and make student debt disappear overnight, it is possible for government to take
    aggressive steps to limit if not eliminate these obligations. Furthermore, easing of credit and down payment requirements would have an immediate impact on Millennials’ decision to buy a new home. More generous parental leave policies on the part of the nation’s employers, either by their own initiative or government mandate, would help accelerate the pace. And policies designed to actually grow wages and expand the economy, such as easier access to affordablehigher education, would certainly help a generation struggling to put together the money they need for a down payment. Longer term policy initiatives designed to increase the supply of housing are certainly worth exploring, but the likelihood that they will be put in place in time to help the bulging number of Millennials moving into early adulthood is not high. Altogether, these initiatives could add at least an extra trillion dollars to the nation’s housing market and make Millennials so much more a part of that market than they are today.

    It’s time to give the country’s next great generation, Millennials, the same chance earlier generations had to become home owners. We need to help them overcome the hurdles they face in joining this coveted group of American families. Fortunately, the housing industry has it within its power to take the first steps to provide Millennials their piece of  the American Dream, helping ignite a housing boom that will spark an economic boom for the entire nation.

    This essay is part of a new report from the Center for Opportunity Urbanism called “America’s Housing Crisis.” The report contains several essays about the future of housing from various perspectives. Follow this link to download the full report (pdf).

    Morley Winograd is co-author of the newly published Millennial Momentum: How a New Generation is Remaking America and Millennial Makeover: MySpace, YouTube, and the Future of American Politics and fellow of NDN and the New Policy Institute.

  • Spreading the Wealth: Decentralization, Infrastructure, and Shared Prosperity

    This essay is part of a new report from the Center for Opportunity Urbanism called “America’s Housing Crisis.” The report contains several essays about the future of housing from various perspectives. Follow this link to download the full report (pdf).

    The public’s preference and the views of the social and intellectual elite has never been greater.

    Journalists, urban and environmental activists and politicians tend to share a vision of a future in which generations-old trends toward the decentralization and dispersal of both production and population are reversed. In this view, densification will replace sprawl, and mass transit will grow in importance relative to personal automobile use, as Americans in growing numbers abandon suburban houses for smaller apartments and condos in mid- density and high-density cities.

    “The New American Dream is Living in a City, Not Owning a House  in the Suburbs,” Time recently declared. The Atlantic agrees: “More Americans Moving to Cities, Reversing the Suburban Exodus.” As for the preferred housing type, the Smithsonian informs us: “Micro Apartments are the Future of Urban Living.” In this world-view, even farming will be brought “back to the city” with the emergence of vertical urban farms. “The Future of Agriculture May be Up” according to The Wall Street Journal. National Geographic predicts that “we may soon be munching on skyscraper scallions and avenue arugula.”

    In this dense city-centric world view, not only will cities feed themselves—in reality a practical and economic impossibility—but also there’s virtually nothing density cannot do, from calming the climate to raising (U.S. national productivity. “Double a city’s population and its productivity goes up 130 percent” asserts MIT News.

    In the depopulated hinterland between downtowns, sleek high-speed trains will whiz past rows of elegant white windmills or gleaming solar panels. Economies of scale and large- scale manufacturing will be replaced  by high-tech localism and the rebirth of walkable dense neighborhoods.

    Each wave of technological innovation since the early industrial revolution has inspired hopes that an economy of small-scale producers and small local markets and walkable, village- like communities can be preserved or recreated, using the most advanced technology available at the time. In 1812, in a letter to General Thaddeus Kosciusko, Thomas Jefferson wrote of his hope that industrial technology could be reconciled with a society of small farmers: “We have reduced the large and expensive machinery for most things to the compass of a private family, and every family of any size is now getting machines on a small scale for their household purposes.” In the early years of the twentieth century, Lewis Mumford hoped that electrification would permit a reversal of the trends toward large- scale corporations and utilities and infrastructure grids and a renaissance of community life and pedestrian cities.

    The third industrial revolution based on information technology has produced its own variants of this utopia, with Alvin and Heidi Toffler predicting “the electronic cottage.” With these earlier utopias, today’s techno-urbanism shares the same social ideal, a society in which production and population are reconcentrated and re-localized in dense communities, which may take the form of the low-rise pedestrian cities of the New Urbanists or Green and “sustainable” skyscraper downtowns. The persistence of this vision, in ever-changing forms, suggests that its appeal must be explained in terms of nostalgia for the less far- flung, less centralized, smaller-scale communities of the agrarian era and the early industrial period.

    Something like this vision of the future American landscape has achieved the status of a near-consensus in the mainstream press about the alleged return to the city and the impending demise of the suburbs. But the story is wrong in every detail. In reality, the American people are not abandoning low-density housing for crowded and expensive urban cores, nor are they likely to do so in the future.

    In fact, the immediate and likely mid-term future will look, in many ways, much like the recent past. Factories, farms and office parks will continue to be dispersed through suburbs, exurbs and the countryside. Information technology will consume ever more electricity, most of which, for the foreseeable future, will come from conventional utilities using fossil fuels, not from renewables like wind and solar power. The aging of the population and the growth of low- paying personal service jobs will increase the importance to the service-sector working class of personal automobile  use in employment. Self-driving cars and trucks, along with telecommuting, may reinforce this trend and produce further decentralization of work, housing, shopping and recreation. The robocar, not the passenger train, should be the icon of the transportation future.

    TECHNOLOGY AND DECENTRALIZATION

    For generations, successive technologies have dispersed production and population even as they have radically reduced transportation, energy and land costs. The increasing speed and flexibility permitted by innovative modes of transportation, from the canal to the railroad to the automobile, truck and airplane, have slashed freight and commuter costs while allowing production facilities and residences to spread out. The decentralization of work, shopping and dwelling has been enabled by the long distance transmission of energy and increasingly cheap, sophisticated and reliable telecommunications grids.

    Since the beginning of the industrial era, each new form of travel—the train, the automobile or truck and the airplane—has permitted higher speeds. From 1800 to the present, personal mobility in the U.S. has grown at an average of 2.7 percent per year with a doubling time of 25 years. Higher speeds allow longer commutes or business trips in the same amount of time. This has resulted in the expansion of urban areas to take advantage of cheaper land for the kind of housing people prefer, largely single family, and the simultaneous decline in their overall density. One study notes that the automobile has allowed cities to grow as much as fifty times larger than the typical pre-modern pedestrian city, which was limited to an area of 20 square kilometers. Today’s advocates of urban “densification” frequently denounce the automobile as the source of so-called “sprawl.” But the trend toward urban deconcentration began with the first industrial revolution, based on steam power. Rather than build urban mass transit around smoke-spewing locomotives, many cities built horse-car lines, something which was not practical until industrial technology made iron or steel rails cheap. In many places these were later replaced by electric trolleys or subways (early horse-drawn railways using wooden tracks had been limited to mines). The growth of suburbs began with horse-drawn omnibuses, trolleys, subways and commuter rail. The “pedestrian cities” of 1900, idealized by many of today’s urban planners, in fact were more dispersed than compact pre-industrial villages and cities.

    Nor has it ever been the case in the industrial era that production facilities have been situated for the convenience of existing city residents, as an alternative to moving workers to production sites. Mills grew up first along the fall lines of streams and rivers, where falling water could be tapped for energy. When coal-powered steam engines replaced waterpower, factory towns tended to be located near coal seams, as in the British Midlands, the Ruhr, and Pittsburgh, or else along rivers or canals with access to barge-borne coal. Mill towns and factory towns alike tended to grow up around the production facilities, which began as “greenfield” sites, to use modern terminology.

    The second industrial revolution, based on the electric motor and the internal combustion engine, accelerated the decentralization of manufacturing in the U.S. and other advanced industrial countries. Electric wiring and motorized power tools allowed large, flat, horizontal factories to replace earlier vertical factories in which waterwheels or steam engines had driven machinery on multiple floors by means of ropes and pulleys. To save money, the new factories were located on cheap land, which only later became dense as residences and
    amenities for workers grew up around them, as in Detroit. Trucks enabled factories to be located far from both waterways and rail lines, and personal car ownership allowed workers to live in less crowded conditions at greater distances from where they worked.

    Paradoxically, passenger air travel, by creating truly national corporations on a continental scale whose facilities could be visited by managers in a single day, allowed the centralization of functions in high-rise office buildings in a few headquarters cities, like New York City, and to a lesser extent, Chicago and, more recently, Los Angeles, Houston, Dallas and Atlanta. Satellite technology and the worldwide Web have enabled the further centralization of supervision over multinational corporations and global supply chains. The error of all too many modern urbanists is a failure to understand that the managerial and financial functions of such dense urban cores depend for their existence on supply chains and consumer markets in lower- density areas across the United States and the world. Only a small number of cities can specialize in these functions in the national and world economies, and these “global cities” like New York and Tokyo and Frankfurt cannot serve as models for most metro areas.

    THE FUTURE OF PRODUCTION

    Will the trend toward the decentralization of production and housing be reversed in the twenty-first century?

    Although their contribution to national employment is dwindling because of automation and offshoring, traded sector industries such as manufacturing, energy, mining and agriculture remain important parts of an advanced economy, because of their multiplier effects and upstream and downstream linkages. According to the Bureau of Economic Analysis, every dollar in final sales of a manufactured good is responsible for $1.34 in input from other economic sectors, while a dollar of retail trade generates only 55 cents and a dollar of wholesale trade only 58 cents. These industries, by their nature, tend to locate their facilities in low-density areas and need extensive, state-of-the-art infrastructures to connect them with national and global suppliers and businesses and consumer markets with minimum friction and cost.

    The decentralization enabled by trucks and cars and buses has converted the monocentric city of the railroad and canal era into what William Bogart, following Jean Gottmann, has called the polycentric city—a blob-like metro area with multiple smaller retail, office and recreation centers. For a while some older urban cores became specialized downtown business districts, housing the headquarters of firms whose factories, warehouses or back offices were located where land or labor or both were cheaper, in suburbs, small towns, and other states or other countries. But as headquarters have moved to suburban office parks and exurban campuses, many downtowns have reinvented themselves again as “playground cities” based around amenities enjoyed by a residential population of the rich and young professionals before marriage, as well as transient populations of tourists.

    Production has moved back to its historic home, the countryside or the outskirts of town. The migration of production out of the city has been accelerated by municipal policies that penalize productive enterprises because of their side effects of traffic, waste or pollution. The real estate
    interest in gentrification—turning former warehouses into lofts for affluent members of the gentry class or restaurants or offices for fashionable social media startups—has seized on this transformation, and in some places, with favorable economic results.

    The mainstream press frequently publishes breathless articles about the alleged rise of urban agriculture— sometimes accompanied by striking illustrations of skyscrapers full of hydroponic gardens or covered with what appears to be kudzu. Most of these stories quote a single activist, Dickson Despommier, a retired professor of microbiology at Columbia University’s School of Public Health. Many articles convey Despommier’s claims about the alleged superiority of indoor, climate- controlled farming in big cities without raising any objections.

    The most obvious objection is the price of land. Even if greenhouses and, in time, synthetic food laboratories were to contribute more to the diet of people in advanced industrial nations like the U.S., and even if consumers insisted on fresh food from nearby, most of these structures would be located on the periphery of expensive cities in low-rise suburbs or exurbs, to minimize the contribution of rent to the price. No matter what technology might be used, food grown in Manhattan will always be an expensive luxury because of land rent alone.

    Nor is most manufacturing ever likely to return to densely-populated, expensive urban areas. The automation of factories is reducing the manufacturing workforce worldwide, even in China. As labor costs decline in importance as a factor in location, more firms may choose to site increasingly-robotic factories near consumer markets and supply chains. And rapid prototyping and other advances that enable customization and short production runs may reduce the benefit that large factories enjoy over smaller operations.

    But high-tech home production of most appliances and high-tech versions of the village blacksmith will probably remain in the realm of science fiction. Economies of scale will probably continue to characterize even advanced manufacturing, to some degree. Most important of all, high rents, combined with municipal regulations, will make cities unattractive as sites for major factories, as distinct from small-scale artisanal shops. Neither agriculture nor large-scale manufacturing are likely to return to cities with high rents and property prices.

    BERMUDA TRIANGLE URBANISM

    What about service sector jobs? As automation leads manufacturing and other productive sectors to shed labor, the greatest growth in absolute employment is found in domestic service sector jobs in health, education, retail, government and other industries that cannot easily be outsourced or automated. The Bureau of Labor Statistics (BLS) projects that in 2022 “services-providing” jobs will account for 80.9 percent of new U.S. jobs.

    According to one influential view, the “new economy” is a post-material “knowledge economy” or “information economy” in which the production of immaterial goods and services is more important than material goods and traditional services. Adherents of this school often treat the most important activities in a modern economy as tech and financial services. This school of thought holds that U.S. productivity would be increased if more people were
    added to a few U.S. metro areas that specialize in tech and finance, with help from “densification” policies such as transit-oriented development.

    According to Chang Tai-Hsieh of the University of Chicago and Enrico Moretti of the University of California, Berkeley, the U.S. could be more productive if more workers could move from less productive cities to more productive cities, which they identify as, among others, San Francisco, San Jose, New York, Boston, and Seattle. They criticize land-use restrictions which prevent more high-rise apartments and high-rise office buildings to house the hordes who allegedly would boost their own productivity, and the nation’s as well, by moving from Bakersfield to San Jose. In short, massive densification would produce huge gains in productivity.

    In all of this there is a grain of truth—but only a very small grain. It is true that, in certain industries, there are genuine agglomeration effects, leading to the dominance of one locale in that field, at least for a while: Silicon Valley for tech, Wall Street for finance, Detroit for automobiles, Hollywood for entertainment. These locations brought together workers, firms, capital, infrastructure and flourishing social networks facilitating the exchange of ideas. If you want to be a country music singer, it was a good idea to move from Tulsa, Oklahoma to Nashville in the old days and to Branson today.

    But even these productivity effects  are limited to particular industries with particular skill sets. You are more likely  to improve your productivity and success as a country music singer if you move from Tulsa to Branson—but not if you move from Tulsa to Silicon Valley or Wall Street. Moretti and Hsieh admit: “The assumption of inter-industry mobility is clearly false in the short run. For example,
    it would be hard to relocate a Detroit car manufacturing worker to a San Francisco high tech firm overnight. On the other hand, the assumption is more plausible in the long run, as workers skills—especially the skills of new workers entering the labor market—can adjust."

    In spite of this concession to reality, Moretti and Hsieh argue for the mass relocation of much of the U.S. workforce to San Francisco, San Jose, New York and a few other big cities. As Timothy B. Lee notes in Vox:

    Hsieh and Moretti envision the New York metropolitan area becoming 9 times its current size, meaning that more than half the country would live there. The Austin metropolitan area would quadruple in size, as would the San Francisco Bay Area. Half the cities in America would lose 80 percent or more of their population. The population of Flint, MI, would shrink from 102,000 people to fewer than 2000.

    This might be called Bermuda Triangle urbanism. Certain metro areas are like the Bermuda Triangle and other legendary zones in which the laws of nature are supposed to operate differently than everywhere else. These metro areas have the unique property of magically raising the productivity of human beings of all skill sets who cross an invisible force field into them.

    Hsieh and Moretti argue that their favored coastal metro areas could rival Southern metro areas in growth by adopting the less restrictive land policies characteristic of growing Southern and Southwestern cities:

    We find that three quarters of aggregate U.S. growth between 1964 and 2009 was due to growth
    in Southern US cites and a group of 19 other cities. Although labor productivity and labor demand grew most rapidly in New York, San Francisco, and San Jose thanks to a concentration of human capital intensive industries like high tech and finance, growth in these three cities had limited benefits for the U.S. as a whole. The reason is that the main effect of the fast productivity growth in New York, San Francisco, and San Jose was an increase in local housing prices and local wages, not in employment. In the presence of strong labor demand, tight housing supply constraints effectively limited employment growth in these cities. In contrast, the housing supply was relatively elastic in Southern cities.Therefore, TFP growth in these  cities had a modest effect on housing prices and wages and a large effect on local employment.

    Advocates of “densification” have seized on Hsieh’s and Moretti’s work to argue for crowding more people into San Francisco and Manhattan by adding skyscrapers, legalizing micro-apartments and squeezing tiny houses into existing suburbs.xxvii But this ignores the fact that the growth of Southern and Southwestern cities has been driven in large part by the desire of middle-class and working-class Americans, as well as affluent Americans, to spend less while enjoying bigger homes and yards. According to demographer Wendell Cox, Census data shows that of the 51 metropolitan areas with more than 1 million residents, only three—Boston, Providence, and Oklahoma City—saw their core cities grow faster than their suburbs. (And both Boston and Providence grew slowly; their suburbs just grew more slowly. Oklahoma City, meanwhile, built suburban residences on the plentiful undeveloped land within city limits.)”. Similar preferences manifestly exist among younger generations of Americans. Between 2000–2011, the number of Americans aged 20–29 increased twenty times as much as the increase of their cohort in central business districts. To accommodate this desire for inexpensive space Southern and Southwestern cities have expanded horizontally, not vertically.

    To their credit, Hsieh and Moretti acknowledge that transportation systems, by enabling longer commutes, can allow more people to live in a metro area that remains relatively low in density. But even here they play to the prejudices of the coastal and campus intelligentsia, by endorsing high-speed rail: “An alternative is the development of public transportation that link local labor markets characterized by high productivity and high nominal wages to local labor markets characterized by low nominal wages. For example, a possible benefit of high speed train currently under construction in California is to connect low-wage cities in California’s Central Valley—Sacramento, Stockton, Modesto, Fresno—to high productivity jobs in the San Francisco Bay Area.”

    Hsieh and Moretti ignore how high-growth Southern cities—their putative models—actually grew. Cities in the South and Southwest in the last half century have expanded thanks to cars and trucks on adequate systems of streets and highways, and near-universal personal automobile ownership, not on the basis of a pre-automobile infrastructure of trains and trolleys and subways. People have moved there—and this appears to be true of educated workers—precisely not to live in high density and expensive areas.

    The link between densification and productivity does not exist even in the so-called “knowledge economy” of the tech sector. Even the intellectual labor of R&D tends to be done in the low-density environments of university and corporate campuses like those of Silicon Valley, Austin and the Research Triangle. The expensive downtowns of skyscraper cities increasingly are home to rentiers with residual financial claims on the products of innovation, including investors and former innovators, rather than individuals and groups engaged in important technological innovation themselves.

    THE NEW LANDSCAPE OF EMPLOYMENT

    Access to cars for personal use will become more, not less, important for  the majority of the American workforce in the decades ahead, thanks to the shifting composition of the workforce and the spatial deconcentration of service sector jobs. While better-paying service sector jobs like those in finance, law and business and professional services may remain downtown in corporate headquarters, an increasing number of lower-wage jobs involving personal care will be found in lower-rent suburbs and exurbs within metro areas. Particularly important among these will be jobs caring for the elderly, either at hospitals and medical centers and nursing homes, or in the homes of the elderly themselves. Between 2002 and 2022, health care and social assistance will have created more jobs than any other sector, growing from 9.5 percent of employment to 13.6 percent.

    Overwhelming numbers of American seniors say they wish to stay in their homes as long as they can. Given the expense of residenial care, elderly Americans will try to remain home with the help not only of technology but also of personal services provided in their homes. These services, many of them paying modestly, will provide employment for nurses, health aides, food delivers, shoppers, drivers, and others providing in-home care or help. Because their clients will be dispersed through metro areas, personal vehicle ownership or access to a car will be a necessity for most of these in-home care-givers. And because few of these jobs are likely to pay well, members of the new service sector working class will economize on expenditures by living in low-cost neighborhoods and shopping at discount stores and dining in affordable restaurants that are located in low- density areas and do not pass on high rents to their customers.

    What we are witnessing is the emergence of something not too dissimilar to European cities with gentrified downtowns becoming centers of high-status spending and employment while poverty is decentralized through the suburbs, particularly those in the inner ring while newer suburbs and exurbs generally do better.xxxiv This reversal of the mid-twentieth century pattern of downtown poverty and suburban affluence poses particular challenges to low-income workers without access to cars in suburbs and exurbs. Researchers at the Brookings Institute, studying data from hundreds of transit providers in numerous metro areas, discovered that, on average, workers reliant on mass transit cannot reach 70 percent of the jobs in their area in less than 90 minutes. Workers in low-income suburbs were even worse off. Only 22 percent of potential metro area jobs for which they were eligible were accessible in less than an hour and a half one way by means of mass transit.

    According to a study of two federal pilot programs operated by the Department of Housing and Urban Development, Moving to Opportunity for Fair Housing and Welfare to Work vouchers, poor participants with cars lived in better neighborhoods and greater employment opportunities. Low-income workers who received Moving to Opportunity Vouchers were twice as likely to get jobs and four times as likely to stay employed. Even when mass transit is available it tends to consume more time than commuting by car. Another study, showing the superior outcomes available to poor people with access to private vehicles, concluded: “If we were most interested in increasing the mobility of the poor, we would subsidize car ownership.”

    ROBOCARS VS. RAILROADS

    In his 2011 State of the Union address, President Barack Obama declared:  “Within 25 years, our goal is to give 80 percent of Americans access to high-speed rail. This could allow you to go places in half the time it takes to travel  by car. For some trips, it will be faster than flying—without the pat-down.” This vision was encouraged by maps showing an imaginary continental network of high-speed passenger rail.

    But the president’s high-speed rail initiative soon collided with reality. In 2011, the Obama administration proposed spending $53 billion on high- speed rail in the next six years. But from 2009-2014 the federal government has spent only $11 billion on high-speed rail. Governors in a number of states have blocked their states from accepting federal high-speed rail grants, for fear of escalating costs. California’s high speed rail project has been plagued by lawsuits and dwindling public support. Amtrak’s Acela, instead of travelling between New York and Washington in only 90 minutes as a true high-speed train might, takes nearly three hours to cover the distance. It would take a quarter century and an estimated expenditure of $150 billion to turn the Washington-to-New York route into a true high-speed rail route.

    The fetishization by many opinion leaders of fixed-rail technology as a futuristic symbol is puzzling. Passenger trains, like passenger blimps, are an anachronistic technology. Most passenger rail in the U.S. was rendered obsolete by the development of automobiles and airlines in the last century. A nonstop cross-country flight in the U.S. usually takes no more than six or seven hours from airport to airport. Even if high- speed rail could compete on some routes, the number of destinations would be far smaller than those accessible by high- speed air. The displacement of passenger rail by air travel and automobile travel in the U.S. has led railroads to return to their original mission from the days of horse-drawn trams and canals—the efficient overland movement of freight.

    The only part of the U.S. where inter-city passenger rail is significant is the Amtrak corridor through the Northeastern megalopolis from Washington, D.C. to Boston. But tickets are expensive, in spite of federal subsidies. In recent years, inter-city bus services have competed with Amtrak along its own route, with much cheaper tickets and only slightly longer travel time. Inter-city bus companies like Bolt have been able to lure away professional- class travelers with amenities superior  to those that Amtrak offers for a  fraction of the price. A 2013 comparison of Amtrak and bus service in a number of routes across the nation concluded that “the cost of providing scheduled motorcoach service is significantly lower than the cost of providing Amtrak train service. The cost difference ranges from a low of $17 per passenger (Washington, DC to Lynchburg, VA) to a high of more than $400 per passenger (San Antonio, TX to El Paso, TX).”

    What about intra-city rail transit? Outside of a few dense urban areas  like New York City, the future of fixed- rail seems bleak, notwithstanding the enthusiasm of urban planners for “light rail” transit projects, which have replaced skyscrapers and Seattle-style space needle towers as icons of progress and prestige  in the imaginations of local boosters. As the technology of self-driving cars advances and regulatory systems adapt, the price of rides in robotaxis compared to subway fare will plummet because taxi fares need no longer support a human worker, only maintenance and energy costs and a modest profit. Single-mode, point-to-point travel will always be more flexible and efficient than fixed- rail transit which requires parts of the journey to be undertaken by foot, bicycle, or automobile, including taxi travel. In most American cities, buses and taxis and personal cars rendered trolley systems obsolete by the mid-twentieth century. By the mid-twenty-first century, except in a few cities or a few routes like airports to convention/hotel centers, robotaxis may put subways and light trail out of business.

    Will robotaxis replace personal cars altogether? Many urbanist opponents of personal automobile ownership hope that fleets of robotaxis will roam the suburbs as well as dense urban centers, permitting suburbanites to dispense with garages and perhaps allowing “densification” of suburban neighborhoods, with houses built right up to the street. Like most fantasies of orthodox urbanism, this is unrealistic. Even if the costs of robotaxis fall radically, it is hard to imagine suburbanites repeatedly calling taxis during the day for different trips—to work and back, to drop off and pick up children and school, to go shopping and  to go out to a restaurant for dinner. In the suburbs, if not in dense urban centers, garages are likely to remain—and they will house the family robocar.

    What is more, the family robocar, like its human-operated predecessors— the station wagon and the minivan and the SUV—will be large enough to accommodate groups of people or large quantities of groceries or other purchases on occasion. And like today’s cars, it will be designed to operate both in cities and on highways. Visions in which individuals on a daily basis now choose tiny one-or-two passenger self-driving cars to commute and now rent spacious robot vans by the hour to go shopping are unlikely to be realized be realized if waiting times make it inconvenient to summon rental vehicles in low-density neighborhoods, as opposed to dense urban cores.

    To the extent that the automation of automobiles and trucks reduces accidents, safety considerations as an incentive to purchase large, heavy vehicles may diminish, and there may be a trend toward somewhat lighter and smaller cars. Still, it is reasonable to predict that fully self-driving cars and trucks will broadly resemble today’s human-operated vehicles, if only because the spatial demands imposed by the dimensions of passengers and freight will remain the same. The street and highway infrastructure of tomorrow is also likely to be more or less the same for self-driving vehicles in the future as for today’s cars and trucks, although fixed signals like painted stripes may give way to virtual signals permitting more flexible road use.

    Reflecting the anti-automobile bias of the gentry intelligentsia, the American press has trumpeted a recent finding that between 2007 and 2012 the number of households without a vehicle increased. But the increase was negligible, from 8.7 percent to 9.2 percent.xli Seventy-five percent of Americans drive to work, while ten percent commute to work by means of carpooling, a number that may have been enlarged by the hardships imposed by the Great Recession.

    Personal care use may well expand, thanks to self-driving cars. The annual cost of upkeep of roads may increase, and it may be necessary to expand road capacity, if the automation of the automobile increases traffic by allowing the elderly and unescorted children to travel without having to drive or be driven by another person.

    Flying as well as driving is on the verge of being transformed by robotics. The Federal Aviation Administration (FAA) may soon adopt regulations that permit the use of drones in the U.S. by civilian business.xliii The potential impact on industries and business models can only be imagined. Restaurant-to-door pizza delivery by drone is probably not in the cards any time soon. The most likely applications of commercial drones are in air freight transportation, warehousing, agriculture and photography, among other industries.

    Meanwhile, increasing automation may make passenger air travel safer. It might also enable the rise of “air taxis”—small aircraft which can pick up passengers on a flexible basis, along the lines of the “free flight” envisioned by a recent NASA study.

    ENERGY IN THE INFORMATION AGE: MYTH VS. REALITY

    Like popular visions of a future American landscape based on urban density and mass transit, perceptions about the information technology and energy infrastructure of the future are equally at odds with reality.

    The ICT (Information and Communications Technology) ecosystem is being transformed by a number of trends: the mobile internet, cloud computing, big data, the “internet of things” and “the industrial internet.” All of these trends together will translate into increased demand for both electricity and reliable wireless communications.

    Because much of the infrastructure supporting ICT is not visible—fiber optic cable, remote data centers, wireless towers—it is easy for the users of modern technology to imagine that it consumes less energy and materials than old- fashioned appliances, and to believe that information-based industries somehow exist in cyberspace rather than the material world. But the alleged virtual reality of cyberspace is grounded in physical infrastructure.

    Unlike windmills and high-speed trains, data centers are not part of the popular iconography of the imagined future. Indeed, for security reasons, many data centers are hidden from public view in nondescript buildings in remote complexes. The result, as a New York  Times report notes, is the illusion that information exists in an immaterial world: “The complexity of a basic transaction is a mystery to most users: Sending a message with photographs to a neighbor could involve a trip through hundreds or thousands of miles of Internet conduits
    and multiple data centers before the e-mail arrives across the street.”

    In spite of their effective invisibility, data centers are the backbone of the digital economy. As these nodes in national and global communications networks grow in importance, they consume more energy. A modern data center uses 100 to 200 times more electricity per square foot than an office building.xlvi Some data centers consume as much energy as small towns. In 2013 U.S. data centers devoured enough kilowatt-hours of electricity—91 billion—to power twice the number of households in New York City.xlvii Gains in efficiency and productivity may be outstripped by increased demands made possible by falling prices.

    And energy-hungry data centers themselves represent only 20 percent of ICT electric consumption, with the rest dispersed among hand-held devices, PC’s and other technologies. As one study notes, “Cost and availability of electricity for the cloud is dominated by same realities as for society at large—obtaining electricity at the highest availability and lowest possible cost."

    Electricity to power increasingly sophisticated phones and computers and cloud computing centers as well as machine-to-machine communication and communication among self- driving vehicles will have to come from somewhere. Will the source be renewable energy? Many Americans have been persuaded that combating global warming will require a rapid—and relatively painless—transition from fossil fuels to renewables, identified in the popular imagination with wind power and solar energy. This vision is sometimes united with the idea of a “distributed” energy network, in which utilities buy
    much of their electricity from rooftop solar panels or electric cars.

    In reality, the reign of hydrocarbons in the energy mix is far from over. The U.S. Energy Information Administration predicts that in 2040 as much as 80 percent of primary energy consumption by fuel in the U.S. will originate with three fossil fuels—petroleum and other liquids (33 percent), natural gas (29 percent) and coal (18 percent). In their contribution to primary energy production, renewables are predicted to rise only from 8 percent  in 2013 to 10 percent in 2040. As a share of electricity generation by fuel, renewables are predicted to account for only 15–22 percent in 2040, roughly the same as nuclear energy. Most of the renewable category is accounted for by hydropower and wind; only minor contributions will be made even in the best case scenarios for 2040 by solar, geothermal, and biomass.

    FUTURE INFRASTRUCTURE: EVOLUTION, NOT REVOLUTION

    The conventional wisdom of  urban planners posits revolution, not evolution. It is widely assumed that the trend of decentralization of production, housing and shopping—a trend that has been reinforced by each new wave of technology, beginning with steam engines—will somehow be reversed in the near future, leading to the reconcentration not only of housing but also of much manufacturing and even “urban agriculture” in dense cities. And all of this is supposed to be accompanied by mass abandonment of personal automobile use for mass transit and a rapid transition from fossil fuels to renewable energy sources.

    As I have sought to demonstrate, none of these assumptions is plausible.
    The future American landscape will be characterized by evolution, not revolution. The desire to minimize costs will lead most businesses and households to avoid expensive, dense urban areas for low-density regions with cheaper land. According to Jed Kolko of Trulia, only one of the ten fastest-growing cities with more than 500,000 people, Seattle, is predominantly urban, while five—Austin, Fort Worth, Charlotte, San Antonio and Phoenix—are majority suburban.

    Roads and highways will be important, as increasingly autonomous cars and trucks and buses render fixed-rail passenger transit even more marginal than it is today for passenger transportation (rail will retain its utility for freight transportation in the U.S.).  Air travel will become more complex, with the addition to airliners of civilian drones and perhaps “air taxis” reshaping patterns of production, package delivery and commuting. Telecommuting and the gradual electrification of transport will make reliable electric grids all the more indispensable. And the displacement of coal by natural gas, and the evolution of a global market in natural gas, will necessitate more pipelines. Growing Internet usage will have to be matched by reliable high-speed connectivity via national and international grids and increasingly colossal data servers which, even if they are more efficient, will require immense quantities of energy for operation and cooling.

    Far from reducing the quality of life of the working class/middle class majority in an aging America, “sprawl” or decentralization, if properly carried out, can benefit both the providers and consumers of personal services. Personal service providers with access to cars have a much greater market for their services— particularly if highways or expressways enlarge the number of sites or homes that they can visit. At the same time, low-cost, low-density housing in suburbs, exurbs and small-towns makes it easier for the elderly to age in place. Emergent technologies such as telemedicine and autonomous vehicles may make suburban life much less challenging for the elderly who can no longer drive. The greatest beneficiaries of an automobile-based service economy may be the low-income elderly and their modestly-paid caregivers.

    This picture is at odds with the kind of urban futurism which envisions passenger trains whizzing past windmills and solar power panels on their way from one skyscraper metropolis to another. Certainly robocars, power lines, natural gas pipelines, and data centers are less striking and glamorous than fashionable icons of pop futurism like high-speed rail and imaginary farms inside skyscrapers. But a decentralized America built on the bones of high-capacity roads, power lines, pipelines, and airstrips can enjoy a growing economy while minimizing the de facto taxes imposed by congestion, high land prices, and other detritus of excessive density. The historic nexus among technology, decentralization and the quality of life, far from being rendered obsolete, is on the verge of being reinforced and renewed in the United States.

    This essay is part of a new report from the Center for Opportunity Urbanism called “America’s Housing Crisis.” The report contains several essays about the future of housing from various perspectives. Follow this link to download the full report (pdf).

    Michael Lind is the Policy Director of the Economic Growth Program at the New America Foundation in Washington, D.C., editor of New American Contract and its blog Value Added, and a columnist forSalon magazine. He is also the author of Land of Promise: An Economic History of the United States. Lind was a guest lecturer at Harvard Law School and has taught at Johns Hopkins and Virginia Tech. He has been an editor or staff writer at the New YorkerHarper’s Magazine, the New Republic and the National Interest.

  • America’s Senior Moment: The Most Rapidly Aging Cities

    In the coming decades, the United States is going to look a lot greyer. By 2050, the number of Americans over 65 will almost double to 81.7 million, with their share of the overall population rising to 21 percent from roughly 15 percent now, according to Census projections. More than 10,000 baby boomers are turning 65 every day.

    Virtually every part of America will become more senior-dominated, but some more than others.

    To determine where seniors are most heavily clustered, we examined 2014 American Community Survey data for the country’s 53 largest metropolitan statistical areas and looked at which areas have the highest percentages of seniors. In many ways these areas are already experiencing what most of the country will in the coming decades.

    The most aged regions come largely in two forms. Retirement metro areas are older in large part due to longstanding patterns of senior migration. First on our list of most aged places is Tampa-St. Petersburg, Fla., where 18.7 percent of the population is over 65, well above the national average of 13.3 percent. Tucson, in dry and warm Arizona, ranks third at 17.7 percent while Miami is fourth, with 17 percent.

    But many of America’s oldest metro areas have little in common with arid Arizona or steamy Florida. Many of the most senior-heavy areas are in the Rust Belt, which has been losing residents to other places for generations, particularly the young. This includes America’s second most senior-dominated metro area, Pittsburgh, where a remarkable 18.3 percent of the population is over 65, 26 percent higher than the national average. Other Rust Belt towns that are heavily grey include No. 5 Buffalo (16.7 percent senior); No. 6 Cleveland (16.5 percent); No. 7 Rochester, N.Y. (16.0 percent); No. 8 Providence, R.I. (15.8 percent), No. 9 Hartford (15.7 percent); and No. 10 St. Louis (14.9 percent). No. 11 Birmingham, Ala. (14.7 percent), although located in the South, has a long history as a heavy manufacturing center.

    And where are seniors still relatively thin on the ground? Mostly in the booming sections of the Sun Belt, places that have long enjoyed considerable positive in-migration from both other states and abroad. Three of the five least senior-dominated places are in Texas, including Austin (9.4 percent), Houston (9.8 percent) and Dallas-Ft. Worth (10.2 percent). The other two include Salt Lake City, the family friendly Mormon capital where only 9.6 percent of residents are over 65 and high-tech capital Raleigh (10.6 percent).

    Biggest Senior Gains

    The picture is very different when we begin to look at where the share of seniors in the population has been growing the fastest. This reflects not so much better weather, per se, or the prevalence of older, declining industries, but the biggest migration pattern of the past 40 years: the movement of massive numbers of people to lower-cost, usually growing states.

    Now many of these same people are reaching 65, and more will soon. Typical of areas that are still young but are now aging rapidly is Atlanta – the senior share of its population grew 20 percent between 2010 and 2014. This is well above the increase of 11.3 percent across all the 53 largest metropolitan areas. Other areas that combine overall migration gains with rapid rates of aging include Raleigh, where the senior share grew 18.1 percent over the time span we examined; Las Vegas, a major magnet for migrants for a generation, saw its share grow by 17.7 percent.

    Some of the fastest-growing senior areas are also places that have been youth magnets, particularly in recent years. Take for example Portland, Ore., which is sometimes described as the “place young people go to retire.” Now more of the Rose City’s residents are actually retirees or heading in that direction; the share of seniors in Portland’s population grew by 17.4 percent from 2010 to 2014, the fourth-highest rate of any major metropolitan area. Other youth magnets, such as Austin, Denver and Charlotte, have also experienced higher than average senior share growth. All of these metropolitan areas ranked in the top third in domestic migration over the same period.

    Why is this happening? Certainly in some places it’s a function of lower prices in these cities; seniors who can cash out of California or New York can feather their nest eggs by moving elsewhere and buying a cheaper home. For those who do not require nonstop sunshine, relocating to Austin, or such North Carolina burgs as Raleigh and Charlotte, does not require a commitment to shoveling snow. Even high-cost Portland and Denver are bargains compared to California and New York.

    Another explanation may be that many parents are following their migrating children (and more importantly grandchildren) to these areas. A recent study ranks this among the biggest reason seniors move. Similarly, as many as one in four millennials have moved to be closer to their parents, often to enjoy life in more affordable communities and get help with raising their kids.

    Back To The City?

    The movement to Sun Belt cities, which tend to be more suburban with more dispersed employment, contradicts one of the favorite urban legends — that millions of aging boomers, now relieved of their children, have been leaving their suburban homes for core city apartments. Some assert that suburbs, being car oriented, will become impossible for seniors as they get older, although eventually autonomous vehicles could allow boomers to drive as long as they can live independently.

    Yet as in so many demographic issues, the “back to the city” meme conflicts with both preferences and actual behavior of most seniors. The most recent decennial Census, for example, shows that the senior percentage share in both the inner core and older suburbs dropped between 2000 and 2010 while growing substantially in the newer suburbs and exurbs. The most recent data show these patterns continue. Since 2010 the senior population in core cities has risen by 621,000 while the numbers in suburbia have surged by 2.6 million.

    “The back to the city” meme appeals to urban boosters and reporters but in reality the numbers behind it are quite small. A 2011 survey by the real estate advisory firm RCLCO found that among affluent empty nesters, 65% planned to stay in their current home, 14% expected to look for a resort-type residence, and only 3 percent would opt for a condominium in the core city. Most of those surveyed preferred living spaces of 2,000 square feet or more. RCLCO concluded that the empty nester “back to the city” condominium demand was 250,000 households nationwide, a lucrative but small market out of the 4.5 million empty nester households in the metropolitan areas studied.

    Rather than move into the city, most boomers, if they move, head towards the periphery or out of town completely. A 2012 National Association of Realtors survey found that the vast majority of buyers over 65 years old looked in suburban areas, followed by rural locales. In contrast, relatively few seniors are likely to give up their homes for condos in the city center; a study by the Research Institute for Housing America suggested that barely 2 percent of all “empty nesters” seek an urban locale.

    Looking Ahead

    Where seniors move will do much to shape America’s future geography. In some places, notably in the Rust Belt, an aging population may suffer from the lack of young people to generate new wealth, pay taxes or provide them with services. In many others, notably in the Sun Belt, areas now built around youthful migration will have to prepare to accommodate many more aging people. And perhaps the biggest challenges will be felt by suburbs that, built for young families, now have to accommodate a growing senior population.

    In the past we always associated change with the movements and desires of the young. But in the 21stcentury, it may well be the seniors, not the kids, who will be forging new paths in how American communities fare.

    No. 1: Atlanta

    Growth In Senior Share Of Population, 2010-14: 20.3%

    Senior Share Of Population (over 65), 2014: 10.8%

    Rank Among Major U.S. Cities By Pop. Share: 48th

    No. 2: Raleigh

    Growth In Senior Share Of Population, 2010-14: 18.1%

    Senior Share Of Population (over 65), 2014: 10.6%

    Rank Among Major U.S. Cities By Pop. Share: 49th

    No. 3: Las Vegas

    Growth In Senior Share Of Population, 2010-14: 17.7%

    Senior Share Of Population (over 65), 2014: 13.3%

    Rank Among Major U.S. Cities By Pop. Share: 27th

    No. 4: Portland

    Growth In Senior Share Of Population, 2010-14: 17.4%

    Senior Share Of Population (over 65), 2014: 13.3%

    Rank Among Major U.S. Cities By Pop. Share: 27th

    No. 5: Jacksonville

    Growth In Senior Share Of Population, 2010-14: 17.1%

    Senior Share Of Population (over 65), 2014: 14.2%

    Rank Among Major U.S. Cities By Pop. Share: 16th

    No. 6: Denver

    Growth In Senior Share Of Population, 2010-14: 16.4%

    Senior Share Of Population (over 65), 2014: 11.7%

    Rank Among Major U.S. Cities By Pop. Share: 46th

    No. 7: Austin

    Growth In Senior Share Of Population, 2010-14: 16.3%

    Senior Share Of Population (over 65), 2014: 9.4%

    Rank Among Major U.S. Cities By Pop. Share: 53rd

    No. 8: Phoenix

    Growth In Senior Share Of Population, 2010-14: 15.7%

    Senior Share Of Population (over 65), 2014: 14.2%

    Rank Among Major U.S. Cities By Pop. Share: 16th

    No. 9: Sacramento

    Growth In Senior Share Of Population, 2010-14: 15.6%

    Senior Share Of Population (over 65), 2014: 13.9%

    Rank Among Major U.S. Cities By Pop. Share: 21st

    No. 10: Tucson

    Growth In Senior Share Of Population, 2010-14: 14.7%

    Senior Share Of Population (over 65), 2014: 17.7%

    Rank Among Major U.S. Cities By Pop. Share: 3rd

    Joel Kotkin is executive editor of NewGeography.com. He is the Roger Hobbs Distinguished Fellow in Urban Studies at Chapman University and executive director of the Houston-based Center for Opportunity Urbanism. His newest book, The Human City: Urbanism for the rest of us, will be published in April by Agate. He is also author of The New Class ConflictThe City: A Global History, and The Next Hundred Million: America in 2050. He lives in Orange County, CA.

    Wendell Cox is Chair, Housing Affordability and Municipal Policy for the Frontier Centre for Public Policy (Canada), is a Senior Fellow of the Center for Opportunity Urbanism (US), a member of the Board of Advisors of the Center for Demographics and Policy at Chapman University (California) and principal of Demographia, an international public policy and demographics firm. He is co-author of the “Demographia International Housing Affordability Survey” and author of “Demographia World Urban Areas” and “War on the Dream: How Anti-Sprawl Policy Threatens the Quality of Life.” He was appointed to three terms on the Los Angeles County Transportation Commission, where he served with the leading city and county leadership as the only non-elected member. He served as a visiting professor at the Conservatoire National des Arts et Metiers, a national university in Paris.

    “Senior Citizens Crossing” photo by Flickr user auntjojo.

  • Black Homes Matter: The Fate of Affordable Housing in Pittsburgh

    “I live here.  I’m from here.  My whole family is here.   We try to stay close together.  This is America.  I’m a Marine, I went to war three times.  I served my country.  It feels crazy not to be able to live in my own area where I grew up,” writes an East Liberty resident in Black Homes Matter, a booklet describing alternative approaches to neighborhood revitalization in the city of Pittsburgh. Since the Reagan-era shut-down of funding for public housing projects, the lack of decent affordable housing for low-income people has become a crisis in many cities.  San Francisco and Seattle are notorious for pushing out poor and working-class residents, but mid-sized cities like Pittsburgh will be following suit unless city governments have the courage to implement equitable development.

    Pittsburgh has been designated the “most livable city” in the US several times in the past decade.  It gets points for its parks and rivers, excellent universities and hospitals, low crime rate, strong family-centered neighborhoods, expanding high-tech economy, and fine dining.  Of course, The Economist and Forbes magazine do not consider how the city’s livability is distributed unequally across lines of race and class.  The facts that we have among the steepest bus fares in the nation, the lowest minimum wages, and high infant mortality among African Americans do not figure in rankings designed to attract tourists and new businesses to the city.

    Housing is one of the sharpest of these class-race fault lines, as gentrification accelerates in desirable neighborhoods.  In a city already segregated by race, affordable housing is rapidly being replaced by high-end units for young professionals attracted by the city’s hi-tech reinvention of itself after the decline of steel and other industries.  The former Nabisco factory in East Liberty now houses a Google hub in the Bakery Square mall and “village,” with an LA Fitness gym, Anthropologie store, and high-priced coffee shops.   Its developer received major public funding because the project borders a “blighted” neighborhood, whose mostly black residents have hardly benefitted from the action.  Few local residents are employed by the new businesses in their neighborhood.

    East Liberty is also the site of a nearly completed Transit-Oriented Development project along the Port Authority’s east bus-way.  Residents of the 360 new apartments, built by private developers with infrastructure provided by the city, will be able to get downtown in twelve minutes.  Rents in the transit center buildings start at $1,100 a month for a studio apartment.   No units have been reserved for tenants whose income is below the city’s median income, which in Pittsburgh is $37,161 overall, and $21,790 for black residents.  Calculating housing expenses at 30% of income, maximum rents would be $929 and $545 respectively.  In the absence of inclusionary zoning, or other enforcement for equity, there is no room in the attractive new development for even the average city resident, let alone those getting by on much lower incomes.  Ironically, these are traditionally the primary users of public transit.  Pittsburgh is on a course to follow Washington DC, where a recent Washington Post study found that neighborhoods with Metro stops are now majority white, and “the Metrorail system is becoming more inaccessible to minority workers.”

    Throughout what was a predominantly black neighborhood, residents are being forced out either through direct eviction from public housing that is being demolished for re-development or because rents have risen beyond their means. In the Pittsburgh Post-GazetteDiana Nelson Jones writes, “Many who are leaving East Liberty can’t find rental housing under $800. Many are having to accept living without adequate services, including transit, outside city neighborhoods where they have earned a sense of belonging. The vast majority are our elders, lifelong laborers and the working poor. Nobody should get sick with stress in the struggle to pay their expenses, then get sent off to the fringes.”  But that is the current reality.  One resident quoted in Black Homes Matter says, “We wasted six months looking for something affordable around here so we finally moved out to Millvale.  I had to buy a car to commute back here to my job and then I had to take another job to pay for the car. I get very little sleep.  And I miss my neighborhood.”

    As a white middle-class resident of a neighborhood bordering East Liberty, I have benefited from the area’s revitalization.  I shop at Trader Joes and Home Depot and eat at Chipotle and Whole Foods.  I have a choice of three nearby yoga studios.  The house I bought twenty years ago for $50K, with help from the Urban Redevelopment Authority because it was in a “transitional” neighborhood, is now worth upwards of $300K.  My street, which was mixed-race back then, now appears to be entirely white, despite being majority rental.   There’s a deep injustice in the fact that many residents who lived through the period of “blight” in the neighborhood are not here to share in its renewal or in the wealth being generated.  Some residents who stay no longer feel at home: “There are people looking at me like ‘what are you doing here?’  I had my first kiss on that street.”

    Along with its “most livable” designation, Pittsburgh is also credited these days for its progressive city administration.  Mayor Bill Peduto, in office since 2014, is listed alongside New York’s Bill De Blasio as a leader willing to tackle structural inequality in his city.  Bakery Square and the East Liberty TOD were initiated before Peduto’s term, and he has recently set up an Affordable Housing Task Force.  A test case will come with the development of the “28 acres,” a vast parking lot between downtown and the largely black Hill District.  This was the site in the 1960s of one of Pittsburgh’s most brutal acts of “urban renewal” – or “negro removal” as activists call it.  8,000 people were displaced and their homes and businesses razed to make way for an arena and parking for the Pittsburgh Penguins hockey team.  The arena has been demolished and the Penguins have relocated, but they still own the land and they refuse to include more than 12% of affordable housing on the site.  With “affordable” defined as 80% of the market rate, even those few homes will be out of reach for descendants of the families that used to live in what was a thriving community.

    It doesn’t have to be this way.  On Pittsburgh’s North Side we have a counter-example: a strong tenant council prevented the eviction of more than 300 low-income families from Section 8 housing slated for redevelopment.  Working with the URA and other agencies, Northside Coalition for Fair Housing acquired properties and used a “rehab for resale” strategy to keep people in their homes.  “The result has been higher-quality housing, safer and more attractive neighborhoods, and increased tenant incomes,” according to the Pittsburgh Fair Development Action Group, which produced Black Homes Matter.  The group advocates a range of strategies to resist displacement and support resident control in neighborhoods threatened by gentrification: inclusionary zoning, community land trusts, rent stabilization, tenant ownership schemes.

    There is no shortage of successful models from around the country.  In Pittsburgh and other cities, we need the political will to hold private property developers accountable to equitable standards and to include residents in determining plans for improvement of their communities.  Affordable housing and accessible transit are essential to neighborhoods that are “livable” for all.

    This essay was first published by the Working-Class Perspectives blog, which offers weekly commentaries on current issues related to working-class people and communities.

    Nicholas Coles holds BA and MA degrees from Oxford University and MA and PhD degrees from SUNY, Buffalo, and has been a member of Pitt’s English Department at the University of Pittsburgh since 1980. Coles is a past-president of the Working-Class Studies Association, and is a founding member of the Pittsburgh Collaborative for Working-Class Studies, a new multi-campus interdisciplinary organization.

    Image of Eastside III development courtesy of mosites.net.

  • We Now Join the U.S. Class War Already in Progress

    Neither Trump nor Sanders started the nation’s current class war—the biggest fight over class since the New Deal—but both candidates, as different as they are, have benefited.

    Class is back. Arguably, for the first time since the New Deal, class is the dominant political issue. Virtually every candidate has tried appealing to class concerns, particularly those in the stressed middle and lower income groups. But the clear beneficiaries have been Trump on the right and Sanders on the left.

    Class has risen to prominence as the prospects for middle and working class Americans have declined. Even amidst a recovery, most Americans remain pessimistic about their future prospects, and, even more seriously, doubt a bright future (PDF) for the next generation. Most show little confidence in the federal government, although many look for succor from that very source.

    To understand class in America today, one has to look beyond such memes as “the one percent” or even the concept of “working families.” As Marx understood in the 19thcentury, classes are often fragmented, with even the rich and powerful divided by their economic interest and world view. In our complex 21st century politics, there’s a big divergence among everyone from the oligarchic classes to those who inhabit, or fear they will soon inhabit, the economic basement.

    The Fragmented OligarchiesThe Techies versus the Tangibles

    This confounding election stems, as much as anything, from the growing divisions among America’s business elite. These divisions have existed in some form in the past, but may never have been so gaping as today.

    On one side, we have the tangible industries—manufacturing, homebuilding, agriculture, logistics and especially energy—which often find themselves on the bad side of progressive regulation. Once these industries split their political contributions between the two major parties, but increasingly they are heading into the GOP camp.

    This is particularly notable in the energy industry. With progressives clamoring for the virtual destruction of the fossil fuel industry as soon as possible, executives feel compelled to back the GOP. They know that as the green movement ups its demands, their heads are on the collective chopping block. In 1990, energy firms gave almost as much to Democrats as Republicans; in 2014 they gave over three times as much to the GOP. Other tangible sectors, including agriculturehomebuilding and chemical manufacturing, which depends on cheap energy, seem also be leaning to the GOP.

    These corporate interests used to dominate fund-raising, but they are increasing out-gunned and out-spent by the rising tech and media sectors. This is where the big money is: In America , the media-tech sector in 2014 accounted for five of the top ten wealthiest people. And just this year, the fortune of the poster boy of social media, Mark Zuckerberg,exceeded that of the Koch brothers, the much demonized scions of the old economy.

    And these new style oligarchs are, for the most part, much younger than their tangible industry rivals. Indeed, virtually all self-made billionaires under 40 are techies. And where once tech folk supported middle of the road candidates, there has been a steady “leftward” drift for the last 15 years. In 2000, the communications and electronics sector was basically even in its donations; by 2012, it was better than two to one Democratic. Microsoft, Apple, and Google—not to mention entertainment companies—all overwhelmingly lean to the Democrats with their donations.

    This shift has occurred as the tech industry has moved away from its roots in aerospace and manufacturing to software and media. This realignment has relieved Silicon Valley of many traditional concerns with labor, energy prices, and basic infrastructure. When you are moving bits and bytes instead of building machines and circuits, you have less pressing interest in maintaining roads and having access to cheap energy. When virtually all your employees have degrees from elite colleges, or are imported technocoolies from India, you worry less about the cost of living or managing unions.

    The Obama years have solidified these ties. Many former Obama aides now work for firms such as Uber, AirBnB, Google, Twitter, and Amazon. Tech also leans strongly towards cultural progressivism—support for gay marriage, abortion rights and unrestricted immigration—and sympathy for the administration’s initiatives on climate change. They are not too concerned about higher energy prices for the middle and working classes, or their negative impact on basi cindustries. Climate change politics not only allows Silicon Valley and its Wall Street supports to feel better about themselves. It has also allowedventure firms and tech companies to profiteer on subsidies.

    But class issues muck up this alliance of manna and idealism. Despite their hip and cool image, the tech oligarchs remain very much ruthless capitalists when it comes to preserving and expanding their wealth. Although Bernie Sanders rarely attacks the tech oligarchs directly, they recognize him as a threat. “They don’t like [Bernie] Sanders at all,” notes San Francisco-based researcher Greg Ferenstein, who has been polling internet company founders for an upcoming book. “He’s an egalitarian liberal,” Ferenstein explains. “These people are tech liberals. Equality is a non-issue in Silicon Valley.”

    Sanders seems not to get the memo—he prefers to demonize Wall Street—butThe Washington Post, owned by super-oligarch Jeff Bezos, has taken particular pains to cut the Vermont socialist down to size. No surprise here, given the controversy over labor relations at Amazon, which, unlike Facebook or Google, actually has to employ blue collar workers.

    Most gentry and “tech liberals” appear to be aligning their vessels with Hillary Clinton’s now listing “armada” of well-heeled tech, financial, and other cronies. Some of these same people have also donated quite generously to the ethically challenged Clinton Foundation.

    And what about Wall Street, the biggest and most deserving target for class rage? Of course, the masters of the universe don’t like Bernie, the one candidate sure to oppose their interests. They are more than ready for Hillary, who, as Sanders repeatedly points out, has been taking their money in gigantic gobs. Security firms, for example, are thelargest donors to Clinton’s super-pak, lagging behind only Jeb Bush in terms of money from this detested part of our economy.

    Yet the more Wall Street money dominates the race in both parties, the less voters seem willing to listen. Their GOP favorites have either lost or are on the way out, including Marco Rubio, who seemed poised to win Wall Street support with his confounding proposal—amidst concern with inequality and rapacious profiteering—advocating a zero capital gains rate. Unable to unite, they are now facing the real, unnerving possibility of Donald Trump or Ted Cruz as the party standard-bearer.

    The Divided Middle Orders: The Yeomanry vs. the Clerisy

    Big contributors may determine who stays in a race, and sometimes who wins, but most elections are settled by the middle class, which constitutes something close to half the population, and likely more of the electorate. Yet like the oligarchs, the middle class is also deeply divided between competing factions and interests.

    The largest section of the middle class consists of what I call the yeomanry. This includes some 28 million small business owners, many of whom employ one of more family members. Spread across a variety of fields, this sector constitutes the class most opposed to the Obama program. In fact, according to Gallup, in 2012 three-fifths of all small business owners opposed Obama’s policies.

    The reasons for this opposition are obvious. Progressive policies like higher minimum wages and stricter environmental and labor laws hit small businesses harder than bigger firms, which have the staff and resources to adapt to the regulatory vise. Once seen as the leading, creative edge of the economy, small business has not done well under Obama: for the first time in modern history, more firms (PDF) are going out of business than staying solvent.

    But there’s another, more ascendant part of the middle class—highly educated professionals, government workers, and teachers—who have done far better under President Obama. In 2012, professionals generally approved of his regime, according to Gallup,by a 52 to 43 percent margin. These voters have become a critical part of the democratic coalition; indeed eight of the nation’s ten wealthiest counties—including Westchester County in New York, Morris County in New Jersey, and Marin County in California—all went Democratic in 2012.

    These middle income workers increasingly do not work for the private economy; they occupy quasi-public jobs dependent on public dollars than private markets. Universities, a core Democratic constituency have been hiring like mad: between 1987 and 2011, they added 517,636 administrators and professional employees, or an average of 87 every working day.

    This educated and often well credentialed middle class tends towards progressive politics; in fact, university professors have become ever more leftist, outnumbering conservatives six to one. Indeed, those voters with advanced degrees were the only group of whites by education to support Obama in 2012.

    In modern America, these people serve largely as a clerisy, hectoring the public and instructing them how to live. A bigger state is not a threat to them, but a boon. No surprise that public unions and academics have emerged as among the largest and most loyal donors to Democrats.

    The Democratic race is a largely a battle over securing the loyalty this class. Clinton tends to dominate the already established clerisy—most notably the teachers unions and gay and feminist lobbies—and among older progressives. But the leaders are being deserted by the followers: Sanders won a decisive 56 percent of college educated primary voters in New Hampshire.

    The Lower Classes: The Precariat and the Traditional Lower Class

    More Americans see themselves as belonging to the lower classes today than ever in recent times. In 2000 some 63 of Americans, according to Gallup, considered themselves middle class, while only 33 percent identified as working or lower class. In 2015, only 51 percent of Americans call themselves middle class while the percentage identifying with the lower classes rose to 48 percent.

    The bulk of this population belongs to what some social scientists call the “precariat,” people who face diminished prospects of achieving middle class status—a good job, homeownership, some decent retirement. The precariat is made up of a broad variety of jobs that include adjunct professors, freelancers, substitute teachers—essentially any worker without long-term job stability. According to one estimate, at least one-third of the U.S. workforce falls into this category. By 2020, a separate study estimates, more than 40 percent of the Americans, or 60 million people, will be independent workers—freelancers, contractors, and temporary employees.

    This constituency—notably the white majority—is angry, and with good cause. Between 1998 and 2013, white Americans have seen declines in both their incomes and their life expectancy, with large spikes in suicide and fatalities related to alcohol and drug abuse.They have, as one writer notes, “lost the narrative of their lives,” while being widely regarded as a dying species by a media that views them with contempt and ridicule.

    In this sense, the flocking by stressed working class whites to the Trump banner—the New York billionaire won 45 percent of New Hampshire Republican voters who did not attend college—represents a blowback from an increasingly stressed group that tends to attend church less and follow less conventional morality, which is perhaps one reason they prefer the looser Trump to the bible thumping Cruz, not to mention the failing Ben Carson.

    Many Trump supporters are modern day “Reagan Democrats.” Half of Trump’s supporters, according to a YouGov survey, stopped their education in high school or before. Trump’s message appeals to these voters in part by preserving social security and other entitlements. He appeals to populist rather than the usual GOP free market sentiment, and decisively won all voters making under $50,000 a year. Tellingly, among Iowa Republican voters who called themselves “moderate or liberal,” Trump trounced Cruz, and duplicated the feat again in New Hampshire.

    Conservative intellectuals dismiss Trump as both too radical and not conservative enough. He offends pundits in both parties by pushing things verboten in polite circles, such as trade with China, which has been responsible for the bulk of U.S. manufacturing losses. He also has embraced curbs on immigration, something that rankles the established leaders in both parties.. “There’s a silent majority out there,” Trump says. “We’re tired of being pushed around, kicked around, and being led by stupid people.”

    But if older, white Trumpians reflect the precariat’s past, young people flocking to Sanders’s camp may represent its future. Sanders destroyed Clinton among those under 30, winning their votes in both the Iowa caucuses and New Hampshire by six to one. These young voters may differ from generally older and whiter Trump voters on many key issues, but they also face a precarious future and diminished prospects. Over the past 40 years, few groups (PDF) have seen their incomes drop more than people under 30.

    In a decade, these millennials will dominate our electorate and as early as 2024 outnumber boomers at the polls. They may be liberal on many social issues, but their primary concerns, like most Americans, are economic, notably jobs and college debt . Fully half, notes a recent Harvard study (PDF), already believe “the American dream” is dead.

    For many millennials, Clinton style incrementalism is less than enough. A recentyougov.com poll found some 36 percent of people 18 to 29 favor socialism compared to barely 39 percent for capitalism, making them a lot redder than earlier generations. No surprise that Sanders beat Clinton among younger voters. As one student, a Sanders backer, recently asked me, “Why should I support her. How is she going to make my life better?”

    Below the precariat lie the traditional lower classes. Almost 15 percent of Americans live in poverty (PDF), and the trend over time has gotten worse. More than 10 million millennials are outside the system, neither in the labor force or education. This is just the cutting edge of a bigger problem: a labor participation rate which is among the lowest in modern history.

    The low-income voters are helping both Trump and Sanders. The Vermont socialist won an astounding 70 percent of the votes among people making less than $30,000 a year. Trump’s largest margins were among both these voters and those making under $50,000 annually, who together accounted for 27 percent of GOP primary voters.

    Class as the New Defining Issue

    We are now experiencing a growth in class-based politics not seen since the New Deal. During the long period of generally sustained prosperity from the ’50s to 2007, class issues remained, but were increasingly subsumed by social issues—civil and gay rights, feminism, environment—that often cut across class lines. Democrats employed liberal social issues to build a wide-ranging coalition that spanned the ghettos and barrios as well as the elite neighborhoods of the big cities. Similarly, Republicans cobbled together their coalition by stressing conservative social ideas, free market economics, and a focus on national defense; this cemented the country club wing with the culturally conservative suburban and exurban masses.

    The chaos and constant surprises of this campaign represent the beginning of a new political era shaped largely by class. In November Trump hopes to ride the concerns of the white working class to victory in the rustbelt to overcome Hillary Clinton’s coastal edge. Close to 20 percent of Democrats, according to Mercury Analytics surveys, plan to support Trump as their champion. In the coming months, the donor class, politicians, and pundits will be forced to address the needs of Trump’s supporters, as well as those of Sanders’ youth precariat in ways mainstream politicians have avoided for years.

    As class politics reshape American politics, we are entering territory not explored for at least a half century. Our political culture is being rocked in ways few would have anticipated just a few months ago.

    Joel Kotkin is executive editor of NewGeography.com. He is the Roger Hobbs Distinguished Fellow in Urban Studies at Chapman University and executive director of the Houston-based Center for Opportunity Urbanism. His newest book, The Human City: Urbanism for the rest of us, will be published in April by Agate. He is also author of The New Class ConflictThe City: A Global History, and The Next Hundred Million: America in 2050. He lives in Orange County, CA.

    Photo by Max Goldberg from USA (Bernie @ ISU) [CC BY 2.0], via Wikimedia Commons

  • The Religious Right is Being Left Behind

    The religious right, once a major power in American politics, is entering an uncomfortable dotage. Although numerous and well-organized enough to push Ted Cruz over the top in Iowa, the social conservative base, two-thirds of them born-again Christians, was of little use in New Hampshire, one of the most secular states in the Union. In the Granite State, Cruz did best among evangelicals but still slightly trailed Donald Trump among this one-quarter of New Hampshire Republicans.

    More importantly, Cruz’s religious strategy might not be enough to allow the Texan to vault past his main rivals, even in the “Bible Belt” states like South Carolina, where Real Clear Politics polls last week showed Donald Trump more than 16 points ahead. This, along with the total collapse of Ben Carson’s religiously based campaign, reflects, in part, slowing growth on the religious right. Evangelicals, who are the cutting edge of the movement, are gaining market share among Christians only because of sharper declines among mainstream Protestants and Catholics. Overall, notes Pew, 68 percent of Americans now believe religion is losing influence in society.

    In contrast, momentum is shifting to the religiously unaffiliated, whose numbers are rising rapidly, from 37.6 million in 2007 to 57 million in 2014. This process is particularly marked among millennials, a large portion of whom appear to have little interest in organized religion. Even if people remain spiritually inclined – and most Americans still are – the lack of church attendance makes mobilization of the faithful ever more difficult.

    Most importantly, some 34 percent of millennials profess to having no religion, compared with 23 percent of the overall population.

    Read the entire piece at The Orange County Register.

    Joel Kotkin is executive editor of NewGeography.com. He is the Roger Hobbs Distinguished Fellow in Urban Studies at Chapman University and executive director of the Houston-based Center for Opportunity Urbanism. His newest book, The Human City: Urbanism for the rest of us, will be published in April by Agate. He is also author of The New Class ConflictThe City: A Global History, and The Next Hundred Million: America in 2050. He lives in Orange County, CA.

    Ted Cruz photo by Michael Vadon (Own work) [CC BY-SA 4.0], via Wikimedia Commons