Category: Demographics

  • Brain Drain Hysteria Breeds Bad Policy

    Desperate times call for desperate measures. The Rust Belt, a region familiar to the air of anxiety, knows this all too well, particularly the “desperate measures” part.

    A case in point: During the 1990’s, Pittsburgh, like many of its Rust Belt peers, was in the midst of a fit of brain drain hysteria. Strategic policy was needed. So the powers that be thought of a marketing campaign meant to saturate the minds of the educated “young and the restless” who were thinking about exiting the Steel City. Pittsburgh demographer and economist Chris Briem, in a 2000 op-ed in the Post-Gazette, picks it up from here:

    “The focus on retaining vs. attracting workers is pervasive in local policies. One marketing character thought of by the Pittsburgh Regional Alliance, whose mission is to promote Pittsburgh, was the genial "Border Guard Bob." The image was of an older, uniformed sentinel on Pittsburgh’s borders keeping our citizens, in particular the younger workers, from leaving the region. This is the same logic that inspired the East Germans to build a wall around Berlin and is likely to have as much success in the long-run.”

    Luckily for Pittsburgh, Border Guard Bob never materialized. Policy-wise, building walls is terrible form in the age of information. Still, the aura of desperation remained in the region, despite its illogicality. For instance, in his 2002 piece called “Young people are not leaving Pittsburgh”, Briem crunched the numbers to find the region’s brain drain wasn’t. Yet he found it hard “to convince Pittsburghers that the outmigration of youth is not the problem it once was,” blaming “a persistence of memory” stemming from the regional exodus in the 1980’s.  

    As a demographer and economic thinker in Cleveland, I can sympathize with Briem. Cleveland, too, is prone to bouts of brain drain hysteria. A recent report highlighted in the New York Times called “The Young and Restless and the Nation’s Cities” was enough set off a flare-up. The report found that between 2000 and 2012, Greater Cleveland added less than 800 25- to 34-year-olds with a college degree—an increase of 1%. The metro ranked second last out of 51 metros, behind only Detroit.

    Obviously, those numbers are not good. That said, from a methodological standpoint, the study has its limitations. Specifically, the analysis cuts through four economic eras: 2000, the end of a prolonged expansionary period; 2005 to 2007, the middle of a jobless economic recovery; 2008 to 2010, the throes of a deep global recession; and 2011 to 2012, a period of economic recovery.

    Why does this matter? Migration patterns are affected by quite different economic circumstances nationally. This is especially true for the 25- to 34-year-old cohort, who are the most mobile, if not fickle, group.

    For example, Greater Cleveland’s lack of a young adult brain gain from 2000 to 2012 resulted from a substantial decrease of nearly 16,000 25- to 34-year-olds with a 4-year college degree from 2000 to 2006. The 2001 recession and subsequent jobless recovery hit Cleveland hard. However, my research at the Center for Population Dynamics at Cleveland State University showed that Greater Cleveland recouped the losses from earlier in the decade, gaining approximately 17,000 25- to 34-year-olds with a 4-year degree from 2006 to 2012—an increase of 23%.

    Moreover, the Census recently released data for 2013, which allows a comparison of the nation’s top big-city metros for 2011 to 2013: the current era of economic recovery. Put simply, what large metros have the momentum? Has there been a shift in where the “young and the restless” are attempting to settle down?

    The results are surprising. Cleveland ranks 3rd in the nation, with a 19.85% increase in the number of young adults with a college degree, behind the Sun Belt metros Nashville and Orlando. And no, this percentage “pop” for the region is not simply due to the fact that Cleveland had a really small base of young college graduates. In fact, the region’s 3-year gain of 15,557 ranks Cleveland 15th in total gains, despite being the 29th largest metro in the nation. To put this in perspective, Greater Cleveland had a larger total growth than Chicago, and nearly seven times the gain of Portland: the nation’s poster child for where the “young and restless” go to “live, work, play”.

    Table 1: 25-to-34-year-olds with at least a Bachelor’s degree, Change, 2011 to 2013
    Metro Area 2011 2013 % Change 2011 to 2013 Total Change 2011 to 2013
    Nashville-Davidson–Murfreesboro–Franklin, TN 82,588 103,239 25.01% 20,652
    Orlando-Kissimmee-Sanford, FL 83,706 101,066 20.74% 17,361
    Cleveland-Elyria, OH 78,392 93,949 19.85% 15,557
    Riverside-San Bernardino-Ontario, CA 97,804 116,767 19.39% 18,963
    Jacksonville, FL 47,792 56,256 17.71% 8,464
    Austin-Round Rock, TX 119,482 138,240 15.70% 18,758
    Seattle-Tacoma-Bellevue, WA 208,647 240,267 15.15% 31,620
    Sacramento–Roseville–Arden-Arcade, CA 77,075 87,435 13.44% 10,360
    Salt Lake City, UT 55,036 62,124 12.88% 7,088
    Pittsburgh, PA 117,402 131,770 12.24% 14,368
    Philadelphia-Camden-Wilmington, PA-NJ-DE-MD 306,271 341,220 11.41% 34,948
    Columbus, OH 106,144 118,224 11.38% 12,080
    Houston-The Woodlands-Sugar Land, TX 266,289 295,230 10.87% 28,941
    Buffalo-Cheektowaga-Niagara Falls, NY 52,231 57,727 10.52% 5,496
    Dallas-Fort Worth-Arlington, TX 296,927 327,330 10.24% 30,403
    New Orleans-Metairie, LA 54,104 59,616 10.19% 5,512
    San Jose-Sunnyvale-Santa Clara, CA 135,306 148,978 10.10% 13,672
    Detroit-Warren-Dearborn, MI 154,542 170,122 10.08% 15,580
    San Francisco-Oakland-Hayward, CA 320,585 350,490 9.33% 29,904
    Baltimore-Columbia-Towson, MD 150,003 163,941 9.29% 13,938
    New York-Newark-Jersey City, NY-NJ-PA 1,216,127 1,327,778 9.18% 111,651
    Los Angeles-Long Beach-Anaheim, CA 631,960 688,057 8.88% 56,098
    St. Louis, MO-IL 134,267 145,978 8.72% 11,710
    Oklahoma City, OK 58,027 63,084 8.71% 5,057
    San Antonio-New Braunfels, TX 85,240 92,524 8.55% 7,284
    Hartford-West Hartford-East Hartford, CT 59,780 64,784 8.37% 5,004
    Denver-Aurora-Lakewood, CO 163,026 176,237 8.10% 13,211
    Milwaukee-Waukesha-West Allis, WI 79,404 85,793 8.05% 6,390
    Louisville/Jefferson County, KY-IN 50,790 54,849 7.99% 4,060
    Virginia Beach-Norfolk-Newport News, VA-NC 67,664 72,888 7.72% 5,224
    Tampa-St. Petersburg-Clearwater, FL 99,316 106,504 7.24% 7,187
    San Diego-Carlsbad, CA 167,735 179,850 7.22% 12,114
    Birmingham-Hoover, AL 47,340 50,675 7.04% 3,335
    Kansas City, MO-KS 102,284 109,455 7.01% 7,171
    Rochester, NY 48,844 52,212 6.90% 3,368
    Boston-Cambridge-Newton, MA-NH 348,490 371,303 6.55% 22,813
    Phoenix-Mesa-Scottsdale, AZ 163,995 174,694 6.52% 10,699
    Providence-Warwick, RI-MA 64,205 68,349 6.45% 4,144
    Raleigh, NC 76,164 80,447 5.62% 4,283
    Indianapolis-Carmel-Anderson, IN 91,083 95,827 5.21% 4,744
    Las Vegas-Henderson-Paradise, NV 59,998 63,058 5.10% 3,060
    Cincinnati, OH-KY-IN 95,084 99,225 4.36% 4,142
    Minneapolis-St. Paul-Bloomington, MN-WI 214,755 223,640 4.14% 8,885
    Washington-Arlington-Alexandria, DC-VA-MD-WV 460,693 477,706 3.69% 17,013
    Chicago-Naperville-Elgin, IL-IN-WI 558,464 572,324 2.48% 13,860
    Atlanta-Sandy Springs-Roswell, GA 272,907 279,232 2.32% 6,325
    Portland-Vancouver-Hillsboro, OR-WA 119,490 121,794 1.93% 2,304
    Miami-Fort Lauderdale-West Palm Beach, FL 221,294 224,388 1.40% 3,094
    Richmond, VA 59,907 59,289 -1.03% -618
    Memphis, TN-MS-AR 52,911 49,412 -6.61% -3,499
    Source: ACS 1-Year, 2011, 2013 Note: Charlotte was removed from the analysis due to substantial geographic changes in the MSA designation from 2011 to 2013. Created by the Center for Population Dynamics at Cleveland State Univeristy, October, 2014. 


    What gives?

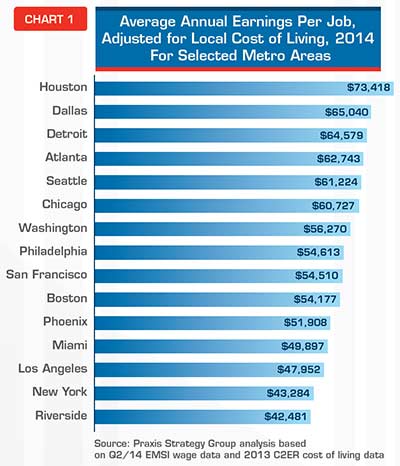
    Part of the answer may be economic. For example, my colleagues Joel Kotkin and Aaron Renn recently analyzed the growth in per capita GDP from 2010 to 2013 for Forbes in a piece entitled “The cities that are benefiting the most from the economic recovery”. Cleveland ranked 15th in the nation, with a 6% increase. In terms of income, the metro is 5th in the nation in the total per capita income increase from 2010 to 2012, behind Houston, San Jose, Oklahoma, and San Francisco.

    In understanding Cleveland’s nascent young adult brain gain, the broader economic performance is important. Healthier economies make metros “stickier” for those here and more of a magnet for those who aren’t. And while there also is the element of “Rust Belt Chic”, or the lure of so-called “authentic” places that counter the “Brooklynization” of American cities, Cleveland as a destination, or a “consumer city”, will always take a back seat to Cleveland as a “producer city”, which is a metro of good jobs, good schools, and affordable housing. The producer city focuses on the creation of value, not simply the consumption of things. This is not to say amenities, such as a good culinary and microbrew scene, are not important, it only says that if the talent you attract has nothing to produce or nowhere to live, well, all play and no work makes Jack a dull boy.

    Talent attraction, then, is only part of the formula in Cleveland’s ongoing and difficult economic restructuring. Talent production is also needed, for both natives and newcomers, regardless of the age group. But emphasizing the latter entails knowing the score on the former. Brain drain hysteria breeds desperation.

    And desperate times call for desperate measures—and bad policy.

    This piece first appeared at Crains Cleveland.

    Richey Piiparinen is a Clevelander, writer, and Senior Research Associate heading the Center for Population Dynamics at Cleveland State University.

  • RIP, NYC’s Middle Class: Why Families are Being Pushed Away From the City

    Mayor de Blasio has his work cut out for him if he really wants to end New York’s “tale of two cities.” Gotham has become the American capital of a national and even international trend toward greater income inequality and declining social mobility.

    There are things the new mayor can do to help, but the early signs aren’t promising that he will be able to reverse 30 years of the hollowing out of the city’s once vibrant middle class.

    As the cost of living has skyrocketed while pay has stagnated except for those at the very top, New York has shifted from a place people go to make it to a place for those who already have it made, or whose families have.

    And once here, the rich are indeed getting richer even as the rest of the city is barely holding on.

    Manhattan is now the most unequal county in America (it was 17th in 1980), with a Gini coefficient — which measures the disparity between the richest and poorest residents — higher than that of Apartheid-era South Africa.

    Between 1990 and 2010, the city’s 1% saw their median income shoot up from $452,415 to $716,625 in 2010 dollars, even as the bottom 60% hardly saw their incomes budge at all, according to a recent City University study. The trend precedes Michael Bloomberg, the billionaire mayor who envisioned New York as a “luxury city,” and it won’t be easy for de Blasio to reverse — especially as he rolls out pricey new public-employee contracts and programs like universal pre-K that further expand the city’s dependence on its wealthiest citizens.

    In 2009, the 0.5% of New Yorkers who made $1 million or more accounted for 27% of the city’s income (nearly three times their share nationally), and an even higher share of its tax take. But while the smart set that attends President Obama’s frequent Manhattan fundraisers has prospered, in no small part thanks to low-interest Federal Reserve policies that have helped big banks more than working people, just across the Harlem River roughly one in three Bronx households lives in poverty — making it the nation’s poorest urban county.Over the Bloomberg years, New York was the national leader in both luxury housing and in homelessness — with a 73% jump in the number of homeless families here. Last January, an unprecedented 21,000 children were in the city’s shelter system each night. This year, that number is rising.

    And as the city becomes more economically unequal, it’s also become more racially segregated. Demographer Daniel Herz’ census analysis shows New York is now America’s second most racially divided city, behind only Milwaukee.African-American incomes in New York are barely half those of whites, as compared to nearly 70% in Phoenix and Houston.

    And New York City now has the nation’s single most segregated public school system, according to a devastating report from the Civil Rights Project at UCLA.

    As the 2014 report put it: “In 2009, black and Latino students in the state had the highest concentration in intensely-segregated public schools (less than 10% white enrollment), the lowest exposure to white students, and the most uneven distribution with white students across schools.”

    Nowhere are these divergences more obvious than in nouveau hipster and increasingly expensive Brooklyn. In my parents’ native borough, the average income has actually dropped between 1999 and 2011, despite huge increases of wealth in areas closer to Manhattan.

    Roughly one in four Brooklynites — most of them black or Hispanic — lives in poverty.

    Bloomberg’s notion that if “we can find a bunch of billionaires around the world to move here, that would be a godsend,” with prosperity trickling down, hasn’t panned out, at least for most New Yorkers. The billionaires came, bought and flourished, but the same can not be said for Gotham’s middle and working classes.

    Using Bureau of Economic Analysis data, analyst Aaron Renn estimates that the city’s per capita GDP has grown a bare 2.3% since 2010, below the mediocre 3.8% national rate and behind such traditional hard-luck cases as Buffalo, Cleveland and Baltimore.

    The percentage of New Yorkers living in poverty has actually gone up by 1.1% since 2010, while household income has been flat.

    Rather than forge a more upwardly mobile society, New York epitomizes what Citigroup researchers have labeled a “plutonomy,” an economy and society driven largely by the investment behavior and spending of the uber-rich. This creates great demand for low-end service workers — dog-walkers, baristas and waiters — but not much for New York’s middle or aspiring middle class.

    Adjusting for the cost of living here, the average paycheck in New York is one of the lowest of any major metropolitan area. Put otherwise, working New Yorkers pay a huge premium to live in the five boroughs, one that repels middle-class individuals and families who aren’t compelled to be here.

    The exodus of the middle class has been ongoing for 30 years, with New York by one measure now having the second lowest share of middle-income neighborhoods of America’s 100 largest cities.As the middle class has waned, even exemplars of the celebrated creative class — musicians, artists, writers — find the going increasingly rough, and unrewarding. Laments rock icon Patti Smith: “New York has closed itself off to the young and the struggling. New York City has been taken away from you.”

    This is the dynamic New Yorkers elected de Blasio to fix. And he’s right the reality of rising inequality and, more important, diminishing opportunity, must be confronted.

    Critically — and here de Blasio has better instincts than his predecessor — more emphasis needs to be placed on the outer boroughs. Even if Manhattan remains the prototypical luxury city, the rest of New York can be reinvented as a generator of middle-class jobs and opportunities.

    One approach that’s paid dividends for workers in cities such as Houston, Dallas-Ft. Worth, Nashville and Pittsburgh is to concentrate on diversified economic growth.

    Certainly some middle class jobs could be created by boosting such things as the port and logistics, resuscitating industries such as food processing and specialized household goods, and rolling out policies that encourage, rather than overregulate, smaller firms in the business-service industry.

    But de Blasio’s press to bring in more tax revenue to pay for ambitious new programs, more generous social services and new contracts for city workers have the perverse effect of doubling down on Bloomberg’s bet on the wealthy.

    His ambitious ramping up of green-energy policy could be the straw that breaks the back of what remains of the logistics and manufacturing industries in New York, something that has already occurred in California.

    And his kowtowing to the teachers union and attempted assaults on charter schools threaten to further undermine the effectiveness of public education, something vital to middle and working class residents.

    In fact, the effect of de Blasio’s policies may turn out to be more neo-Victorian than progressive. Rather than new homeowners, the city may see a greater concentration of people dependent on government largesse.

    The poor-door phenomena, with a few lucky members of the lower class winning subsidized units in buildings for the rich, but with separate entrances and no access to luxury amenities, recreates not social democracy but the Victorian upstairs-downstairs society.

    The critical point is this: New York is losing its role as a place of opportunity, and the de Blasio toolbox is unlikely to put back the ladder that’s been pulled up.

    A great city does not only serve the rich, transforming others into their servants or recipients of noblesse oblige. New York need to be, as Rene Descartes described Gotham’s founding city, 17th century Amsterdam, “an inventory of the possible.”

    That must hold true for most New Yorkers, not just for the very rich.

    This piece first appeared at the New York Daily News.

    Joel Kotkin is executive editor of NewGeography.com and Roger Hobbs Distinguished Fellow in Urban Studies at Chapman University, and a member of the editorial board of the Orange County Register. His newest book, The New Class Conflict is now available at Amazon and Telos Press. He is author of The City: A Global History and The Next Hundred Million: America in 2050. His most recent study, The Rise of Postfamilialism, has been widely discussed and distributed internationally. He lives in Los Angeles, CA.

    Photo by Kevin Case from Bronx, NY, USA (Bill de Blasio) [CC-BY-2.0], via Wikimedia Commons

  • The Decline of the Midwest, the Rise of the South

    The New York Times ran an article recently that’s nominally about football, but really gives insight into the decline of the Midwest and the rise of the South. Called “As Big Ten Declines, Homegrown Talent Flees,” this piece ties in perfectly with my recent essay on the differing social states of the Midwest and South. The NYT’s money quote says it all:


    The SEC sold excellence. The Big Ten sold tradition.

    Ironically, it is the formerly stigmatized “backwoods” South that has embraced excellence while the former industrial champion of the Midwest has spurned it. I don’t think that Midwesterners understand how much things have changed in the South. I hear the same stereotypical view of the South that might have had a lot of truth decades ago but have changes substantially. For example, those who think it is both a good thing and bad have quipped that Indiana is like an extension of the South into the Midwest. I don’t think so.

    For example, Charlotte built a light rail system. Dallas has poured a billion dollars into a downtown arts district. Atlanta has a multi-billion infill strategy around its former Belt Line railroad. Nashville eliminated downtown parking minimums and implemented a form based code. South Carolina has its German style apprenticeship program. North Carolina built Research Triangle Park – in 1959. Southern cities like Atlanta have proudly claimed and built success around their black heritage. And Charlotte’s Chamber of Commerce CEO said, “To understand Charlotte, you have to understand our ambition. We have a serious chip on our shoulder. We don’t want to be No. 2 to anybody.” Outside of Chicago, does anybody in the Midwest talk like that?

    Sure, there are bits and pieces here and there in the Midwest that speak to excellence. But they are the anomalies in a region that has retrogressed. Whereas in the South they’ve massively elevated their game in the last 40 years and are working hard to keep getting better. Sure, low costs and taxes play a role in their success. Climate and the universality of air conditioning as well. But they aren’t content to rest on just that. They want to get better. Meanwhile the Midwest is regressing towards what the South used to be such as, for example, by turning paved roads back to gravel because they can’t afford the maintenance.

    The NYT piece brings up an interesting factor driving the rise of the SEC vs. the Big Ten, namely the shift in underlying population ratios over time: “An instructive comparison is Michigan and Georgia. In 1960, Michigan had twice Georgia’s population; in 1990, it was nearly one and a half times as big; today, their populations are roughly equivalent.”

    The decline in Midwest population and economic heft brings with it a price that has to be paid. It’s showing up in the football world today. But it’s sure to hit the academic prowess of the Midwest’s major state schools as well. How long can these places maintain their relative rankings of excellence without the financial firepower to play in the big leagues? There’s more inertia on the academic side, but don’t think it won’t eventually happen here as well. The same is true in many other aspects of civic life. Even mighty Chicago has nearly bankrupted itself in its efforts to keep up with other global cities.

    The Big Ten obviously saw the writing on the wall and decided to expand outside the region. I dislike this for reasons of, naturally, tradition. But it’s a rational response to a declining marketplace. Similarly, the Cleveland Orchestra established a Miami residency in the pursuit of cash to keep its artistic excellence intact. Might some of these institutions at some point become Midwest in name only? Time will tell.

    Not everyone agrees with the idea that the SEC vs. Big 10 comparison is a relavent proxy, basically saying that it’s ludicrous to say that football proves anything. I don’t think that it does. But I will make three points:

    1. The differing fortunes of the two conference is yet another in an extremely long series of data points and episodes that demonstrate a shift in demographic, economic, and cultural vitality to the South.
    2. Sports is one of the many areas in which Midwestern states have clung to traditional approaches, even though those approaches haven’t been producing results.
    3. Demographic and economic changes have consequences. It’s not realistic to expect that the Midwest’s excellent institutions will necessarily be able to retain excellence when supported by hollowed out economies.

    I’d like to throw up a couple of charts to illustrate the longer term trends at work. The first is a comparison of per capita personal income as a percent of the US average for Illinois vs. Georgia since 1950:


    il-vs-ga

    Here’s the same chart of Ohio vs. North Carolina:


    oh-vs-nc

    If I put up the population or job numbers, the same charts would show the South mutilating the Midwest. (Indiana, Georgia, and North Carolina were all about the same population in 1980, but the latter two have skyrocketed ahead since then for example). What’s more, the South’s major metros score better on diversity and attracting immigrants than the Midwest’s major metros as a general rule.

    These charts show the convergence in incomes over time. The decline in relative income of the Midwest is possibly in part to increases elsewhere, not internal dynamics. But think about what the Midwest looked like in 1950, 60, or 70 vs the South, then think about it today and it’s night and day. The Midwest may still be endowed with better educational and cultural institutions than the South, but we can see where the trends are going. Keep in mind that those things are lagging indicators. Chicago didn’t get classy until after it got rich, for example.

    Now we see that Southern income performance hasn’t been great since the mid to late 90s. This is a problem for them. As is their dependence on growth itself in their communities. I won’t claim that the South is trouble free or will necessarily thrive over the long haul. But they seem to have a clearer sense of identity, where they want to go, and what their deficiencies are than most Midwestern places.

    Richard Longworth seems to buy the decline theory but has a different explanation of the source, namely that Chicago has sucked the life out of other Midwestern states:

    In the global economy, sheer size is a great big magnet, drawing in the resources and people from the surrounding region. We see this in the exploding cities of China, India and South America. We see it in Europe, where London booms while the rest of England slowly rots.

    And we see it in the Midwest where, as the urbanologist Richard Florida has written, Chicago has simply sucked the life – the finance, the business services, the investment, especially the best young people – out of the rest of the Midwest.

    To any young person in Nashville or Charlotte, the home town offers plenty of opportunities for work and a good life. To any young person stuck in post-industrial Cleveland or Detroit, it’s only logical to decamp to Chicago, rather than to stay home and try to build something in the wreckage of a vanished economy.

    This seems to be a common view (see another example), even in the places that would be on the victim side of the equation. But I’ve never seen strong data that suggests this is actually the case. Are college grads and young people getting sucked out of the rest of the Midwest into Chicago?

    Thanks to the Census Bureau, we now have a view, albeit limited, into this. The American Community Survey releases county to county migration patterns off of their five year surveys sliced by attribute. There seems to be some statistical noise in these, and for various reasons I can’t track state to metro migrations, but thanks to my Telestrian tool, I was able to aggregate this to at least get metro to metro migration. So here is a map of migration of adults with college degrees for the Chicago metro area from the 2007-2011 ACS:


    degree-migration
    Net migration of adults 25+ with a bachelors degree or higher with the Chicago metropolitan area. Source: 2007-2011 ACS county to county migration data with aggregation and mapping by Telestrian

    This looks like a mixed bag to me, not a hoover operation. What about the “young and restless”? Here’s a similar map of people aged 18-34:


    ya-migration
    Net migration of 18-34yos with the Chicago metropolitan area. Source: 2006-2010 ACS county to county migration data with aggregation and mapping by Telestrian

    This is an absolute blowout, with a massive amount of red on the map showing areas to which Chicago is actually losing young adults. Honestly, this only makes sense given the well known headline negative domestic migration numbers for Chicago.

    I do find it interesting that there’s a strong draw from Michigan. Clearly Michigan has taken a decade plus long beating. There’s been strong net out-migration from Michigan to many other Midwestern cities during that time frame, and its the same in Cleveland, which also took an economic beating in the last decade. This is just an impression so I don’t want to overstate, but it seems to me that a disproportionate number of the stories about brain drain to Chicago give examples from Michigan. Longworth uses the examples of Detroit and Cleveland. These would appear to be the places where the argument has been truly legitimate, but that doesn’t mean you can extrapolate generally from there.

    What’s more, even if a young person with a college degree does move to Chicago from somewhere else, will they stay there long term? They may circulate out back to where they came from or somewhere else after absorbing skills and experience. It’s the same with New York, DC, SF, etc. I’ve said these places should be viewed as human capital refineries, much like universities. That’s not a bad thing at all. In fact, it’s a big plus for everybody all around. Chicago is doing fine there. But it’s a more complex talent dynamic than is generally presented, a presentation that does not seem to be backed up by the data in any case.

    Aaron M. Renn is an independent writer on urban affairs and the founder of Telestrian, a data analysis and mapping tool. He writes at The Urbanophile, where this piece originally appeared.

    Photo courtesy of BigStockPhoto.com.

  • A Newer Geography of Jobs: Where Workers with Advanced Degrees Are Concentrating the Fastest

    This is a new report brief from the Center for Population Dynamics at Cleveland State University, download the pdf version here. The report was authored by Richey Piiparinen, Jim Russell, and Charlie Post.

    In 1963, nearly 75% of America’s top 50 companies owned and extracted natural resources1. By 2013, only 20% of top firms were natural resource-based. Today, knowledge-focused industries such as IBM comprise over 50% of America’s top 50 firms. Translation: talent is the new oil.

    But not every region has reservoirs of human capital. Historically, knowledge economies have gathered in select top-tier metros, termed “Islands of Innovation”2. Think Boston and San Francisco. There are numerous reasons for this, including access to select research institutions, as well as the productivity effects that arise when a cluster economy is formed3.

    For scholars such as economist Enrico Moretti, this “Great Divergence”4 between “the best” and “the rest” will continue. “More than traditional industries,” writes Moretti in his book The New Geography of Jobs, “the knowledge economy has an inherent tendency toward geographical agglomeration.”

    But is this trend inevitable? Will the divergence remain? One line of thought is that the cost of living in top-tier metros will inevitably lead to “capital equalization”5—loosely defined as the “convergence” between regions in job and income growth. Capital equalization was a key factor in the decline of the Rust Belt. Here, manufacturing jobs became automated or moved down South or overseas to cut labor costs. One could argue that capital equalization will re-map the geographies of the knowledge economy in a similar manner.

    “The prediction of this view is the convergence of American communities,” writes Moretti. “Low-cost areas will attract more and more of the new, high-paying jobs. Cities that have been lagging behind-the Clevelands, the Topekas, and the Mobiles-will grow much faster. Bogged down by their high costs, San Francisco, New York, Seattle, and similar cities will decline.” That said, Moretti does not believe convergence is taking shape. “[T]he data don’t support this view,” Moretti continues. “In fact, the opposite has been happening.”

    But there is data that do support this view, and it begins to sketch a newer geography of jobs that is enabling an increasing concentration of highly-skilled workers in America’s second-tier cities. AOL Co- Founder Steve Case has dubbed this convergence back into Middle America “the Rise of the Rest”6.

    Where are America’s Highest-Skilled Jobs Clustering?

    The most common measure of human capital is educational attainment, or the percent of a population  with a college degree. Not all human capital is equal. Generally speaking, the higher the degree conferred, the more productive the worker, and this is reflected in pay. For example, the national median income by education level is as follows: $27,350 for a high school graduate, $50,050 for a person with a 4-year degree, and $65,565 for a person with an advanced degree7. The fact that those with a graduate or professional degree are paid highest is indicative of their productive capacity in the knowledge economy.

    Specifically, a region’s highest-educated workers are likely to be job creators, not just job consumers. This primarily comes about two ways: (1) through direct job creation, such as a research doctor starting a biotech spin-off firm; and (2) through indirect job creation, particularly relating to the “downstream” effect a high- paying job has on the local service economy. Put simply, more income, more spending, equals more jobs.

    What metros are experiencing the fastest growth in its concentrationof workers with advanced or professional degrees? To answer this, the analysis used data from the Current Population Survey (CPS) to compare the educational attainment rates of the nation’s largest laborforcesfrom 2005 to 2013. Of particular concern was the percentage of people in a regional labor force with an advanced or professional degree, and whether or not top-tier metros gained higher- skilled workers at a faster rate than second-tier metros. Here, the rate was calculated as the percent point change between a region’s 2013 educational attainment rate and its 2005 educational attainment rate for workers with an advanced degree.

    Table 1 shows the results. In line with the Great Divergence, Washington, D.C. and San Francisco are experiencing the 1st and 4th fastest rates of change in the employment of high- skilled workers, respectively. However, three of the top five fastest-growth metros are second tier: Providence, Indianapolis, and Cleveland— each with over a 5% percent point change. While these metros cannot match the top-tier metros in the number of advanced degree jobs gained— e.g., Cleveland gained nearly 44,000 grad-level jobs compared to 157,000 for San Francisco— the data nonetheless speak to a number of second-tier metros converging, or “moving up”, into the knowledge economy hierarchy.

    Table 1 Percentage of Workers with Advanced Degree, 2005 Percentage of Workers with Advanced Degree, 2013 Percent Point Change
    Source: CPS 2005, 2013
     
    Washington, DC 21.58% 27.48% 5.90%
    Providence 10.71% 16.30% 5.59%
    Indianapolis 11.63% 17.08% 5.45%
    San Francisco 17.49% 22.88% 5.39%
    Cleveland 11.68% 17.00% 5.32%
    Kansas City 10.88% 15.49% 4.61%
    Jacksonville 7.54% 12.07% 4.52%
    San Antonio 8.52% 12.32% 3.80%
    Denver 12.75% 16.54% 3.78%
    Sacramento, CA 9.07% 12.78% 3.72%
    Detroit 12.66% 16.26% 3.60%
    Minneapolis 12.30% 15.55% 3.25%
    Riverside, CA 5.08% 8.09% 3.01%
    Pittsburgh, PA 13.66% 16.57% 2.91%
    Chicago 14.70% 17.55% 2.84%
    Philadelphia 13.52% 16.22% 2.70%
    Charlotte 7.62% 10.14% 2.52%
    Orlando 9.28% 11.73% 2.45%
    Boston 21.03% 23.41% 2.37%
    Seattle 15.34% 17.71% 2.36%
    Phoenix 10.19% 12.50% 2.31%
    Milwaukee 12.32% 13.87% 1.55%
    Las Vegas 7.08% 8.56% 1.48%
    Portland 13.52% 14.98% 1.46%
    New York 17.14% 18.56% 1.42%
    Columbus, OH 12.95% 14.35% 1.40%
    St. Louis 11.91% 13.20% 1.29%
    Dallas 10.89% 12.16% 1.28%
    Baltimore 17.12% 18.28% 1.17%
    Virginia Beach 9.62% 10.57% 0.96%
    Houston 9.65% 10.60% 0.95%
    Miami 10.83% 11.68% 0.85%
    San Diego 14.27% 15.03% 0.75%
    Los Angeles 11.65% 12.38% 0.73%
    San Jose 23.33% 23.52% 0.20%
    Nashville 12.02% 11.70% -0.32%
    Atlanta 14.08% 13.36% -0.72%
    Cincinnati 10.23% 9.22% -1.01%
    Tampa 11.30% 10.05% -1.25%
    Austin 17.92% 16.35% -1.57%


    To further illustrate this point, rankings were calculated to show the metros with the highest concentration of advanced-degreed workers in the labor force for 2005 and 2013. Change rankings were then calculated to determine just how far converging metros like Cleveland and Indianapolis were rising in the knowledge economy hierarchy. Figure 1 displays the results. Notice the top of the rankings are comprised of traditional top-tier metros. Also, the change in these metro rankings from 2005 showed no variance (ranging from -1 to +1), indicating little “wiggle room” in the top echelon from 2005 to 2013. The exception, here, was Austin, which dropped 9 spots to 13th. Moreover, two metros—Indianapolis and Cleveland—moved up from the middle of the pack to rank 9th and 10th, respectively. Providence also made a large leap: from 29th in 2005 to 14th in 2013. These figures indicate there is a notable economic restructuring occurring in Indianapolis, Cleveland, and Providence that is perhaps forming a next generation of innovation nodes.

    Now, in the case of Cleveland, do the results mean the gritty Rust Belt metro is experiencing robust job growth? Not exactly. From 2005 to 2013, 78% of the nearly 54,782 jobs added for college graduates in Greater Cleveland were for those with advanced degrees—meaning job growth for people with only a bachelor’s degree was sluggish at best. What’s more, job losses for Greater Clevelanders without college degrees was substantial: a decline over 83,000 jobs from 2005 to 2013. In other words, while the region’s highest-skilled workforce is converging into the ranks of the national elite, the effect has yet to be found “downstream” in direct or indirect job creation.

    This is not unexpected. Specifically, economic restructuring, particularly for manufacturing-based regions, is a process, and a working theory for the Center for Population Dynamics is that a concentration of advanced-degree workers is an important leading indicator to more widespread growth8. As this line of inquiry evolves, an eventual step is to set up a policy framework so that the region’s growing concentration of high-skilled workers can be strategically catalyzed to lead to broader economic opportunities, rather than missed opportunities. The Center for Population Dynamics is currently constructing a working policy paper that will help drive this effort.

    This is a new report brief from the Center for Population Dynamics at Cleveland State University, download the pdf version here. The report was authored by Richey Piiparinen, Jim Russell, and Charlie Post.

    2 Hilpert, Ulrich. Archipelago Europe: islands of innovation: synthesis report. FAST, Commission of the European Communities, 1992.

    3 Porter, Michael E. "Location, competition, and economic development: Local clusters in a global economy." Economic development quarterly 14.1 (2000): 15-34.

    4 Moretti, Enrico. The new geography of jobs. Houghton Mifflin Harcourt, 2012.

    7 Source: American Community Survey 1-Year Estimates, 2013

    8 See: http://engagedscholarship.csuohio.edu/urban_facpub/1177/

  • Metropolitan Populations from 1900 Posted (Current Geographies)

    We have posted population data for the nation’s major metropolitan areas for censuses from 1900 to 2010 and as estimated in 2013. These data are use the current (2013) boundaries to define metropolitan areas. There is no consistent list historical listing of metropolitan area populations using the commuting criteria that define the 2010 and 2013 metropolitan areas. Thus, in using the data in this new report, caution should be employed.

  • How Segregated Is New York City?

    The online reaction to the reports on racial segregation in New York state’s public schools reminded me, yet again, that most people think of New York as an integrated city, and are surprised or incredulous when that impression is contradicted.

    This is somewhat jarring, since virtually every attempt to actually measure racial segregation suggests that New York is one of the most segregated cities in the country. This University of Michigan analysis of 2010 Census data, for example, suggests that New York is the second-most-segregated metropolitan area in the U.S., exceeded only by Milwaukee, and that about 78% of white and black people would have to move in order to achieve perfect integration. (Chicago’s corresponding number is just over 76%, good enough for third place.)

    Why is this so surprising? One obvious reason, I think, is that most people’s conception of New York is limited to about 1/2 of Manhattan and maybe 1/6 of Brooklyn, areas that are among the largest job and tourist centers in the world. As a result, they attract people of all different ethnic backgrounds, especially during the day, even if the people who actually live in those areas tend to be monochromatic. Imagine, in other words, trying to judge racial segregation in Chicago by walking around the Loop and adjacent areas: you would probably conclude that you were in a pretty integrated city.

    But it goes beyond that, I think. Segregation in New York doesn’t look like segregation in Chicago, or a lot of smaller Rust Belt cities. For one, there just aren’t very many monolithically black neighborhoods left in New York. Here, for example, I’ve highlighted every neighborhood that’s at least 90% African American (see note on method at the bottom of this piece):


    NYB90

    Were we to do this in Chicago, half the South and West Sides would be lit up. But in New York, black neighborhoods have become significantly mixed, in particular with people of Hispanic descent. This is a phenomenon Chicagoans are used to in formerly all-white communities – places like Jefferson Park or Bridgeport, which as recently as 1980 were overwhelmingly white, now have very large Latino and Asian populations – but in New York, it’s happened in both white and black neighborhoods.

    That said, white folks in New York have still on the whole declined to move to black areas, except for some nibbling along the edges in Harlem and central Brooklyn. That means that instead of measuring segregation the way we might in Chicago – by looking for very high concentrations of a single ethnic group – it makes more sense to look for the absence of either white or black people.

    Here, then, I’ve highlighted all the places where white people make up less than 10% of the population:


    NYW10

    It’s a lot. And, correspondingly, here are all the places where black people make up less than 10% of the population:


    NYB10

    It’s also a lot. And if we put the two maps together, we see that these two categories cover the overwhelming majority of NYC:


    NY10

    The same pattern holds pretty well if we lower the threshold to no more than 5% white or black:


    NY5

    And there are even a significant number of areas that are truly hypersegregated, with fewer than 2% of residents being either white or black:


    NY2

    Because I now love GIFs, here’s a summary GIF.


    NYSeg

    What does all this tell us? For one, it confirms graphically what the Census numbers suggested, which is that the median black New Yorker lives in a neighborhood with very few white people, and vice versa.

    But it also suggests a racial landscape that looks different from that of Chicago, and lots of other American cities, in important ways. In particular, where Chicago has a relatively simple racial geography – white neighborhoods at various levels of integration with Hispanics and Asians to the north and northwest, black and Hispanic neighborhoods to the south and west, with only a few small islands like Hyde Park and Bridgeport that break the pattern – New York’s segregated neighborhoods form a more complex patchwork across the city. That means that while a North Sider in Chicago might go years without having to even pass through a black neighborhood, lots of white New Yorkers have to get through the non-white parts of Brooklyn or the Bronx to reach job and entertainment districts in Manhattan or northern Brooklyn.

    I imagine that structural-geographic fact, combined with New York’s relatively high level of black-Hispanic integration, goes a long way to explaining my anecdotal experience that white New Yorkers tend to be less ignorant and scared of their city’s non-white neighborhoods than white Chicagoans are of Chicago’s. (There’s some interesting research that suggests white people tend to be more sympathetic to brown people, and their neighborhoods, than black people and theirs.) There’s also, of course, the fact that Chicago’s segregated non-white neighborhoods tend to have much higher violent crime rates, and much more modest business districts, than New York’s, although that’s likely both an effect and cause of their relative isolation.

    All of this is another reason that I’m kind of excited about the growing entertainment and shopping district on 53rd St. in Hyde Park, since the more that the South Side has “neighborhood downtown” strips that draw people from across the city, the more likely North Siders and suburbanites are to travel through the black and Latino neighborhoods that surround them, observe that many of them are actually quite nice, become less committed to shunning them, and thus contribute less to the social and economic dynamics that have created the institution of the ghetto, and the poor job prospects, failing schools, and high crime rates that accompany it.

    In conclusion: New York is super segregated, but the numbers aren’t everything.

    Also, let me have another Talk To Me Like I’m Stupid moment: suggestions for books about the racial history of New York? What’s the equivalent of Making the Second Ghetto or Family Properties? I’ve already read Caro’s Moses book.

    Note:  This piece focuses on white-black segregation because that, for various social and historical reasons, has been by far the most significant geographic separation in American cities, certainly in the Midwest and Northeast. But by far the second most significant separation – white-Latino segregation – is also very extreme in New York. The same Census analysis that found NYC was the second-most-segregated metro area in terms of white and black people found that it was the third-most-segregated metro area in terms of white and Latino people. That’s obviously not the end of the story either, though. If you know about or are curious about some other aspect of segregation, leave a comment.

    Daniel Hertz is a masters student at the Harris School of Public Policy at the University of Chicago. This post originally appeared in City Notes on April 14, 2014.

    Photo by Mike Lee

  • The Unrest In Hong Kong And China’s Bigger Urban Crisis

    The current protests in Hong Kong for democracy reflects only part of the issues facing Chinese cities, as they grow and become ever more sophisticated. In just four decades, China has gone from 17.4 percent to 55.6 percent urban, adding nearly 600 million city residents. And this process is far from over: United Nations projections indicate that over the next 20 years, China’s urban population will increase by 250 million, even as national population growth rates slow and stall.

    Overall this transition has been spectacularly successful. As it has urbanized, China, following the lead of Hong Kong, has become a much richer country, expanding its share of global GDP from 2 percent in 1995 to 12 percent in 2012.

    China now boasts four megacities of over 10 million people, the most of any country. The population of Shanghai, a cosmopolitan world city decades before the Communist takeover of the country, has expanded almost 50% since 2000, and the ancient capital Beijing and the southern commerce and industrial hub of Guangzhou have grown nearly as rapidly. The U.N.’s growth projections suggest that the future list of megacities will include Chongqing, Tianjin and Chengdu.

    Shenzhen, one of the four current megacities, epitomizes the speed of China’s urbanization. A small fishing village along the Hong Kong border with a few factories when I first visited three decades ago, the city rose as the focus of Deng Xiaoping’s first wave of modernization policies. In 1979 it had roughly 30,000 people; now it is a thriving metropolis of 13 million whose population in the past decade grew 56%. Its rise has been so recent and quick that the Asia Society has labeled it “a city without a history.”

    Shenzhen has not only grown but thrived over the past three decades, as was evident on my most recent trip. In contrast to the often impoverished slum cities of the developing world, China’s cities have grown much as Britain’s did in the 19th century, upon the back of rapid expansion of manufacturing and trade. This sets Chinese urbanization apart from India‘s; manufacturing’s share of Indian GDP is half that of China. In the process, Chinese cities have become more tied to the global economy, exposing its people to international trends, as well as greater affluence. This is exactly what has happened earlier in Hong Kong, setting the stage for some of the recent unrest. At the same time, the leading cities of the West are, for the most part, barely growing, and much of that by dint of immigration. With plunging birthrates and generally anemic economies, the great cities of the Europe and North America are hardly likely to blaze a brash urban trail; they are more concerned with retaining what they can from their historical inertia. There is no city in the West — even Houston and Dallas-Fort Worth — that approaches the dynamism one now finds in China.

    The Coming Chinese Urban Economic Crisis

    China’s successful urban transformation now faces a challenge as the country’s export-led economy weakens. Labor costs are soaring and young adults, some four times as many of whom have attended college than those who came of age a decade ago, have little interest in factory work. At the same time, many of China’s most successful and talented people are seeking out lives abroad; two-thirds of the country’s affluent residents, according to one survey, are considering migrating overseas.

    The labor crunch is most intense in China’s coastal cities, home to most of the urban population. These face greater competition from less expensive urban areas further west, such as Chongqing and Chengdu. But even these areas are facing a labor shortage, forcing companies to fill their ranks with not necessarily voluntary student laborers. There is also growing competition as well in labor-intensive industries like textiles from cheaper cities in places like Vietnam, Indonesia and Bangladesh.

    Recent attacks by Beijing on multinationals, charging them for corruption and anti-trust violations, could make things worse. For political reasons, the government has decided to persecute the very companies that account for half of Chinese exports, charging corruption and anti-trust violation. China, where ironically the public is more favorable than most Westerners to large corporations, now faces an investment downturn as foreign companies look for safer havens such as in Mexico or to come back to the U.S.

    The logical solution to this challenge, particularly for coastal Chinese cities, is to move up the value chain, much as Hong Kong and Singapore have already done. This means a greater reliance on finance, business services and technology. Shenzhen, for example, looks to Silicon Valley as a role model. But their attempt is taking place in an urban environment very different than that nurtured in California suburban garages. Instead we see typically immense infrastructure projects like the 15 square kilometer Qianhai development near the city’s main port. Qianhai hopes to lure service and tech employment from pricier, and for now, more unstable Hong Kong.

    But in many cases, high-value industries depend on open access to information, something Beijing clearly sees as a threat to the political order; China’s great Internet Firewall is getting, if anything, higher and more difficult to breach, to the detriment of local knowledge workers. Government authorities realize that Hong Kongers’ access to western media, movies and culture makes them less pliable than those, even in neighboring Shenzhen, where access to major foreign publications, Google and many websites is highly restricted.

    Health And Demographics

    China is not only urbanizing, but doing it at extreme levels of density; barely four to six percent of all new floor space in the country goes to single-family houses. Even on the suburban periphery, there are few low-rise apartment buildings and even fewer houses; much of the construction, particularly for rural migrants, is also substandard, with buildings erected so close that sometimes residents of one can shake the hands of those next to it.

    This has created a series of health problems. Dense urbanization, notes a recent Chinese study, has led to more obesity, particularly among the young, who get less exercise, and spend more time desk-bound. Stroke and heart disease have become leading causes of death.

    Perhaps the best known result from intensified urbanization can be seen outside any window: pervasive air pollution. Beijing and Shanghai rank among the most polluted major cities in the world, just behind Delhi. This problem has become so severe that it has led, even in authoritarian China, to grass-roots protests, many of them targeted at new industrial plants and other facilities near cities such as Shanghai, Dalian, and Hangzhou.

    More serious still has been the impact on birth rates. Even though the government has been relaxing its long-held “one child” policy, the density of Chinese cities continues to help suppress birthrates. This relationship between density and low fertility can also be seen in similarly crowded Singapore, Taiwan and Hong Kong, where there is no official limit on having more than one child. In Hong Kong some 45% of middle-class couples have abandoned the idea of having children, not surprising since the cost of raising a child is now estimated at over $700,000, more than twice than in the United States.

    Given high prices relative to incomes, and dense conditions, Chinese cities appear to follow the same pattern, which over time is almost certain to slow economic growth as the population of elderly grows and the workforce shrinks. Already, notes National University of Singapore demographer Gavin Jones, the fertility rate of women in Shanghai has fallen to 0.7, among the lowest ever reported, well below the “one child” mandate and barely one-third the number required simply to replace the current population. Overall, the Chinese urban fertility rate is a weak 1.08.

    The Future

    Rather than look at the current unrest in Hong Kong as a singular example, we should understand that many problems faced in the former British colony are increasingly felt as well in mainland China. As cities reach middle class status and land prices soar, they need to move up the value scale, but this is very difficult to do under a fundamentally authoritarian system.

    While authoritarian structures can work in an industrial city, they may be less effective in a more information-based economy, in which companies need to adjust to rapidly changing attitudes and trends. The problem here is that, in an authoritarian state, controls over information are often deemed mandatory; in a sense, in an information-dependent economy, this is like trying to run a car with watered down gasoline. At the same time, the health effects of dense urbanism, and the massive pollution of the surrounding countryside, augur poorly for many of the largest Chinese cities, which will be forced to compete not only with more open economies, but with lower-cost cities across the developing world.

    Ultimately, China, whose urban growth has been a great success story, now must consider changing development patterns, perhaps looking at lower density and more dispersed development. One promising sign is that China’s smaller cities, particularly in the West, are now growing faster — with encouragement from Beijing authorities — than megacities. Recently released 2014 population estimates indicate reductions in the annual growth rates of both Shanghai and Beijing.

    Ultimately, a shift towards dispersion — both within regions and between them — could have a many positive effects. It would allow people more living space, and if employment also was also spread out, a quicker and less rigorous commute, with related benefits gained in time and energy conservation. It would greatly help families and children by reducing the need for parents to migrate for work, separating as many as one in five Chinese families.

    Clearly, new models are clearly called for, ones that look not only at bulking up cities, but humanizing them. This may be imperative if Beijing would like to avoid the prospect of a future characterized by an aging, alienated and increasingly unhealthy population.

    This piece first appeared at Forbes.

    Joel Kotkin is executive editor of NewGeography.com and Roger Hobbs Distinguished Fellow in Urban Studies at Chapman University, and a member of the editorial board of the Orange County Register. His newest book, The New Class Conflict is now available at Amazon and Telos Press. He is author of The City: A Global History and The Next Hundred Million: America in 2050. His most recent study, The Rise of Postfamilialism, has been widely discussed and distributed internationally. He lives in Los Angeles, CA.

    Photo by Pasu Au Yeung.

  • Opportunity Urbanism: Creating Cities for Upward Mobility

    This is the introduction to a new report commissioned by the Greater Houston Parnership and HRG and authored by Joel Kotkin with help from Tory Gattis, Wendell Cox, and Mark Schill. Download the full report (pdf) here.

    Over the past decade, we have witnessed the emergence of a new urban paradigm that both maximizes growth and provides greater upward mobility. We call this opportunity urbanism, an approach that focuses largely on providing the best policy environment for both businesses and individuals to pursue their aspirations.

    Although contrary to much of the conventional wisdom about cities and regions, this is not a break with traditional urbanism, but instead a reinforcement of old traditions. Long ago, Aristotle reminded us that the city was a place where people came to live, and they remained there in order to live better. “A city comes into being for the sake of life, but exists for the sake of living well.”  In the end, opportunity urbanism rests on the notion that cities serve, first and foremost, as engines to create better lives for its residents.

    The Houston and Luxury Models

    We have focused on the Houston metropolitan area because in many ways it reflects the idea of opportunity urbanism more closely than any major metropolitan area. Across a broad spectrum—income growth, new jobs, housing starts, population growth and migration—no other major metropolitan region in the country has performed as well over the past decade. This was among the first major metropolitan regions to replace the jobs lost in the recession, and has experienced by far the largest percentage job growth since, with Dallas-Ft. Worth second.

    In many ways, opportunity urbanism contrasts with the prevailing urban planning paradigm—variously called new urbanism or smart growth—which seeks to replicate the dense, highly concentrated mono-centric city of the past. At the core of this approach is the notion that policies of forced density, through regulatory mandates and often subsidies, are critical to attracting both young, educated people and the global business elite.4 This approach describes the successful city, in the words of former New York Mayor Michael Bloomberg, as “a luxury product.”

    This notion of the “luxury city” can be seen to have worked, at least for some, in well-appointed older cities such as New York, San Francisco and Boston. Unlike most American cities, these boast long-established dense cores and transit-oriented commuter sheds. They possess great amenities tied to their past, from world class art museums and universities, to charming historic districts, parks and public structures.

    But this model of urbanism does not fit the profile of most American metropolitan regions, which tend to be far more recent in their development, more dispersed and overwhelmingly auto-dominated in terms of commuting. Indeed, most of the fastest growing regions in this country—Houston, Dallas-Ft. Worth, Oklahoma City or Atlanta—function in a highly multi-polar model, that contrasts sharply with that of cities like New York, Boston or Chicago.

    Prospects for Upward Mobility

    The luxury paradigm has worked for some in some cities, but has failed, to a large extent, in providing ample opportunities for the middle and working classes, much less the poor. Indeed, many of the cities most closely identified with luxury urbanism tend to suffer the most extreme disparities of both class and race.

    If Manhattan were a country, it would rank sixth highest in income inequality in the world out of more than 130 countries for which the World Bank reports data. New York’s wealthiest one percent earn a third of the entire municipality’s personal income-almost twice the proportion for the rest of the country.

    Indeed, increasingly, New York, as well as San Francisco, London, Paris and other cities where cost of living has skyrocketed—are no longer places of opportunity for those who lack financial resources. Instead they thrive largely by attracting people who are already successful or living on inherited largesse.

    They are becoming, as journalist Simon Kuper puts it, “the vast gated communities where the one percent reproduces itself.”  

    Not surprisingly, the middle class is shrinking rapidly in most luxury cities. A recent analysis of 2010 Census data by the Brookings Institution found that the percentage of middle incomes in metropolitan regions such as New York, Los Angeles and Chicago has been in a precipitous decline for the last thirty years, due in part to high housing and business costs. A more recent 2014 Brookings study found that these generally high-cost luxury cities—with the exception of Atlanta—tend to suffer the most pronounced inequality: San Francisco, Miami, Boston, Washington DC, New York, Chicago and Los Angeles. Income inequality has risen most rapidly in the very mecca of luxury progressivism, San Francisco, where the wages of the poorest 20 percent of all households have actually declined amid the dot com billions.

    Like other large cities, Houston also suffers a high level of inequality, but its lower costs have helped its middle and working class populations to enjoy a higher standard of living than their luxury city counterparts. The promise of the opportunity urbanism model also can be demonstrated by lower income disparities between racial groups, higher GDP growth, less expansion of poverty and the greater production of high-paying mid-skilled jobs. In these aspects, opportunity cities like Houston greatly out-performed their often more celebrated rivals.

    How to Measure “Living Well”

    We leave this introduction with one statistic that most encompasses the success of the Houston opportunity model and exposes the weakness of smart growth: the cost-of-living adjusted average paycheck.

    Despite the assertions of Paul Krugman, among others, that the Texas urban economy is based on low wages, the fact is Harris County’s average household income is above the national average; close to that of Boston. But once the cost of living is factored in, Houston does far better for its citizens compared to any of the legacy cities. Houston, with Dallas-Ft. Worth a strong second, is able to provide its citizens the highest standard of living, as measured by average annual adjusted wages, of any major metro in America. This is different than subjective “quality of life,” but includes such basics as jobs, housing and overall cost of living.

    Download the full report (pdf) here.

    Joel Kotkin is executive editor of NewGeography.com and Roger Hobbs Distinguished Fellow in Urban Studies at Chapman University, and a member of the editorial board of the Orange County Register. His newest book, The New Class Conflict is now available at Amazon and Telos Press. He is author of The City: A Global History and The Next Hundred Million: America in 2050. His most recent study, The Rise of Postfamilialism, has been widely discussed and distributed internationally. He lives in Los Angeles, CA.

  • Metropolitan Housing: More Space, Large Lots

    Americans continue to favor large houses on large lots. The vast majority of new occupied housing in the major metropolitan areas of the United States was detached between 2000 and 2010 and was located in geographical sectors associated with larger lot sizes. Moreover, houses became bigger, as the median number of rooms increased (both detached and multi-family), and the median new detached house size increased.

    These conclusions are based on an analysis of small area data for major metropolitan areas using the City Sector Model. City Sector Model analysis avoids the exaggeration of urban core data that necessarily occurs from reliance on the municipal boundaries of core cities (which are themselves nearly 60 percent suburban or exurban, ranging from as little as three percent to virtually 100 percent). It also avoids the use of the newer "principal cities" designation of larger employment centers within metropolitan areas, nearly all of which are suburbs, but are inappropriately joined with core municipalities in some analyses. The City Sector Model" small area analysis method is described in greater detail in the Note below.

    Increase in Detached Housing

    America’s preference for detached housing was evident across the spectrum of functional city sectors between 2000 and 2010. Overall, there was a 14% increase in detached housing in the major metropolitan areas. Among the major metropolitan areas (over 1 million population), the number of occupied detached houses rose the most (35%) in the later or generally outer suburbs and exurban areas (24%). Detached houses increased 2.8 million in the later suburbs and 2.5 million in the exurban areas. A smaller 50,000 increase was registered in the earlier or generally inner suburban areas. Most surprisingly, there was also a small increase (20,000) in the number of detached houses in the functional urban cores (Figure 1).

    Smaller Increase in Multi-Family Housing

    The increase in detached housing dwarfed that of new multi-family housing (owned and rented apartments). The increase in detached housing in the major metropolitan areas was six times that of multi-family housing. Overall, there was a four percent increase in multi-family housing in the major metropolitan areas, less than one-third the increase in detached housing.  There were slight decreases in the number of multi-family houses in both the urban cores and the earlier (generally inner) suburbs. At the same time, there has been a healthy increases in the number of multi-family houses in the later suburbs and exurbs, where the growth rates exceeded the increase in major metropolitan population (11%). In the later suburbs, multi-family housing increased 29% and in the exurbs the increase was 14% (Figure 2).

    Larger Houses, Larger Lots

    Yet overall, houses were getting bigger. The median number of rooms per house rose from 5.3 in 2000 to 5.6 in 2010. Increases in median rooms were registered in each of the city sectors (Figure 3). Nationally, the median size of new detached housing edged up five percent between 2000 and 2010. (By 2013, median new house size had increased another 17 percent to a record 2,384 square feet).

    Lots also were getting bigger. Nearly all of the population growth (99 %) was in the later suburbs and exurbs between 2000 and 2010, where population densities are much lower and lots are larger than in the earlier suburbs and the urban core (Figure 4).

    The preponderance of  urban planning theory over the past decade has been based on the notion that people would increasingly seek houses on smaller lots. For example, Arthur C. Nelson of the University of Utah predicted that the demand for housing on conventional-sized lots (which Professor Nelson defines as more than 1/8 acre, which is smaller than the smallest lot size reported by the Census Bureau) would be only 16% in the major metropolitan areas of California by 2010, relying in part on stated preference survey data. In fact the revealed preferences — in other words what people actually did — was four times the predicted demand (64%) in the conventional-lot-dominated later suburbs and exurbs of California’s largest metropolitan areas between 2000 and 2010. This is despite California’s regulatory and legal bias against detached housing on conventional lots (See: California’s War Against the Suburbs). Outside California, later suburban and exurban detached housing represented 77% of new housing demand over the period.

    Planning and Preferences

    Urban cores and multi-family housing are favored by urban planning policy. Yet, large functional urban cores (high density and high transit market share, as defined in the City Sector Model, Note below) are few and far between, with only seven exceeding 500,000 population, a modest number equaled or exceeded by approximately 100 metropolitan areas. Overall, the functional urban cores of major metropolitan areas lost more than 100,000 residents between 2000 and 2010, while suburban and exurban areas gained more than 16.5 million. Predictably, the housing forms typical of the later suburbs and exurbs made strong gains. The preferences of planning are not those of people and households.

    ————-

    Note: The City Sector Model allows a more representative functional analysis of urban core, suburban and exurban areas, by the use of smaller areas, rather than municipal boundaries. The more than 30,000 zip code tabulation areas (ZCTA) of major metropolitan areas and the rest of the nation are categorized by functional characteristics, including urban form, density and travel behavior. There are four functional classifications, the urban core, earlier suburban areas, later suburban areas and exurban areas. The urban cores have higher densities, older housing and substantially greater reliance on transit, similar to the urban cores that preceded the great automobile oriented suburbanization that followed World War II. Exurban areas are beyond the built up urban areas. The suburban areas constitute the balance of the major metropolitan areas. Earlier suburbs include areas with a median house construction date before 1980. Later suburban areas have later median house construction dates.

    Urban cores are defined as areas (ZCTAs) that have high population densities (7,500 or more per square mile or 2,900 per square kilometer or more) and high transit, walking and cycling work trip market shares (20 percent or more). Urban cores also include non-exurban sectors with median house construction dates of 1945 or before.

    ————-

    Wendell Cox is principal of Demographia, an international public policy and demographics firm. He is co-author of the “Demographia International Housing Affordability Survey” and author of “Demographia World Urban Areas” and “War on the Dream: How Anti-Sprawl Policy Threatens the Quality of Life.” He was appointed to three terms on the Los Angeles County Transportation Commission, where he served with the leading city and county leadership as the only non-elected member. He was appointed to the Amtrak Reform Council to fill the unexpired term of Governor Christine Todd Whitman and has served as a visiting professor at the Conservatoire National des Arts et Metiers, a national university in Paris.

    Photo: Northern Suburbs of Minneapolis-St. Paul (by author)

  • America’s Newest Hipster Hot Spot: the Suburbs?

    It’s an idea echoed everywhere from “Friends” to “Girls”Young people want to live in cities. And, we’re told, a lot of them (at least the cool ones) do.

    It’s a common assumption. But it’s also wrong.

    Between 2010 and 2013, the number of 20- to 29-year-olds in America grew by 4 percent. But the number living in the nation’s core cities grew 3.2 percent. In other words, the share of 20-somethings living in urban areas actually declined slightly.

    This trend has occurred in supposedly hot cities like San Fransisco, Boston, New York and D.C., notes demographer Wendell Cox. Chicago and Portland, Ore., both widely hailed as youth boom-towns, saw their numbers of 20-somethings decline, too.

    To some extent, this is an economic problem. Millennials can’t always afford the most popular cities, which have gotten increasingly expensive and unequal.  It doesn’t help that most young people, even with college degrees, are experiencing steadily dropping annual earnings. And their careers are progressing more slowly too.

    But it’s not just that. According to the most recent generational survey research done by Magid and Associates, 43 percent of millennials describe the suburbs as their “ideal place to live,” compared to 31 percent of older generations.

    Only 17 percent of Millennials identify the urban core as where they want to settle permanently. Another survey, by the Demand Institute (funded by the Conference Board and Neilsen), found that 48 percent of 20-somethings hoped to move to the suburbs one day. And contrary to popular myth, they hoped to own a single-family home. Sixty-one percent seek more space.

    These findings may actually understate the suburban preference. As people age, particularly entering the child-bearing period between 30 and 50, they long have displayed a distinct tendency to move to suburban areas.

    And why not?

    A lot of the amenities that once drew people to gritty cities are popping up in the suburbs instead.

    The New York Times documents a trend of people moving from Manhattan and Brooklyn to the verdant suburbs of the Hudson Valley. Increasingly, those towns boast art house films, vegan restaurants and other hip accoutrements.

    Incipient hipster suburbs can also be found in places like Montclair, N.J., Claremont, Calif., and even Irvine, whose Millennial population last decade grew more than four times as much as that of downtown Los Angeles. Once a foodie desert, Irvine and its surrounds now boast dim-sum houses, Vietnamese, Korean, sushi and California cuisine restaurants.

    That’s thanks to another trend: Immigrants are bypassing cities and moving to the suburbs in drovesaccording to Brookings. And they’re bringing good, cheap ethnic food along with them.

    Nowhere are these changes more marked than among Asians, now the nation’s largest source of new immigrants. For example, in the New York metropolitan area, the Asian population grew both in numbers and in percentage far more rapidly in the suburbs than in the core city in the past decade. Nationwide, the Asian population in suburbs jumped by almost 2.8 million, or 53 percent, while that in core cities grew 28 percent.

    great American ethnic culinary tour today would take you not to Manhattan, San Francisco, Hollywood or Chicago, but to places like the San Gabriel Valley, roughly 10 miles east of downtown Los Angeles. This highly suburban region of strip malls and giant food palaces arguably boasts the largest, and most diverse, collection of Asian restaurants in the nation.

    A CNN survey of America’s top 50 Asian restaurants located seven in the area, the most of any region. That includes foodie havens like New York City. Three others were  in the heavily Asian suburbs of Silicon Valley.

    As Tyler Cowen noted, the best places to find distinctive ethnic cuisine in Greater Washington is not in the urban core but in far-flung suburban strip malls, where rents are cheap, parking is adequate and there’s a built-in community of eaters craving home.

    Much the same can be said for Asian markets, temples or schools. Sugarland, some 22 miles further west of downtown Houston, is home to one of the nation’s largest Hindu temples. The largest Hindu temple in the world is now under construction in Robbinsville, N.J. — an exurb of New York some 60 miles south of Manhattan.

    Indeed, in large parts of America, many successful malls are those that are getting “ethnicized.” A prime example is La Gran Plaza on the outskirts of Fort Worth, Tex., where a once-failing mall is now booming, converted to look like an old village in Northern Mexico, with loads of restaurants, markets, wedding and quincenara shops and a huge swap-meet.

    This is in addition to live music and, on some Sundays, Catholic Mass.

    As their demographics change, so too do the functions of suburbs. No longer mere bedroom communities, they are becoming economic centers of their own. Despite the constant hype about the new appeal of downtown locations, jobs continue to follow the migration of middle-class families. Having been widely written off for dead, suburban office space also  began to recover last year at a much quicker rate than in  city centers, according to the office consultancy Costar. Overall, suburbs already account for close to three quarters of the nation’s office inventory.

    Suburbia is not the city’s antithesis, but its natural extension, particularly as young people morph towards adulthood.  Rather than vilify suburbs as fundamentally inefficient, deadening and wasteful, its time to focus on how to improve the preferred environment for work, interaction and raising the next generation for most Americans. Cities have changed too, of course, in many cases for the better. But the suburbs are evolving as well. And all indications suggest that they are likely to retain their preeminence as Americans’ preferred places to settle down.

    This piece first appeared at The Washington Post.

    Joel Kotkin is executive editor of NewGeography.com and Roger Hobbs Distinguished Fellow in Urban Studies at Chapman University, and a member of the editorial board of the Orange County Register. His newest book, The New Class Conflict is now available at Amazon and Telos Press. He is author of The City: A Global History and The Next Hundred Million: America in 2050. His most recent study, The Rise of Postfamilialism, has been widely discussed and distributed internationally. He lives in Los Angeles, CA.