Category: Demographics

  • Class Issues, Not Race, Will Likely Seal the Next Election

    Recent events in Ferguson, Missouri and along the U.S.-Mexico border may seem to suggest that race has returned as the signature issue in American politics. We can see this already in the pages of mainstream media, with increased calls for reparations for African-Americans, and expanded amnesties for the undocumented. Increasingly, any opposition to Obama’s policies is blamed ondeep-seated white racism.

    Yet in reality, race will not define the 2014 election, or likely those that follow. Instead the real defining issue—class—does not fit so easily into the current political calculus. In terms of racial justice, we have made real progress since the ’60s, when even successful educated minorities were discriminated against and the brightest minority students were often discouraged from attending college. Today an African-American holds the highest office in the land, and African Americans also fill the offices of U.S. attorney general and national security advisor. This makes the notion that race thwarts success increasingly outdated.

    But at the same time that formal racial barriers have been demolished, the class divide continues to grow steeper than in at any time in the nation’s recent history. Today America’s class structure is increasingly ossified, and this affects not only minorities, who are hit disproportionately, but also many whites, who constitute more than 40 percent of the nation’s poor. Upward mobility has stalled under both Bush and Obama, not only for minorities but for vast swaths of working class and middle class Americans. Increasingly, it’s not the color of one’s skin that determines one’s place in society, but access to education and capital, often the inherited variety.

    Worries about upward mobility have been mounting for a generation, and according to Pew, only one-third of Americans currently believe the next generation will do better than them. Indeed, in some surveys pessimism about the next generation stands at an all-time high.

    But race is not the main determinant in looking to the future. The greatest dismay, in fact, is felt among working class and middle class whites, who are generally much more pessimistic about the future for themselves than are either African-Americans or Hispanics.

    This pessimism—for all the discussion on campuses about “white privilege”—is even more deeply seated among young whites. According to a poll conducted by the left-leaning advocacy group Demos, only 12 percent of whites 18 to 34 believe they will do better than their parents, compared to 31 percent for African-Americans and 36 percent among young Hispanics.

    This suggests that the issue of restoring upward mobility has more widespread resonance than a more narrow race-based approach. The political party that best addresses this concern will be in the strongest position to dominate the political landscape not only in 2014, but well beyond.

    The problem for the Democrats in this regard: the record of the last six years. President Obama has presided over an economy that, even when healing, has done little to improve the economic conditions of most Americans. The incomes of middle class Americans have remained stagnant, or shrunk, even as we have seen record corporate profits, a soaring stock market, and huge run ups in elite property markets.

    This failure may explain why some Democrats and progressives feel tempted to go back to race-related issues—as well as social concerns such as gay and abortion rights—to stir their political base. The president’s suggestion of executive action on immigration would be in part to “galvanize” support among Latinos, many of whom can relate personally to the dilemma faced by the undocumented.

    The stirring of resentment among African-Americans has become the critical component of race-based Democratic strategy. The president’s embrace of hoary racial warlord Reverend Al Sharpton, a well-known charlatan and occasional anti-semite, as his “go to guy” demonstrates the administration’s willingness to use the tragedy of the Ferguson shooting case to rally African-American voters for the off-year election.

    These tactics may have some political efficacy, but it’s doubtful that ’60s progressive bromides of race-based politics or calls for redistribution can seriously address inequality or poverty. Certainly the idea that greater dependence on government handouts—the main social focus of modern progressives—has not aided minority uplift or promoted upward mobility. The Great Society may have reduced poverty initially, but in the past decade poverty rates have risen to the highest level since the ’60s.

    If anything, under the most progressive-dominated regime since at least the New Deal, things have gotten even worse. African-American youth unemployment is now twice that of whites while according to the Urban League, the black middle class, once rapidly expanding, has essentially lost the gains made over the past 30 years.

    In the same vein, Hispanic income also has declined relative to whites. Latino poverty rates now stand at 28 percent. The administration’s leniency that permits impoverished kids to flock here from Central America may make moral or political sense, but its actual impact on communities could prove problematical.

    Indeed one has to question the viability of new mass immigration of poor, poorly educated kids at a time when poverty among Latino children already here has risen since 2007, according to the American Community Survey, from 27.5 percent to 33.7 percent in 2012, an increase of 1.7 million. Given their own economic problems, and the vital need to improve their educational performance one has to wonder whether African-Americans or even many Latinos, as opposed to the activist base, actually would welcome a fresh infusion of impoverished refugee children from Central America into the country. A recent Pew survey found that not only half of all whites, but nearly two-fifths of African Americans and roughly a third of Hispanics approved of increased deportations of the undocumented.

    Some Latino and African-American Democrats have already departed from the party line on immigration. Texas Rep. Henry Cuellar, a moderate border district Democrat, has called “the border incursion” “Obama’s Katrina moment” and he is co-sponsoring legislation with Republican Sen. John Cornyn of Texas to speed up the deportation process for kids detained at the border.

    Perhaps even more serious are divisions among Democrats on key economic and regulatory issues. In California, for example, Latino Democrats, particularly from the hard hit interior, have revolted against their party’s “cap and trade” policies, which will lead to ever higher energy costs, and threaten industries that tend to employ working class Latinos. Similarly some unions in the interior, notably the Teamsters and Laborers, have taken strong positions favoring energy development, notably the Keystone pipeline, in sharp opposition to the president’s core supporters.

    And then there’s the reality that blue states—with all the usual progressive policies—suffer the widest gap between the classes. Indeed, notes demographer Wendell Cox, New York City now has an income distribution that approaches that of South Africa under apartheid.

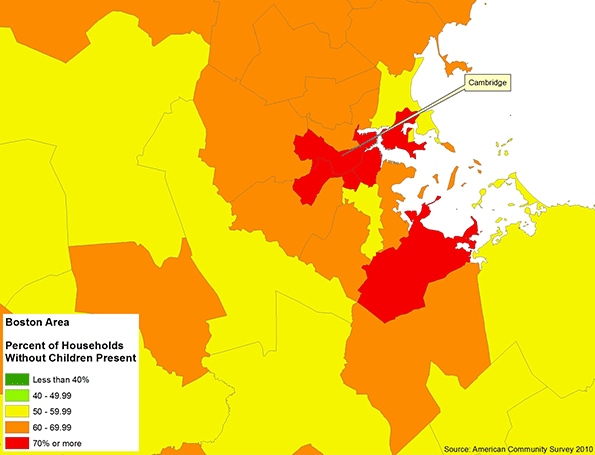
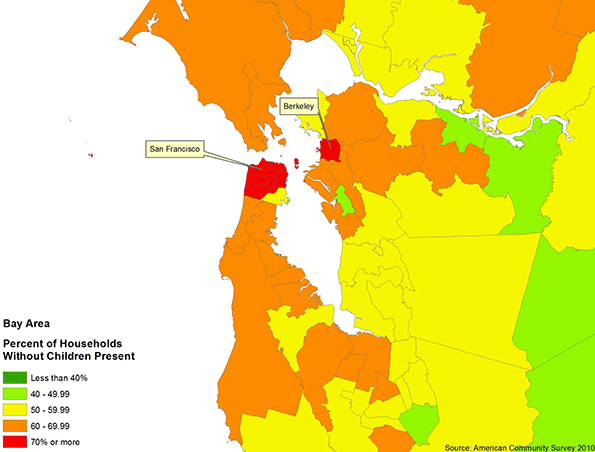
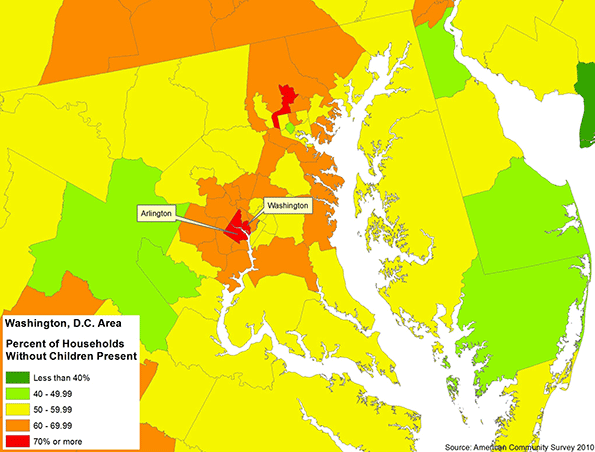
    Similarly a recent Brookings report found the greatest income disparity in such bastions of progressivism as San Francisco, Miami, Boston, Washington D.C., New York, Oakland, Chicago and Los Angeles. Oddly enough, minorities seem to do better, relative to whites, in states that have had more conservative governance, in part because they also tend to have lower costs of living.

    This disconnect between progressive aims and reality stems from the shift in the Left’s class and geographic base. Once dependent on industrial and construction workers, many of them unionized, the party increasingly depends for support from green activists, urban land speculators, and “creative class” workers in expensive regions where regulatory constraints tend to discourage industrial and housing growth. In contrast many red state metros such as Houston, Oklahoma City, Salt Lake, and Dallas-Ft. Worth tend to produce more higher paid, blue collar growth.

    Given these realities, perhaps progressives need to move away from symbolic issues, such as reparations and racial name-calling, and instead directly address middle class and working class concerns. Yet this creates a potential for internecine conflict with other key party constituencies, which seem more interest in suppressing middle class aspirations than fulfilling them.

    It should be clear by now that regulatory and tax regimes imposed in blue states tend to stunt middle and working opportunities, with the worst effects on minorities and working class whites. Blue-state progressive can whine about race, inequality, and poverty with the best of them, but they would contribute far more if they started to address these issues with something other than well-rehearsed indignation and rhetoric.

    But while progressive attempts to address the class divide have been less than successful, can the Republicans fill the breach? Already working class whites are arguably the GOP’s strongest base and Republicans should be able to exploit class resentment toward the increasingly gentrified Democratic leadership. Yet to date, they have shown a remarkable inability to do so, in part due to the ideological constraints and racial baggage of the increasingly Southern-oriented GOP.

    Republicans, particularly those closest to Wall Street, also seem to have a problem even admitting the existence of the class issue. Conservatives economists repeatedly downplay ever greater insecurity about jobs, the affordability of decent housing and generally lower net worths for all but the highly affluent. Convinced that any discussion about these issues constitutes unseemly “class warfare,” the right’s intellectual leadership seems incapable of addressing these concerns.

    What would a policy that addresses inequality look like? Some steps would offend some Republicans, such as restarting a modern version of the Depression era Works Progress Administration. Instead of a stimulus directed at government workers and crony-capitalists, as Obama employed in 2009, a program that brought young people into the work force would help them gain needed practical skills while repairing our increasingly woeful infrastructure.

    Other reforms would include a major overhaul of the tax system, particularly equalizing capital gains and income taxes. Whatever the benefits we may have seen from lower capital gains rates in the past, the current, incredibly unequal recovery undermines the legitimacy of this approach. Rather than stir investment and create middle income jobs, capital gains have become a ruse for the rich to get even richer, largely through asset inflation. Companies, notes a new Harvard Business Review study, have used the low interest bonanza and access to cheap money to boost profits, not by expanding employment but by buying back their own stock.

    Ultimately, the best way to address class concerns, as well as those of minorities, would be to spark strong economic growth, particularly in the energy, manufacturing, and construction sectors, which tend to offer higher wage employment for them. Both Latinos and African-American made their biggest economic strides when the economy was booming under Presidents Reagan and Clinton, both of whom have been criticized for “trickle down” policies.

    A growth agenda is a winning one for the party that embraces and effectively advocates it. A recent analysis (PDF) of public opinion by the Global Strategy Group found that although roughly half of Americans believe inequality per se is a major issue, more than three-quarters believe that faster economic growth should be the main priority.

    In the old Democratic Party, from Truman to Clinton, this approach would be an easy sell. A policy that encouraged building new water facilities, expanding domestic energy , manufacturing and construction, particularly single family homes, would have widespread appeal to working and middle class voters. But a growth agenda likely would face much opposition from the president’s green gentry base, who seem perfectly content with an economy that rewards insiders, venture capitalists, and companies that employ few people, largely the best educated and positioned.

    Republicans could seize the momentum here, but to do so would require shedding some ideological baggage, as well standing up to some of their more ruthless backers on Wall Street and the corporate community. Similar a return to a more traditional growth oriented liberalism would help hard pressed Democrats, particularly in red states, who desperately need to recapture some of their traditional working class backers. It will be here, in the nexus of policy and class, not racial posturing, the political future of the country may well be determined.

    This piece originally appeared at The Daily Beast.

    Joel Kotkin is executive editor of NewGeography.com and Distinguished Presidential Fellow in Urban Futures at Chapman University, and a member of the editorial board of the Orange County Register. His newest book, The New Class Conflict is now available at Amazon and Telos Press. He is author of The City: A Global History and The Next Hundred Million: America in 2050. His most recent study, The Rise of Postfamilialism, has been widely discussed and distributed internationally. He lives in Los Angeles, CA.

  • America’s Fastest-Growing Small Cities

    Coverage of America’s changing urban scene tends to focus heavily on large metropolitan areas and the “megaregions” now often said to dominate the economic future. Often missed has been a slow, but inexorable, shift of migration and economic growth to smaller cities, a geography usually ignored or dismissed, with the exception of college towns, as doomed to lag behind by urban boosters.

    Part of the problem is that analysts often assume that the decline of small towns, which have been losing population, also means small cities are in trouble. Yet this is simply not true. Since 2000 small cities with between 100,000 and 250,000 residents have enjoyed a 13.6% population growth rate, more than twice that of New York, Los Angeles and Chicago, and roughly 10% faster than the national growth rate. The main driving force, notes demographer Wendell Cox, appears to be domestic migration, which is negative in the largest cities as well as in small towns. However the 167 metropolitan statistical areas with between 100,000 to 250,000 in population have added a net 675,000 people due to domestic migration since 2000.

    This performance is also seen in the economic sphere. All five of the nation’s fastest growing economies in 2013 were small cities, which, despite their smaller size, possess the basic infrastructure — hospitals, schools, airports, broadband — that are essential to economic growth.

    Of course, not all small cities are doing well. Many, particularly in the industrial heartland, continue to suffer; virtually all the bottom 10 small cities on our list are in old industrial areas in the Great Lakes, the Southeast and Massachusetts,  the birthplace of America’s first manufacturing boom.

    In order to determine which small metro areas are booming, and help us understand why, we asked Mark Schill at the Praxis Strategy Group to rank them based on four factors: population growth (2000-13), job growth (2001-14), real per capita personal income growth (2000-12), and growth of regional GDP per job (2001-12) — if GDP per job is increasing, it’s an indicator that the metro area is adding high-value, productive industries to its economy, as opposed to lower-wage jobs.

    Boomer Boomtowns

    Over the next decade, one major driver for growth in small cities may be demographic factors, notably the aging of the baby boom generation. Contrary to popular press accounts that suggest boomers are gravitating to big cities, demographic evidence suggests the opposite is the case. Demographer Cox says boomers appear to be, on net, leaving both big cities and older suburbs in favor either of exurbs or smaller cities.

    Some small cities already appear to benefiting from this trend, including the top-ranked city on our list: The Villages, Fla. This relatively new community, which focuses on “active” seniors has doubled in population since 2000, and last year was the nation’sfastest-growing metropolitan area. The area also has expanded its job base by 186% since 2001. Yet as much of the employment is in services, growth in economic productivity has been lackluster. Critically, this does not mean the area has been getting poorer. Personal income growth, largely from assets owned by seniors, has soared by some 60% since 2000, 10 times the national average growth rate of 6%.

    Thriving senior-oriented economies can be found throughout Florida, but they are also emerging elsewhere. St. George, Utah, which ranks 12th on our list, has long attracted downshifting boomers from the West Coast as well as the rest of the Intermountain West. This has helped to power its construction sector, a key element of the local economy. Another hot spot for boomers is No. 17 Bellingham, Wash., which is home to Western Washington University. In the coming decade, we can expect a growing competition among smaller towns for boomer residents, and their sometimes significant assets.

    Energy Towns

    The oil and gas industry doesn’t need bright lights, but sometimes its presence can create some. Of our top 10 fastest-growing small cities, five are energy-driven boom towns. This includes No. 2 Midland, Texas, which has logged 60% job growth since 2001 and 30% population growth since 2000. The west Texas  city, located in the heart of the booming Permian Basin is also getting richer, with personal income growth of over 96.7% since 2000, a rate well above the national average of 6% and the median for small cities of 10.2%. Last year, Midland led the nation in GDP growth at 14%.

    Other high-ranked energy cities include No. 3 Odessa, Texas,  and No. 8 Houma-Thibadaoux, La., which this February boasted the lowest unemployment rate in the nation at 2.8%.

    College Towns

    One would expect this list to be chock full of university towns, but to our surprise, only one made the top 10: Fargo, North Dakota-Minnesota. The metro area has caught our eye before. Fargo is far more than home to North Dakota State, with almost 15,000 students, but the school’s  expertise in engineering and energy dovetails perfectly with the state’s boom not only in energy but it’s rapidly growing tech and manufacturing sectors. Since 2010, manufacturing employment is up 18% in Fargo, to go along with 21% growth at corporate managing offices, 20% in wholesale trade, 17% in finance, and 14% in professional services.

    Perhaps a better example of a small city benefiting from university connections is  No. 12 Morgantown, W.V. The metro area of 135,000 is home to the nearly 30,000 people working or studying at the University of West Virginia. Other college towns that made it to the upper tier include No. 11 Hammond, home to Southeast Louisiana University , with 15,000 students; No. 13 Logan, Utah, which hosts Utah State’s 28,000 students; and No. 25 Auburn, Alabama, home to the 25,000-student university of the same name.

    Government Centers

    Throughout the Bush years and in the first years of the recession, government centers — such as greater Washington, D.C., Madison, Wisc., as well as towns with military bases — out-performed the overall economy. Today many of the small cities that are thriving remain largely dependent on government spending, including  No. 5 Jacksonville, N.C., home to the Marine Corps’ Camp Lejeune.

    Given the long-term fiscal crisis facing many communities, this dependence on government spending could prove problematic, leaving a metro area’s fate in the hands of others. Planned cuts in military spending could undermine growth in many of these communities and is already raising the hackles of some public sector unions.

    The Road Ahead

    These trends suggest that the future of small city America may be far brighter than suggested by many urban pundits. The movement of boomers and the growth of resource-based industries seem likely to accelerate this trend, although declines in government, and particularly military, spending may impact some communities negatively. Like big cities, their small brethren seem to be divided between those that are thriving and those that are not.

    Perhaps the biggest challenge facing small cities will be retaining or attracting enough young families. Already roughly two out of every five millennials lives in one of the country’s smaller communities, and proportionately this population grew faster in these small metro areas than in either core cities or suburbs. In the future the key question is how to get more of them, particularly the better educated, to stay.

    Economically, these areas also need to diversify, taking advantage of new technologies that allow many businesses to operate remotely. Too great dependence on government spending, or on boomer migration, tends to distort local economies by fostering too much dependence on Washington or  creates a labor market overly tilted towards low-paying service workers. These smaller places still have their work cut out from them, but their prospects may overall be brighter than many suspect.

    Fastest Growing Small Cities
    Rank Region (MSA) Score Growth GDP/Job, 2001-2012 Job Growth, 2001-2014 PCPI Growth, 2000-2012 Population Growth, 2000-2013
    1 The Villages, FL 76.4 2.0% 186.0% 59.2% 99.2%
    2 Midland, TX 60.4 15.8% 59.7% 96.7% 30.3%
    3 Odessa, TX 54.4 32.9% 45.0% 49.4% 23.8%
    4 Fargo, ND-MN 43.4 24.8% 28.4% 23.5% 27.7%
    5 Jacksonville, NC 41.8 15.3% 27.2% 42.2% 22.9%
    6 Longview, TX 41.1 29.7% 18.0% 25.0% 11.5%
    7 Bismarck, ND 41.0 15.2% 35.5% 34.9% 22.5%
    8 Houma-Thibodaux, LA 40.7 18.0% 22.0% 49.7% 7.9%
    9 Watertown-Fort Drum, NY 39.9 22.1% 19.8% 39.5% 6.9%
    10 Madera, CA 39.4 20.1% 25.6% 22.0% 23.3%
    11 Hammond, LA 39.1 18.6% 20.5% 25.2% 24.5%
    12 Morgantown, WV 39.1 19.8% 22.7% 23.9% 22.3%
    13 Logan, UT-ID 39.0 23.1% 23.8% 12.4% 25.7%
    14 Las Cruces, NM 38.7 20.0% 21.0% 23.2% 21.9%
    15 Elizabethtown-Fort Knox, KY 37.9 27.8% 9.9% 18.6% 12.6%
    16 St. George, UT 36.9 -2.0% 48.7% 6.4% 62.1%
    17 Bellingham, WA 35.2 15.8% 20.1% 15.7% 23.1%
    18 Rochester, MN 35.1 24.7% 7.0% 12.7% 14.2%
    19 Sioux Falls, SD 34.9 13.6% 19.7% 13.0% 29.3%
    20 California-Lexington Park, MD 34.7 12.6% 20.0% 17.0% 26.7%
    21 Hanford-Corcoran, CA 34.7 10.2% 12.0% 36.6% 16.3%
    22 Sherman-Denison, TX 34.4 27.7% 3.1% 9.4% 10.3%
    23 College Station-Bryan, TX 33.8 9.0% 26.1% 16.5% 27.5%
    24 Elkhart-Goshen, IN 33.4 31.9% 3.8% -3.1% 9.4%
    25 Auburn-Opelika, AL 33.3 8.7% 33.9% 7.3% 30.8%
    26 St. Joseph, MO-KS 33.1 24.8% 8.7% 14.4% 3.0%
    27 Tuscaloosa, AL 32.7 19.4% 11.0% 10.2% 15.2%
    28 Billings, MT 32.6 13.2% 16.1% 17.3% 18.0%
    29 Grand Forks, ND-MN 32.3 13.5% 8.6% 34.2% 3.4%
    30 Hattiesburg, MS 32.3 13.3% 13.7% 15.9% 19.0%
    31 Idaho Falls, ID 32.3 10.8% 12.0% 10.6% 30.5%
    32 Charlottesville, VA 31.6 12.8% 12.7% 16.0% 17.5%
    33 Lawton, OK 31.5 15.4% 7.1% 23.2% 7.7%
    34 Burlington-South Burlington, VT 31.4 20.0% 4.9% 14.2% 7.6%
    35 Coeur d’Alene, ID 31.3 6.9% 23.9% 7.1% 31.8%
    36 Alexandria, LA 31.2 16.6% 4.8% 21.8% 6.6%
    37 Daphne-Fairhope-Foley, AL 31.2 3.2% 27.3% 5.9% 38.3%
    38 Johnson City, TN 31.2 19.5% 1.6% 13.2% 10.5%
    39 Bend-Redmond, OR 30.6 2.4% 23.9% 2.6% 42.4%
    40 Yuma, AZ 30.4 8.7% 13.1% 11.4% 25.3%
    41 Waterloo-Cedar Falls, IA 30.0 15.2% 6.8% 21.6% 3.5%
    42 El Centro, CA 30.0 -0.2% 28.2% 21.9% 24.0%
    43 Binghamton, NY 30.0 27.1% -10.5% 11.1% -1.7%
    44 Grand Junction, CO 30.0 12.2% 13.7% 2.0% 25.4%
    45 Jonesboro, AR 29.9 9.8% 11.9% 17.0% 16.2%
    46 Eau Claire, WI 29.7 15.8% 9.3% 10.1% 10.7%
    47 Sierra Vista-Douglas, AZ 29.7 7.1% 8.2% 30.0% 9.6%
    48 State College, PA 29.6 10.6% 3.5% 20.2% 14.3%
    49 Iowa City, IA 29.6 6.3% 21.1% 12.4% 21.9%
    50 Winchester, VA-WV 29.6 9.7% 12.2% 4.3% 27.4%
    51 Greenville, NC 29.4 6.8% 13.6% 6.3% 29.8%
    52 Lafayette-West Lafayette, IN 29.0 17.6% 5.8% -0.9% 16.8%
    53 Tyler, TX 28.8 5.8% 16.4% 11.3% 23.0%
    54 Bowling Green, KY 28.4 9.2% 16.8% 4.5% 20.8%
    55 Bloomington, IN 28.2 15.0% 8.5% 2.5% 14.3%
    56 Champaign-Urbana, IL 28.2 17.5% -5.0% 6.9% 11.7%
    57 Yakima, WA 27.9 9.0% 12.9% 14.5% 11.0%
    58 Homosassa Springs, FL 27.9 8.7% 11.2% 9.5% 17.4%
    59 Carbondale-Marion, IL 27.8 13.7% 0.8% 16.9% 4.8%
    60 Rapid City, SD 27.8 4.9% 7.7% 19.0% 17.4%
    61 Panama City, FL 27.6 4.5% 15.7% 15.1% 17.1%
    62 Anniston-Oxford-Jacksonville, AL 27.5 17.7% -5.2% 10.0% 5.1%
    63 Columbia, MO 27.3 2.5% 20.8% 6.7% 25.6%
    64 La Crosse-Onalaska, WI-MN 27.3 11.9% 6.1% 13.8% 6.7%
    65 Chico, CA 27.2 10.5% 6.5% 13.6% 9.0%
    66 Abilene, TX 27.1 7.7% 10.2% 21.8% 4.5%
    67 Yuba City, CA 27.1 6.8% 4.4% 10.2% 20.9%
    68 Terre Haute, IN 27.0 18.8% -2.7% 8.7% 0.8%
    69 Kahului-Wailuku-Lahaina, HI 27.0 1.4% 13.0% 13.0% 24.2%
    70 St. Cloud, MN 26.9 8.0% 10.7% 10.8% 13.8%
    71 Chambersburg-Waynesboro, PA 26.9 7.5% 17.1% 4.7% 17.2%
    72 Oshkosh-Neenah, WI 26.8 15.4% 1.4% 5.3% 7.9%
    73 Dover, DE 26.6 -2.8% 23.0% 6.0% 33.2%
    74 Texarkana, TX-AR 26.6 12.4% -0.3% 15.1% 4.5%
    75 Dothan, AL 26.4 9.6% -2.5% 13.4% 12.7%
    76 Lake Havasu City-Kingman, AZ 26.3 2.8% 8.5% 3.9% 30.0%
    77 Lawrence, KS 26.3 10.2% 2.0% 7.9% 14.0%
    78 Fairbanks, AK 26.3 1.3% 8.5% 15.8% 21.0%
    79 Missoula, MT 26.3 5.4% 13.7% 9.4% 16.3%
    80 Joplin, MO 26.2 12.0% 2.0% 6.6% 11.1%
    81 Owensboro, KY 26.2 11.4% 5.2% 11.5% 5.8%
    82 Lake Charles, LA 26.2 6.8% 5.4% 22.4% 4.4%
    83 Williamsport, PA 26.2 12.5% 0.4% 20.0% -2.6%
    84 San Angelo, TX 26.1 5.0% 5.4% 20.1% 10.1%
    85 Flagstaff, AZ 26.0 6.2% 9.3% 8.3% 16.9%
    86 Glens Falls, NY 25.9 8.6% 3.7% 19.5% 3.4%
    87 Cumberland, MD-WV 25.8 9.6% 0.3% 22.4% -0.6%
    88 New Bern, NC 25.8 9.8% -1.1% 11.2% 10.9%
    89 Beckley, WV 25.7 6.2% 3.3% 28.7% -1.7%
    90 Bloomington, IL 25.5 9.5% -2.6% 8.4% 14.0%
    91 Longview, WA 25.4 12.2% -5.4% 8.2% 9.5%
    92 Kingston, NY 25.3 9.5% -4.7% 20.9% 1.8%
    93 Wheeling, WV-OH 25.3 14.2% 0.7% 14.7% -4.7%
    94 Florence-Muscle Shoals, AL 25.1 12.0% -0.7% 11.4% 3.0%
    95 Dalton, GA 25.1 19.3% -15.8% -10.6% 17.6%
    96 Sioux City, IA-NE-SD 25.1 10.5% 0.7% 16.2% 0.6%
    97 Sebastian-Vero Beach, FL 25.0 1.9% 12.8% 2.4% 25.3%
    98 Wenatchee, WA 24.8 1.3% 17.1% 11.5% 14.2%
    99 Blacksburg-Christiansburg-Radford, VA 24.8 6.9% 3.4% 12.4% 9.0%
    100 Harrisonburg, VA 24.7 3.8% 7.7% 6.2% 19.1%
    101 Albany, OR 24.5 9.8% 2.6% -0.8% 15.3%
    102 Battle Creek, MI 24.2 17.5% -9.7% 6.1% -2.2%
    103 Ithaca, NY 24.2 3.1% 5.9% 18.3% 7.3%
    104 Warner Robins, GA 24.1 -3.9% 13.5% 7.2% 28.6%
    105 Lebanon, PA 24.0 0.9% 13.0% 13.0% 12.6%
    106 Goldsboro, NC 23.9 7.8% -2.2% 9.2% 9.6%
    107 Monroe, LA 23.8 6.7% -2.5% 15.6% 5.0%
    108 Lewiston-Auburn, ME 23.7 9.1% 0.3% 9.9% 3.6%
    109 Sumter, SC 23.6 9.1% -9.1% 15.1% 3.2%
    110 Prescott, AZ 23.4 -3.7% 11.5% 5.4% 27.6%
    111 Vineland-Bridgeton, NJ 22.9 3.5% -0.4% 14.9% 7.6%
    112 Wichita Falls, TX 22.8 6.5% -9.7% 21.3% -0.4%
    113 Jackson, TN 22.8 6.5% 3.8% 6.6% 7.0%
    114 Decatur, AL 22.8 12.2% -7.7% 2.4% 5.0%
    115 Cleveland, TN 22.7 2.7% 7.5% 5.6% 13.6%
    116 Janesville-Beloit, WI 22.5 11.0% -3.7% 1.4% 5.4%
    117 Napa, CA 22.3 0.1% 15.0% 6.2% 12.7%
    118 Decatur, IL 22.3 11.6% -9.6% 12.2% -4.6%
    119 Sheboygan, WI 22.2 6.1% -3.1% 13.7% 1.9%
    120 Athens-Clarke County, GA 22.2 -3.3% 17.9% 5.3% 18.7%
    121 Kankakee, IL 21.9 7.1% -1.8% 3.2% 8.0%
    122 Morristown, TN 21.8 6.9% -4.8% 0.9% 12.1%
    123 Brunswick, GA 21.7 3.9% -4.9% -3.1% 21.9%
    124 Medford, OR 21.6 0.3% 7.9% 4.4% 14.7%
    125 Topeka, KS 21.4 6.4% -4.2% 7.7% 4.2%
    126 Wausau, WI 21.3 4.9% -1.6% 5.9% 7.5%
    127 Hilton Head Island-Bluffton-Beaufort, SC 21.3 -8.7% 8.4% -2.7% 38.8%
    128 Mount Vernon-Anacortes, WA 21.3 -1.3% 8.2% 6.0% 14.9%
    129 East Stroudsburg, PA 21.1 -0.3% 7.3% -1.1% 19.6%
    130 Bangor, ME 21.1 3.4% -0.9% 9.4% 5.8%
    131 Valdosta, GA 21.0 -6.2% 6.7% 11.6% 19.4%
    132 Gadsden, AL 20.9 5.1% -2.2% 11.0% 0.6%
    133 Jefferson City, MO 20.9 3.6% -1.4% 6.7% 7.3%
    134 Altoona, PA 20.8 6.7% -1.2% 9.2% -2.1%
    135 Appleton, WI 20.8 -0.6% 5.5% 5.2% 13.5%
    136 Gettysburg, PA 20.7 2.2% 6.3% 1.0% 11.0%
    137 Staunton-Waynesboro, VA 20.5 0.9% -3.2% 9.3% 9.5%
    138 Michigan City-La Porte, IN 20.3 11.8% -12.6% -0.8% 1.1%
    139 Lima, OH 19.9 12.6% -11.3% -0.6% -3.0%
    140 Springfield, IL 19.7 8.1% -12.6% 0.0% 5.0%
    141 Fond du Lac, WI 19.6 3.8% -1.5% 3.7% 4.5%
    142 Charleston, WV 19.5 3.4% -9.0% 16.9% -4.6%
    143 Redding, CA 19.0 -2.1% -1.6% 8.5% 9.4%
    144 Pueblo, CO 18.9 -4.2% 6.5% 3.6% 13.9%
    145 Farmington, NM 18.8 -15.5% 9.6% 28.5% 10.8%
    146 Gainesville, GA 18.8 -12.1% 13.9% -3.4% 33.2%
    147 Jackson, MI 18.3 7.8% -7.0% -4.0% 1.1%
    148 Monroe, MI 18.1 5.9% -5.8% -3.1% 2.7%
    149 Bay City, MI 18.1 9.4% -10.9% -2.1% -3.0%
    150 Florence, SC 18.0 -2.3% -3.4% 8.0% 6.7%
    151 Santa Fe, NM 17.9 -5.4% 4.5% 3.2% 13.7%
    152 Niles-Benton Harbor, MI 17.4 4.7% -9.0% 5.3% -4.4%
    153 Burlington, NC 17.3 -0.6% -6.2% -7.8% 17.5%
    154 Racine, WI 17.2 0.4% -5.4% 3.6% 3.2%
    155 Johnstown, PA 17.0 0.1% -6.0% 14.5% -7.6%
    156 Muncie, IN 16.7 7.2% -13.8% -4.1% -1.1%
    157 Punta Gorda, FL 16.3 -11.2% 12.9% 2.0% 15.8%
    158 Mansfield, OH 15.6 5.2% -16.6% 1.3% -5.5%
    159 Rocky Mount, NC 15.6 -0.1% -13.7% -0.1% 5.3%
    160 Pittsfield, MA 15.3 -5.7% -1.4% 13.2% -3.8%
    161 Barnstable Town, MA 15.3 -10.8% 3.2% 21.1% -3.6%
    162 Weirton-Steubenville, WV-OH 13.8 -1.6% -15.8% 9.0% -7.4%
    163 Albany, GA 13.7 -9.5% -5.7% 13.8% -1.2%
    164 Springfield, OH 13.1 -2.7% -10.4% 4.0% -5.8%
    165 Saginaw, MI 11.8 -1.3% -10.6% -4.0% -6.4%
    166 Muskegon, MI 10.8 -9.7% -4.1% -0.7% 0.4%
    167 Macon, GA 9.1 -18.3% -3.1% 5.6% 4.0%

    Analysis by Mark Schill, mark@praxissg.com. Measures are normalized and equally weighted. Sources: U.S. BEA (GDP/Job, PCPI growth), EMSI (employment growth), U.S. Census Population Estimates Program (population growth).

    This piece originally appeared at Forbes..

    Joel Kotkin is executive editor of NewGeography.com and Distinguished Presidential Fellow in Urban Futures at Chapman University, and a member of the editorial board of the Orange County Register. His newest book, The New Class Conflict is now available at Amazon and Telos Press. He is author of The City: A Global History and The Next Hundred Million: America in 2050. His most recent study, The Rise of Postfamilialism, has been widely discussed and distributed internationally. He lives in Los Angeles, CA.

    Fargo photo by David Kohlmeyer.

  • Chicago’s Planning Strategy: Hot or Not?

    The City of Broad Shoulders may have two faces, but how will it age?

    This was the essence of the question that the Chicago Tribune was asking in October of 2013 when it urged readers to re-envision the city’s original 1909 plan in a modern context. In the 115 years since, and especially recently, Chicago has become a glitzy glass and steel mecca for Midwest yuppies. It’s also become an unfortunate poster child for corruption, financial struggles, urban violence, and poor schools. It’s a city whose two reputations could hardly be more different.

    To many in the Windy City, the opportunity was a chance to envision a bold new future for the region. In their eyes, the future of Chicago today depends on it becoming a vibrant bastion of international excitement, with a growing population and tourism as key ingredients of new fiscal health.

    Their hopes are based on optimism garnered from a real estate scene in which Chicago’s north side has become one of the hottest locations in the country, and formerly blighted neighborhoods have turned into battlegrounds for gentrification.

    Along with that, through a variety of initiatives, the fiscally strapped city has invested in many white-collar neighborhoods and international attractions, which some have argued come at the expense of the city’s lower-income areas, as well as the city’s older industrial, manufacturing, and infrastructural assets. Arguably the most visible investment – Millennium Park – has been a story of success that is inspiring the subsequent transformation of the Chicago River from a primarily industrial channel into a tourist experience unto itself. It’s part of an approach by Mayor Rahm Emmanuel to up tourism and generate tourist industry jobs.

    The strategy of investing deeply in white-collar cultural successes with the hope that the resulting momentum will offset the city’s grimmer challenges is a daring game. There are some reasons to think that parts of it may be working. Over the last decade, for instance, Chicago attracted a rapid in-migration of new residents – by some estimates Cook county gained over 100,000 in-migrants per year.

    But the bigger demographic picture doesn’t inspire optimism. While Chicago gained a substantial numbers of Millennials in their 20s and folks in their 50s and 60s between 2000 and 2010, it was also the only one of the nation’s ten largest cities that lost population overall during the same time period.

    And between 2005 and 2010, despite substantial in-migration, Cook County lost as many as 185,000 residents a year to out-migration according to IRS data, including negative net-migration among nearly every age group, including 20-somethings, a statistic that is particularly eye-popping given the city’s perceived success at attracting people in exactly that age bracket.

    At the same time that Chicago’s Loop experienced a sudden burst as the hottest urban center in the US, the city as a whole still lost considerable ground to the nation’s growing cities. It’s been predicted that in another 30 years the Chicago region will be surpassed in size by at least two different metropolitan areas in the Texas triangle, and, nationally, possibly by more. That’s assuming that Chicago doesn’t lose ground faster than it already has. Moving forward, it may have a tougher time attracting large numbers of Midwestern Millennials, as Rust Belt cities like Cleveland work to keep their talent at home.

    There are additional reasons to doubt Chicago’s long-term ambitions to become a global mecca. For one, the city is a lonely snowman in the age of air conditioning. Between 2000 and 2012 nearly every city in the southern US grew its metropolitan region by at least 30 percent. Even hot growth cities in the North like Columbus and Indianapolis couldn’t match that pace. Since air conditioning became a norm rather than an exception, growth has overwhelmingly trended toward warmer climates. In the last 50 years, half of the population growth in the US went to the eight states with the warmest climates, while the eight coolest states attracted just 3% of that total.

    A second area of concern is that the exponential power of a centralized city has diminished. The city of Chicago is now home to just seven of the region’s 28 Fortune 500 companies. The city of a dominant core and residential periphery is being squashed by the realities of preferences.

    Rather than settle on being the bland and livable capital of the Midwest, Chicago has instead opted to try to wage battle with the likes of London and Rome, and it may have a tough time winning. It’s clear that such worldly ambitions are contingent on growing both residents and tourists.

    The city might do well to begin with a humbler approach that focuses on serving its current residents. The primary things Chicago has going for it are its comparative affordability to other large cities, and the perception that it’s composed of friendly people. These traits are largely antithetical to most megacities. Rather than pursue a path on which it could lose these unique assets, Chicago should capitalize on them.
    In addition to remaining affordable, the city should take easy steps to be more family friendly, a quality it currently lacks because of horrifically high crime and subpar schools.

    Of the city’s out-migration in the last decade, an overwhelming amount was by families, especially from its African American community. If Chicago invested in creating average schools out of its failing ones, rather than closing the bad ones while expanding the great ones, it might retain some of the people who are fleeing the city. Generating even passable middle and high schools alone might be enough to convince companies that adequate talent exists to launch the kinds of job training and manufacturing centers that could start to revitalize neighborhoods in the city’s job-depleted areas.

    It could also zone parts of the city with declining populations more in the way that suburbs do. High density development need not be the only considered path forward. Chicago’s geographic constraints already make it difficult to find spacious low-density housing within a reasonable distance of the center city, so it might help revitalize neighborhoods if low density development were permitted on the city’s struggling south and west sides.

    The city should also consider decentralizing its public transportation infrastructure. Chicago’s core transit system is designed around an outdated jobs model that focuses all lines toward the center of the city. The result is that while overall commute times are fairly low, just 6.3% of jobs can be reached within 45 minutes on public transit.

    Finally, the city shouldn’t lose sight of its manufacturing legacy just because yuppies are moving in. Chicago’s greatest assets include its positioning as an infrastructural crossroads, and this is of great value to industry.

    If it did these few things better, the city might find itself losing far fewer residents, and not relying so heavily on narrow groups of in-migrants. If not, existing preoccupations with international fame may cause Chicago to lose its appeal, while other American cities accelerate faster.

    Roger Weber is a city planner specializing in global urban and industrial strategy, urban design, zoning, and real estate. He holds a Master’s degree from the Harvard Graduate School of Design. Research interests include fiscal policy, demographics, architecture, housing, and land use.

    Flickr photo by Chris Smith: Pritzker Pavilion, Millennium Park

  • Urbanist Goals Will Mean Fewer Children, more Seniors Needing Government Help

    America’s cognitive elites and many media pundits believe high-density development will dominate the country’s future.

    That could be so, but, if it is the case, also expect far fewer Americans — and far more rapid aging of the population.

    This is a pattern seen throughout the world. In every major metropolitan area in the high-income world for which we found data — Tokyo, Seoul, London, Paris, Toronto, New York, Los Angeles, and the San Francisco Bay area — inner-core total fertility rates are much lower than those in outer areas.

    For example, inner London, notes demographer Wendell Cox, has a fertility rate of 1.6 children per female, which is well below the replacement rate of 2.1.

    The total fertility rate is the average number of children born to women between 15 and 44 years old. In the outer reaches of London, this rate hits 2.0, one-fourth higher.

    In Sydney, Australia, where increasing population density is a sworn goal of planners, the inner city now has a fertility rate of 0.76, compared to 2.0 or more in the outer suburbs.

    Nowhere is the confluence of high density and high prices more evident than East Asia. This region is now home to some of the lowest fertility rates on Earth.

    Take Seoul, South Korea, a paragon of high-density development where high-rise buildings dominate even on the periphery.

    Seoul’s fertility rate is about 1.2, similar to rates found in Tokyo, Singapore and Hong Kong. This is the kind of place urban planners often cite as a role model.

    A recent glowing report in Smithsonian Magazine heralded Seoul as “the city of the future.” Architects, naturally, join the chorus. In 2010, the International Council of Societies of Industrial Design named Seoul the “world design capital.”

    Yet the real frontier of ultra-low fertility may now be coastal China. Both Shanghai and Beijing have fertility rates of roughly 0.7, almost one-third of the replacement rate. Overall, China’s cities have a fertility rate under 0.9.

    Gavin Jones, a leading demographer of Asia, suggests that despite recent easing of China’s one-child policy, the world’s second leading economic power is experiencing a dramatic slowdown in its birthrate.

    In places such as Taiwan, Hong Kong, Tokyo and Singapore, more than one-quarter of women will never marry and even more will never have children.

    The result, Jones suggests, will be a society made up increasingly of single people, one-child families and very old people.

    In less than four decades, according to United Nations projections, Japan will have more people over 80 than under 15.

    This may present more of a challenge to Japan in the future, one professor suggests, than the rise of China. Indeed, over time, notes Jones, the same process will be seen across East Asia, as well as parts of Europe, as the anti-marriage and post-familial trends accelerate.

    “This won’t get better in the future,” he suggests. “The decline is just starting and it’s expanding to other areas, and the process seems inexorable.”

    For now, America, with a fertility rate of 1.89, stands in somewhat less distress, but that could be changed by increasing urban density — the very policy widely adopted by pundits and planners and broadly endorsed by urban developers.

    As Cox has shown, localities with higher densities and higher prices — the two are often coincident — have considerably lower birth rates than areas with lower prices.

    This becomes even more evident when one considers the segment of the population between 5 and 14 years old, when children enter school.

    In 2012, urban areas with the highest percentage of children are predominately lower density and lower cost, including Houston, Dallas-Fort Worth, Riverside-San Bernardino, Atlanta, and Phoenix.

    Urban areas with the lowest percentage of people in these age groups were also the New Urbanist exemplars, such as Boston, San Francisco, New York, and Seattle.

    The geographical nature of low fertility becomes even more clear in maps developed by demographer Ali Modarres.

    These maps show the percentage of households without children present. In regions such as New York, San Francisco, Seattle, D.C. and Chicago, the message is clear: much lower fertility rates in the denser urban cores.

    Maps Source: Demographer Ali Modarres, chair of urban studies at the University of Washington at Tacoma, using data from U.S. Census American Community Survey 2010

    In virtually every case, family size expands the closer one gets to the periphery; in contrast, some of the inner rings show fertility rates that approximate those seen in the hyper-dense Asian regions.

    What this suggests is that a continued focus on forcing Americans to abandon their suburban lifestyles will have a profound impact on the nation’s future competitiveness.

    An aging America will lose much of its current advantage in terms of vitality of our markets and labor force, and will be forced, like many East Asian and European countries, to invest ever more resources to take care of an aging population.

    Yet don’t expect this to affect the planners, environmentalists and their allies in real estate development, who hope to harvest windfall profits by urging and even forcing people to embrace high-density living.

    Their gain will not be to America’s advantage and will consign future generations to persistent slow growth, greater debt and a kind of societal malaise as the family fades in the face of ever greater emphasis on individualism.

    At the same time, an expanded state will be needed to keep the old folks alive in the absence of traditional networks of children and relatives.

    This piece originally appeared at The Washington Examiner.

    Joel Kotkin is executive editor of NewGeography.com and Distinguished Presidential Fellow in Urban Futures at Chapman University, and a member of the editorial board of the Orange County Register. His newest book, The New Class Conflict is now available for pre-order at Amazon and Telos Press. He is author of The City: A Global History and The Next Hundred Million: America in 2050. His most recent study, The Rise of Postfamilialism, has been widely discussed and distributed internationally. He lives in Los Angeles, CA.

    Crossing the street photo by Bigstock.

  • Ranking America’s Top Young Labor Forces: A Rust Belt Rising?

    This is a new report brief from the Center for Population Dynamics at Cleveland State University, download the pdf version here. The report was authored by Richey Piiparinen, Charlie Post, and Jim Russell

    Greater Cleveland ranks 8th nationally in the percentage of 25- to 34-year-olds in the labor force with a graduate or professional degree, ahead of such “brain hubs” as Chicago, Seattle, and Austin. The analysis speculates as to whether or not this is a leading indicator to broader economic growth. Comparisons are made with Boston and Pittsburgh—two metros further along in the economic restructuring process.

    Ranking America’s Young Adult Labor Forces

    A region’s economic prospects are tied to its levels of human capital. The most common proxy for human capital is the educational attainment rate, or the percent of a population that has completed a bachelor’s degree or higher. Figure 1 shows the nation’s largest 40 metros ranked by the percent of residents 18 and over who have completed at least a bachelor’s degree. The Rust Belt metros of Pittsburgh and Cleveland rank 23rd and 31st, respectively.

    But there are issues with measuring educational attainment this way. Metros such as Cleveland and Pittsburgh have larger aging populations due to their settlement histories, and this significantly affects regional educational attainment rates. Why does this matter? Notes Pittsburgh economist Chris Briem1: “I argue all the time that such a metric says little about how well we are doing in recent decades at either educating the population, or on how we are doing at both attracting and retaining folks with higher education.”

    A better way to analyze human capital is through age cohort. Measuring the educational attainment of a region’s 25- to 34-year-olds is a leading indicator when it comes to understanding where a region’s economy is headed. Figure 2 shows the educational attainment rates for the 25- to 34-year-old age cohort. Greater Pittsburgh ranks 7th, moving up 16 spots. Greater Cleveland moves up 6 spots to rank 25th.

    An additional method of examining a region’s skill level is to look at the educational attainment within the labor force, as opposed to population. The rationale for doing so is simple. Regions with proportionally large student populations, like Columbus, Ohio, can have exaggerated talent pools, at least in terms of economic productivity. That is, a college student may live in a region to consume knowledge but not necessarily be employed to produce output.

    To calculate educational attainment in the labor force, data were analyzed for the 25- to 34-year-old cohort from 2013 Current Population Survey2. Figure 3 details the results of this analysis. Pittsburgh ranks 4th, whereas Greater Cleveland moves up to rank 21st. Conversely, Columbus, Ohio drops 13 spots to rank 27th, perhaps suggesting that the region’s large college enrollment isn’t effectively translating into the regional labor market.

    A final analysis examines the percentage of a region’s young adult labor force that is highly skilled, or those with a graduate or professional degree. Slicing the labor force data this way is important in that a region’s highest-skilled workers are drivers of economic growth. Specifically, a metro’s top talent—think engineers, scientists, and doctors—are key agents of knowledge production and transference3, which— when translated into the marketplace—mean new firms and the evolution of existing firms. Those metros that have a high concentration of highly-skilled young adult workers have a head start in the race toward the “next” new economy.

    Figure 4 ranks the metros by the percentage of 25- to 34-year-olds in the labor force with a graduate or professional degree. Pittsburgh ranks 3rd nationally, whereas Greater Cleveland moves up 13 spots to rank 8th, ahead of Chicago, Seattle, and Austin. The implications of these findings are discussed below.

    A Rust Belt Rising?

    Economic restructuring from a labor- to a knowledge-based economy is no easy endeavor. Perhaps no other metro has made this transformation as successfully as Boston. What has driven the region’s evolution from a “dying factory town to a thriving information city”4 has been its gains in human capital. As shown in Figure 5, Boston ranks as an elite metro when it comes to educational attainment rates in both its population and labor force.

    What metro is the “next Boston”? Pittsburgh is a likely candidate. The “Steel City” region is increasingly marrying its legacies of manufacturing and knowledge production, with the evolution of new industries and products to show for it5. Enabling Pittsburgh’s ascent is a highly-skilled young adult workforce that’s rivaling Boston in terms of concentration of human capital (See Figure 5 below).

    here does that leave Cleveland? While the region is far from being the “next Boston”, one can make the case it is trending to be the “next Pittsburgh”. Specifically, a line of emerging thought—and one that will be developed by the Center for Population Dynamics in the coming months in two working papers—is that Cleveland’s 8th-placed ranking in its concentration of young workers with an advanced degree is a harbinger of broader economic growth. While this supposition is exactly that, there are several mechanisms by which this can occur.

    First, it is important to note that there is an industry demand for workers with advanced degrees in Greater Cleveland, else its 8th-place ranking wouldn’t occur. Termed a “magnet city”6, Cleveland’s knowledge economy is forming world-class clusters of expertise that are attracting top talent in key industry sectors, particularly life sciences and advanced manufacturing. In other words, if you want to act, you go to Hollywood. If you want to practice cardiac care or make medical devices you come to Cleveland. The next step for the region is to scale up its emerging economies so that the amassing of knowledge and investment becomes multiplied into the creation of a “thicker, stickier” regional economy.

    Part of this scaling up process relates to the effect that Cleveland’s concentration of highly-skilled workers can have on the local economic ecosystem. To wit, those with advanced degrees are most likely to migrate across state or international lines7. For instance, 29% of newly-arriving immigrants into Cleveland’s Cuyahoga County had a graduate or professional degree8. This means Cleveland’s burgeoning new economy demand is commonly fueled from outside the market. Why does this matter? For a historically insular region like Cleveland, this out-of-the-market knowledge migration brings a deepening of a region’s idea bank, as well as increasing global connectivity. The ability of a region to cross-pollinate ideas and get connected with global markets is crucial in the creation of new firms and emerging industries9.

    Now, what does, for example, a new biotech firm in Cleveland’s Health Tech Corridor mean for the local mechanic, bartender, lawyer, or accountant? A lot actually. Specifically, economist Enrico Moretti found that for every high-skilled job created, an additional 5 jobs are created in the professional or service sector10. What’s more, the job creation goes beyond the local services and taps into semi-skilled professions in emerging industries. For example, a recent Brookings study found that the Cleveland metro ranked 20th out of the nation’s largest 100 metros in the number of workers without bachelor’s degrees employed in pre-baccalaureate health care occupations11.

    Summary

    Perhaps Cleveland is the next Pittsburgh, and Pittsburgh the next Boston. Clarifying this entails analyzing how human capital development and economic restructuring takes place. Simply, is Cleveland’s talent profile today similar to Pittsburgh’s a decade ago, and to Boston’s twenty years prior? Moreover, what policies have been proven effective in translating knowledge production to regional economic growth?

    The Center for Population Dynamics is in the process of answering these questions. The information intends to help Cleveland speed up how quickly tomorrow gets here.

    This is a new report brief from the Center for Population Dynamics at Cleveland State University, download the pdf version here.

    Creative Commons photo “Cleveland Skyline from the Flats” by Flickr.com user Erik Drost.

    ———–

    2 The Current Population Survey (CPS) is a monthly survey of households conducted by the Bureau of Census for the Bureau of Labor Statistics. The monthly workforce educational attainment rate estimates were aggregated for a 2013 annual estimate.

    3 Waters, R. and Smith, H. 2013. High-technology local economies: Geographical mobility of the highly-skilled. In
    Networking Regionalised Innovative Labour Markets; Eds. Hilpert, U and Smith. H. Routledge: New York.
  • Welcome to the Billion-Man Slum

    When our urban pundit class speaks of the future of cities, we are offered glittering images of London, New York, Singapore, or Shanghai. In reality, the future for most of the world’s megacities—places with more than 10 million people—may look more like Dhaka, Mumbai, or Kinshasa: dirty, poverty- and disease-ridden, and environmentally disastrous.

    Harvard’s Ed Glaeser suggests that megacities grow because “globalization” and “technological change have increased the returns to being smart.” And to be sure, megacities such as Jakarta, Kolkata (in India), Mumbai, Manila, Karachi, and Lagos—all among the top 25 most populous cities in the world—present a great opportunity for large corporate development firms and thrilling treasure troves for both journalists and academic researchers. But surely there’s a better alternative to celebrating misery, as one prominent author did recently in aForeign Policy article bizarrely entitled “In Praise of Slums.”

    Bigger is no longer better.

    Let’s start with the idea that, in an urbanizing world, bigger is no longer necessarily better. In a recent study I conducted with Ali Modarres, Aaron Renn, and Wendell Cox for Singapore’s Civil Service College and Chapman University, we ranked cities by importance as global centers. Of the world’s estimated 29 megacities, only a handful made into the top 20. Most leading megacities were either long-established Western cities—Tokyo, New York, London, Los Angeles—or located in booming East Asia, including Beijing, Shanghai, and Seoul.

    Notably missing are fast-growing growing megacities such as Lagos, Karachi, and Dhaka, as well as the 16 additional megacities—mostly in developing countries in Africa and south Asia—that will pass the 10 million mark by 2030. Yet despite their girth, the majority of megacities are not particularly attractive for foreign investors or as locations for regional corporate offices. These firms tend to cluster instead in westernized cities such as Singapore, Hong Kong, or Dubai, and visit places like Jakarta, Manila, and Cairo only when necessary.

    History drives some of this. The great global cities rose as centers of industry and trade, while developing from there an excellence in related services. They created pockets of a more advanced economy to serve the predominately rural hinterland, or in some cases colonial possessions. This imperial relationship spurred the rise of London, Paris, and New York in the early 20th century, and also that of Tokyo, still the world’s biggest city.

    Some new megacities, some such as Guangzhou and Shenzhen (which in 1979 had roughly 30,000 people, compared to its 10.6 million today) have a real economic shot at becoming top global cities due to China’s emergence as the world’s workshop. But, as we explain in a recent paper from Chapman University, this is far less the case for most megacities in the developing world.

    Unlike their Chinese counterparts, these megacities’ expansion has not been driven by economic growth but more by bringing people from their own impoverished countryside into the city. Critically, in contrast to the peasants who came to Tokyo in the ’50s or Shanghai in the ’90s, there is no huge demand for an industrial workforce in cities in South Asia, Africa, or Latin America, where manufacturing is far less prevalent—manufacturing’s share of India’s GDP, for example, is half that of China.

    Here’s the difficult truth: Most emerging megacities, particularly outside of China, face bleak prospects. Emerging megacities like Kinshasa or Lima do not command important global niches. Their problems are often ignored or minimized by those who inhabit what commentator Rajiv Desai has described as “the VIP zone of cities,” where there is “reliable electric power, adequate water supply, and any sanitation at all.” Outside the zone, Desai notes, even much of the middle class have to “endure inhuman conditions” of congested, cratered roads, unreliable energy, and undrinkable water.

    The slums of Bangladesh’s capital, Dhaka, swell by as many as 400,000 new migrants each year. Some argue that these migrants are better off than previous slum dwellers since they ride motorcycles and have cellphones. Yet access to the wonders of transportation and “information technology” don’t compensate for physical conditions demonstrably worse than those endured even by Depression-era poor New Yorkers. My mother’s generation at least could drink water out of a tap and expect consistent electricity, if the bill was paid, something not taken for granted by their modern-day counterparts (PDF) in the developing world.

    More serious still, the slum dwellers face enormous risk from unsafely built environments. Traffic, as anyone who has spent time in these cities easily notices, poses particular threats to riders and pedestrian alike. According to researchers, developing countries now experience a “neglected epidemic” of road-related injuries accounting for 85 percent of the world’s traffic fatalities.

    And don’t drink the water, please. Nearly two-thirds of the sewage in the megacity of Dhaka, with 15 million people, is untreated. As Dr. Marc Reidl, a specialist in respiratory disease at UCLA, puts it, “Megacity life is an unprecedented insult to the immune system.”

    Cities of disappointment.

    Over these environmental problems loom arguably greater social ones. Many of the megacities—including the fastest growing, Dhaka—are essentially conurbations dominated by very-low-income people; roughly 70 percent of Dhaka households earn less than $170 (U.S.) a month, and many of them far less. “The megacity of the poor,” is how the urban geographer Nazrul Islam describes his hometown.

    Inequality is expanding in most of these places. A recent Euromonitor International study found that larger “city size remains the key explanatory factor for income inequalities across the world’s urban agglomerations.” Even megacities that we might refer to as “middle income,” such as Tehran and Istanbul, are becoming what geographer Ali Modarres calls “cities of disappointment.” In many cases, high housing prices and a lack of space have already reduced the birthrate to well below the replacement level. Increasingly, many women are choosing to remain single—heretofore something rare in these countries.

    One scholar, Jan Nijman, suggests that most gains in recent years have accrued to the upper echelons of the middle class in Indian cities while “the ranks of the lower middle income classes have shrunk, and the ranks of the poor have expanded rapidly.” Much of the growth in a perceived middle class, Nijman argues, is based not on income but on consumption driven by credit. The informal sector—drivers, stall-owners, repair-people, household industries—account for much of Mumbai’s employment growth.

    Housing costs are the key here. Researcher Vatsala Pant estimates a monthly total household “middle class income” in Mumbai at 40,000-50,000 rupees; equivalent to less than $1,000 U.S. dollars. Yet monthly salaries for teachers, police officers, and other mid-level jobs are often half that amount. Not surprisingly, even these workers often find themselves living in slum neighborhoods, which are also known as jhopad-patti, jhuggi-jhopadi or busties. “It’s the dream of an immigrant for a place in Mumbai … and ends up with a slum,” she notes.

    Is there a better alternative?

    Future urbanization does not need to pose a choice between rural hopelessness and urban despair. This is a critical issue, even for high-income countries. The rise of a mass of poor slum dwellers—estimated as high as 1 billion—threatens the social stability not only of the countries they inhabit, but the world, as they tend to generate high levels of both random violence and more organized forms ofthuggery, including terrorism.

    Fortunately, an alternative structure of urbanization is beginning to emerge that emphasizes a spreading diversity of cities as opposed to gigantic agglomerations. In the coming decade, McKinsey predicts megacities will underperform economically and demographically, as growth shifts to “fast growing middleweights,” many of them in China and India.

    There needs to be a far greater emphasis on these smaller cities, as well as working to develop a viable economy for the villages. In India, migration to large cities already is beginning to slow, as more potential migrants weigh the costs and opportunities of making such a move as opposed to staying closer to home. This phenomenon has been called “rurbanization” and was an important provision of the campaign of India’s new prime minister, Narendra Modi, who implemented such programs as chief minister of the state of Gujarat. Modi speaks of human settlements with the “heart of a village” and developing “the facilities of the city.”

    A growing array of critics understand the need to break with the megacity mantraAshok R. Datar, chairman of the Mumbai Environmental Social Network and a longtime adviser to the Ambani corporate group, says the emerging megacities of the developing world need to stop emulating the Western model of rapid, dense urbanization. “We are copying the Western experience in our own stupid and silly way,” Datar says.

    He suggests a policy focusing on more human-scale growth. One does not have to be a Gandhian idealist to suggest that Ebenezer Howard’s “garden city” concept—conceived as a response to miserable conditions in early 20th century urban Britain—may be a better guide to future urban growth than the current trend of relentless concentration.

    The “garden city” alternative could help ameliorate the downsides of  mass urbanization in China as well, where the government is seeking to move 250 million more people from the countryside to urban areas over the next decade. “There’s this feeling that we have to modernize, we have to urbanize, and this is our national-development strategy,” said Gao Yu, China country director for the Landesa Rural Development Institute, based in Seattle. Referring to the disastrous Maoist campaign to industrialize overnight, he added, “it’s almost like another Great Leap Forward.”

    As the world urbanizes, we need to start thinking about how to make cities better, not simply bigger. The primary goal of a city should not be to enrich already wealthy landlords and construction companies. It should not be to make politicians more powerful. And it certainly should not be mindless, pointless growth for its own sake. Urbanism should not be defined by the egos of planners, architects, politicians, or the über-rich but by what works best for the most people.

    This piece originally appeared at The Daily Beast.

    Joel Kotkin is executive editor of NewGeography.com and Distinguished Presidential Fellow in Urban Futures at Chapman University, and a member of the editorial board of the Orange County Register. His newest book, The New Class Conflict is now available for pre-order atAmazon and Telos Press. He is author of The City: A Global History and The Next Hundred Million: America in 2050. His most recent study, The Rise of Postfamilialism, has been widely discussed and distributed internationally. He lives in Los Angeles, CA.

    Dhaka photo by Wendell Cox.

  • A Typology of Gentrification

    Patterns of gentrification vary by city, and the spread of gentrified areas is partly determined by the city’s predominant development form and the historic levels of African-American populations within them. Gentrification is a nuanced phenomenon along these characteristics, but most people engaged in any gentrification fail to acknowledge the nuances.

    Spurred on by the recent debate on the impact of limited housing supply on home prices and rents, thereby “capping” gentrification, (taken on fantastically by geographer Jim Russell in posts like this), I decided to do a quick analysis of large cities and see how things added up. The analysis was premised on a couple observations of gentrification, one often spoken and one not. One, gentrification seems to be occurring most and most quickly in cities that have an older development form, offering the walkable orientation that is growing in favor. Two, gentrification seems to be occurring most and most quickly in areas that have lower levels of historic black populations. This less noted observation was the thrust of a study by Harvard sociology professor Robert Sampson and doctoral student Jackelyn Hwang, recently described here. Here’s what they said, after conducting an exhaustive study of gentrification patterns in Chicago:

    After controlling for a host of other factors, they found that neighborhoods an earlier study had identified as showing early signs of gentrification continued the process only if they were at least 35 percent white. In neighborhoods that were 40 percent or more black, the process slowed or stopped altogether.

    That prompted my quick study. I wanted to categorize cities by old and new development forms, and low and high historic levels of black population. To do that I came up with an arbitrary proxy for the age of development form. Using decennial Census data, if a city reached 50 percent of its peak population by 1940, it was deemed to have an old development form; if a city reached 50 percent of its peak population in 1950 or later, it was deemed to have a new development form. Here’s a quick example of how this works. Baltimore, currently with a population of a little over 600,000, reached its peak of 949,000 in 1950. Baltimore reached half its peak, or about 475,000, by 1890, a time at which it could be said that Baltimore’s form as a city had been firmly established. Similarly, Austin reached its peak of 790,000 in 2010. The fast-growing Texas city was half that size in only 1990, a year in which it could be said that its development form was established and the city began to see itself as a major city. Imprecise, yes, but a decent proxy for examining old and new city development forms.

    The second piece of analysis was gathering Census data on central city black populations in 1970. This decade was chosen largely because it represents the end of the Great Migration, when millions of African-Americans left the rural South for cities across the nation. By that time the cities which are generally recognized as having large black populations had already been identified, and it’s possible to explore the impact of the migration on them. I arbitrarily said cities with black populations lower than 25 percent of the total in 1970 had a low black population, and those above 25 percent had a high black population.

    Using those two factors, I put together this table of the 64 primary cities over 250,000 in the U.S.:


    There are more than a few cities that are exceptions, largely because recent consolidations or large-scale annexations have boosted them into more unfamiliar boxes. But some patterns are evident, and if you think of these in terms of gentrification, you might be able to make the following general assumptions:

    Old Form + Low Black Population = Expansive Gentrification (OFLB)
    Old Form + High Black Population = Concentrated Gentrification (OFHB)
    New Form + Low Black Population = Limited Gentrification (NFLB)
    New Form + High Black Population = Nascent Gentrification (NFHB)

    Identifying the examples might be the best way to explain what I mean. New York, San Francisco and Boston are the prototypical OFLB cities, and gentrification has made its widest impact in these three cities. Chicago, Washington and Atlanta are the classic OFHB cities, where gentrification is concentrated in certain areas of the city (or region), and eludes the heavily African-American parts of the city. Phoenix, San Diego and Las Vegas might be the prototypical NFLB cities, all of which came of age with the car as the dominant mode of transport and with few African-Americans. NFLB cities may also be the leaders and innovators in seeking ways to catalyze their inner cities, with greater tangible investments in public transit and mixed use development. The relatively few NFHB cities are a distinctly Southern phenomenon, and by all appearances gentrification activity lags behind other cities, with sprawl still the dominant development engine.


    Cities by gentrification type. Special thanks to Adam Carstens for producing this map.

    Why would any of this matter? Nationally, the gentrification debate is defined by the experiences of the OFLB types like New York, San Francisco and Boston. There, the issues are rapidly growing unaffordability, concerns with displacement and growing inequality. But the gentrification debate is quite different in OFHB cities like Philadelphia and Atlanta, where seeking ways to more equitably spread the positive benefits of revitalization might lead such discussions.

    In other words, it’s not exactly correct to look at what’s happening in Los Angeles or San Diego, or Baltimore or St. Louis, in the New York-San Francisco-Boston context. Different forces and different experiences are creating different outcomes in each city, and if we want to understand how to look at gentrification’s impact, we need to understand its foundations.

    This post originally appeared in Corner Side Yard on August 15, 2014.

    Pete Saunders is a Detroit native who has worked as a public and private sector urban planner in the Chicago area for more than twenty years.  He is also the author of “The Corner Side Yard,” an urban planning blog that focuses on the redevelopment and revitalization of Rust Belt cities.

  • The Problem With Being Global

    The globalization of cities and their elites often comes at the expense of many of the people who live there. Forced to compete with foreign capital and immigrant workers, native-born residents of cities from Los Angeles and London to Singapore often feel displaced, becoming strangers in what they thought was their own place.

    This phenomena is common for virtually all the leading lights on our list of The Most Influential Global Cities. Higher prices and greater labor force competition seem to be the natural result of global city status, posing enormous challenges to local populations and those that govern them.

    Since the late Enlightenment, great cities, often built around markets, were typically places for the aspirational middle and lower classes. The ability to rise in cities from North America and Europe to Asia — through what historian Peter Hall calls “this unique creativity of great cities” — stands as one of the great social achievements of modern times.

    But in this era of powerful oligarchs and growing inequality, these planetary centers are less places for upward mobility than most other cities. This is clearly true in the United States, where its premier global city, New York, as well as its prime competitors for international standing, Chicago, Los Angeles and the San Francisco Bay Area, rank among the 10 most unequal cities in the nation.

    The property market has a distorting effect. Home prices in affordable markets tend to average three times household incomes. The ratio for the top 10 global cities tend to be much higher, often upward of 10 times incomes.

    Pied a terre and investment purchases by wealthy residents of the former Soviet Union, China, the Indian diaspora and the Middle East play a role in this inflation, particularly in London, where an onslaught of Asian buyers, now, by one estimate, purchases 70% of the city’s newly built homes.For young people in London, the possibility of home ownership has begun to evaporate. Regulations that restrict new construction and raise development costs also play a substantial role in the diminishing amount of affordable housing in cities like London, New York and San Francisco.

    The Disappearance Of The Middle Class

    Rising home prices are among the impacts of globalization that tend to force out the middle class. Even in traditionally egalitarian Toronto, a study by the University of Toronto found that between 1970 and 2001 the proportion of middle-income neighborhoods in the core city had dropped from two thirds to a third, while poor districts had more than doubled to 40%. By 2020, according to the study, middle-class neighborhoods could fall below 10%, with the balance made up of affluent and poor residents.

    This leads even usual urban booster to question the direction of their cities, as they lose their counter-culture gloss. As one green journalist laments: “But what are we getting when we throw away height limits and barriers to development, stop worrying about shadows and views, and let the developers loose? Also importantly, who are we getting?”

    The impact of rising prices clearly reshapes societies. In Manhattan, half of households are single, according to the American Community Survey; in the city of San Francisco, there are now 80,000 more dogs than children. Similar trends can be seen in London, Paris, Tokyo, Hong Kong, Singapore and other top global cities. Due to high prices, some 45% of Hong Kong’s middle-class couples have abandoned the idea of having children anytime soon, according to a survey commissioned by Citibank.

    The Jobs Dilemma

    Property prices and development pressures represent just one aspect of how globalization impacts the native working and middle class. The globalized economy often favors the employment of the very skilled, and those who serve them. Many companies, such as in finance, move their middle management jobs to other, less pricey places, from Sioux Falls to India and virtually anywhere else, reducing global cities’ mid-income employment and middle-class populations.

    At its apex, in places like New York and London, the new global economy creates what economist Ajay Kapur calls a “plutonomy,” an economy that revolves around serving the wealthiest. This leaves the primary global cities as centers for both concentrated wealth and the greatest poverty, as we have seen in London, New York and other major global cities.  In New York, over a third of workers labor in low wage, service jobs, a percentage that has increased steadily through the recovery, notes a recent study by the Center for an Urban Future.

    Not surprisingly the luxury cities — the most affluent parts of certain metropolitan areas — tend to have the highest concentrations of inherited and other rentier wealth in the nation, as well as some of the greatest concentrations of poverty. An asset-based recovery, like America’s current one, favors places like Manhattan, but does little for the Bronx, just across the Harlem River, which ranks at the bottom among the nation’s large counties for the percentage of residents’ income that comes from investments, rents and dividends.

    Increasingly, the cores, and often the suburbs, of global cities such as New York San Francisco, London, Paris and other cities where the cost of living has skyrocketed are no longer places where one goes to be someone; they are where you live when already successful or living on inherited largess. They are, as journalist Simon Kuper puts it, “the vast gated communities where the one percent reproduces itself.”

    Political Consequences

    These trends could shape the future of cities socially and politically. In New York, the election of a strong left-wing mayor, Bill de Blasio,reflected the concerns of working- and middle-class Gothamites that they were becoming superfluous in their own town. Similar leftward trends can be seen in Seattle, another city that has experienced widespread gentrification, and recently passed a $15 an hour minimum wage.

    This shift represents, in part, a reaction to the fact that gentrification has done little to address the large and growing population of the poor in many global cities. London may, by recent accounts, have more billionaires than any city on the planet, but it also has the highest incidence of child poverty in the United Kingdom.

    Even many of the lower-end service jobs in restaurants, construction and retail have not redounded to the benefit of the native-born in Britain; more than 70% of the jobs created between 1997 and 2007 in the United Kingdom went to foreigners, according to the OECD. Indeed, economist Tony Travers at the London School of Economics estimated that during the last decade London received more immigrants, many from the rest of the EU, than New York or Los Angeles.

    Cultural Displacement

    The combination of mass migration and the power of the city-hopping global wealthy makes many native-born residents in global cities worried, as one London writer put it, about losing “the soul” of their city.

    This trend can be discerned in almost any global city. A Tommy Hilfiger or other chain store in Causeway Bay in Hong Kong, Fifth Avenue in New York, or Regent Street in London is pretty much like any other. Yet for independent merchants in global cities, the price of being there is often too much to bear. In the process many of the most unique shops and restaurants are displaced by the largely high-end chains that can handle the rent.

    At the same time, globalization and migration have inspired dangerous reactions, notably nativism, and a growing chasm between guest workers and residents. This has become a political issue even in the most cosmopolitan cities such as London, Singapore and the Randstadt (Amsterdam-Rotterdam-the Hague-Utrecht ).

    The fundamental challenge: the global city must accommodate two identities, a global and a local one. A great global city must serve its international role as well as its local economy and the needs of its local residents. A city must be more than a fancy theme park or a collection of elite headquarter towers. It needs a middle and working class, not just the global rich and their servants. It needs families and ordinary residents who may rarely leave town, not just globe-trotters. It needs to be true to itself and the people who, in the first place, created it.

    This piece originally appeared at Forbes.

    Joel Kotkin is executive editor of NewGeography.com and Distinguished Presidential Fellow in Urban Futures at Chapman University, and a member of the editorial board of the Orange County Register. His newest book, The New Class Conflict is now available for pre-order atAmazon and Telos Press. He is author of The City: A Global History and The Next Hundred Million: America in 2050. His most recent study, The Rise of Postfamilialism, has been widely discussed and distributed internationally. He lives in Los Angeles, CA.

    Hong Kong photo by BighStockphoto.com

  • Beyond Polycentricity: 2000s Job Growth (Continues to) Follow Population

    The United States lost jobs between 2000 and 2010, the first loss between census years that has been recorded in the nation’s history. The decline was attributable to two economic shocks, the contraction following the 9/11 attacks and the Great Recession, the worst financial crisis since the Great Depression. Yet, even in this moribund job market, employment continued to disperse in the nation’s major metropolitan areas.

    This is the conclusion of a small area analysis (zip code tabulation areas) of data from County Business Patterns, from the Census Bureau, which captures nearly all private sector employment and between 85 and 90 percent of all employment (Note 1). 

    The small area analysis avoids the exaggeration of urban core data that necessarily occurs from reliance on the municipal boundaries of core cities (which are themselves nearly 60 percent suburban or exurban, ranging from as little as three percent to virtually 100 percent). This "City Sector Model" small area analysis method is described in greater detail in Note 2.

    Distribution of Employment in Major Metropolitan Areas

    County Business Pattern data indicates that employment dropped approximately 1,070,000 in the 52 major metropolitan areas (those with more than 1,000,000 population) between 2000 and 2010. The inner city sectors (the functional urban cores and earlier suburbs) were hard-hit. Together the inner sectors, the functional urban cores and the earlier suburbs, lost 3.74 million jobs. The outer sectors, the later suburbs and the exurbs, gained 2.67 million jobs (Figure 1).

    There were job losses of more than 300,000 in the functional urban cores, and even larger losses (3.2 million) in the earlier suburbs. The functional urban cores are defined by the higher population densities that predominated before 1940 and a much higher dependence on transit, walking and cycling for work trips. The earlier suburbs have median house construction dates before 1980.

    The share of major metropolitan area employment in the functional urban cores dropped from 16.4 percent in 2000 to 16.2 percent in 2010. This compares to the 8 percent of major metropolitan employment that is downtown (central business district) areas. The notion, however, that metropolitan areas are dominated by their downtowns is challenged by the fact that 84 percent of jobs are outside the functional urban cores.

    The largest percentage of major metropolitan areas is clustered in the earlier suburbs, those with median house construction dates from 1946 to 1979. In 2010, 46.8 percent of the jobs were in the earlier suburbs, a decline from 51.4 percent in 2000.

    These losses in employment shares in the two inner city sectors were balanced somewhat by increases in the outer sectors, the later suburbs (with median house construction dates of 1980 or later) and the exurbs, which are generally outside built-up urban areas. The increase was strongest in the later suburbs, where, where employment increased by 2.6 million. The share of employment in the later suburbs rose to 25.5 percent from 21.6 percent. There was also a 600,000 increase in exurban employment. The exurban share of employment rose to 11.5 percent from 10.6 percent (Figure 2).

    The Balance of Residents and Jobs

    There is a surprisingly strong balance between population and employment within the city sectors, which belies the popular perception by some press outlets and even some urban experts that as people who farther away from the urban core, they have to commute farther. In fact, 92 percent of employees do not commute to downtown, and as distances increase, the share of employees traveling to work downtown falls off substantially. As an example, only three percent of working residents in suburban Hunterdon County, New Jersey (in the New York metropolitan area), work in the central business district, Manhattan, while 80 percent work in relatively nearby areas of the outer combined metropolitan area.

    It is to be expected that the functional urban core would have a larger share of employment than population. However the difference is not great, with 16.2 percent of employment in the functional urban core and 14.4 percent of the population. The earlier suburbs have by far the largest share of the population at 42.0 percent. They also have the largest share of employment, at 46.8 percent. The later suburbs have 26.8 percent of the population, slightly more than their 25.5 percent employment share. The largest difference is, as would be expected, is in the exurbs, with 16.8 percent of major metropolitan area residents and 11.5 percent of employment (Figure 3). It is notable, however, that the difference between the share of population and employment varies less than 15 percent in the three built-up urban area sectors (urban core, earlier suburbs and later suburbs), though the difference was greater in the exurbs.

    How Employment Followed Population in the 2000s

    The outward shifts of population and employment are between in the city sectors. In the earlier suburbs, where the population and employment is the greatest, the population share declined 4.3 percentage points, while the employment share declined a near lockstep 4.6 percentage points. The later suburbs had a 4.5 percentage point increase in population share, followed closely a near lockstep 3.9 percentage point increase in employment share. In the exurbs, a 1.5 percentage point increase in the population share was accompanied by a 0.9 percentage point increase in the employment share. The connection is less clear in the functional urban core, where a 1.6 percentage point drop in the population share was associated with a 0.2 percentage point reduction in the employment share (Figure 4).

    The similarity in population and employment shares between the city sectors is an indication that employment growth has been geographically tracking population growth for decades, as cities have evolved from moncentricity to polycentricity and beyond.

    "Job Following" by Relative Urban Core Size

    Similar results are obtained when cities are categorized by the population of their urban cores relative to the total city population. Each category indicates an outward shift from the functional urban cores and earlier suburbs to the later suburbs and exurbs, in both the population share and the employment share. However, the shift is less pronounced in the cities with larger relative urban cores, which tend to be in the older urban regions  (Figure 5). Out of the 18 cities with functional urban cores amounting to more than 10 percent of the metropolitan area, 16 are in the Northeast (including the Northeastern corridor cities of Washington and Baltimore) and the Midwest, where strong population growth ended long ago.

    As usual, New York is in a category by itself, New York, has a functional urban core with more than 50 percent of its population. New York experienced an outward shift of 1.1 percent in its population, and a 0.4 percent outward shift of its employment (the total shift in share, from the urban core and earlier suburbs to the later suburbs and exurbs, expressed in terms of percentage points).

    Generally speaking, the stronger the functional urban core, the less the movement of jobs and people from the center. The actual percentages of functional urban core population by city are shown in From Jurisdictional to Functional Analysis of Urban Cores and Suburbs (Figure 6).

    On average, there was a shift of nearly five percent from the inner sectors (functional urban cores and earlier suburbs) to the outer sectors (later suburbs and exurbs)

    Commute Times: Less Outside the Urban Cores

    The earlier suburbs are generally between the functional urban cores and the later suburbs geographically. As a result, jobs are particularly accessible to residents from all over the metropolitan area. A further consequence is that commute times are shortest (26.3 minutes) in the earlier suburbs, where approximately half of the people also live. Commute times are a bit higher in the later suburbs (27.7 minutes). The exurbs have the third longest commutes, at 29.2 minutes. Finally, commute times are longest in the functional urban cores (31.8 percent), both because traffic congestion is greater (to be expected, not least because of their higher densities), and more people take transit, which is slower (Figure 7).

    The dispersed, and well coordinated location of jobs and residences is one reason that United States metropolitan areas have shorter commute times and less traffic congestion than its international competitors in Europe, Australia, and Canada. All this is testimony to the effectiveness with which people and the businesses established to serve them have produced effective labor markets, which are the most affluent in the world, in which the transaction related impacts of work trip travel time are less than elsewhere.

    Beyond Polycentricity

    These are not new concepts, despite the continuing tendency to imagine the city as a monocentric organism where everyone works in downtown skyscrapers and lives in suburban dormitories. The lower density US city has not descended into the illusion of suburban gridlock that some planners have declared so stridently. Indeed, traffic congestion is considerably less intense in US cities than it is in the other parts of the high income world for which there is data.

    A quarter century ago, University of Southern California economists Peter Gordon and Harry Richardson said that "the co-location of firms and households at decentralized locations has reduced, not lengthened commuting times and distances. Decentralization reduces pressures on the CBD, relieves congestion and avoids ‘gridlock.’"  In 1996 they Los Angeles as "beyond polycentricity" Both of these observations fit well as a description of trends in the 2000s. Most US major metropolitan areas are now "beyond polycentricity," not just Los Angeles.

    Wendell Cox is principal of Demographia, an international public policy and demographics firm. He is co-author of the “Demographia International Housing Affordability Survey” and author of “Demographia World Urban Areas” and “War on the Dream: How Anti-Sprawl Policy Threatens the Quality of Life.” He was appointed to three terms on the Los Angeles County Transportation Commission, where he served with the leading city and county leadership as the only non-elected member. He was appointed to the Amtrak Reform Council to fill the unexpired term of Governor Christine Todd Whitman and has served as a visiting professor at the Conservatoire National des Arts et Metiers, a national university in Paris.

    ——

    Note 1: The Census Bureau describes "County Business Pattern" data as follows: "Statistics are available on business establishments at the U.S. level and by State, County, Metropolitan area, and ZIP code levels. Data for Puerto Rico and the Island Areas are available at the State and county equivalent levels. County Business Patterns (CBP) covers most NAICS industries excluding crop and animal production; rail transportation; National Postal Service; pension, health, welfare, and vacation funds; trusts, estates, and agency accounts; private households; and public administration. CBP also excludes most establishments reporting government employees.

    Note 2: The City Sector Model allows a more representative functional analysis of urban core, suburban and exurban areas, by the use of smaller areas, rather than municipal boundaries. The more than 30,000 zip code tabulation areas (ZCTA) of major metropolitan areas and the rest of the nation are categorized by functional characteristics, including urban form, density and travel behavior. There are four functional classifications, the urban core, earlier suburban areas, later suburban areas and exurban areas. The urban cores have higher densities, older housing and substantially greater reliance on transit, similar to the urban cores that preceded the great automobile oriented suburbanization that followed World War II. Exurban areas are beyond the built up urban areas. The suburban areas constitute the balance of the major metropolitan areas. Earlier suburbs include areas with a median house construction date before 1980. Later suburban areas have later median house construction dates.

    Urban cores are defined as areas (ZCTAs) that have high population densities (7,500 or more per square mile or 2,900 per square kilometer or more) and high transit, walking and cycling work trip market shares (20 percent or more). Urban cores also include non-exurban sectors with median house construction dates of 1945 or before. All of these areas are defined at the zip code tabulation area (ZCTA) level.

    —–

    Photo: Beyond Polycentric Houston (by author)

  • Tracking America’s ‘Hidden Millennials’

    When it comes to attracting the hip and cool, Southern California, long a cultural trendsetter, appears to be falling behind – at least in the view of the national media. Articles about where millennials are, or should be, going rarely mention anywhere in this region as a top choice.

    Rather than hang out at the beach or enjoy poolside ambience, the conventional wisdom is that the millennial generation – those born after 1983 – would rather go anywhere else. Southern California is not on a list of the top 12 regions (although San Diego gets a mention) for millennials, published in the Huffington Post. Other “best” lists and similar compilations invariably highlight New York, San Francisco, Chicago, Austin, Texas, Raleigh, N.C., and Boston, but rarely SoCal.

    What numbers tell us

    But sometimes, before succumbing to conventional wisdom, one has to look at the numbers. We examined the percentages of millennials – we took the ages 20-29 – and their growth in all 52 major U.S. metropolitan areas. To our surprise, Los Angeles-Orange County scored very high – No. 5 – with a 15.5 percent share. That’s well above the 14 percent total nationally. San Bernardino-Riverside, at 15 percent, ranked ninth.

    This research placed Southern California well ahead of such supposed youth magnets as Seattle, Boston, New York and San Francisco, whose population is actually under-represented in terms of millennials. Nor, despite the social media bubble, are things shifting to the denser “hip,” “cool” cities so widely celebrated in the media. In fact, with the exception of Seattle, the Los Angeles area’s rate of millennial growth far outstripped that of Austin, New York, Boston, Chicago and San Francisco.

    Southern California turns out to be more of a youth magnet than one might think. In terms of millennials’ share of population growth, San Bernardino-Riverside ranked second of 52 metro areas, adding 50,000 millennials, an 8.3 percent increase since 2010. Los Angeles and Orange counties – older, settled areas with far lower population growth – together registered 18th, adding 90,000 twenty-somethings since 2010. That’s the most of any metropolitan area, including New York.

    Reality and Perception

    What accounts for this gap between perception and reality? One key factor lies with the media, which, outside Hollywood, has abandoned Southern California. Like many shrinking industries, news media is consolidating in a few strongholds – New York, Washington and, increasingly, San Francisco. Reporters from these cities tend to like (at least for now) dense, urban, transit-dependent places. Many of their friends do, too,rejecting “sprawling, car-dependent cities.” Like it or not, that sums up Southern California.

    Yet, the common assertion that most millennials hate suburbs, cars and “sprawl” may be yet another urban myth promulgated by developers, planners and their handmaidens in the media. It turns out that the percentage of twenty-somethings nationally living in the denser core counties in 2013 is slightly lower than in 2010. The vast majority of millennials, roughly 70 percent, live well outside the core counties, and their numbers grew overall by three times as much over the past three years.

    In fact, virtually all the densest core areas – New York, Chicago, San Francisco, Boston – lost millennials. Everybody’s favorite millennial destination, Portland, Ore., experienced the second-greatest loss of population ages 20-29 in its core county, surpassed only by St. Louis.

    It appears that being part of a “sprawling area,” in fact, does not discourage millennial growth. The fastest-growing millennial regions – San Antonio, the Inland Empire, Orlando, Fla. – are all renowned for spreading out. Instead of living in high-density areas, these millennials reside in apartments and homes distant from the core; many, perhaps one in three, are still at their parents’ houses.

    We refer to them as the “hidden millennials.” They are not the high-profile Brooklyn hipsters and their imitators nationally; nor are they attached to the social media oligarchy around San Francisco. They live far from the iPads of the reportorial class and the promotors of the “hip and cool” urban gospel. They are, for all intents and purposes, invisible in the minds of most media.

    One last thing to keep in mind. Many of these hidden millennials are working-class and minorities. One possible explanation for Southern California’s millennial surge lies with large Hispanic communities, which for three decades have maintained a considerably higher birth rate than that of non-Hispanic whites. Nationally, Latinos constitute 20 percent of millennials, compared with 13 percent of U.S. residents over age 30. In Southern California, Latinos account for slightly over half of twenty-somethings and 37 percent of older cohorts.

    Where do Southern California millennials Live?

    The widely embraced “back to the city core” mantra attributed to millennials is partially true but definitely overstated, particularly in Southern California. To be sure, from 2000-10, Downtown Los Angeles gained more than 4,200 twenty-somethings, an impressive 25 percent increase. But these gains were essentially offset by losses of more than 17,000 in the areas bounded by the South Bay, Southeast L.A. County, West L.A. and the Santa Monica Mountains. As we have seen in many American regions, strong gains of millennials in the core have been counterbalanced by a loss of younger people in the surrounding areas.

    In contrast, the big growth has occurred in places that are not usually associated with hip youth culture. The biggest percentage increases in millennial populations – far higher than for Downtown L.A. – have occurred in various Inland Empire communities, as well as Valencia, the Victor Valley, Irvine and Coachella. In actual numbers, the predominance of these outlying areas is overwhelming. Irvine’s and South Orange County’s gain of more than 19,000 millennials stands out, not to mention the Inland Empire’s gain of 95,000 or even the nearly 20,000 who have appeared in far-flung Valencia-Antelope Valley. Southwestern Riverside County (Temecula-Murrieta-Perris) gained nearly 50,000, the largest of any area subregion.

    Overall, millennial growth in the urban core, with the exception of Downtown L.A., is very slow or even negative. It is also negligible in extra-expensive areas of the Westside and coastal Orange County; high rents and housing prices make these areas increasingly off-limits to all but the most well-heeled millennials. Policymakers, often obsessed with the urban core and its hipster denizens, need to recognize this varied millennial geography. Most of the next generation are not hanging out in cool Hollywood cafes but in malls in the outer periphery or in middle- and upper-middle-class, family-friendly enclaves such as Valencia or Irvine.

    These millennials may be “hidden” but servicing their needs and desires deserves a far more concerted effort by policymakers. This means such things as looking to the periphery for expanding parks, cultural events and educational opportunities that may persuade these millennials to stay and help rebuild this region’s economy.

    The demographic future of Southern California will not be determined primarily on Spring Street or Rodeo Drive but across, literally, hundreds of communities, often far-flung, where the bulk of our twenty-somethings reside.

    This piece originally appeared at The Orange County Register.

    Joel Kotkin is executive editor of NewGeography.com and Distinguished Presidential Fellow in Urban Futures at Chapman University, and a member of the editorial board of the Orange County Register. His newest book, The New Class Conflict is now available for pre-order atAmazon and Telos Press. He is author of The City: A Global History and The Next Hundred Million: America in 2050. His most recent study, The Rise of Postfamilialism, has been widely discussed and distributed internationally. He lives in Los Angeles, CA.

    Wendell Cox is principal of Demographia, a St. Louis public policy consultancy, and a former member of the Los Angeles County Transportation Commission.