Category: Demographics

  • How Professionals Choose Where To Live

    With the growing bifurcation of incomes in America, most regions would prefer, if given a choice, to attract higher-earning professionals to their areas. These people generate more spending in the community and contribute more taxes to the till.

    So, what does it take to get them there?

    The Center for Demographics and Policy at Chapman University just completed a national survey, fielded and tabulated by The Cicero Group, of 1,191 professionals: people aged 25-64 with household incomes greater than $80,000, and who work in education, healthcare, information technology, finance or other professional services jobs. We asked respondents to rate which general non-work factors, which educational and social non-work factors, and which work-related factors were most important to them in determining where they would want to move, assuming an attractive job opportunity presented itself. While there were some differences between different industries, the variances were relative small, in most cases.

    Overall, the results surprised us by how young and middle aged professionals —who are almost uniformly said to prefer living in an edgy, dense urban environment— actually opt for far more traditional, or even banal, alternatives. Professionals are more focused on family lifestyle issues as they consider where they would want to live. While they do not want to live in a cultural wasteland, they prioritize outdoor activities, a lack of crowding and an affordable house over exciting nightlife.

    These preferences are reflected in the real life choices professionals made. Research by Chapman’s Erika Orejola, using 2015 ESRI data, shows that 25 of the top 30 counties with the highest concentrations of individuals earning $75,000 or more are largely or entirely suburban.

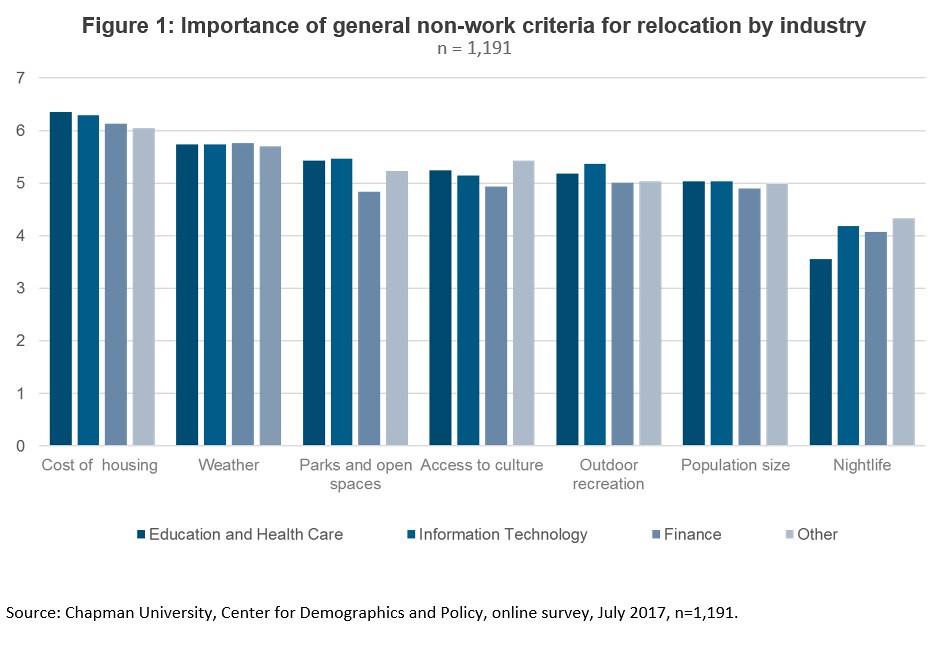
    To understand the professional class’ actual choices —- as opposed to common media stereotypes — the survey is very useful. Figure 1 below summarizes general non-work factors. Housing costs were clearly the most important factor they considered. Weather was second. Parks and open spaces, access to culture, outdoor recreation and population size were clustered together as the next most important variables. People employed in the education and healthcare fields did not consider an area’s nightlife to be as important a criterion for relocation as those in other professions.

    Housing costs, in addition to being an important factor in why professionals move into an area, are also a reason someone removes an area from consideration, as you can see in Figure 2. 37% of professionals say they would eliminate an area from consideration because of its high housing costs.

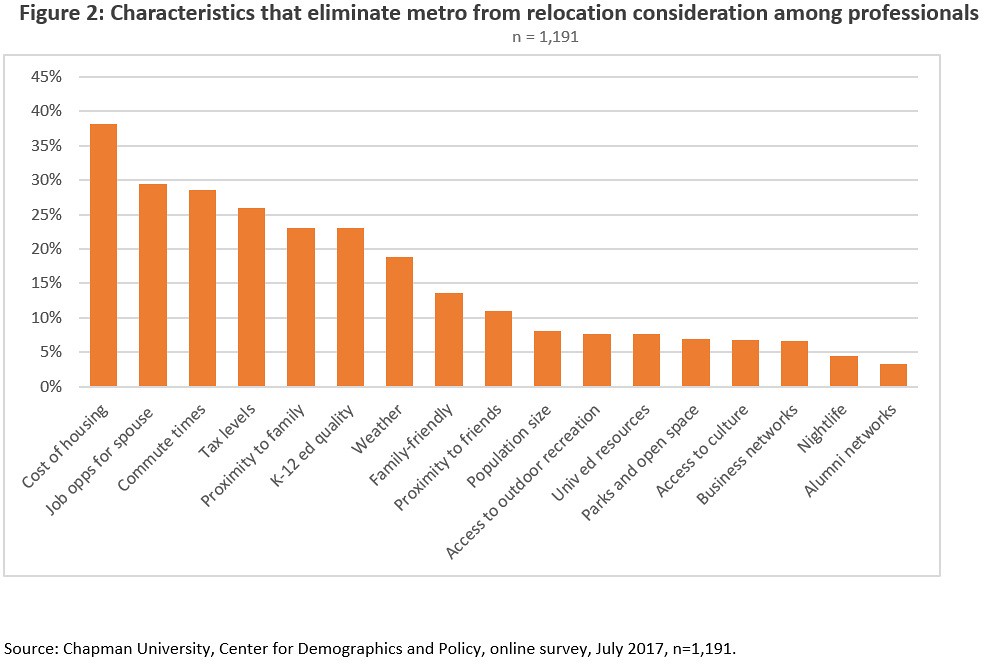
    Professionals often live in two income households. That may explain why lack of “job opportunities for my spouse” was the second most prevalent reason for why people would eliminate an area from consideration. It was cited about as frequently as “commute times” by respondents.

    Looking at other general, non-work variables from Figure 1, we see clearly that many professionals are looking for a more balanced lifestyle in the place they live. People want an area to be of sufficient size to offer interesting cultural alternatives, nightlife and restaurant options. However, they shy away from crowding, places with major traffic problems, and long commute times (which is also addressed in Figure 4.) And they want to be able to relax in what they see as a non-frenetic area with outdoor recreation, parks and open spaces.

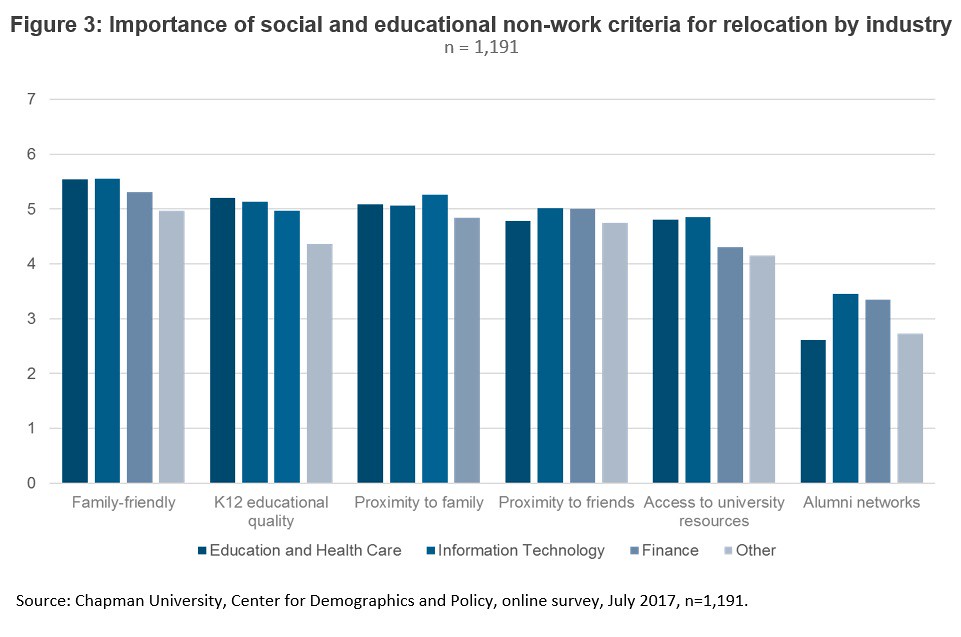
    Professionals we surveyed are clearly family-oriented. As we see in Figure 2, their rating of “family-friendliness”, proximity to family and friends and their kid’s K-12 educational quality ranks top in importance. Access to university resources were deemed to be important, however, access to a professional’s alumni networks was not as much of a priority, something of a surprise. When looked at from the perspective of eliminating a region for consideration, proximity to family was a very important variable, while proximity to friends was much less of a “deal killer”.

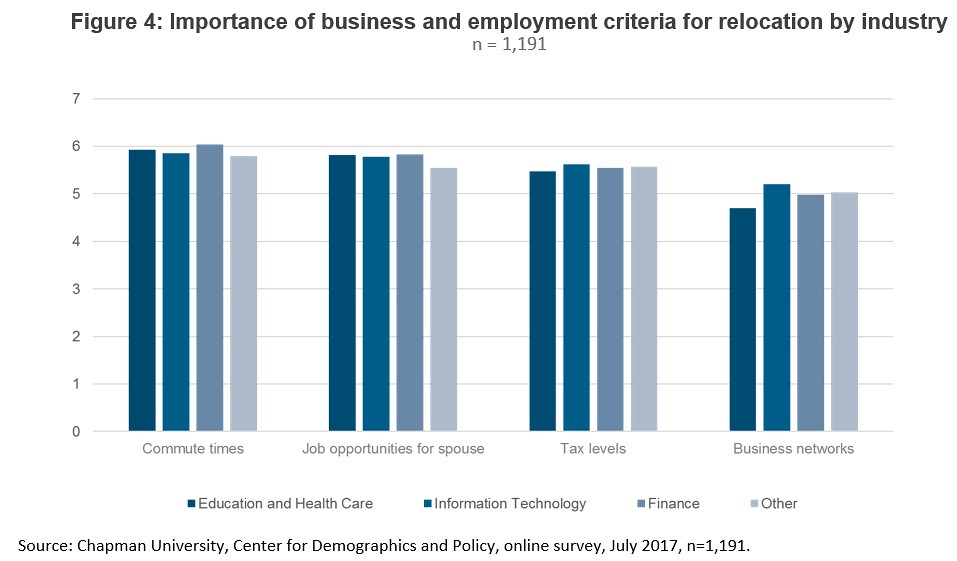
    Looking at work-related criteria in Figure 4, we see that commute time and job opportunities for spouses rank as highly important. As with housing costs, these two criteria are both important in deciding to relocate to an area and a “deal killer” if they are not there. Tax levels are also of high importance to professionals. Given their higher incomes that seems logical. Having strong business networks is almost as important as tax levels, and is of greater concern to people in IT, finance and other professional services areas than it is to education and healthcare professionals.

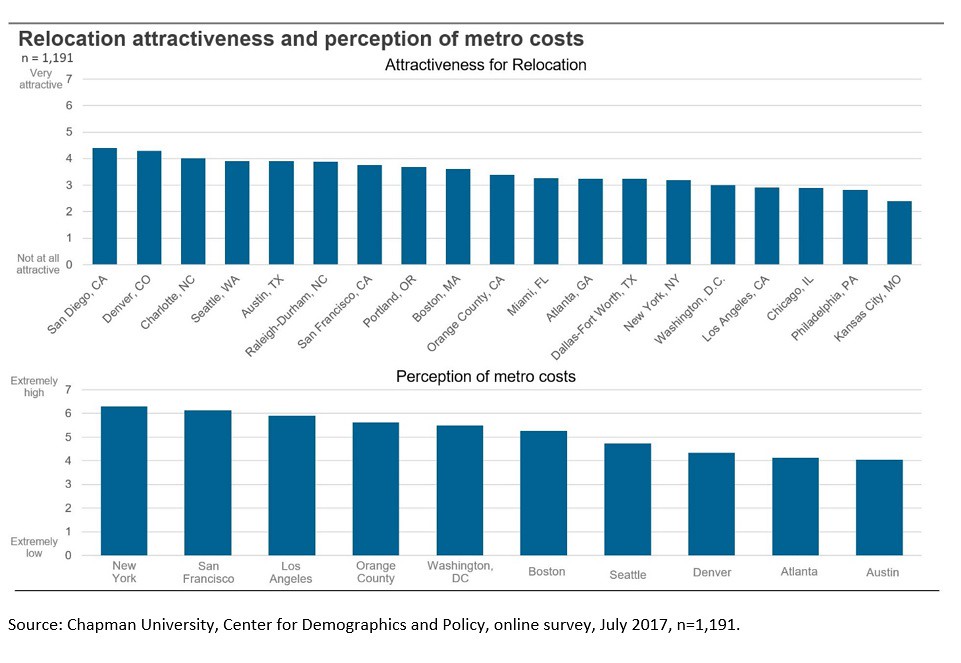
    So, given all of these criteria and deal killers, how do the different metro areas stack up against each other as a magnet for professional talent? We gave professionals a choice of 25 metro areas to choose from. These areas were selected by looking at the census data changes in the past decade and seeing where the highest concentrations of professional jobs were located.

    Looking at Figure 5, we see that professionals view San Diego as the most attractive metro in the country. That may seem counter-intuitive, given the high actual cost of real estate in Southern California and the high tax levels in California in general. However, professionals do not appear to perceive San Diego as being among the top 10 highest cost places to live. That distinction falls to New York, followed closely by San Francisco.

    Denver, Charlotte, Seattle, Austin and Raleigh are next in line in terms of perceived attractiveness overall. Orange County, CA ranks much higher in attractiveness than its northern neighbor, Los Angeles. It is perceived to have the 4th highest cost of living in the country, among places that attract professionals.

    Of significance is the fact that no region actually stands out as the “beauty contest winner” of regions. The highest scoring metro, San Diego, received a 4.3 out of 7 score in attractiveness, indicating that there is no “perfect” in the minds of professionals. To them, there are certain factors that are “must haves”, such as affordable housing, jobs for spouses and reasonable commute times. Rather than obsess over trendy hipsterism, regions seeking to lure professionals need, more than anything, to focus on the basics that shape family quality of life.

    Marshall Toplansky is Clinical Assistant Professor of Management Science at Chapman University. He is co-principal investigator, with Joel Kotkin on “The Orange County Model”, a demographic and econometric research project to identify growth strategies for that region. He is formerly Managing Director of KPMG’s national center of excellence in data and analytics, and is co-founder of Wise Window, a pioneer in sentiment analysis and the use of big data for predictive models. He lives in Orange, California.

  • California Population Lags Behind Projections

    Halfway through the new decade, California, widely seen as an irresistible force for the young and ambitious, is underperforming the state’s own demographic projections. Since 2010 the state’s population grew 5.3 percent from the 2010 census figure, 12 percent below the 6.1 percent increase projected by the California State Department of Finance. The population increased at below projected rates in all of the five metropolitan regions (combined statistical areas, or CSAs and metropolitan statistical areas MSAs, outside the CSAs) with more than 1,000,000 population, except in San Diego.

    This article compares the 2016 US Census Bureau population estimates of areas within California to the corresponding projections by the California State Department of Finance (DOF). The Census Bureau estimates are for July 1, 2016 and the Department of Finance projections are for January 1. As a result, the Census Bureau estimates are compared to the average of the California 2016 and 2017 projections. Moreover, the Census Bureau estimates are used because of their more authoritative nature. DOF calibrates its estimates to those of the Census Bureau at each 10 year national census. It is important to recognize that projections are just that — forecasts that can be significantly off even when demographers take the greatest caution to achieve accuracy.

    The Los Angeles CSA

    The population gain in the Los Angeles CSA was 4.5 percent between the 2010 census and July 1, 2016, 16.0 Percent below the projected 5.4 percent. The Los Angeles CSA includes Los Angeles, Orange, Riverside, San Bernardino and Ventura counties. Among these, only Riverside County exceeded its projection, by 5.1 percent. Los Angeles County fell 27.5 percent short of its projection and Ventura County was 20.3 percent short. San Bernardino County missed its projection by 14.7 percent, while Orange County was 10.3 percent short.

    The San Francisco Bay Area CSA

    The San Francisco Bay Area CSA also gained fewer new residents than expected, with its 7.3 percent increase following 7.5 percent short of the 7.9 percent projection. The San Francisco Bay Area CSA includes seven metropolitan areas: San Francisco, San Jose, Stockton, Santa Cruz, Vallejo, Napa and Santa Rosa. The San Francisco metropolitan area grew 4.2 percent less than its projection. This was driven by a shortfall of 27.9 percent in Marin County, 12.7 percent in San Mateo County and 6.4 percent in San Francisco County. Alameda County did slightly better than expected, while Contra Costa County did slightly worse.

    Santa Clara County, home of San Jose, grew 13.7 percent less than projected. All of the outlying metropolitan areas fell short of their projections, except for Sonoma County, which grew 15 percent more than projected, probably in part due to its having among the least severely unaffordable housing in the area and having good access to employment centers of western Contra Costa County.

    The San Francisco area’s failure to achieve its population projection is significant, given that Plan Bay Area assumed that the Bay Area would grow 54 percent more than the DOF estimates for 2010 to 2040. I raised questions about this assumption in a 2013 report for the Pacific Research Institute, that the failure to use the state projection was likely to exaggerate greenhouse gas emissions in 2040. The suspicion that Plan Bay Area was based on exaggerated population projections appears to be fully justified by the actual population trends.

    San Diego MSA

    San Diego is the only major metropolitan region in the state that is not a combined statistical area. San Diego is unique in having exceeded its population projection for 2016. The margin was small, at 1.6 percent.

    Sacramento CSA

    The Sacramento CSA (California portion), fell short by a relatively small margin, gaining 6.3 percent compared to its 6.5 percent projection (a shortfall of 2.3 percent). Sacramento County, the area’s largest, fell only 1.2 percent short of its projection. The Sacramento CSA includes three metropolitan areas: Sacramento, Yuba City and Truckee.

    Fresno CSA

    Among the larger metropolitan regions, the most dramatic shortfall relative to projections was in Fresno, where the population grew 23.6 percent less than projected, for a gain of 4.9 percent. The Fresno CSA includes Fresno and Madera counties.

    Balance of the State

    Outside the major metropolitan regions, population growth was even less compared to projections. In the San Joaquin Valley, even without Fresno and the Stockton portion of the San Francisco Bay Area CSA, population growth was 24.9 percent below projections. In the rest of the state that growth was 26.2 percent below projection (Figures 1 and 2)

    California’s Slower Growth Persists

    All of this continues the comparatively rapid turnaround of California’s population growth since 2000. Between statehood in 1850 and 1990, California’s population grew no less than 18.6 percent (1970s) and up to 300 percent (1850s). After rising back to 25.7 percent in the 1990s, growth dropped to 10.0 percent in the 2000s, an average of one percent per year. During this decade, it seems unlikely that even that rate will be achieved.

    Since the 2000 census, California’s growth rate has dropped to only 0.84 percent, only a little above the national rate of 0.73 percent. Now it may be on track to start growing slower than the nation. In 2016 California’s growth rate fell below that of the nation for the first time in the decade coming in at 0.66 percent, compared to the national rate of 0.70 percent. Between 2011 and 2016, California’s average population increase was 18 percent above the national rate (Figure 3). Once a beacon for growth, California’s growth is more stagnant than in the past.

    Wendell Cox is principal of Demographia, an international public policy and demographics firm. He is a Senior Fellow of the Center for Opportunity Urbanism (US), Senior Fellow for Housing Affordability and Municipal Policy for the Frontier Centre for Public Policy (Canada), and a member of the Board of Advisors of the Center for Demographics and Policy at Chapman University (California). He is co-author of the “Demographia International Housing Affordability Survey” and author of “Demographia World Urban Areas” and “War on the Dream: How Anti-Sprawl Policy Threatens the Quality of Life.” He was appointed to three terms on the Los Angeles County Transportation Commission, where he served with the leading city and county leadership as the only non-elected member. He served as a visiting professor at the Conservatoire National des Arts et Metiers, a national university in Paris.

    Photograph: San Diego, only major metropolitan region in California to exceed its state population projection 2010-2016 (by author).

  • A Different Kind of Border Wall

    To slow mass migration, stop the illicit capital flight from poor to rich countries.

    An asset manager called ____ Capital recently sent out this email seeking referrals:

    The US Investor visa program allows one to invest $500,000 U.S. in a government licensed fund for a period of about five years and in around 18 months, a conditional green card is attained for the investor and their immediate family. The investor and their family can live, work and study anywhere in the United States and there are no educational, age or English language requirements.

    Most experts report that on September 30th the investment amount will increase from $500k to $1.3m, a significant jump that will price out many potential investors.

    There is still time to file before September 30th if you start your process with ____ Capital now.

    Others can comment on the practice of selling green cards (and ultimately US citizenships) to wealthy foreigners while millions of other applicants, some of whom would be greater contributors to the United States, continue to wait in line for years. Our concern is one step removed and has to do with the legality of this money.

    Give me your rich, but no huddled masses. (photo: populyst)

    It would be unfortunate if foreign money inflows into the US, whether green card-related or not, benefited only a small number of American fund managers and real estate developers while they lowered the standard of living of larger numbers of Americans, for example by crowding them out of some cities because of rising home prices. But it would be doubly unfortunate if some of this money was also illicit, in other words stolen or obtained through dubious maneuvers by corrupt or crony foreign government officials and corporate executives.

    Indeed, to use just one example, the fact that the identity of many buyers in New York’s newest condominiums is cloaked by the use of shell companies is unhelpful to anyone claiming that these vast incoming sums are mostly clean money. For more on this, see Manhattan Ultra-Luxury ‘Battling the Serpent of Chaos’.

    Why Mass Migration

    Before we loop and close this circle, let us examine a very related issue: the mass migration of people from poor countries towards Europe, North America and other wealthy nations.

    When considering the migrant crisis, from the Middle East, Asia and Africa into Europe, or from Asia and Latin America into the United States, the question among policy makers has been on whether and on how to allow or to stop the inflow of people: when, where, how and how many?

    But an antecedent question should be: what in the first place is causing these people to migrate thousands of miles, often at the risk of their own lives? Clearly the answer resides in the poor economies of their home countries. But then what accounts for this poor state of their economies?

    Capital flight must be one of the most important reasons. Modern economics and globalization encourage the free flow of capital. But what if this capital leaving poor countries was ill-obtained? What if it was stolen by corrupt government officials or corrupt corporate executives, or diverted unethically by cronies operating on the margin of legality?

    We do know that wealth and opportunity in many of these countries are hoarded by a small, insecure and often corrupt governing elite. Indeed it is the insecurity that accompanies such hoarding that naturally leads to a significant share of this capital being exported towards jurisdictions where the risk of seizure is deemed to be minimal.

    Yet rich country economies are already awash in capital due to extremely accommodative central bank monetary policy while at the same time poor countries are in dire need of capital to improve their own infrastructure and economy. Simply put, their economies need this money a lot more than ours do. If anything, our own economies may be suffering from too much capital because of extremely low interest rates.

    Closing the Loop

    This then is the reality of today. Rich countries have been on the one hand accepting with open arms the capital coming from poor countries and profiting from it handsomely, and on the other hand balking, to put it euphemistically, at accepting the people from these poor countries who are emigrating in part as a result of this large capital flight.

    The Honest Accounts report estimates that illicit capital outflows from sub-Saharan Africa alone totaled $67.6 billion in a single recent year and that the continent is a net creditor to the world to the tune of $41.3 billion per year.

    One way to think about it then is that migrants are coming to our shores after their country’s money has already come to our shores. As with your typical human being, their search for better living conditions are forcing them to follow the money, some of which happens to be their money. This is not to justify illegal immigration but to explain that it is at least partially a result of our open and undiscriminating stance towards incoming wealth.

    If, as Pope Francis recently stated, corruption steals from the poor, then its younger brother, cronyism, steals from the middle class. Of course, most poor countries don’t have a middle class and their elites therefore often don’t even bother to become cronies. With a weak judiciary, they go directly into corruption, usually with impunity until the levers of power change hands, which is not all that often.

    Parenthetically, it stands to reason that elites in poor countries would not love democracy at home because it reconfigures the power structure every few years in a way that threatens their standing and prosperity. These same elites however do love the democracy and fair play of rich countries because they are the conditions that allow them to safeguard their assets.

    For better or for worse, things are different now due to demographics and technology. For decades, all the power players – government officials, foreign corporations, safe-haven banks – have extracted a large share of wealth because the poor in underdeveloped nations were few, disorganized and largely uninformed. But now they are far more numerous, goaded by smugglers to emigrate, and better informed through the internet. See Working Age Population Around the World to understand the potential magnitude of the migrant issue.

    Where the Money Goes

    The image of the elite from poor countries living in the lap of luxury, jetting to their homes in New York, Miami and London, visiting their financial advisors in Zurich and Cayman, and educating their children at tony private colleges while the masses of their countries subsist in abject poverty, often without sanitation, water or electricity, is so widespread and so real that it has almost become an accepted cliche to most people.

    But to the European and American business and financial elite, the moneyed foreign elite is irresistibly cool, usually not because it is foreign but because it is moneyed and often free-spending. For every American consumer whose appetite for luxury goods is flagging, there may be two or three new wealthy consumers in emerging nations who are eager to collect luxury status symbols. If Louis Vuitton and BMW revenues were to stall in the United States, these firms would merely intensify their focus on new customers in the Middle East, Africa and Asia.

    Foreign elites are also big investors in the United States and Europe. The destination of flight capital is usually one of the following:

    • Banks or financial institutions that offer some secrecy and safety. Historically, this has been private banks domiciled in Switzerland but more recently, it has become any financial institution in an offshore financial center such as the Cayman Islands, Bermuda, Panama, Cyprus, the Channel Islands or other. The Tax Justice Network estimated in 2016 that $12 trillion from developing countries were parked in offshore havens.
    • This capital is then funneled by these banks to asset management firms, be they stock and bond funds, private equity funds or other, to be put to productive use through investments in the public or private markets (see footnotes 1 and 2).
    • Real estate projects in New York, Miami, London, Vancouver and many other places. In 2015, a report by the New York Times estimated that in six of Manhattan’s most expensive buildings, shell companies owned between 57 and 77 percent of the condominiums. (see footnote 3).
    • Other asset classes such as art where funds can be parked safely.

    So, here today, we are faced with this question: is it right to accept into our country another people’s money but to turn away the people themselves? And if we cannot, due to their sheer numbers, accept the people themselves without risking a disruption of our own politics and economics, shouldn’t we then at least turn away the illicit capital that is fleeing their countries? Shouldn’t that capital remain in their countries where it can help them build a better economy and thus remove or reduce their need to emigrate across the sea?

    Given that the number of working-age Africans and Asians is about to swell by hundreds of millions of additional job seekers, it would be prudent for us to encourage the capital originating in their countries to stay at home rather than come to rich countries where it is distorting prices in real estate and other markets. We may not be able to enforce a barrier against all such capital but it behooves us to try and limit the migration of illicit wealth, or to face the inevitable blowback, a human wave of tens of millions of migrants banging on the door to enter the rich world.

    Cruelty plays its hand artfully. Some large beneficiaries of foreign money inflows are also vociferous proponents of greater limits on immigration. These two positions can coexist harmoniously within the same brain only until the connection between the trillions in capital flight and the millions of migrants is exposed in full relief.

    _____________________

    1. Most of the returns on this capital underperform the major stock indices but custodians seem indifferent while they extract their own hefty fees. Meanwhile the owners of the capital don’t worry about a few percentage points of underperformance when their main motive is the safety of the principal. This is the real reason why hedge funds continue to thrive despite delivering poor performance. Their investors are more tolerant of subpar returns because the main alternative is to keep their money in their home countries where they could lose some or all of it in an unfriendly crackdown.

    2. In theory, the Patriot Act required financial institutions to investigate the sources of funds that they receive from foreign countries. But in practice, depositors with no suspected connection to terrorism are ostensibly granted the all clear. Finance firms are simply not staffed or equipped to differentiate between ill-gotten funds and clean funds.

    3. Here too, investors are relatively indifferent to the return they obtain and are merely looking to garage their wealth. Some of New York’s new high-rise condominiums have been called “safety deposit boxes with a view”.

    This piece originally appeared on Populyst.net

    Sami Karam is the founder and editor of populyst.net and the creator of the populyst index™. populyst is about innovation, demography and society. Before populyst, he was the founder and manager of the Seven Global funds and a fund manager at leading asset managers in Boston and New York. In addition to a finance MBA from the Wharton School, he holds a Master’s in Civil Engineering from Cornell and a Bachelor of Architecture from UT Austin.

    Photo by Mstyslav Chernov/Unframe (Own work) [CC BY-SA 4.0], via Wikimedia Commons

  • A New Way Forward on Trade and Immigration

    President Donald Trump’s policy agenda may seem somewhat incoherent, but his underlying approach — developed, in large part, by now-departed chief strategist Steve Bannon — can be best summarized in one word: nationalism. This covers a range of issues from immigration and trade to cultural and ethnic identity, and generally the ones with the most polarizing impact on our political system.

    To many progressives, nationalism is, by its very nature, a dirty word, associated with fascist, Nazi or otherwise repressive regimes throughout history, and tied to violent extremists among the “alt-right,” like the small group of truly “deplorables” that recently surfaced in Charlottesville, Va. Liberal globalists detested Trump’s Poland speech defending Western values. To them, progressive theology matters more than affiliation with political tradition. Assaults on free trade also concern tech and other corporate chieftains, whatever their impact on the American working class.

    Yet, despite his consistently ill-considered rhetoric, Trump is actually about half-right on nationalism. The postindustrial, globalized economy has not worked for most Americans, as judged by their meager income growth. The West is, indeed, threatened not only by Islamic fundamentalists, but also by China, Russia, North Korea and other authoritarian states. In comparison with today’s progressives, the Roosevelts, Truman, Kennedy and Johnson would be considered rampant nationalists.

    Reassessing free trade

    Free trade, the fundamental economic dogma of the global corporate class and its neoliberal allies, has proven, in practice, to be far less benign than “global strategists” suggest. What works for Manhattan or San Francisco has had devastating impacts in more industrially oriented places like the Midwest and much of the South. Overall, notes a recent study from the labor-backed Economic Policy Institute, trade with China has cost an estimated 3.4 million jobs so far this century.

    Commerce Secretary Wilbur Ross points out — correctly — that many leading trading partners, like the EU and China, impose higher tariffs on incoming U.S. goods than what we impose on their exports. China, in particular, seeks to gain advantage over U.S. producers, embracing what William Galston, former policy adviser to President Bill Clinton, calls “technonationalism,” under which a country seeks to extort the surrender of intellectual property in exchange for market access and cold hard cash.

    In this sense, Trump’s hard-line position on trade — and his courting of foreign investors such as Toyota and Mazda — represents a justifiable throwback to the nationalist policies framed by Alexander Hamilton, which persisted until World War II. The problem here, as elsewhere, is that Trump’s pettiness and Twitter inanities allow our trading partners to divert the discussion away from the legitimate issues around international commerce.

    Read the entire piece in the Orange County Register.

    Joel Kotkin is executive editor of NewGeography.com. He is the Roger Hobbs Distinguished Fellow in Urban Studies at Chapman University and executive director of the Houston-based Center for Opportunity Urbanism. His newest book is The Human City: Urbanism for the rest of us. He is also author of The New Class ConflictThe City: A Global History, and The Next Hundred Million: America in 2050. He lives in Orange County, CA.

    Photo by Dirk Dallas, via Flickr, using CC License.

  • Children and Cities

    My wife recently gave birth to our first child. It’s an exciting time – and also one that portends great changes for our future.

    Cities are supposedly hostile to children. But living on the Upper West Side of New York, we’ve experienced nothing but oohs and ahhs over our son. The people in our neighborhood love children. And there are plenty of them around. The UWS is one of those places you could probably classify as a “strollerville.”

    But it’s hard not to notice that while there are lots of very young children here, there are far fewer school aged ones. I don’t have any desire or plans to leave, but I have to recognize that children have a way of changing your priorities. Realistically, most people with school-aged children still seem to move to the suburbs. Those I see raising older kids in the city are generally well-off enough to afford large apartments or even single family homes (in cities like Chicago). They can also either pay the premium to live in a high quality neighborhood school zone or pay the freight for private schooling.

    The number of children in cities, particularly in the dense urban centers were the creative class often congregates, is often low. San Francisco, one of the paradigms of creative class urbanism, has the lowest share of children of any major city at only 13%. The city famously has as many dogs as children.

    This has important implications. These global cities are where the culture is made, where the media are, etc. To the extent that they represent a very atypical demographic profile that largely excludes families with school-aged children, this only perpetuates the “bubble” in which America’s leadership class often lives.

    The values and priorities of people without children are different from those with children. One example is the value people put on space. In our central cities populated with largely people who have no children, a big obsession is changing zoning regulations to allow smaller units, including so-called “micro-apartments.” These kinds of developments would enable more upscale young adult singles to live in cities. That’s good in itself. Yet it is not paired with equal concern about creating more housing for families. What’s more, urbanists are often hostile to changes in the city that would increase child friendliness. For example, central cities often have smaller apartments. One way to create the space families require is to combine units. But people doing just that in Chicago – converting or deconverting multi-flat buildings into single family homes – are opposed by urbanists, who see this as destroying housing supply and reducing density.

    Jane Jacobs saw cities as a superior vehicle for the socialization of children, writing:

    In real life, only from the ordinary adults of the city sidewalks do children learn – if they learn at all – the first fundamental of successful city life: People must take a modicum of public responsibility for each other even if they have no ties to each other. This is a lesson nobody learns by being told. It is learned from the experience of having other people without ties of kinship or close friendship for formal responsibility to you take a modicum of public responsibility for you.

    Yet today cities are increasingly no longer seen as a locus of family life and child rearing, but rather an “entertainment machine” for adults, as Terry Nichols Clark famously labeled.

    There’s nothing wrong with urban centers playing that role as playground for adults and production node in the creative class economy – as long as you recognize the limits that implies. These urban environments are often held up as the model for the future, especially in a world of climate change. But a city without children has no future. To the extent that central cities outsource the rearing of future generations to the suburbs or foreign countries, they cannot plausibly serve as a general-purpose model. The world can have and celebrate its San Franciscos or lower Manhattans, but they will remain a minority of places.

    Aaron M. Renn is a senior fellow at the Manhattan Institute, a contributing editor of City Journal, and an economic development columnist for Governing magazine. He focuses on ways to help America’s cities thrive in an ever more complex, competitive, globalized, and diverse twenty-first century. During Renn’s 15-year career in management and technology consulting, he was a partner at Accenture and held several technology strategy roles and directed multimillion-dollar global technology implementations. He has contributed to The Guardian, Forbes.com, and numerous other publications. Renn holds a B.S. from Indiana University, where he coauthored an early social-networking platform in 1991.

    Photo by Garry Knight, via Flickr, using CC License.

  • California’s Coming Youth Deficit

    Images of California, particularly the southern coast, are embedded with those associated with youthfulness — surfers, actors, models, glamorous entrepreneurs. Yet, in reality, the state — and the region — are falling well behind in the growth of their youthful population, which carries significant implications for our future economic trajectory and the nature of our society.

    The numbers, provided by demographer Wendell Cox, based on U.S. Census Bureau estimates, should concern every business and community, particularly across the high-priced coastal areas. On the other hand, the stronger youthful growth in the interior, notably the Inland Empire, may become the basis for a regional resurgence, given a less draconian state regulatory regime.

    What the numbers say

    Let’s start with the millennials, the population that was aged between 20 and 34 in 2015. Since 2000, the growth of this segment of the population has been, for the most part, very slow along the coastal regions, well below the 6 percent national average. In Los Angeles and Orange County, the youth population grew by roughly 3 percent, about half the national average. San Francisco-Oakland, did a bit better, at 7 percent, but Silicon Valley-San Jose experienced a barely 1 percent increase.

    In comparison, the millennial population of Orlando, Fla., grew by 47 percent, while in Las Vegas it increased by 42 percent. The four big Texas cities — led by San Antonio, with a 43 percent increase — all registered well over 20 percent growth. Rising tech regions, like Raleigh, N.C., saw 30 percent growth — 30 times the rate in Silicon Valley.

    Yet, not all of California is losing out in the coming generation. The fastest-growing region for young people among the 53 largest metropolitan regions is right here in Southern California, the Riverside-San Bernardino area, which saw its 20-34 population expand by a remarkable 47 percent. Another inland standout in California, Sacramento, grew by over 30 percent, far ahead of any of the coastal areas.

    Read the entire piece in the Orange County Register.

    Joel Kotkin is executive editor of NewGeography.com. He is the Roger Hobbs Distinguished Fellow in Urban Studies at Chapman University and executive director of the Houston-based Center for Opportunity Urbanism. His newest book is The Human City: Urbanism for the rest of us. He is also author of The New Class ConflictThe City: A Global History, and The Next Hundred Million: America in 2050. He lives in Orange County, CA.

    Wendell Cox is principal of Demographia, an international public policy and demographics firm. He is a Senior Fellow of the Center for Opportunity Urbanism (US), Senior Fellow for Housing Affordability and Municipal Policy for the Frontier Centre for Public Policy (Canada), and a member of the Board of Advisors of the Center for Demographics and Policy at Chapman University (California). He is co-author of the “Demographia International Housing Affordability Survey” and author of “Demographia World Urban Areas” and “War on the Dream: How Anti-Sprawl Policy Threatens the Quality of Life.” He was appointed to three terms on the Los Angeles County Transportation Commission, where he served with the leading city and county leadership as the only non-elected member. He served as a visiting professor at the Conservatoire National des Arts et Metiers, a national university in Paris.

    Photo by vlasta2 [CC BY 2.0], via Wikimedia Commons

  • Smaller American Cities Need to Focus on Private Sector Job Growth Downtown

    I’m back from a short break. While I was away my debut contribution to City Lab was published. In it I argue that the next frontier for smaller cities (meaning metros in the 1-3 million raise) in their downtown development efforts needs to be a focus on growing private sector jobs.

    There’s a reason it’s call the Central Business District. Commerce is the beating heart of a downtown. Here’s an excerpt:

    For downtowns in major American cities, these are boom times. The urban centers of New York and Chicago boast record high employment. In San Francisco and Seattle, there’s an explosion of residential construction, dining, and entertainment options, as well as a commercial rebirth in high-end, white-collar employment.

    But in many smaller cities, the downtown renaissance doesn’t rest on such solid ground. Look to downtown Cincinnati or St. Louis and you’ll see large growth in residential and entertainment offerings, and major investment in civic spaces and buildings. What you won’t see is the same level of success in becoming growing centers of commerce.

    For decades, jobs have been leaving downtowns and heading to the suburbs. In 2015, a City Observatory report suggested this might be turning around based on 2007-2011 data, but many downtowns were still losing jobs in that time, including Kansas City, Minneapolis, and San Antonio. A 2015 analysis by Wendell Cox found that just six cities were responsible for about three-fourths of all major-city downtown employment growth from 2010 to 2013: New York, Chicago, Boston, San Francisco, Seattle, and Houston. This shows the disparity between the major business and tech hubs and all the rest.

    Click through to read the whole thing.

    This piece originally appeared on Urbanophile.

    Aaron M. Renn is a senior fellow at the Manhattan Institute, a contributing editor of City Journal, and an economic development columnist for Governing magazine. He focuses on ways to help America’s cities thrive in an ever more complex, competitive, globalized, and diverse twenty-first century. During Renn’s 15-year career in management and technology consulting, he was a partner at Accenture and held several technology strategy roles and directed multimillion-dollar global technology implementations. He has contributed to The Guardian, Forbes.com, and numerous other publications. Renn holds a B.S. from Indiana University, where he coauthored an early social-networking platform in 1991.

    Photo: The tallest building in Indianapolis was recently renamed after tech giant Salesforce. Image via Salesforce.com.

  • Forget the Urban Stereotypes: What Millennial America Really Looks Like

    Perhaps no generation has been more spoken for than millennials. In the mainstream press, they are almost universally portrayed as aspiring urbanistas, waiting to move into the nation’s dense and expensive core cities.

    Yet like so many stereotypes — often created by wishful thinking — this one is generally exaggerated and even essentially wrong. We now have a solid 15 years of data on the growth of young people ages 20-34, from 2000 to 2015, which covers millennials over the time they entered college, got their first jobs and, in some cases, started families.

    What The Numbers Say

    An analysis of Census Bureau data by demographer Wendell Cox contradicts much of the conventional wisdom. Take, for example, the #1 region for growth in the number of young people since 2000 (out of the 53 largest metropolitan areas). True, it’s in California, but it’s not San Francisco, Los Angeles or even Silicon Valley; rather, it’s the sprawling Inland Empire (Riverside-San Bernardino), which saw a remarkable 47.7% growth in young people, adding more than 315,000.

    Cities widely seen as millennial magnets — like Seattle, San Francisco, San Jose, Los Angeles, New York and Chicago — did considerably worse. Seattle performed the best among those superstar cities, ranking 15th on our list with a healthy 24.2% growth, adding more than 75,000 young people. The Bay Area lags behind, with San Francisco at #39 with 7.7% growth and San Jose at #49 with growth of barely 1%. Together, the two areas added 78,000 young people — one-fourth the growth of the Inland Empire even though they have roughly twice its total population.

    The performances of New York, Los Angeles and Chicago were also unimpressive. New York (#43) saw growth of 6.2%, slower than the national increase of 12.9%. Los Angeles (#47) did even worse, at 3.3% growth, while Chicago ranked 50th with a meager 0.5% increase in the demographic.

    Housing And Rent Costs

    Behind these developments may well be the rising cost of housing, combined with paltry economic prospects. Young people face an economy that, according to the Luxembourg Income Study, has produced relatively lower incomes and too few permanent, high-paying jobs. New York City reported that the incomes of residents ages 18-29 in 2014 had dropped in real terms compared with those of the same age in 2000, despite considerably higher education levels; rents in the city, meanwhile, increased by 75 percent from 2000 to 2012. According to data from Zillow, rent costs claim upward of 40% of income for workers ages 22-34 in Los Angeles, San Francisco, Miami and New York, compared with closer to 30 percent of income in metropolitan areas like Washington, Dallas-Fort Worth, Houston and Chicago.

    Virtually all the fastest growing millennial locations — including Riverside-San Bernardino and the rest of the top 10 metropolitan areas (Orlando, San Antonio, Las Vegas, Austin, Houston, Sacramento, Jacksonville, Raleigh, Tampa-St. Petersburg) — have even lower housing costs.

    Of course, cheap housing is not enough to attract millennials by itself. They also need jobs, and most of the areas in our top 10, as well as #12 Nashville and #13 Denver, have done well, not just in terms of overall job growth but also in such critical fields as professional and business services. Low-priced cities with mediocre or poor growth — #53 Detroit, for example — have fared worse; the Motor City and its environs have seen their youth numbers drop by 9.3% since 2000, amounting to a loss of more than 83,000.

    What The Future Holds

    A more recent subset of the data, from 2010 to 2015, shows similarities to the broader set, but in this case, it’s booming San Antonio that comes in first. The tech boom has helped boost millennial growth in some markets, such as San Francisco, Boston and San Jose, but as this generation ages, these places seem likely to continue lagging behind the fast-growth markets, which are largely in the Sun Belt.

    There remains a school of thought, particularly in the mainstream media, that millennials have little interest in purchasing homes and will avoid suburbs, and sprawling places, at all costs. Yet more than 80% of people ages 25-34 in major metropolitan areas already live in suburbs and exurbs, according to the latest data. Further, since 2010, nearly 80 percent of population growth in this group has occurred in the suburbs and exurbs, even though the millennials living in urban cores are better educated and more celebrated by the media. Among those under 35 who do buy homes, four-fifths choose single-family detached houses, which are more affordable in the fast-growing cities and suburbs.

    These trends may deepen as these young people enter their 30s. As economist Jed Kolko notes, adult responsibilities tend to make people move to affordable suburbs; the website FiveThirtyEight notes that as millennials have aged, they have actually been more likely to move to suburban locations than those their age in the past. We have already passed, in the words of USC demographer Dowell Myers, “peak urban millennial” and may be witnessing the birth of a new suburban wave.

    Economic Impacts

    Over time, it’s likely that younger workers, oppressed by high housing prices, will continue to follow this pattern as they seek affordability. As shown in a new report from the Center for Demographics and Policy at Chapman University, the decline in the home ownership rate for Californians ages 25 to 34 stands at 25 percent, compared with the 18 percent national loss. In San Francisco, Los Angeles and San Diego, the 25-34 home ownership rates range from 19.6 percent to 22.6 percent — approximately 40 percent below the national average.

    It’s clear that, for the most part, high housing prices lead to out-migration — among millennials and other generations — as illustrated by the continuing exodus from California, indicated by the last two years of IRS data. This follows a national pattern: People leave areas where house prices are higher, relative to incomes, for places that are more affordable, a pattern documented in Harvard research.

    In the end, it boils down to aspirations. At their current savings rate, millennials would need about 28 years to save enough for a 20% down payment on a median-priced house in the San Francisco area, but only five years in Charlotte or three years in Atlanta, according to a study by Apartment List. This may be one reason, a recent Urban Land Institute report notes, that 74 percent of all Bay Area millennials are considering a move out of the region in the next five years. Unwilling to accept permanent status as apartment renters, many millennials, so key to California’s dynamism, could be driven out.

    Millennials represent the nation’s largest living generation, and where they choose to move will shape local economies over the coming years. Although some will likely continue to move to superstar cities like New York and San Francisco, with their evident allures, the bulk of growth in millennial America is likely to take place elsewhere, offering opportunities to those economies that best attract and retain them.

    This piece originally appeared on Forbes.

    Joel Kotkin is executive editor of NewGeography.com. He is the Roger Hobbs Distinguished Fellow in Urban Studies at Chapman University and executive director of the Houston-based Center for Opportunity Urbanism. His newest book is The Human City: Urbanism for the rest of us. He is also author of The New Class ConflictThe City: A Global History, and The Next Hundred Million: America in 2050. He lives in Orange County, CA.

    Wendell Cox is principal of Demographia, an international public policy and demographics firm. He is a Senior Fellow of the Center for Opportunity Urbanism (US), Senior Fellow for Housing Affordability and Municipal Policy for the Frontier Centre for Public Policy (Canada), and a member of the Board of Advisors of the Center for Demographics and Policy at Chapman University (California). He is co-author of the “Demographia International Housing Affordability Survey” and author of “Demographia World Urban Areas” and “War on the Dream: How Anti-Sprawl Policy Threatens the Quality of Life.” He was appointed to three terms on the Los Angeles County Transportation Commission, where he served with the leading city and county leadership as the only non-elected member. He served as a visiting professor at the Conservatoire National des Arts et Metiers, a national university in Paris.

    Photo by Michael Adams [CC BY-SA 3.0], via Wikimedia Commons

  • Increase in Long Commutes Indicates More Residential Dispersion

    A recent New York Times story chronicled the experiences of “extreme commuters,” those who travel two hours or more each way to work. The article focuses on people who commute to New York and notes that there is little or no data on extreme commutes. The Census Bureau, through the American Community Survey (ACS) does not survey two hour commutes. Its maximum classification is 90 minutes or more, though The Times focuses on the 60 minutes and over data, 2013 ACS.

    Regrettably, The Times is not terribly clear in its portrayal of the ACS data, in noting that the 21 percent of residents spend more than 60 minutes getting to work, not mentioning whether it is the New York figure or the national figure. It is New York. The most recent 2015 data shows that only 9.0 percent of US workers spend 60 minutes or more getting to work. The New York metropolitan area figure was 21.4 percent.

    However, The Times picks up on what’s going on in commuting. People are driving farther to qualify to live the lifestyles they prefer. Urban growth continues to be overwhelmingly in the suburbs, approximately 90 percent since 2010.

    Distribution of 90 Minute and Over Commuting

    Despite the frequent portrayal of long commuting as the norm, only 2.2 percent of the nation’s workers travel 90 minutes or more, one way to work. Moreover, that long commuting is concentrated in and near just a few combined statistical areas (CSAs), the larger the larger metropolitan area definition that combines adjacent metropolitan areas like Bridgeport-Stamford with New York, San Jose with San Francisco and Riverside-San Bernardino with Los Angeles. Figure 1 shows that 17 of the 25 metropolitan areas with the largest share of 90-plus minute commuters are in or adjacent to just four combined statistical areas (CSAs).

    Figure 1 shows that 17 of the 25 metropolitan areas with the largest share of 90-plus minute commuters are in or adjacent to just four combined statistical areas (CSAs), the larger metropolitan area region definition that connects places like New Haven County and Fairfield County with New York, San Jose with San Francisco and Riverside-San Bernardino with Los Angeles.

    Seven of the metropolitan areas are in the New York CSA, including New York (NY-NJ-PA), Bridgeport-Stamford (CT), Allentown (PA), Trenton (NJ), Kingston (NY) and East Stroudsburg (PA). The San Francisco CSA has three metropolitan areas among the longest commute metropolitan areas, San Francisco, San Jose and Stockton, as well as adjacent Modesto and Merced. The Washington CSA has four metropolitan areas in the longest 25 commutes, including Washington (DC-VA-MD-WV), California (MD), Hagerstown (MD) and Winchester (VA-WV). Seattle, by far the smallest CSA with more than one metropolitan area in the longest commute CSAs, has two, Bremerton (WA) and Olympia (WA).

    East Stroudsburg (New York CSA) has the largest share of 90 and more minute commuters, at 14.3 percent. Stockton (San Francisco CSA) has the second largest number, a much lower 8.0 percent. Nearby Modesto (adjacent to the San Francisco CSA and a candidate for inclusion after 2020) is at 7.8 percent. Winchester and Hagerstown (Washington CSA) are at 7.3 percent and 7.0 percent respectively.

    None of this is surprising, considering that each of these markets is plagued by urban containment land use policies that force up house prices. Harvard research indicates that domestic migration is being driven by the differential in house prices and people have been leaving the New York, Washington and San Francisco CSAs for other parts of the country. Seattle has done better, simply because its expensive housing is still a bargain compared to the much more onerous house costs in coastal California, from which migrants are being drawn. The trend in long commutes suggests another dimension to the domestic migration story, as households disperse more in the same general area.

    Long Commuting is Expanding

    Further, long commuting is expanding. Between 2005 and 2010, the increases were modest, with a market share rise of 3.0 percent among residents traveling 90 minutes or more to work and 0.3 percent among those traveling from 60 to 89 minutes to work. This is not surprising, given the Great Financial Crisis, which began during that period.

    However, there was a substantial increase in the trend after 2010. Between 2010 and 2015, the share of residents commuting 90 minutes or more increased 725,000, a market share increase of 13.6 percent. There was an increase of 1,550,000 among residents traveling from 60 minutes to 89 minutes, a market share increase of 12.5 percent (Figure 2). This combined increase of nearly 2.3 million 60 minutes plus commuters is substantial. It is more people that commute to work in the San Francisco metropolitan area (not counting those who work at home) and a larger number than the commuters in all but 10 of the nation’s metropolitan areas.

    This continuing dispersion is also indicated in data from the City Sector Model, which shows that suburban and exurban areas continued to attract 80 percent of the new jobs after 2010 (see “America’s Most Suburbanized Cities” and “Suburbs (Continue to) Dominate Jobs and Job Growth”).

    Comparisons by Mode of Travel

    Data by mode of travel is available only at the 60 minutes and over level, and for just 132 of the metropolitan areas. The percentage of those driving alone for 60 or more minutes is lower than the overall 9.0 percent average, at 7.0 percent. Car and van pool commuters are 60 plus commuters 10.7 percent of the time.

    Transit has a far higher level of 60 plus commuting, 38.3 percent at the national level. This is 5.5 times the rate of people driving alone (7.0 percent). While this may be surprising, it is consistent with what is obvious about transit commuting — that it takes about twice as long as commuting by car. And, transit provides scant job access compared to cars, even in the largest, best served metropolitan areas. On average, major metropolitan area resident can reach more than 40 times as many jobs in 30 minutes by car as by transit (the overall one-way work trip travel time is 26 minutes).

    Indeed, among the six metropolitan areas with the “legacy” cores that attract approximately 55 percent of the transit commute destinations in the nation, transit riders much more likely to travel 60 minutes or more to work than those who drive alone. In Philadelphia, the ratio is 3.8, while New York and Chicago transit commuters are 3.6 times as likely to travel 60 minutes or more than those who drive alone. In Boston the figure is 3.1 and San Francisco is 3.0. The smallest difference is in Washington, where transit commuters are only 2.4 times as likely to commute more than one hour than those who drive alone (Figure 3).

    In fact, transit commuters were more likely to travel 60 minutes or more to work than those who drive alone in all of the 53 major metropolitan areas (Table). New York has the largest share of residents commuting 60 minutes or more, at 21.4 percent. Washington is second, at 17.3 percent, San Francisco at 17.0 percent, Riverside-San Bernardino, which is adjacent to Los Angeles, at 16.9 percent and Boston at 14.8 percent. Buffalo, Salt Lake City, Oklahoma City, Kansas City and Milwaukee have the smallest share of their residents traveling 60 minutes or more to work, ranging from 2.5 percent to 2.7 percent.

    More Dispersion?

    The Times article that suggests that the increasing flexibility of companies toward full time working at home could permit people to disperse even more. Despite press reports that working at home is declining, its prospects look good. From 2014 to 2015, working at home experienced the largest increase of any work access mode except driving alone. The increase in work at home was 300,000, while the work at home share rose 5 percent in a single year according to ACS data. Moreover, Global Workplace Analytics reports a 115 percent increase in regular working at home among the non-self employed workforce since 2005, 10 times the increase in the workforce.

    These trends indicate that dispersion is continuing in US metropolitan areas as well as between metropolitan areas, as people seek better standards of living.

    Additional Data

    90 and Over Commute Shares by Metropolitan Area

    60 and Over Commute Shares by Mode by Metropolitan Area

    COMMUTE TIMES 60 & OVER MINUTES BY MODE
    US Major Metropolitan Areas: 2015
    Share by Mode
    All Workers Rank (Longest to Shortest) Drive Alone Transit Transit X Drive Alone
    UNITED STATES 9.0% 7.0% 38.3%          5.46
    Atlanta, GA 13.3%                    7 12.1% 40.5%          3.36
    Austin, TX 7.2%                  24 6.5% 27.9%          4.32
    Baltimore, MD 12.0%                    9 9.5% 46.2%          4.85
    Birmingham, AL 6.5%                  31 5.7% 30.0%          5.31
    Boston, MA-NH 14.8%                    5 11.8% 36.6%          3.11
    Buffalo, NY 3.4%                  53 2.5% 18.0%          7.21
    Charlotte, NC-SC 7.1%                  26 6.3% 33.7%          5.38
    Chicago, IL-IN-WI 14.4%                    6 11.0% 38.7%          3.50
    Cincinnati, OH-KY-IN 4.8%                  42 4.1% 31.7%          7.68
    Cleveland, OH 4.9%                  41 3.7% 33.0%          9.00
    Columbus, OH 4.2%                  46 3.7% 25.1%          6.80
    Dallas-Fort Worth, TX 8.7%                  16 7.7% 43.6%          5.65
    Denver, CO 7.8%                  21 6.2% 38.0%          6.18
    Detroit,  MI 6.8%                  30 6.1% 42.5%          6.95
    Grand Rapids, MI 4.3%                  45 3.6% 25.5%          7.04
    Hartford, CT 5.0%                  38 4.5% 23.0%          5.09
    Houston, TX 11.9%                  10 11.0% 39.0%          3.55
    Indianapolis. IN 5.0%                  39 4.6% 39.4%          8.64
    Jacksonville, FL 5.6%                  34 4.6% 39.6%          8.56
    Kansas City, MO-KS 3.6%                  50 3.2% 21.1%          6.51
    Las Vegas, NV 4.6%                  43 2.5% 45.9%        18.65
    Los Angeles, CA 12.5%                    8 10.8% 40.6%          3.77
    Louisville, KY-IN 4.4%                  44 3.6% 31.3%          8.60
    Memphis, TN-MS-AR 3.8%                  48 3.3% 37.1%        11.25
    Miami, FL 10.0%                  13 8.3% 43.1%          5.23
    Milwaukee,WI 3.8%                  49 2.7% 27.2%          9.89
    Minneapolis-St. Paul, MN-WI 5.5%                  37 4.5% 21.2%          4.68
    Nashville, TN 8.2%                  18 7.7% 29.6%          3.84
    New Orleans. LA 7.9%                  20 6.7% 37.9%          5.64
    New York, NY-NJ-PA 21.4%                    1 11.9% 42.1%          3.54
    Oklahoma City, OK 3.6%                  51 3.1% 7.5%          2.40
    Orlando, FL 6.9%                  28 5.6% 42.8%          7.66
    Philadelphia, PA-NJ-DE-MD 11.4%                  12 9.0% 33.8%          3.78
    Phoenix, AZ 6.8%                  29 5.3% 41.9%          7.95
    Pittsburgh, PA 8.0%                  19 7.3% 20.3%          2.77
    Portland, OR-WA 7.4%                  23 5.2% 28.9%          5.59
    Providence, RI-MA 9.1%                  15 7.3% 54.7%          7.47
    Raleigh, NC 6.0%                  32 5.0% 42.8%          8.61
    Richmond, VA 4.9%                  40 4.0% 33.1%          8.17
    Riverside-San Bernardino, CA 16.9%                    4 15.0% 48.5%          3.25
    Rochester, NY 4.0%                  47 3.1% 32.7%        10.43
    Sacramento, CA 7.6%                  22 6.5% 34.7%          5.37
    St. Louis,, MO-IL 5.8%                  33 4.6% 36.3%          7.85
    Salt Lake City, UT 3.5%                  52 2.1% 23.3%        11.34
    San Antonio, TX 6.9%                  27 5.8% 41.5%          7.17
    San Diego, CA 7.2%                  25 5.6% 37.5%          6.73
    San Francisco-Oakland, CA 17.0%                    3 12.5% 37.2%          2.97
    San Jose, CA 9.4%                  14 7.5% 48.1%          6.43
    Seattle, WA 11.8%                  11 8.9% 33.6%          3.78
    Tampa-St. Petersburg, FL 8.4%                  17 7.9% 33.2%          4.22
    Tucson, AZ 5.5%                  36 3.7% 29.5%          7.99
    Virginia Beach-Norfolk, VA-NC 5.6%                  35 4.8% 40.1%          8.35
    Washington, DC-VA-MD-WV 17.3%                    2 13.9% 35.7%          2.57
    Derived from American Community Survey, 2015

    Wendell Cox is principal of Demographia, an international public policy and demographics firm. He is a Senior Fellow of the Center for Opportunity Urbanism (US), Senior Fellow for Housing Affordability and Municipal Policy for the Frontier Centre for Public Policy (Canada), and a member of the Board of Advisors of the Center for Demographics and Policy at Chapman University (California). He is co-author of the “Demographia International Housing Affordability Survey” and author of “Demographia World Urban Areas” and “War on the Dream: How Anti-Sprawl Policy Threatens the Quality of Life.” He was appointed to three terms on the Los Angeles County Transportation Commission, where he served with the leading city and county leadership as the only non-elected member. He served as a visiting professor at the Conservatoire National des Arts et Metiers, a national university in Paris.

    Photograph: New Jersey Transit Commuter Train (by author)

  • Ontario’s Labor & Housing Policies: US Midwest Opportunities?

    The Globe and Mail, a Canadian national newspaper, reports concerns raised by Magna International, Inc. that proposed provincial labor legislation (the “Fair Workplaces Better Jobs Act”) could result in seriously reduced economic competitiveness for Ontario, Canada’s most populous province (“Magna says new Ontario labour bill threatens jobs, investment”). Ontario accounts for about 40 percent of the Canadian economy and has approximately twice the gross domestic product of second ranking Québec. Magna is Canada’s largest employer in the automotive sector, which The Globe and Mail characterizes as “one of a handful of homegrown Canadian companies that have risen to the status of global giants.”

    Magna told the provincial parliamentary standing committee on finance that “For the first time in our 60 year history, we find ourselves in the very untenable position questioning whether we will be able to operate at historical levels in this province.” Stressing the need to remain competitive, the company added: “This is especially important when our main competitor to the south is working harder than ever to reduce costs, regulatory burdens and promote business efficiency and productivity. From our perspective, the province of Ontario seems to be moving in the opposite direction.”

    The proposed legislation would increase mandatory annual vacation and personal leave requirements and increase the minimum wage. The legislation would also reduce work scheduling flexibility. This would, according to Magna, make the “just in time” production “impossible,” in a North American industry that has used the practice to compete more effectively. According to Automotive News, Magna noted the difficulty of manufacturing where it calls the cost of electricity, payroll and pension costs and the provincial “cap and trade” policy are among the highest in the G-7. Magna said that the “Fair Workplaces Fair Jobs Act” is “extremely one-sided.

    At the same time that Ontario seems poised to make business investment more difficult, some key nearby US states are doing the opposite. Michigan, Indiana and Kentucky, all on the NAFTA Highway (Interstate 69) have enacted voluntary unionism laws (called “right to work”). Ohio has reduced taxes among the most of any state over the past five years. None of these states seems inclined to follow Ontario’s example. Another nearby regulation liberalizing state, Wisconsin (where voluntary unionism was also enacted), has just won the $10 billion first US plant to be built by China’s large electronics contractor Foxconn, edging out Ohio.

    Becoming Less Competitive: Ontario’s Housing Regulation

    Ontario’s competition threatening actions are not limited to business and labor policy. Land-use and housing policies are also making Ontario less competitive, first in the Toronto metropolitan area and now spreading across the province. About a decade ago, the province imposed its “Places to Grow” program that not one, but two urban containment boundaries. The highly publicized Greenbelt designates a huge swath of land on which development is not permitted.

    Then there is the second urban containment boundary, the “settlement boundary,” which largely ensures that new development is limited to a far smaller area around the urbanization, further intensifying the price-escalating impact of the Greenbelt. In this crazy quilt of regulation, land owners operate in a sellers’ market, able to drive prices up for their scarce holdings, to the detriment of home buyers. This environment is particularly welcome to speculators. Consistent with the fundamentals of economics, urban containment boundaries lead to higher land prices where new housing is permitted, and higher house prices.

    The procedures for supplying sufficient new greenfield development land require amendments of official community plans, a slow and cumbersome bureaucratic process. It is not surprising that Mattamy Homes Founder and CEO Peter Gilgin told Bloomberg that despite his largest homebuilding firm in the Toronto area having plenty of land for new houses, the necessary approvals are very difficult to obtain.

    The effects on house prices have been dramatic. In 2004, Toronto’s median house price was 3.9 times its median household income (median multiple). At that point, it had actually been reduced from 4.3 in 1971 and had hovered around 3.5 in the intervening years. According to the 13th Annual Demographia International Housing Affordability Survey, by 2016 house prices virtually doubled relative to incomes, with a median multiple of 7.7. This means a lower standard of living and greater relative poverty.

    Meanwhile, the house price increases are spreading from Toronto to nearby metropolitan areas. For example, house prices in Kitchener – Waterloo, Canada’s “Silicon Valley” rose 40 percent in the single year ended April 2017. This is nearly double the rate of Toronto that over the same period.

    The most recent domestic migration data indicates that people are moving out of the Toronto metropolitan area in droves. Since the 2011 census, more than 125,000 more people have left the Toronto area for other parts of Ontario that have moved in. This is the same dynamic apparent in the United States, where differentials in housing affordability have been cited as a principal reason for domestic migration gains and losses, as households flee from higher cost to lower-cost areas.

    A recently imposed foreign buyers tax led to somewhat lower prices in the Toronto area last year, but they are still 6.3 percent above a year ago and rising at a rate three times that of average earnings. Without restoring the competitive market for land on the periphery, it is likely that house prices will continue rising relative to incomes, to the detriment, in particular, of younger households.

    Meanwhile, house prices are substantially lower in US states nearby Ontario. As late as the mid-2000’s, there was little difference between the housing affordability across Ontario, including Toronto, and the Michigan, Ohio, Indiana and Kentucky. That is no longer the case.

    Immigration laws, however, do not permit the free movement of labor across the Canadian-US border, so there is no likelihood that Ontarians will move to the United States for lower cost housing. But capital is far more mobile. Companies that develop new business locations, especially manufacturing, often locate where they can maximize returns for their shareholders. Moreover, companies establishing new facilities are also interested in their employees being able to live close enough to commute to the plant.

    Figure 1 shows the metropolitan area housing affordability, measured by the median multiple, for Toronto, as well as major metropolitan areas in the four nearby states. Residents of Cleveland and Cincinnati pay nearly two-thirds less of their income for their houses than do residents of Toronto. In Indianapolis, Detroit, Grand Rapids, Columbus and Louisville, residents pay approximately 60 percent less for their houses than in Toronto. Meanwhile, no one should confuse the sometimes characterized as decrepit city of Detroit, reeling from decades of misgovernance, with its leafy suburbs, where 85 percent of the metropolitan area’s people live.

    Figure 2 indicates that things are a bit better among other Greater Golden Horseshoe metropolitan areas. Residents pay from 4.7 to 5.0 times their incomes in Brantford, Barrie and Peterborough. This is still up to double the 2.5 times incomes that residents pay in Toledo (Ohio) and Fort Wayne (Indiana). House prices are slightly higher in Dayton and Kalamazoo, but still at least than 40 percent below the three Ontario metropolitan areas.

    The Need for Competitive Policies

    Maintaining economic growth and the standard of living is important to Ontario’s 14 million people. At the same time, the world is becoming more competitive. Ontario needs to be careful, or economic development departments from across the increasingly competitive states of the Midwest could reap a harvest in business investment and jobs.

    Wendell Cox is principal of Demographia, an international public policy and demographics firm. He is a Senior Fellow of the Center for Opportunity Urbanism (US), Senior Fellow for Housing Affordability and Municipal Policy for the Frontier Centre for Public Policy (Canada), and a member of the Board of Advisors of the Center for Demographics and Policy at Chapman University (California). He is co-author of the “Demographia International Housing Affordability Survey” and author of “Demographia World Urban Areas” and “War on the Dream: How Anti-Sprawl Policy Threatens the Quality of Life.” He was appointed to three terms on the Los Angeles County Transportation Commission, where he served with the leading city and county leadership as the only non-elected member. He served as a visiting professor at the Conservatoire National des Arts et Metiers, a national university in Paris.

    Photograph: Pearson International Airport (Mississauga, Brampton and Toronto), Canada’s Largest employment centre (by author)