The 52 major metropolitan areas of the United States are, in aggregate, approximately 86 percent suburban or exurban in function. This is the conclusion from our new City Sector Model, which divides all major metropolitan zip codes into four functional categories, based on urban form, population density and urban travel behavior. The categories are (1) Pre-Auto Urban Core, (2) Auto Suburban: Earlier, (3) Auto Suburban: Later and (4) Auto Exurban. It is recognized that automobile-oriented suburbanization was underway before World War II, but it was interrupted by the Great Depression during the 1930s and was small compared to the democratization of personal mobility and home ownership that has occurred since that time.
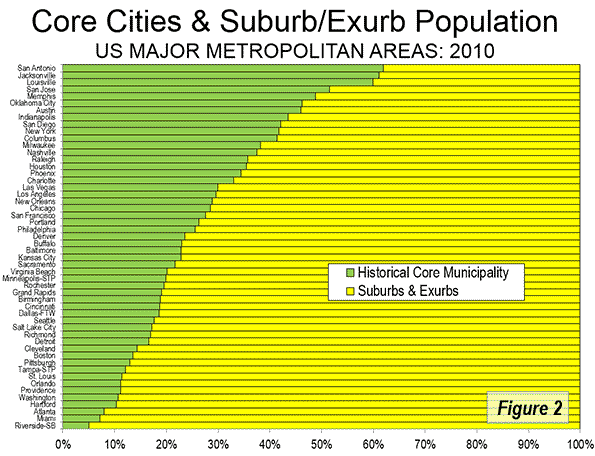
For decades there has been considerable analysis of urban core versus suburban trends. However, for the most part, analysts have been jurisdictional, comparing historical core municipalities to the expanse that constitutes the rest of the metropolitan area. Most core municipalities are themselves substantially suburban, which can mask (and exaggerate) the size of urban cores.
The Queen’s University Research
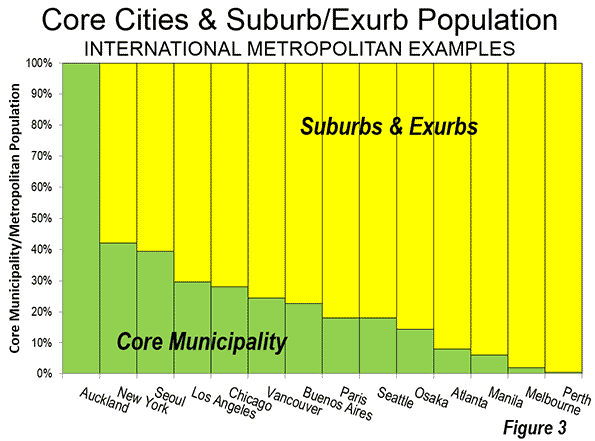
The City Sector Model is generally similar to the groundbreaking research published by David L. A. Gordon and Mark Janzen at Queen’s University in Kingston Ontario (Suburban Nation: Estimating the Size of Canada’s Suburban Population) with regard to the metropolitan areas of Canada. Researchers used travel behavior (journey to work data from the 2006 census) and density for classifying metropolitan areas into four sectors, (1) Active Core, (2) Transit Suburbs, (3) Auto Suburbs, and (4) Exurbs. The active core was that portion of metropolitan areas with a high share of work trip travel by walking and cycling. I covered the research in a newgeography.com article last autumn.
Gordon and Janzen concluded that the metropolitan areas of Canada are largely suburban. Among the major metropolitan areas of Canada, the Auto Suburbs and Exurbs combined contain 76 percent of the population, somewhat less than the 86 percent we found in the United States.
The City Sector Model follows the same general approach as the Queens University research, although there are important differences. For example, the City Sector Model is principally aimed at identifying the Pre-Auto Urban Core component of the modern metropolitan area and does not identify an active core.
All US Major Metropolitan Area Growth Has Been Suburban and Exurban
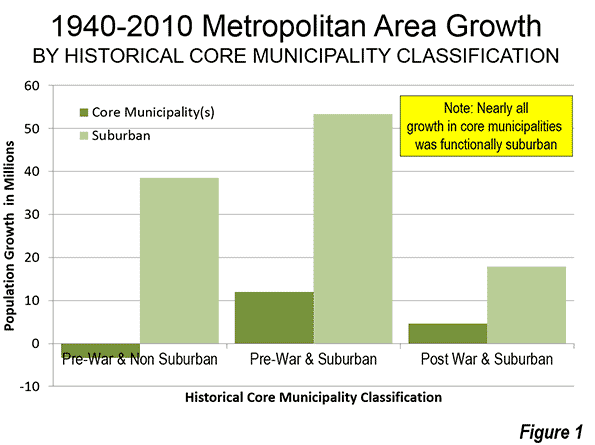
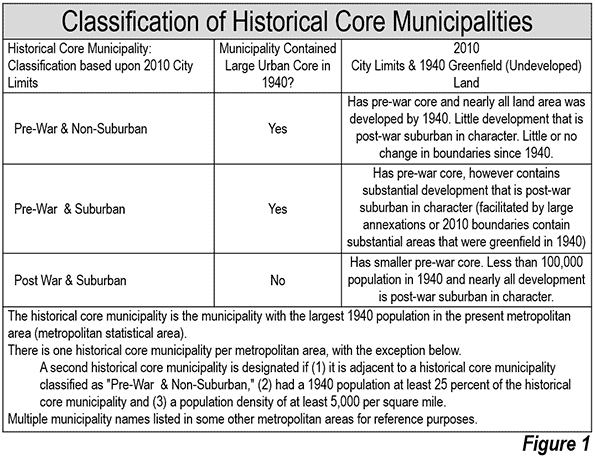
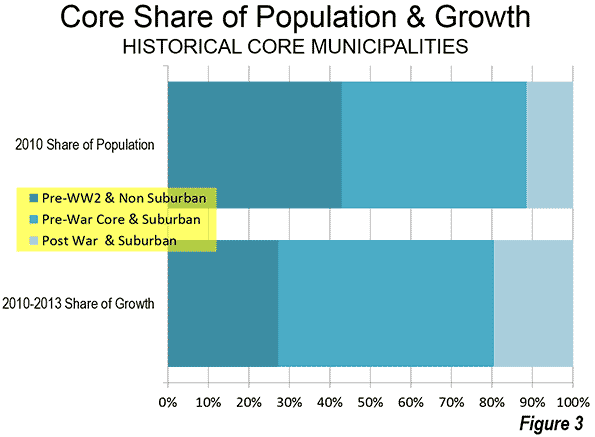
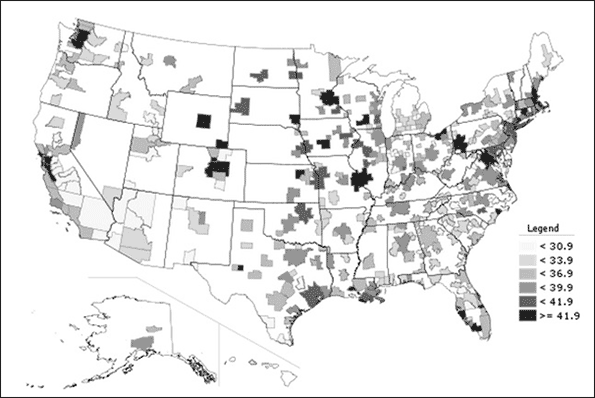
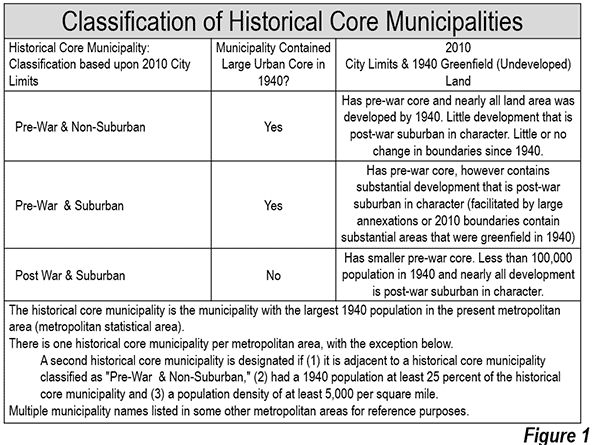
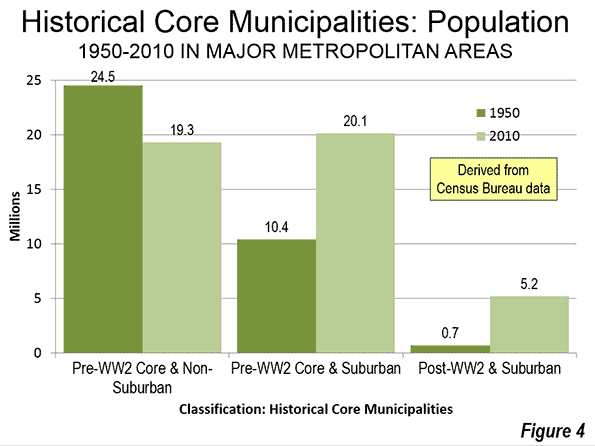
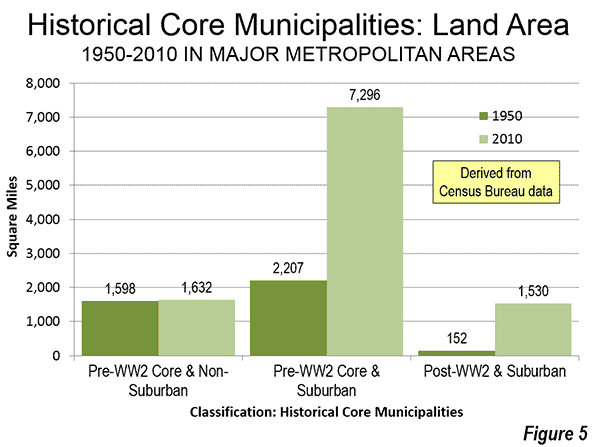
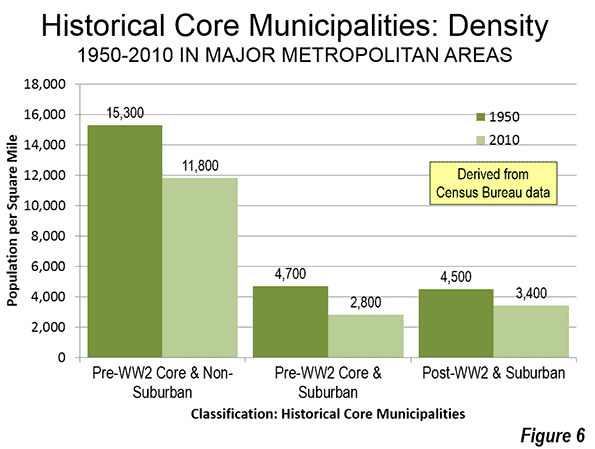
Virtually all population growth in US metropolitan areas (as currently defined) has been suburban or exurban since before World War II (the 1940 census). The historical core municipalities that have not annexed materially and were largely developed by 1940 have lost population. As a result, approximately 110 percent of their metropolitan area growth has occurred in suburbs and exurbs. Further, among the other core municipalities, virtually all of the population growth that has occurred in annexed areas or greenfield areas that were undeveloped in 1940 (Figure 1).
Identifying the Pre-Auto Urban Core
The City Sector Model is not dependent upon municipal boundaries (the term "city" is generic, and refers to cities in their functional sense, metropolitan areas, or in their physical sense, urban areas). Not being constrained by municipal boundaries is important because core municipalities vary substantially. For example, the core municipality represents less than 10 percent of the population of Atlanta, while the core municipality represents more than 60 percent of the population of San Antonio. The City Sector Model applies data available from the US Census Bureau to estimate the population and distribution of Pre-Auto Urban Cores in a consistent manner.
At the same time, the approach is materially different from the Office of Management and Budget (OMB) classification of "principal cities." It also differs from the Brookings Institution "primary cities," which is based on the OMB approach. The OMB-based classifications classify municipalities using employment data, without regard to urban form, density or other variables that are associated with the urban core. These classifications are useful and acknowledge that the monocentric nature of US metropolitan areas has evolved to polycentricity. However, non-urban-core principal cities and primary cities are themselves, with few exceptions, functionally suburban.
The City Sector Model Criteria
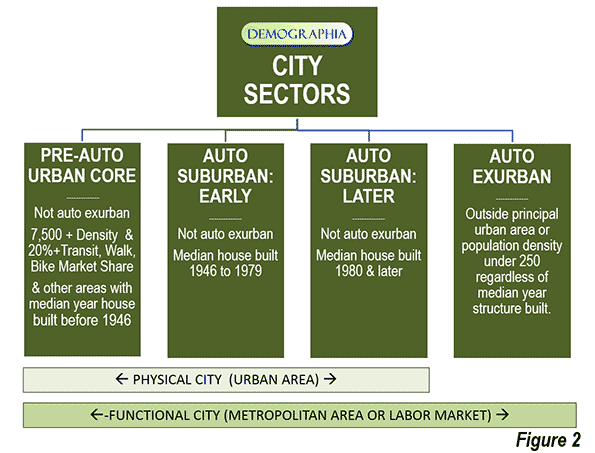
Due to media and academic interest in the Pre-Auto Urban Core, a number of data combinations were used to best fit the modeled population to that of the core municipalities that have virtually the same boundaries as in 1940 and that were virtually fully developed by that time (the Pre-War & Non-Suburban classification in historical core municipalities). A number of potential criteria were examined, and the following were accepted (Figure 2).
The Auto Exurban category includes any area outside a principal urban area.
The Pre-Auto Urban Core category includes any non-exurban with a median house construction date of 1945 or before and also included areas with a population density of 7,500 per square mile (2,900 per square kilometer) or more and with a transit, walk and cycling journey to work market share of 20 percent or more.
The Auto Suburban Earlier category included the balance of areas with a median house construction date of 1979 or before.
The Auto Suburban Later category later included the balance of areas with a median house construction date of 1980 or later.
Additional details on the criteria are in Note 1
Results: 2010 Census
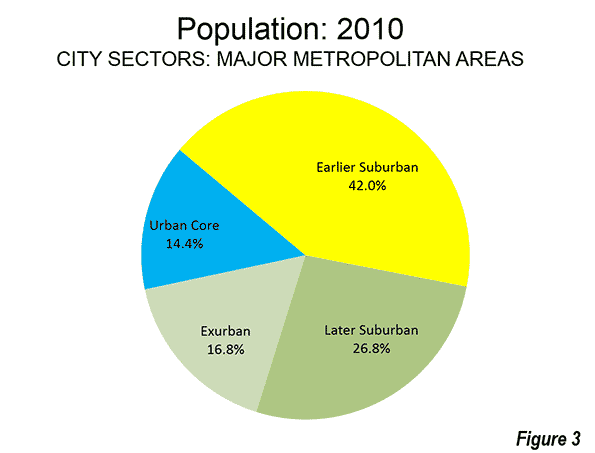
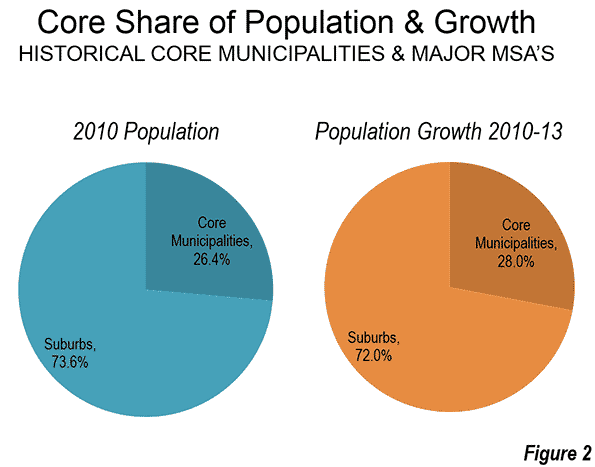
The combined Pre-Auto Urban Core areas represented 14.4 percent of the population of the major metropolitan areas in 2010 (2013 geographical definition). This compares to the 26.4 percent that the core municipalities themselves represented of the metropolitan areas, indicating nearly half of their population was essentially suburban.
The Auto Suburban: Earlier areas accounted for 42.0 percent of the population, while the Auto Suburban: Later areas had 26.8 percent of the population. The Auto Exurban areas had 16.8 percent of the population (Figure 3).
The substantial difference between US and Canadian urbanization is illustrated by applying an approximation of the Gordon-Janzen criteria, which yielded an 8.4 percent Pre-Auto Urban Core population. The corresponding figure for the six major metropolitan areas of Canada was 24.0 percent. This difference is not surprising, since major Canadian urban areas have generally higher densities and much more robust transit, walking and cycling market shares. Yet, the Gordon-Janzen research shows Canada still to be overwhelmingly suburban (Note 2).
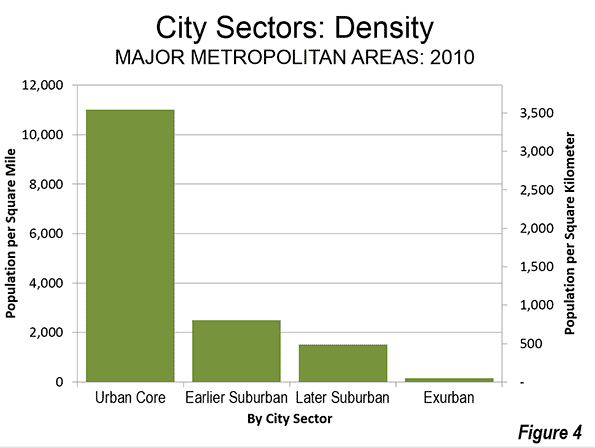
Population Density: As would be expected, the Pre-Auto Urban Core areas had the highest densities (Figure 4), at 11,000 per square mile (4,250 per square kilometer). The Auto Suburban: Earlier areas had a density of 2,500 per square mile (1,000 per square kilometer), while the Auto Suburban: Later had a population density of 1,300 per square mile (500 per square kilometer), while the Auto Exurban areas had a population density of 150 per square mile (60 per square kilometer)).
Individual Metropolitan Areas (Cities)
The metropolitan areas with the highest proportion of Pre-Auto Urban Core population are New York (more than 50 percent), and Boston (nearly 35 percent), followed by Buffalo, Chicago, San Francisco-Oakland, and Providence, all with more than 25 percent (Table).
| Table | ||||
| City Sectors: 2010 | ||||
| Major Metropolitan Areas | ||||
| City (Metropolitan Area) | Pre-Auto Urban Core | Auto Suburban: Earlier | Auto Suburban: Later | Auto Exurban |
| Atlanta, GA | 0.5% | 14.9% | 70.7% | 13.8% |
| Austin, TX | 1.8% | 15.7% | 62.5% | 20.0% |
| Baltimore, MD | 16.2% | 41.8% | 19.9% | 22.0% |
| Birmingham, AL | 0.0% | 42.1% | 24.6% | 33.3% |
| Boston, MA-NH | 34.2% | 49.7% | 3.2% | 12.9% |
| Buffalo, NY | 28.8% | 51.6% | 3.1% | 16.5% |
| Charlotte, NC-SC | 0.0% | 10.0% | 38.4% | 51.6% |
| Chicago, IL-IN-WI | 25.8% | 45.0% | 18.3% | 10.9% |
| Cincinnati, OH-KY-IN | 10.1% | 38.8% | 24.3% | 26.8% |
| Cleveland, OH | 22.2% | 46.8% | 10.5% | 20.6% |
| Columbus, OH | 5.0% | 28.7% | 37.5% | 28.9% |
| Dallas-Fort Worth, TX | 0.3% | 34.4% | 43.0% | 22.4% |
| Denver, CO | 3.1% | 42.9% | 42.4% | 11.6% |
| Detroit, MI | 6.3% | 60.6% | 16.1% | 16.9% |
| Grand Rapids | 3.8% | 32.9% | 15.3% | 48.1% |
| Hartford, CT | 11.1% | 58.6% | 1.1% | 29.2% |
| Houston, TX | 0.3% | 34.2% | 48.9% | 16.6% |
| Indianapolis. IN | 4.6% | 28.0% | 41.8% | 25.6% |
| Jacksonville, FL | 0.0% | 26.4% | 48.2% | 25.4% |
| Kansas City, MO-KS | 5.4% | 37.6% | 26.3% | 30.6% |
| Las Vegas, NV | 2.4% | 17.5% | 76.7% | 3.5% |
| Los Angeles, CA | 10.4% | 76.4% | 5.2% | 8.0% |
| Louisville, KY-IN | 8.1% | 45.4% | 25.6% | 20.8% |
| Memphis, TN-MS-AR | 1.8% | 40.6% | 34.3% | 23.3% |
| Miami, FL | 1.4% | 51.4% | 44.8% | 2.4% |
| Milwaukee,WI | 22.1% | 52.0% | 10.4% | 15.5% |
| Minneapolis-St. Paul, MN-WI | 12.7% | 31.6% | 33.8% | 22.0% |
| Nashville, TN | 0.0% | 25.0% | 36.1% | 38.9% |
| New Orleans. LA | 10.6% | 49.9% | 7.0% | 32.4% |
| New York, NY-NJ-PA | 52.4% | 35.3% | 5.6% | 6.7% |
| Oklahoma City, OK | 2.5% | 35.1% | 31.6% | 30.8% |
| Orlando, FL | 0.0% | 16.1% | 50.5% | 33.4% |
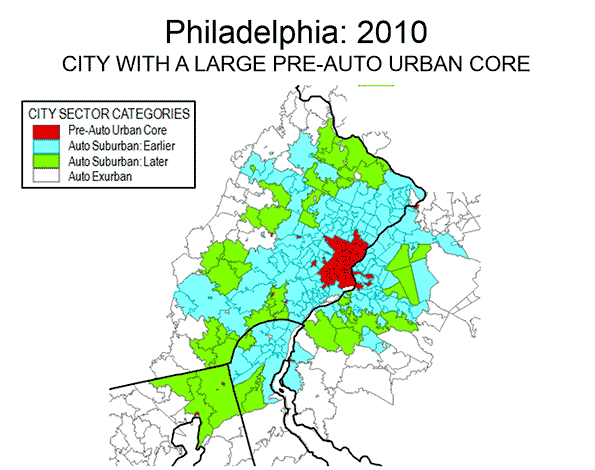
| Philadelphia, PA-NJ-DE-MD | 24.6% | 51.1% | 15.1% | 9.2% |
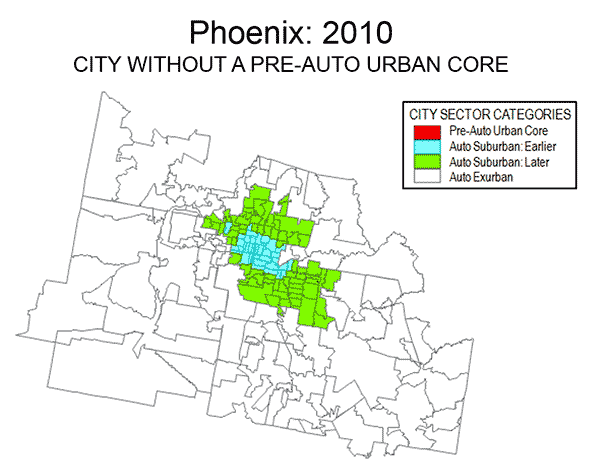
| Phoenix, AZ | 0.0% | 29.4% | 51.7% | 18.8% |
| Pittsburgh, PA | 15.7% | 56.1% | 4.8% | 23.4% |
| Portland, OR-WA | 9.3% | 36.7% | 39.5% | 14.6% |
| Providence, RI-MA | 25.5% | 47.7% | 2.8% | 24.0% |
| Raleigh, NC | 0.0% | 7.5% | 54.4% | 38.1% |
| Richmond, VA | 4.5% | 38.8% | 38.0% | 18.8% |
| Riverside-San Bernardino, CA | 0.0% | 29.1% | 29.4% | 41.4% |
| Rochester, NY | 11.1% | 46.9% | 7.7% | 34.3% |
| Sacramento, CA | 1.6% | 38.0% | 40.2% | 20.1% |
| St. Louis,, MO-IL | 11.7% | 39.9% | 25.7% | 22.8% |
| Salt Lake City, UT | 4.6% | 47.9% | 38.4% | 9.1% |
| San Antonio, TX | 0.1% | 39.7% | 42.6% | 17.6% |
| San Diego, CA | 1.2% | 61.6% | 30.3% | 6.9% |
| San Francisco-Oakland, CA | 25.7% | 55.5% | 7.6% | 11.2% |
| San Jose, CA | 0.1% | 77.7% | 9.1% | 13.1% |
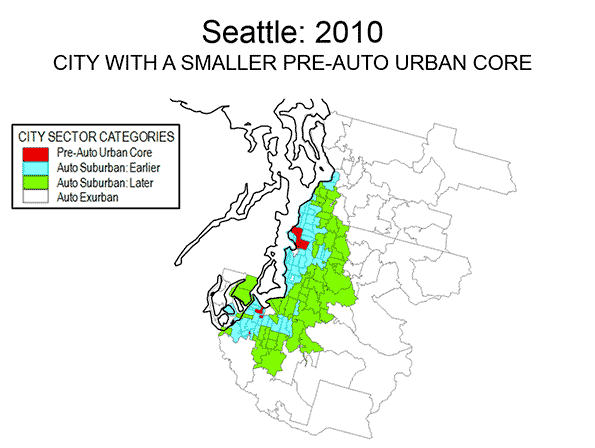
| Seattle, WA | 7.8% | 38.9% | 40.2% | 13.0% |
| Tampa-St. Petersburg, FL | 0.0% | 44.8% | 39.7% | 15.5% |
| Virginia Beach-Norfolk, VA-NC | 1.5% | 44.4% | 37.7% | 16.4% |
| Washington, DC-VA-MD-WV | 15.9% | 29.2% | 36.2% | 18.7% |
| Overall | 14.4% | 42.0% | 26.8% | 16.8% |
It may be surprising that many of the major metropolitan areas are shown with little or no Pre-Auto Urban Core population. For example, five metropolitan areas have virtually no Pre-Auto Urban Core population, including Phoenix, Riverside-San Bernardino, Tampa-St. Petersburg, Orlando, Jacksonville, and Birmingham. By the Census Bureau criteria of 1940, two of these areas were not yet metropolitan and only Birmingham (400,000) had more than 250,000 residents. Many of the newer and fastest growing metropolitan areas were too small, too sparsely settled or insufficiently dense to have strong urban cores before the great automobile suburbanization that followed World War II. Further, many of the Pre-Auto Urban Cores have experienced significant population loss and some of their neighborhoods have become more suburban (automobile oriented). Virtually no urban cores have been developed since World War II meeting the criteria.
Thus, no part of Phoenix, San Jose, Charlotte and a host of other newer metropolitan areas functionally resembles the Pre-Auto Urban Core areas of metropolitan areas like Chicago, Cincinnati, or Milwaukee. However, new or expanded urban cores are possible, if built at high enough population density and with high enough transit, walking, and cycling use.
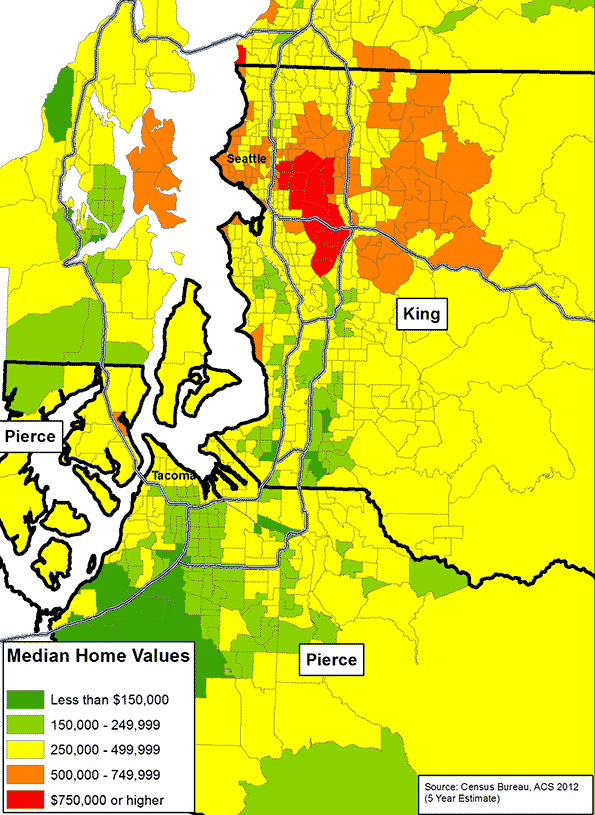
Examples of three differing metropolitan areas are provided. Philadelphia (Figure 5) is a metropolitan area with a strong Pre-Auto Urban Core, which is indicative of an older metropolitan area that has been among the largest in the nation since its inception, Seattle (Figure 6) is a much newer metropolitan area, yet exhibits a larger Pre-Auto Urban Core than most. Phoenix (Figure 7) may be the best example of a post-War metropolitan area, with virtually no Pre-Auto Urban Core. In 1940, the Phoenix metropolitan area had only 120,000 residents and could be 40 times that large by 2020. Virtually all of Phoenix is automobile-oriented. Even three years after opening its light rail line, 88 percent of Phoenix commuters go to work by car and only two percent by transit, virtually the same as in 2000.
Despite the comparatively small share of the modern metropolitan area represented by the Pre-Auto Urban Core in the City Core Model, the definition is broad and, if anything over-estimates the size of urban core city sectors. The population density of Pre-Auto Urban Core areas is below that of the historical core municipalities before the great auto oriented urbanization (11,000 compared to 12,100 in 1940) and well above their 2010 density (8,400), even when New York is excluded. The minimum density requirement of 7,500 per square mile (not applied to analysis zones with a median house construction data of 1945 or earlier) is slightly less than the density of Paris suburbs (7,800 per square mile or 3,000 per square kilometer) and only 20 percent more dense than the jurisdictional suburbs (suburbs outside the historical core municipality) of Los Angeles (6,400 per square mile or 2,500 per square kilometer). Some urban containment plans require higher minimum densities, not only in urban cores but also in the suburbs.
In describing the Canadian results, Professor Gordon noted that there is a tendency to “overestimate the importance of the highly visible downtown cores and underestimate the vast growth happening in the suburban edges.” That is true to an even greater degree in the United States.
—–
Note 1:
The City Sector Model is applied to the 52 major metropolitan areas in the United States (over 1 million population). The metropolitan areas are broken into principal urban areas, with all other areas considered to be exurban. The principal urban areas also include the Concord urban area and the Mission Viejo urban area, which are adjacent to and included in the San Francisco and Los Angeles urban areas respectively. As a result, some smaller urban areas, such as Palm Springs (Riverside-San Bernardino metropolitan area), Lancaster (Los Angeles metropolitan area) and Poughkeepsie (New York metropolitan area) are considered exurban. Areas with less than 250 residents per square mile (100 per square kilometer) are also considered exurban, principally for classification of large areas on the urban fringe that have a substantial rural element.
The Pre-Auto Urban Core includes all non-– exurban areas in which is the median house (single-family or multi-family) was built is 1945 or before. Three density levels were considered, 10,000, 7,500 and 5,000 per square mile (4,000, 2,900 and 2,000 per square kilometer). The lower 5,000 per square mile was examined to test the extent to which such a low density would increase the urban core population. This density, less than the entire urban area (urban core and suburban) of the Los Angeles, San Francisco, San Jose and New York urban areas would have, at the most raised the urban core population to 21.5 percent of the metropolitan population, even with a modest 10 percent transit, walking and cycling market share (Figure 8)
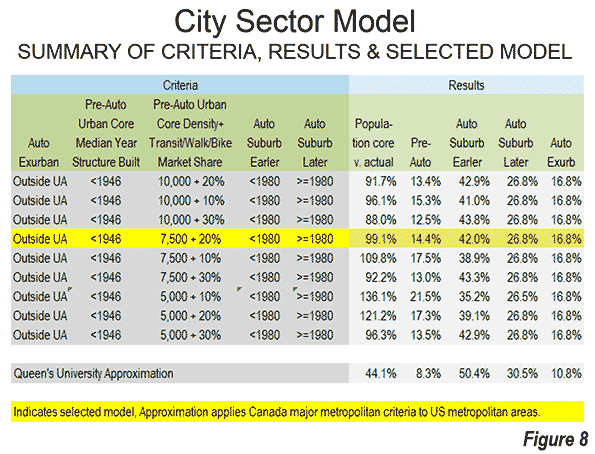
The pre-auto urban core specification results in a 2010 population for the metropolitan areas with Pre-war and non-suburban historical core municipalities within one percentage point of the actual total, excluding the far higher density case of New York.
The analysis showed that a lower transit, walking and cycling market share at a 7,500 per square mile floor (2,900 per square kilometer) would substantially increase the Pre-Auto Urban Core category population, while diluting its urban core nature. More than one-half of the increase would be in Los Angeles which has added literally millions of residents in high density suburban areas that are as automobile oriented as suburbs elsewhere.
The analysis zones (zip codes) have an average population of 19,000, with from as many as 1,000 zones in New York to 50 in Raleigh.
Note 2:
An approximation based on the Gordon and Janzen approach would indicate an urban core population of only 8 percent in the major metropolitan areas of the United States. This approximation results in a modeled population for the metropolitan areas with pre-war and non-suburban historical core municipalities of less than one-half the actual 2010 population.
This Queen’s University research comparison in Figure 8 is referred to as an approximation, since it applies an overall transit, walking, and cycling market share for the six major metropolitan areas, instead of a factor corresponding to each metropolitan area (the Gordon and Janzen approach).
The differences in transit market share relative to the US are substantial. This may be best shown by considering Calgary, which with a population of 1.2 million in 2011 would have ranked as the 47th largest metropolitan area if it were in the United States. Yet, Calgary would rank second only to the New York metropolitan area in transit market share if it were in the United States. Even so, Calgary is found to be the most suburban of Canada’s major metropolitan areas in the Queen’s University research and Statistics Canada data from 2011 indicates strong domination of urban travel by the automobile.
Wendell Cox is principal of Demographia, an international public policy and demographics firm. He is co-author of the “Demographia International Housing Affordability Survey” and author of “Demographia World Urban Areas” and “War on the Dream: How Anti-Sprawl Policy Threatens the Quality of Life.” He was appointed to three terms on the Los Angeles County Transportation Commission, where he served with the leading city and county leadership as the only non-elected member. He was appointed to the Amtrak Reform Council to fill the unexpired term of Governor Christine Todd Whitman and has served as a visiting professor at the Conservatoire National des Arts et Metiers, a national university in Paris.
Photo: Los Angeles