Category: Demographics

  • The Consequences of Urban Containment

    Recently published research by Brian N. Jansen and Edwin S. Mills represents notable addition to the already rich academic literature that associates more stringent land use regulation with higher house prices. The analysis is unusually comprehensive and its conclusions indicate greater consequences than is usually cited. Mills is Professor Emeritus of Real Estate and Finance at Northwestern University and is renowned for his contributions to urban economics over more than five decades.

    The Research

    The comprehensiveness of the research is indicated by the fact that it covers all of the 268 metropolitan areas in the United States for which complete data was available. The focus was on the trend of house prices leading up to 2006, the peak of the housing bubble. Their econometric analysis showed that "stringent land use controls raise house prices."

    They also found that more stringent land use controls were associated with greater house price losses following the peak.

    “The strong conclusion of this paper is that stringent residential land use controls were a primary cause of the massive house price inflation from about 1992 two 2006 and possibly of the deflation that started in 2007.”

    Overall, this finding is consistent with the work of others (such as in Glaeser and Gyourko) who have associated more stringent land use controls with greater house price instability.

    Consistency with Economic Principle & Previous Research

    The Jansen and Mills findings reiterate those of a large body of research. Economists Richard Green and Stephen Malpezzi summarized the issue a decade ago:

    “When the supply of any commodity is restricted, the commodity’s price rises. To the extent that land – use, building codes, housing finance, or any other type of regulation is binding, it will worsen housing affordability.”

    This relationship is even acknowledged by proponents of more stringent land use policies. A Brookings Institution team led by University of Utah Professor Arthur C. Nelson indicated that “If … policies serve to restrict land supplies, then housing price increases are expected.”

    Needless to say, any other effect would be the equivalent of “sun rising in the West” economics.”

    The more stringent land use regulations include blunt tools like the urban growth boundaries of Vancouver, Sydney, Portland or the San Francisco Bay Area but also the large-lot suburban lots that have rendered Boston’s urban densities nearly as low as Atlanta. Artificial limits on development lead to higher house prices, other things being equal.

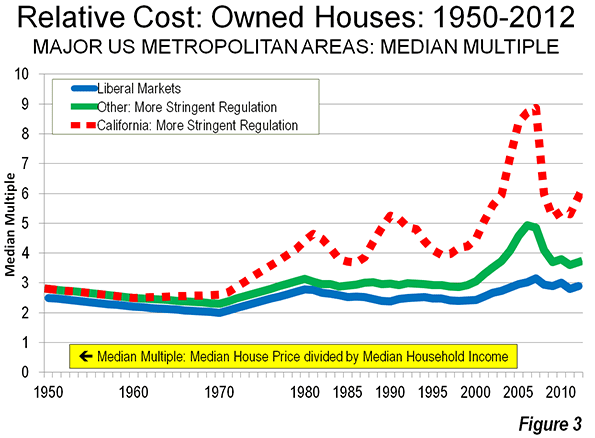
    This will come as no surprise to those familiar with the work of Dartmouth economist William Fischel who attributed California’s high house prices to stringent land use regulation. He noted that until around 1970, California house prices had been nearly the same, relative to incomes as the rest of the nation, before more stringent land use regulation began. Now house prices in coastal California markets are double those in liberally regulated markets, measured by the median multiple (median house price divided by median household income).

    Unintended Consequences: Portland and California

    The Jansen and Mills findings will disappoint urban containment (smart growth or growth management) advocates who have often denied the economic reality of its influence on house prices. Some had hoped that the house price increasing effects of stringent land use regulation would be neutralized by more affordable housing costs in the cores of metropolitan areas, where more dense housing would be permitted. A principle source of this view is an analysis of early 1990s Portland (Oregon) house prices by Justin Phillips and Eban Goodstein, who said that such an effect “should” occur.

    Yet in the 15 years since the period covered by this research, Portland house prices have risen with a vengeance (see The Evolving Urban Form: Portland), with the median multiple rising more than 40 percent, from 3.0 in 1995 to 4.3 in 2012. Obviously, with such an increase, the price increasing impacts of Portland’s urban growth boundary have not been negated.

    Further, housing costs rose in Portland’s densifying areas at virtually the same rate as in the rest of the metropolitan area over the period from 1999 to 2009. Census and American Community Survey data indicates that densifying zip code areas (housing unit density increases of 5 percent or more) experienced median multiple increases of 37 percent, compared to 36 percent for the balance of the metropolitan area (Note). Rents in the densifying areas rose 9 percent, compared to 8 percent in the rest of the area.

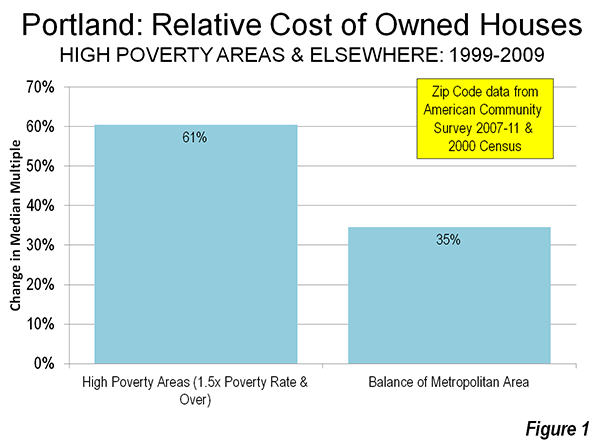
    The impact on Portland’s low income population, however, was less than equitable. The cost of owned housing rose 75 percent more in areas of higher poverty (areas with poverty rates 50 percent or more than the average rate) than in the balance of the metropolitan area. The median multiple (value) rose 61 percent in the high poverty areas and only 35 percent elsewhere (Figure 1).

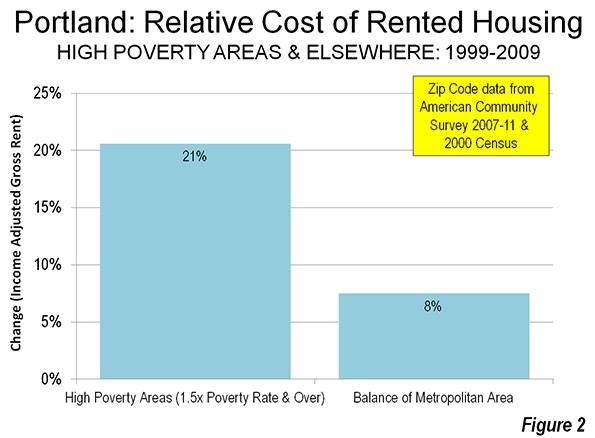
    The difference was even starker in rentals, where low income households are concentrated. Income adjusted median gross rents in the high poverty areas rose more than 2.5 times the increase in the rest of the metropolitan area. In the high poverty areas, the increase was 21 percent and only 8 percent elsewhere (Figure 2).

    The housing cost increases in the higher poverty areas appears to be at least partially from gentrification as well as Portland’s efforts to improve neighborhoods through urban renewal. In assessing the results of the 2010 census, The Oregonian noted that the core city of Portland had become less diverse and that many African-American households were driven out of their neighborhoods by “gentrification.”

    This greater housing cost burden on lower income households belies the noble intentions expressed in much of the urban containment and smart growth literature. Results are more important than intentions.

    Portland is not alone. Nelson, et al, were uncritical of Portland a decade ago (before the evidence of house price increases was so clear), but did not mince words in characterizing the already evident higher prices from stringent land use policies in California, saying: “This is arguably what happened in parts of California where growth boundaries were drawn so tightly without accommodating other housing needs that housing supply fell relative to demand.”

    The Broader Consequences of Stringent Land Use Regulation

    Jansen and Mills took the research farther than most others. In their econometrics, they found more stringent land use regulation negatively impacted metropolitan area population, employment and per capita real income.

    They also considered the role of stringent land use controls in the Great Financial Crisis. This issue had also been a subject of inquiry of the congressionally established United States Financial Crisis Inquiry Commission, which documented much larger than national housing bubbles in the so-called “sand states” of California, Florida, Arizona and Nevada. Three of the
    10 members issued a minority opinion citing land use controls as one of the causes of the housing bubble (which is widely considered to have sparked the Great Financial Crisis). The major metropolitan areas in the “sand states” all had strong land use restrictions.

    “Land use restrictions. In some areas, local zoning rules and other land use restrictions, as well as natural barriers to building, made it hard to build new houses to meet increased demand resulting from population growth. When supply is constrained and demand increases, prices go up.”

    My analysis of metropolitan markets for the National Center for Policy Analysis suggested a similar relationship (see The Housing Crash and Smart Growth).

    Jansen and Mills squarely place blame for the Great Financial Crisis on stringent land use controls.

    “Indeed, it is difficult to imagine another plausible cause of the 2008–2009 financial crisis. Popular accounts simply refer to a speculative housing price bubble. But productivity growth in housing construction is faster than in the economy as a whole and the US has an aggressive and competitive housing construction sector. In the absence of excessive controls, housing construction would quickly deflate a speculative housing price bubble.”

    The absence of excessive controls would have defused the housing bubble, they suggested. This notion is supported by the experience of metropolitan areas with liberal land use regulation (Figure 3) where median multiple remained near or below 3.0 in liberally regulated markets. This standard has typified affordable markets since World War II, as well as California markets to the early 1970s and Portland until 1995. The retention of housing affordability is especially significant in Atlanta, Dallas-Fort Worth and Houston, which experienced some of the largest rates of domestic in-migration during the bubble. This is in contrast to the more stringently regulated high cost markets of coastal California, which experienced huge out-migration during the same period.

    The Imperative for Job Creation and Economic Growth

    All of this is particularly important because housing is the most expensive element of household budgets, and unlike transportation and most consumer goods, is extremely sensitive to varying local and regional public policies. Where households have to pay more for housing, they have less discretionary income and necessarily have a lower standard of living. This is deleterious to virtually all households and is especially burdensome on lower income households.

    Many young adults are “doubling up” with their parents, deferring their own independence, facing huge student loan debts and inadequate employment prospects in what may become the Great Malaise. Taxpayers in many jurisdictions face unprecedented burdens in funding unsustainable government employee pension benefits. Only job creation and economic growth can solve these problems. The last thing the economy needs is stringent land use policies that reduce employment, economic growth and per capita real incomes.

    Wendell Cox is a Visiting Professor, Conservatoire National des Arts et Metiers, Paris and the author of “War on the Dream: How Anti-Sprawl Policy Threatens the Quality of Life.

    —–

    Note: Median multiple data from the Census Bureau (and the American Community Survey) are reported using median house values, instead of the more common median house price.

    —–

    Photo: 1,700 square foot house in exurban Los Angeles priced at $575,000 at the peak of the housing bubble (by author).

    CORRECTION

    Land use regulation as a cause of the housing bubble should have been should have been attributed to a dissenting opinion in the United States Financial Crisis Inquiry Commission, rather to the Commission itself.

  • What Triggers a Civic Turnaround?

    Lots of cities in America are struggling with low population growth and sluggish economies. Poor demographics and economics lead to fiscal problems that result in more people and businesses leaving, perpetuating a downward spiral. Detroit, which recently filed bankruptcy, is an extreme case, but many cities and states find themselves in similar straits, including much of New England and especially most of Rhode Island.

    How to places break out of this and renew prosperity? Looking at cities where there has been change, I have observed several basic patterns of turnaround.

    Structural Changes

    Many cities failed for structural economic reasons like deindustrialization and globalization. Similarly, many ended up reviving for similar external reasons. In her seminal book The Global City, Saskia Sassen noted that while globalization permitted the dispersal of economic activities to lower cost locations, it created a parallel need for specialized financial and producer services to manage and control those global production networks. These services were disproportionately concentrated in so-called “global cities” like New York and London. While once those cities had fallen on hard times (in NYC’s case, nearly going bankrupt itself in the 1970s), globalization more than any other factor perhaps brought them back to life. Unfortunately, localities have no ability to conjure up these macro-economic changes.

    Natural Lifecycle Progression

    In a few places, notably Pittsburgh, it seems that the problems simply reached the end of their life cycle. To borrow a phase, they “hit bottom” and started reviving, if slowly. Of course, many places hit bottom and stayed there. Pittsburgh has been helped by the presence of large, world-class institutions. Being in the Marcellus Shale formation that’s the epicenter of the American gas fracking boom doesn’t hurt. It’s worth noting that Pittsburgh has seen fairly slow growth and still faces big challenges, including major pension and infrastructure problems.

    Outsider Influx

    Other cities hit a growth inflection point when they were able to attract a critical mass of outsiders. I have argued that having a critical mass of outsiders, that is, of people who aren’t long time natives or “boomerang” migrants, is almost a prerequisite for major civic change:

    You need them, and you need enough of them that they a) don’t get beaten down by the man, so to speak and b) that they become a base of support for change in their own right. Once this group becomes large enough, it opens up the field of possibilities. They have the insights and different ideas from having lived elsewhere. They aren’t bought into the status quo or burdened by the baggage of the past. They are willing to question they way things are done. They are more likely to want change. In short, outsiders are the natural constituency for the new. That’s why outsiders are so important for a community to change, and why absent enough newcomers, change is difficult if not impossible.

    Of course, this almost begs the question: how do you attract those outsiders? This would appear to be a second order factor. It would be worth doing a deep dive on how significant inward migration began in these places. Also, the places that seemed to do well on this model – like Nashville or Denver – are places that weren’t in terrible shape to begin with.

    Transformational Leaders

    Any number of cities lend themselves to a narrative of transformational change led by a particular leader or group of leaders. You can think of Richard M. Daley in Chicago or Rudy Giuliani and Michael Bloomberg in New York. Cory Booker in Newark may be an emerging story in this mold. Or in previous generations there were business magnates like J. Irwin Miller in Columbus, Indiana that through superior vision combined with clout were able to put their community on a different path than other similarly positioned cities. (Among other things, Columbus, Indiana is an internationally renowned center of modernist architecture, with no fewer than six National Historic Landmarks in a modernist style).

    The obvious question here is how much leadership had to do with it. So many of these large tier one type cities came back at the same time that it seems likely some common outside force like globalization was the real driver. Or at least that it was a prerequisite to enable the leadership to be effective. However, there are some examples like Columbus that appear to be less the result of outside forces.

    Civic Sector Led Revitalization

    Some cities have done well in models without a single dominant leader such as a larger than life mayor. In Indianapolis, for example, it was a broader coalition of business, community, and institutional leaders that championed items such as their sports hosting strategy that had a transformational impact. This is the model most cities try to use, but it has failed nine times out of ten in delivering transformational impact, so would appear to be a very high risk strategy.

    What other models suggest themselves? I won’t claim this as a comprehensive list.

    A Look At Providence and Rhode Island

    Where does Rhode Island fit in? Well, it hasn’t seen a turnaround yet. But there has been a sort of slow growth in personal incomes that could add up over time. In this light, Providence would be a sort of Pittsburgh-like city from a lifecycle perspective, though I should note with a much smaller asset base. Alon Levy made the case for this view last year in a piece called “The Quiet Revival”:

    Rhode Island may have one of the highest unemployment rates in the US today, but income growth is high; things are slowly getting better. The most visible growth in the US is in population rather than income, and so the usual markers are new housing starts, new infrastructure, and a lot of “coming soon” signs. Providence of course doesn’t have much of this. Instead, people are getting richer, slowly… Economic growth in the richest countries is slow enough that people don’t perceive it. Instead, they think it’s the domain of countries that are catching up, such as China, where it’s so fast it includes new construction and the other markers that signify population growth in the first world. In the long run, it matters that a city’s income grows 1.8% a year rather than 1.1%, but it’s not visible enough to be captured by trend articles until long after the spurt of growth has started.

    Given the lack of structural economic forces boosting the city, and a comparatively small base of newcomers, particularly outside of Providence proper and other core cities, this will likely have to do for now, unless we witness the emergence of a disruptive and transformational type leader.

    This post originally appeared in GoLocalProv on August 26, 2013.

    Aaron M. Renn is an independent writer on urban affairs and the founder of Telestrian, a data analysis and mapping tool. He writes at The Urbanophile.

    Photo by Will Hart.

  • Canada’s Changing Income Patterns

    Statistics Canada’s newly released National Household Survey indicates changes in the distribution of median household incomes among the provinces and territories. The new data is for 2010, and indicates that an increase of 13.9 percent per household at the national level from the 2005 data collected in the 2006 census.

    The big story, however, is the progress in parts of Canada that have grown used to laggard economic performance. In 2005, few would have expected the progress made in the provinces of Saskatchewan and Newfoundland & Labrador. In both cases, the resource boom had much to do with the turnaround.

    Gains in Saskatchewan and the Prairies

    Saskatchewan’s median household income grew 32.1 percent, out-distancing perennial champion Alberta and emerging Newfoundland & Labrador by nearly a third (Figure). Alberta’s income was up 22.9 percent, while Newfoundland & Labrador experienced a nearly as great 22.7 percent increase. Saskatchewan had trailed British Columbia by more than 10 percent five years before, but had edged ahead by 2010. Saskatchewan’s income level now leads all of the provinces except Alberta and Ontario.

    All three of the Prairie Provinces did well. In addition to Saskatchewan and Alberta, household income in Manitoba grew at a 20 percent, stronger than all provinces outside the prairies except for Newfoundland & Labrador.

    A New Day in Newfoundland and Labrador

    While Saskatchewan has experienced prosperity from time to time in its history, the same is not so true in Newfoundland and Labrador. In fact, in 1933, the government of Newfoundland (as it was then known) voted itself out of existence as a Dominion of the British Empire because of its serious financial difficulties. Effectively, the Dominion was relegated to the status of a British crown colony (like former Hong Kong). Newfoundland joined Canada as the 10th province in 1949. With that, representative government was restored, but Newfoundland always lagged behind (generally along with the Maritime provinces of New Brunswick, Nova Scotia and Prince Edward Island). In 2005, Newfoundland and Labrador ranked 10th out of the 10 provinces in median household income. By 2010, the ranking had improved to 7th.

    The Prosperous Territories

    The greatest income growth (35 percent) was in the territory of Nunavut, which was created by carving out the eastern portion of the Northwest Territories in 1999. Nunavut covers a land area about 1.3 times that of Alaska, but has only 30,000 residents (about the same as live in a square kilometer of Manhattan or Paris). The Yukon experienced a 26 percent increase, while the Northwest Territories had a 24 percent increase. The Yukon and the Northwest Territories had stronger income growth than all of the provinces, except Saskatchewan.

    The Old Dynamos Trail

    Meanwhile, the economic dynamo of the nation, Ontario experienced household income growth of less than 10 percent, nearly a third less than the national average, and less than one-third of Saskatchewan. Ontario is home to more than one-third of the national population. British Columbia, which has historically experienced strong economic growth, could muster only slightly above average household income growth (14.4 percent compared to the national 13.9 percent).

  • Urban Core Boomer Populations Drop 1 Million 2000-2010

    This may be a surprising headline to readers of The Wall Street Journal and the Washington Post, which reported virtually the opposite result in their August 19 editions. The stories, “Hip, Urban, Middle-Aged: Baby boomers are moving into trendy urban neighborhoods, but young residents aren’t always thrilled,” by Nancy Keates in The Wall Street Journal and “With the kids gone, aging Baby Boomers opt for city life,” by Tara Barampour in the Washington Post reported on information from the real estate firm, Redfin (a link to the corrected Wall Street Journal story is below). Both stories reported virtually the same thing: that 1,000,000 baby boomers moved to within five miles of the city centers of the 50 largest cities between 2000 and 2010. Because these results appeared to be virtually the opposite of census results, I contacted both papers seeking corrections.

    When pressed for more information, Redfin.com responded with a tweet indicating that: “We don’t have a link to share or published study; Redfin did a special analysis of Census data at reporters’ requests.”

    In fact, the census data shows virtually opposite. Redfin’s method was not clear, so I queried the five mile radius within the main downtown areas of the 51 metropolitan areas with more than 1,000,000 population in 2010, shown below in this table and figure.

    Within the five mile radius of downtown, there was a net loss of 1,000,000 baby boomers, or 2 percent of the 2000 population (ages 35 to 55 in 2000). There was also a loss of 800,000 in the suburbs, or 17 percent of the 2000 population. The continuing dispersion of the nation is indicated by the fact that there was a gain of nearly 450,000 in this cohort outside the major metropolitan areas. Overall, there was a net loss of 1.3 million, principally due to deaths.

    To its credit, The Wall Street Journal issued a correction, as I would have expected. The incorrect reference to an increase of baby boomers in the urban cores was removed. To my surprise, not only did the Washington Post fail to make a correction, but they also ignored multiple requests to deal with the issue (though my emails received courteous computer generated acknowledgements).

    With the ongoing repetition of the “return to the city from the suburbs” myth, it is important to draw conclusions from the data, not from impressions.

  • Inequality of the Largest U.S. Metropolitan Areas

    We earlier mapped inequality of the US states. Now I show the geography of inequality for metropolitan areas over 1,000,000.  These measures of inequality are gini coefficients, calculated by the US Census Bureau for 2005-2009. These indicate how amazingly severe inequality, or the concentration of income and wealth at the top, has become.  The gini is a measure of the departure of a curve of accumulated income, ranking from the poorest to the richest. The current US gini is .467, up from .39 back in 1974, and much higher than other rich countries, such as Canada at .32, Germany at 27, France at .33, and Sweden at .23.

    Interpretation of these indices is relative. Even the lowest value, for Salt Lake City, is absolutely high compared to high-income-country norms, or even our own recent past. But in the contemporary US context, ginis from .41 to .44 are  low, between .44 and .447 medium low, .448 to .46 moderate, .46 to .47  moderately high,  and over .47 very high inequality.  Note that the US average is .467, and that most of the metropolitan areas are below that. This is a reflection of the demographic influence of the high levels of inequality of the following few large metropolitan areas:

    Region Population Gini  
    New York 18.9 million 0.502
    Miami 5.5 0.493
    LA 12.8 0.484
    Houston 5.6 0.478
    San Francisco   4.2 0.473

    These national or regional capitals are highly unequal because of the concentration of wealthy families or wealth-producing sectors like finance. Other contributors are a dearth of middle income jobs and large numbers of the poor. These higher than the US average metro areas are joined by three southern metropolitan areas, New Orleans, Memphis, and Birmingham, where in equality is more explainable instead by racial inequality.

    Metro areas around or just below the national average (in red) similarly include a mix of regional economic and financial capitals, along with southern large metros, including Chicago, Philadelphia,  Cleveland, Dallas, and Charlotte plus Oklahoma City and San Antonio.


    A handful of  metro areas, shown in yellow, are moderately lower than the national average and dominantly in the east central part of the country, and include a mix of sizes, from Detroit, St. Louis and Atlanta, Pittsburgh, Buffalo and Milwaukee, Nashville, Tampa, and Austin, with only Denver and San Diego in the west. 

    Less unequal areas, shown in green, are with the exception of Phoenix, all in the east, from Hartford and Providence, to Baltimore, Jacksonville and Orlando, and a cluster in the north central states, with Cincinnati, Columbus, Louisville, Indianapolis, and Grand Rapids. These mostly follow the pattern observed in our recent state analysis where inequality was generally lower across the northern tier of the country.

    The least unequal metro areas are even more focused on the Germanic belt that stretches across the Midwest to far west, with Minneapolis, Kansas City, Salt Lake, Seattle and Portland, Sacramento Las Vegas and Riverside-San Bernardino, plus some in the Atlantic states, including Rochester, Raleigh, Richmond  and the government dependent Washington DC and Virginia Beach-Norfolk. Salt Lake, influenced both by Mormonism and a moderately Scandinavian population, is the least unequal followed by Virginia Beach and Minneapolis.  Overall, with the exception of the Washington DC area,  the least  unequal metro areas tend to have the lowest shares of minority populations. Less unequal metros also tend to retain strong middle class industries, whether it’s Boeing in the Seattle area or the burgeoning tech and manufacturing industries found in places like the Salt Lake region.

    Highly unequal and less unequal may appear together on the map, suggesting lesser suburban or satellite inequality. Generally speaking, suburbanized, less dense (and often less globalized) areas tend to be more equal. We can see this in the difference between Los Angeles and Riverside-San Bernardino,    San Francisco as opposed to Sacramento, Boston vs. Providence, and Washington DC vs. Baltimore. Washington is especially interesting, as the city is extremely unequal, the wider metro area (more homogenous middle class suburbs) far less so. This is even more telling if we look at a more local geographic scale, with central cities marked by the juxtaposition of the very rich and very poor, while suburban cities tend to be dominated by similar middle class folks.

    Among metro areas under 1 million the most unequal is Bridgeport-Stamford, CT  ( those wealthy suburbanites next to historic industrial cities), while the least unequal are Ogden, UT, Appleton, WI, York, PA and Fairbanks, AK.

    Inequality in selected cities

    The most unequal cities (over 100,000) are all southern (Atlanta, #1, New Orleans, Washington, Miami, Gainesville, Ft. Lauderdale, Dallas and Baton Rouge), all except for mighty New York City. Race and ethnicity matter, as does the composition of the local economy. 

    The least unequal  cities are all suburban or satellite, except for Port St. Lucie (military and space), such as of Chicago (Elgin), Kansas City (Olathe), Salt Lake (West Valley, West Jordan), Sacramento (Elk Grove), Los Angeles (Norwalk), Phoenix (Gilbert) , Denver (Thornton) and North Las Vegas.

    Conclusion

    Inequality in distributions of income are high and have become higher in recent years in the United States. But there remains fascinating geographic variation, resulting from abiding racial differences, variation in industrial structure and class homogeneity, and in geographic situation, regionally and locally. This helps both to explain some of the drivers of inequality, but also the complexities of finding ways to alleviate it.

    Richard Morrill is Professor Emeritus of Geography and Environmental Studies, University of Washington. His research interests include: political geography (voting behavior, redistricting, local governance), population/demography/settlement/migration, urban geography and planning, urban transportation (i.e., old fashioned generalist).

  • Book Review: ‘The End of the Suburbs,’ by Leigh Gallagher

    Suburbia has been a favorite whipping boy of urbane intellectuals, who have foretold its decline for decades. Leigh Gallagher’s “The End of the Suburbs” is the latest addition to this tired but tireless genre. The book lacks the sparkling prose and original insights one could find in the works of, say, Jane Jacobs or Lewis Mumford. Indeed, Ms. Gallagher’s book is little more than a distillation of the conventional wisdom that prevails at Sunday brunch in Manhattan.

    The author restages many of the old anti-suburban claims, and her introduction’s section headings easily give away the gist of the argument: “Millennials hate the burbs”; “Our households are shrinking”; “We are eco-obsessed”; “The suburbs are poorly designed to begin with”; and so on.

    Ms. Gallagher, an editor at Fortune magazine, fails to persuade. For starters, her focus on the recent past distorts her argument. She starts with reporting about a dismal home-building conference in Orlando in early 2012, when the housing market was still close to its post-bubble nadir. She portrays those dark times as the harbinger of a new reality that will see suburban living fade away. She quotes real-estate economist Robert Schiller saying that suburban home prices won’t recover “in our lifetime.” But given that prices have indeed risen, and are now reaching precrash levels in some markets, such predictions should be viewed skeptically.

    There isn’t much room for contrarian viewpoints here. All the usual anti-suburbanite suspects are marshaled to support the book’s thesis: Al Gore suggests suburbs will die because they aren’t green enough; the critic James Howard Kunstler makes exaggerated claims about how “peak oil”—the notion that we are running out of fossil fuels and that their cost will skyrocket—will bankrupt suburbanites; other experts claim that young people will desert suburbia for their entire lifetimes and that empty-nesters will abandon their stale suburban lives in favor of urban density.

    Today barely 11% of Americans live in densities of more than 10,000 people per square mile, which is about the level of an inner-ring San Fernando Valley suburb, one-seventh of the Manhattan level and almost one-third of the five boroughs. Four out of five prospective home buyers in the U.S. prefer single-family houses, according to a 2011 survey conducted by the National Association of Realtors and the advocacy group Smart Growth America. In short, most of America isn’t about to densify itself along Gothamite, or even Los Angeles, lines.

    The author ignores most of these findings. She believes cities are poised to become the main beneficiaries of the suburban decline she projects. “To see that cities are resurgent centers of wealth and culture, all you need to do is set foot in one,” she writes. To be sure, some American urban centers, most notably New York, San Francisco and Washington, have experienced modest population growth over the past decade or two, although still well below the national average. And even in these cities, there are many neighborhoods that sophisticated urbanites wouldn’t really want to “set foot in.” In newly hip, and now increasingly expensive, Brooklyn, nearly a quarter of residents live below the poverty line. The borough’s artisanal cheese shops and trendy restaurants are charming, but one in four Brooklynites receives food stamps. The urban renaissance is even less obvious in places like St. Louis, Cleveland and Detroit, which have lost residents in significant numbers over the past decade and whose gentrified zones are tiny.

    Having misunderstood the past, Ms. Gallagher is likely off in her predictions of a high-density future. She insists that young people overwhelmingly want to live “in urban areas and don’t want to own a car.” But most millennials entering their 30s, according to surveys, are likely to get married and eventually have children. That is when they will start to seek out single-family houses in lower-density areas. They may well experience suburbia differently than their parents. More of them will work at home or close to home, or drive fuel-efficient cars on their commutes. Even so, most aging millennials can be expected to seek out homes in affordable areas with decent schools, meaning either the suburbs of older cities or lower-cost, economically vibrant regions like the Southeast, the Gulf Coast or the Mountain West.

    Much the same can be said about the other key emerging demographic group, immigrants and their offspring. Nationwide over the past decade, the Asian population in suburbs grew by almost 2.8 million, or 53%, while that of core cities grew 770,000, or 28%. In Los Angeles, the region with the nation’s largest Asian population, the suburbs added roughly five times as many Asians as the core city.

    One reason: Immigrants are more likely to have families than the native-born. They don’t share the conviction, held by many anti-suburbanites such as Ms. Gallagher, that we are seeing “the end of the nuclear family.” The family, like suburbia, has been written off numerous times. But as Margaret Mead once observed, it “always comes back.” High-density cities generally repel families, and they aren’t conducive to middle-class aspirations. In New York City and Los Angeles, for example, the homeownership rate is 20% less than the national figure of 65%. Things are even worse for working-class and minority households. Metropolitan Atlanta’s African-American homeownership rate is approximately 40% above those of San Jose and Los Angeles, approximately 50% higher than Boston’s, San Francisco’s and Portland’s, and nearly 60% higher than New York’s.

    Many of those migrating to Atlanta, Houston, Dallas-Fort Worth and other low-density, lower-cost cities come from denser, more expensive areas. Between 2000 and 2010, 1.9 million net domestic migrants left the New York area, 1.3 million left Los Angeles and 340,000 left San Francisco, while 230,000 left San Jose and Boston, according to Census Bureau data. The death of the suburbs may suggest a pleasant prospect for the New York and D.C. urbanist crowd, but for most, the American dream remains a suburban one. As long as the American family and the national aspiration for a better life persist, the suburbs are likely to retain their pre-eminent role.

    Joel Kotkin is executive editor of NewGeography.com and Distinguished Presidential Fellow in Urban Futures at Chapman University, and a member of the editorial board of the Orange County Register. He is author of The City: A Global History and The Next Hundred Million: America in 2050. His most recent study, The Rise of Postfamilialism, has been widely discussed and distributed internationally. He lives in Los Angeles, CA.

    This piece originally appeared at The Wall Street Journal.

  • Americans’ Family Feud

    In this bizarrely politicized environment, even the preservation of the most basic institution of society – the family – is morphing into a divisive partisan issue. Increasingly, the two parties are divided not only along lines of economic and social philosophy, but over the primacy of traditional familialism.

    Increasingly, large portions of the progressive community are indifferent or hostile to the idea of the nuclear family, while many on the right argue that it’s key to a Republican revival. Observers such as the Weekly Standard’s Jonathan Last see familialism as key to the demographically challenged GOP. “Start a family, vote Republican,” he suggests. Long-term, Republicans can look forward to the rise of what New York Times columnist David Brooks cleverly calls “red diaper babies.”

    In the long term, the logic seems impeccable. Salt Lake City is creating a new generation of what may tend to be more conservative voters; when San Francisco’s largely single and childless populace passes, their legacy ends with them – game over. Indeed virtually all areas of the country with the fastest projected growth in households are located in red states. Houston, Atlanta and Dallas are expected to add more households than true-blue New York City, Los Angeles or Chicago. New York, California and Illinois are losing children as a share of population, while deep-red Texas, Utah, Idaho, as well as Nevada, have increased their tyke population.

    Others on the right take a more racially oriented tack. Linking lower fertility rates, particularly among Caucasians, Pat Buchanan warns of “the end of white America.” Steven Sailer, a staunchly anti-immigrant conservative theoretician, links Republican fortunes to “white fertility rates,” pointing out where whites choose to have children, particularly those who are married. George W. Bush, Sailer points out, won all 19 states with the highest rates of white fertility, as well as the 25 states where white women have been married the longest, on average.

    This politicization threatens the building of a broad consensus on how to promote the family. The related issue of America’s sagging birth rate – the lowest since the 1920s, by some measurements – should not be seen as a matter of political expediency but as an existential issue concerning the health of society and the long-term prosperity of the United States. No matter what happens with immigration, minorities are going to be a growing portion of our population and will soon represent the majority of children. Unless conservatives seek to secede and form their own Republic, they need to favor familialism among all ethnic groups.

    Yet for now, partisan concerns remain primary, and are compelling, if for narrow, political reasons. In the past two national elections, the differences in voting patterns between married couples and those who are not has become obvious. Democratic pollsters like Stan Greenberg now hail single women as “the largest progressive voting bloc in the country,” Ruy Texeira, a leading political scientist, calls singletons critical to the “emerging Democratic majority.”

    The mainstream “progressive” view on families can be seen in the “Life of Julia” slideshow produced last year by the Obama campaign and designed to appeal to single, unmarried women. In this rather pathetic portrayal, the fictional Julia is helped by federal programs from early in life. When she finally “decides to have a child,” it’s on her own, a sort of an immaculate conception since no man seems to be involved. Then, her offspring is sent off to federally funded early childhood education programs and never heard of again.

    Out of fashion

    Familialism is deeply unpopular with many in two key Democratic constituencies – greens and feminists. Many feminists have long derided the traditional family and see child-raising as something that tends to reinforce sexual stereotypes by reducing the career prospects of women.

    For their part, greens often disdain familialism since they see extra humans as a threat to the environment. The notion that depopulation, and too-rapid aging, at least in higher-income countries, could well become a greater issue than growth seems not to have sunk in, yet. Instead, people like Lisa Hymas, with the environmentalist website Grist, suggest that the “childfree” are something of a persecuted group that are in need of more societal understanding. Environmentalists also tend to be in favor of slow economic growth, which, in turn, tends to further depress birth rates.

    These worldviews represent a break from the progressive politics of the entire era stretching from Teddy Roosevelt to Bill Clinton. In the past, the basic emphasis has been to make families stronger by backing such institutions as public schools and parks, as well as creating the basis for broad-based economic growth. Support for single-family homes that most families require was part of this.

    But today, many “progressives” disdain the suburbs, which were built largely with the help of New Deal and successor programs. Now, most planners, according to the American Planning Association survey, believe accommodating families is simply not worth the cost of the services, notably schools, that they engender.

    Rather than looking at housing that fits families, many progressives now want to promote an urbanism that has little place for families. Some real estate sites, such as Estately, rank cities not by being child-friendly, but those most accommodating to the “childfree” – reminds me of gluten-free – a term which for some reason is deemed preferable to childless. Virtually all cities so ranked, such as ultralow-fertility San Francisco, Portland, Seattle, New York and Madison, Wis., are all places that increasingly are Republican-free as well.

    Most still want kids

    Since most people, including millennials, likely will choose to have children – and settle in suburbs – embracing familialism does offer an opportunity for conservatives and Republicans. Most millennials, note generational chroniclers Morley Winograd and Mike Hais, place high priority on being good parents and having a strong marriage.

    The potential political benefit, however, is being squandered by profamily activists who tend to focus on a Manichean worldview that sees anything other than traditional arrangements as inimical to core religious values about what is defined as a “natural family.” Rather than try to accommodate modernity, many family activists contend, as one leader told me, that we need to “march back to the ’50s.”

    Unfortunately for more hard-line social conservatives, history may go in waves, with each shift engendering a reaction, but it does not generally go backward. To remain relevant, and not to, so to speak, throw the baby out with the bathwater, some agenda items need to be laid aside. This is particularly true on issues such as gay marriage, where millennial opinion is shifting toward ever-greater acceptance, with roughly two in three in favor. By forcing allegiance to increasingly unpopular views, social conservatives are in danger of losing touch with the next generation.

    At the same time, many conservatives are so wedded to the market economy as to ignore the negative pressures on family formation imposed by our relentlessly competitive society. Some thought has to be given to mechanisms – such as free or subsidized child care and extended parental leave – that might make it easier for young families to survive, particularly in tough economic times. Conservatives, if they value family, should look at ways to support them, even if, sometimes, it’s done through government.

    In the end, the issue of family is too important to leave to the mercilessness of narrow partisan political forces. The country – and its future generations – needs both parties to focus not just on pro-family rhetoric, but on how we can make it easier for young people both to create, and nurture, the next generation.

    Joel Kotkin is executive editor of NewGeography.com and Distinguished Presidential Fellow in Urban Futures at Chapman University, and a member of the editorial board of the Orange County Register. He is author of The City: A Global History and The Next Hundred Million: America in 2050. His most recent study, The Rise of Postfamilialism, has been widely discussed and distributed internationally. He lives in Los Angeles, CA.

    This piece originally appeared at The Orange County Register.

    Baby photo by Bigstock.

  • Suburb Hating is Anti-Child

    Sure, suburbs have big problems. Their designs force their inhabitants to drive in cars, instead of walking and bicycling. This diminishes face-to-face interactions, physical health, and the quality of the environment. Aesthetically, many of them, particularly those dreaded “planned communities,” are quite boring. People who live there tend not to have much contact with people who aren’t like them, so suburbs reinforce racial, religious, and class segregation.

    A large proportion of intellectuals and politicians, including President Obama, decry these problems with suburbs as reason to hate them and advocate for their elimination, in favor of dense, big cities.

    Yeah, I get it. I agree that all these problems exist, and they bother me a lot.

    There’s just one big problem with suburb hating. The alternative to suburbs in metropolitan areas, cities, are much worse for children. Sure, adults can have a great time in hip, dense city centers like Manhattan or San Francisco. In fact, if my wife and I never had kids, we’d still be living in San Francisco, going out practically every night.

    However, it’s clear that cities are worse for kids than suburbs.

    Why do I say this?

    First, just look at where newly married urbanites choose to live once they have children. They leave cities in droves. The hipper and denser the city, the more likely are parents to flee to the suburbs.

    20-29_table

    Richard Florida made his name over a decade ago writing about how cities should attract the “creative class” – a code name for childless urban hipsters. In his book, Who’s Your City?: How the Creative Economy Is Making Where to Live the Most Important Decision of Your Life, he lists cities he thinks are best for different groups of people. The table here shows the percentage of total population in the United States that is school-aged children (age 5-17) versus that for large cities that Florida lists as best for 20-29 year-olds.

    The only two cities that are even close to the national average of 17.5% are Los Angeles and New York. Los Angeles covers an awful lot of land area, and I suspect that if I could get data for what Florida really means by “Los Angeles,” the percentage would be much lower.

    NYC_boroughs

    New York is also quite large and diverse, but there, fortunately, I have data for what Florida really means by “New York.” I’m sure he’s thinking of Manhattan when he thinks of “creative class.” There, as you can see on the table here, Manhattan’s percentage of the population that is school-aged is 11.8%, far below the national average.

    In her suburb-hating book, The End of the Suburbs: Where the American Dream Is Moving, Leigh Gallagher gushes that Manhattan “has become overloaded with families.” To back up this assertion, she points to US Census data that there were 2,600 more married families with children 0-18 in 2010 than in 2000. Actually, that’s unimpressive for two reasons. First, the census data show that Manhattan’s total population actually increased by more than the population of children, so children as a percentage of the total population actually dropped. Second, even if the percentage of children had increased, the 11.8% figure for school-aged children is horrifically low.

    The New York Times contributed to this gushing sentiment for children in Manhattan in a 2005 article. It pointed to a small surge in children under 5 in Manhattan’ census data between 2000 and 2004. Unfortunately, this trend did not extend to school-aged kids.

    This disparity hints at the major reason why families leave big cities: public schools in large cities are, by and large, awful. So, for the most part, families that have the means to move out of cities when their children reach school age flee to the ‘burbs. Most middle and upper-middle class families that do stay send their children to private schools. 30% of San Francisco children go to private schools, and my guess is that the figure for Manhattan and other dense, hip urban centers is close to that.

    So, to some extent, when you hear people complain that cities are too expensive for families, they are calculating private school into the cost of living there.

    But private schools not only cost a lot of money. They also destroy neighborhood life for children. In big city neighborhoods where many or most children go to private schools, children who live on the same street hardly know each other because they tend to go to different schools that their parents choose.

    Beyond running bad schools that force families with the means to go to private school, some big city school systems put the final dagger into neighborhoods by forcing or enticing children to go to a school outside their neighborhoods.

    For example, San Francisco has done this for decades in an effort to forcibly integrate students of different races and backgrounds, but instead, what it’s done is destroy neighborhoods and push more families into private schools than any other city in America. In the last year or two, that city has made a small change in its policy in an apparent effort to make it more possible for children to go to school in their own neighborhood, but this change hasn’t gone nearly far enough to pull neighborhoods together.

    So, big cities are left with neighborhoods where children spray out to all parts of the city to go to school every day. When school’s over at the end of the day, playing in their neighborhoods isn’t an option because children there don’t know one another.

    The families that do flee for the suburbs leave a diverse place where parents like them have a small amount of political power and huge teachers’ unions dominate, to a more homogeneous place where most residents are like them, in terms of socio-economic status, and parents wield great power over schools. Left behind are the less fortunate kids, with their families.

    The other primary problem that families have with cities is space. Yes, while it’s trendy these days for urban planners to advocate for dense development, families with children flee from density. Every large city in the United States that has high density – including those in the Richard Florida list above and other dense cities like Miami and Philadelphia – have very low percentages of school-aged children.

    To put it simply, play requires space. If all kids have outside their crowded apartment building is a sidewalk, they can’t play a game of soccer, nor can they play even less formal games like hide and seek or tag. Also, sidewalks are a lot less complex, and therefore they’re a lot more boring for kids, than yards that have grass and bushes with hiding spaces.

    As Richard Louv writes so eloquently in his book Last Child in the Woods, children really do love being in nature. They’re drawn to play among trees, bushes, grass, and creeks rather than sidewalks and brick walls.

    Those who tout the attractiveness of city life for children always cite the importance of public parks. Parks are great for families that live right next to them, but unfortunately, we’re never going to put a park in every other block. The fact is that children don’t roam very far on their own these days. In fact, most preteen children don’t roam on their own more than a few feet from their front doors, whether those front doors are to their single family homes or to their apartment buildings. So, parks are of very limited use, even to most city dwellers. While kids and caregivers go there together, kids hardly every go there on their own to play freely.

    Clearly, children can get a great deal of value from a yard outside a single family home, which is one important reason why so many families aim to move to the suburbs. Yes, most families don’t exploit their yards nearly enough once they move there, but that’s a problem with how families live in suburbs. It’s not a blanket condemnation of suburbs.

    So, we need to fix suburbs and the way families utilize them. They should be far more pedestrian friendly, and not favor cars so much. Residential yards should be used as social hangouts, not merely admired from afar for their manicured shrubs and flower beds. I’ve written a great deal about these fixes on my blog and in my book Playborhood.

    But what we shouldn’t do is try to force families to live in dense city centers. Most families don’t like it there, with good reason.

    Suburb hating hurts children. Politicians who advocate anti-suburb policies are hurting children. They are, dare I say, anti-child.

    Mike Lanza is author of the parenting book Playborhood: Turn Your Neighborhood Into a Place For Play, and blogs at Playborhood.com.

    Suburbs photo by Bigstock.

  • A Map Of America’s Future: Where Growth Will Be Over The Next Decade

    The world’s biggest and most dynamic economy derives its strength and resilience from its geographic diversity. Economically, at least, America is not a single country. It is a collection of seven nations and three quasi-independent city-states, each with its own tastes, proclivities, resources and problems. These nations compete with one another – the Great Lakes loses factories to the Southeast, and talent flees the brutal winters and high taxes of the city-state New York for gentler climes – but, more important, they develop synergies, albeit unintentionally. Wealth generated in the humid South or icy northern plains benefits the rest of the country; energy flows from the Dakotas and the Third Coast of Texas and Louisiana; and even as people leave the Northeast, the brightest American children, as well as those of other nations, continue to migrate to this great education mecca.

    The idea isn’t a new one – the author Joel Garreau first proposed a North America of “nine nations” 32 years ago – but it’s never been more relevant than it is today, as America’s semi-autonomous economic states continue to compete, cooperate … and thrive. Click on the thumbnail of our map to see our predictions for the job, population and GDP growth of these 10 regional blocks over the next decade, and read on below for more context.

    View the map graphic at Forbes.com.


    INLAND WEST

    The Inland West extends from the foothills of the Rockies to the coastal ranges that shelter the Pacific Coast. This is the West as we understand it historically, a land of spectacular scenery: icecaps and dry lands, sagebrush, high deserts and Alpine forests. From 2003 to 2013, it enjoyed the most rapid population growth in the nation: 21%. It is expected to continue to outgrow the rest of the country over the next decade, as the area boasts the highest percentage of young people under 20 in the U.S.

    Much of this growth was driven by a combination of quality of life factors — access to the outdoors and relatively low housing prices — as well as strong economic fundamentals. Over the past decade the area has enjoyed nearly 8% job growth, the strongest in the country, with the highest rate of STEM growth in the nation over the past decade.  Boise, Denver and Salt Lake City have posted stellar employment growth due to the energy boom and growth in technology. The western reaches of the region — the inland parts of Washington, Oregon and California — have not done as well. These areas suffer from being “red” resource- and manufacturing-oriented economies within highly regulated, high-tax “blue states.”

    THE LEFT COAST

    The Northeast may still see itself as the nation’s intellectual and cultural center, but it is steadily losing that title to the Left Coast. This region sports a unique coastal terroir, with moderate temperatures, though it may be a bit rainy in the north. The climate requires less power than elsewhere in the country for heating and air-conditioning, making its residents’ predilection for green energy more feasible.

    Over the past 20 years, the Left Coast — the least populous nation with some 18 million people — has rocketed ahead of the Northeast as a high-tech center. It has by far the highest percentage of workers in STEM professions — more than 50% above the national average — and the largest share of engineers in its workforce as well. No place on the planet can boast so many top-line tech firms: Amazon and Microsoft in the Seattle area, and in the Bay Area, Intel, Apple, Facebook and Google, among others.

    Over the next decade, the Left Coast should maintain its momentum, but ultimately it faces a Northeast-like future, with a slowing rate of population growth. High housing prices, particularly in the Bay Area, are transforming it into something of a gated community, largely out of reach to new middle-class families. The density-centric land use policies that have helped drive up Bay Area prices are also increasingly evident in places like Portland and Seattle. The Left Coast has the smallest percentage of residents under 5 outside the Great Lakes and the Northeast, suggesting that a “demographic winter” may arrive there sooner than some might suspect.

    CITY-STATE LOS ANGELES

    Once called “an island on the land,” southern California remains distinct from everywhere else in the country. Long a lure for migrants, it has slipped in recent decades, losing not only population to other areas but whole industries and major corporations. The once-youthful area is also experiencing among the most rapid declines in its under-15 population in the nation. Yet it retains America’s top port, the lion’s share of the entertainment business, the largest garment district–and the best climate in North America.

    THE GREAT PLAINS

    The vast region from Texas to Montana has often been written off as “flyover country.” But in the past decade, no nation in America has displayed greater economic dynamism. Since the recession, it has posted the second-fastest job growth rate in the U.S., after the Inland West, and last year it led the country in employment growth. The Dakotas, Nebraska, Oklahoma and Kansas all regularly register among the lowest unemployment rates in the country.

    The good times on the Plains are largely due to the new energy boom, which has been driven by a series of major shale finds: the Bakken formation in North Dakota, as well as the Barnett and Permian in Texas. The region’s agricultural sector has also benefited from soaring demand in developing countries.

    Most remarkable of all has been the Plains’ demographic revival. The region enjoyed a 14% increase in population over the past 10 years, a rate 40% above the national average, and is expected to expand a further 6% by 2023, more than twice the projected growth rate in the Northeast. This is partly due to its attractiveness to families — the low-cost region has a higher percentage of residents under 5 than any other beside the Inland West.

    But outside of the oil boom towns, don’t expect a revival of the small communities that dot much of the region. The new Great Plains is increasingly urbanized, with an archipelago of vibrant, growing cities from Dallas and Oklahoma City to Omaha, Sioux Falls and Fargo.

    Its major challenges: accommodating an increasingly diverse population and maintaining adequate water supplies, particularly for the Southern Plains. The strong pro-growth spirit in the region, its wealth in natural resources and a high level of education, particularly in the northern tier, suggest that the Plains will play a far more important role in the future than anyone might have thought a decade ago.

    THE THIRD COAST

    Once a sleepy, semitropical backwater, the Third Coast, which stretches along the Gulf of Mexico from south Texas to western Florida, has come out of the recession stronger than virtually any other region. Since 2001, its job base has expanded 7%, and it is projected to grow another 18% the coming decade.

    The energy industry and burgeoning trade with Latin America are powering the Third Coast, combined with a relatively low cost, business-friendly climate. By 2023 its capital–Houston–will be widely acknowledged as America’s next great global city. Many other cities across the Gulf, including New Orleans and Corpus Christi, are also major energy hubs. The Third Coast has a concentration of energy jobs five times the national rate, and those jobs have an average annual salary of $100,000, according to EMSI.

    As the area gets wealthier, The Third Coast’s economy will continue to diversify. Houston, which is now the country’s most racially and ethnically diverse metro area, according to a recent Rice study, is home to the world’s largest medical center and has dethroned New York City as the nation’s leading exporter. Mobile, Ala., seems poised to become an industrial center and locus for trade with Latin America, and New Orleans has made a dramatic comeback as a cultural and business destination since Katrina.

    THE GREAT LAKES

    The nation’s industrial heartland hemorrhaged roughly a million manufacturing jobs over the past 10 years, making it the only one of our seven nations to lose jobs overall during that period. But the prognosis is not as bleak as some believe.

    Employment is growing again thanks to a mild renaissance in manufacturing, paced by an improving auto industry and a shale boom in parts of Ohio. The region has many underappreciated assets, such as the largest number of engineers in the nation, ample supplies of fresh water and some of the nation’s best public universities. With fifty-eight million people, it boasts an economy on a par with that of France.

    Yet we cannot expect much future population growth in the Great Lakes, the second most populous American nation. Its population is aging rapidly, and the percentage under 5 is almost as low as the Northeast.

    THE GREAT NORTHEAST

    The Northeast–which excludes the city-state of New York–has been the country’s brain center since before the American Revolution. This region is home to some 41 million people, and leads the nation in the percentage of workers engaged in business services, as well as in jobs that require a college education. With average wages of $76,000, $19,000 above the national average, the area boasts a GDP of $2.2 trillion, about equal to that of Brazil.

    The Northeast is one of the country’s whitest regions — Anglos account for over 70% of the population — and one of the wealthiest. In many ways, it resembles aging Western Europe in its demographic profile. The Northeast is the most child-free region outside the retirement hub of south Florida. Coupled with sustained domestic out-migration, its population growth is likely to be among the slowest in the nation in the decade ahead.

    Good thing its residents are highly educated — diminishing numbers and the consequent decline in political power suggest that the Northeast may need to depend more on its wits in decade ahead.

    CITY-STATE NEW YORK

    The Big Apple’s much heralded comeback has assured its place as one of the world’s great global cities. But the city faces challenges in terms of soaring indebtedness, rapid aging, a weak technical workforce, expensive housing and high taxes. It also will struggle with competition from rising cities of the other nations such as San Francisco, Seattle, Washington, D.C., and Houston, each of which threatens New York’s traditional role in key sectors of the economy.

    THE SOUTHEAST MANUFACTURING BELT

    At the time of the Civil War the southeastern United States was both outpeopled and outmanufactured. Today the Southeast, is the largest region in terms of population (60 million) and is establishing itself as the country’s second industrial hub, after the Great Lakes.

    It is attracting large-scale investment from manufacturers from Germany, Japan, and South Korea. Although most of the region still lags in educational attainment, the education gap with the Northeast and Great Lakes is slowly shrinking. The population holding college degrees has been expanding strongly in Nashville, Raleigh, Birmingham, Richmond and Charlotte.

    More babies and the migration of families, including immigrants, to this low-cost region suggest an even larger political footprint for the Southeast in the decades ahead. Population growth has been more than twice as fast since 2001 as in the Northeast, a trend that is projected continue in the next decade. The region looks set to become smarter, more urban and cosmopolitan, and perhaps a bit less conservative.

    CITY-STATE MIAMI

    Greater Miami often seems more the capital of Latin America than it does an American region. Its population is heavily Hispanic, and trade, finance, construction and tourism tend to focus southward. But Miami faces the constraints of an aging, and largely childless, population–which means it will continue to rely on newcomers both from abroad and from the colder regions of the U.S.

    This story appears in the September 23, 2013 issue of Forbes.

    Joel Kotkin is executive editor of NewGeography.com and Distinguished Presidential Fellow in Urban Futures at Chapman University, and a member of the editorial board of the Orange County Register. He is author of The City: A Global History and The Next Hundred Million: America in 2050. His most recent study, The Rise of Postfamilialism, has been widely discussed and distributed internationally. He lives in Los Angeles, CA.

    Mark Schill is Vice President of Research at Praxis Strategy Group, an economic development and research firm working with communities and states to improve their economies.

  • The Emerging Geography of Inequality

    Since the 1970s there has been a well-documented and persistent increase in income inequality in the United States. As the country slowly emerges out of a deep recession, it is instructive to seek out the geographic variation by states in the degree of inequality and the variation in both median and mean incomes.

    Data in this article are for households (basically IRS data), for 2009-2011. Median household income is considered the “typical” income of an area. The mean income is the aggregate income of all households in an area, divided by the number of households. This latter measure can be heavily influenced by high numbers of very affluent as well as poor households.

    Inequality is a measure of how far the distribution of incomes differs from if all households had the same income.  The gini coefficient is the most popular measure of income inequality.  But for my maps I instead use a simple measure of the difference between the median and mean, divided by the median, or the percent by which the mean is higher (or lower) than the median. Values above .39 (the figure for the US as a whole) are considered quite high. It should be noted that areas of highest or lowest incomes are not necessarily very unequal, if mostly all are rich or all are poor. Rather it is the juxtaposition of poor and rich households in the same state or area that best demonstrates the true geography of inequality.

    Median income is the best descriptive measure of the relative income of areas.  The state map is often reproduced and will not surprise the informed reader.  The highest median incomes, in descending order, are in Connecticut, New Jersey. Maryland, Alaska, Hawaii, Massachusetts, New Hampshire, Virginia and California, all over $60,000.  All but the far western AK, HI, and CA are parts of Megalopolis (minus the NY and PA core!).  The next “richest” (over $55,000) are selected northern and western states with large metropolitan populations: Washington, DC;  Delaware; Washington; Minnesota; Colorado; Utah; Nevada; Illinois; and New York.   

    States with median incomes from $50,000 to $55,000 are the ”typical” US set ( the US median income  is $51,914) and include Arizona, Pennsylvania, Rhode Island, Vermont, Wisconsin and Wyoming – but no state from the Old Confederacy outside Virginia. The 16 states with median incomes between $45,000 and $50,000 include the remaining big metropolitan states of the northeast, Indiana, Michigan, Missouri, Ohio, some more agricultural states in the Midwest, such as Iowa, Nebraska, North and South Dakota,  and the most sophisticated, metropolitan southern states , Georgia, Texas, Florida and North Carolina.

    Lower down on the income totem pole are six southern states, including Kentucky, South Carolina, Oklahoma, Alabama, Tennessee and Louisiana, and two western states, Montana and New Mexico, with median incomes between $40,000 and $45,000. Three states, Arkansas, Mississippi, and West Virginia, are at the bottom with median incomes under $40,000.  These states lack large urban areas, and in the case of Arkansas and Mississippi, retain a large and mostly poor African-American population.

    Inequality

    With the exception of New York, and its spillover to Connecticut, the northern part of the country has much lower inequality than the southern half, presumably because of a less severe racial and ethnic history, but also because of the differential history of unionization and welfare measures between north and south. The most egalitarian states are also in the North, establishing a band of lower inequality from Wisconsin through Iowa, Nebraska, Wyoming to Utah, northern New England (Maine, Vermont and New Hampshire), as well as the newest states, Hawaii, and Alaska.

    Then these are abutted by the relatively more equal states (in yellow) across the northern tier from Oregon and Washington to Indiana, Ohio, West Virginia, Maryland, and Delaware. There may be several historic  reasons for this greater degree of equality ranging from relatively low percentages of  poorer minorities such as African-Americans and Latinos; the presence of large Scandinavian and German descendants who have a historic attachment to egalitarian notions; and in some states, the strong influence of private sector unions.

    The middle set of states, orange on the map, sort of take a middle position geographically too, comprising in the east the highly urbanized  states of Massachusetts, New Jersey, Pennsylvania and Virginia, the Mid-America  trio of Missouri, Illinois and Kentucky,  and then the western redoubts of Colorado, Arizona, and New Mexico, affected by Hispanic and American Indian populations.  I can’t say why South Carolina is more equal (slightly) than any other state in the deeper South.  

    The states in green with higher inequality are a contiguous set across the traditional South, a region united by a difficult history of race relations and underdevelopment, as well as hostility to unions and public intervention on economic issues. The exception to the rule, Connecticut is due to its proximity to New York, bringing exceptionally wealthy households, overcoming otherwise more egalitarian institutions.

    Only four states, New York, California, Texas, and  Florida, plus Washington, DC have inequality above the national average of .39, indicating both their very large populations, their very complex ethnicity, and large metropolitan economies rich in high income earners, entrenched concentrations of poverty, and high levels of immigration. Surprisingly, these states are even more unequal than the poorest states with the most difficult racial history and delayed development: Mississippi, Alabama, Arkansas, and Louisiana.

    Poverty

    How does the level of poverty relate to income levels and the geography of inequality?  Consider first these simple correlations: Median income and poverty, -.62, mean income and poverty, -.44, and poverty and inequality, .57.  These relations reflect the complex patterns of income, inequality, and poverty across the states. While richer states tend to have lower levels of poverty, the weaker relation with mean rather than with median income reflects the fact that some richer states, especially New York and California, have moderately high poverty, which in turn is related to their high degree of inequality.  The moderate positive correlation of poverty and inequality is most evident in the giant states of New York, California, Texas and. Florida (and Washington DC) as well as in the deep south states of Louisiana, Mississippi, Alabama, and Georgia. In contrast there is relatively low rates of both poverty and  inequality in the same northern tier (Plains, Midwest, and Mountain) states of Wisconsin, Minnesota, Iowa, Nebraska, Wyoming, and Utah, plus the northern New England states of Vermont and New Hampshire.

    The geography of poverty, even more than that of inequality is reflective in large part of the deep and abiding income and education divide between whites and Asians versus Blacks and Hispanics. But the poverty of West Virginia and perhaps of Kentucky, and even Tennessee and Indiana also reflects an    alternative Appalachian history of settlement and culture that is largely white. At the opposite end the low poverty of Maryland, despite a high minority population, perhaps reflects the importance of federal employment.

    Conclusion

    For an old Roosevelt Democrat, the persistence of widespread poverty and deepening inequality, even while the extremely rich capture ever higher shares of income and wealth, is outrageous. It brings the United States back to the degree of inequality last recorded in 1929. It is ironic that the lowest degree of inequality in American history was 39 years ago in 1974, during a Republican administration, and fifty years after the great March on Washington.  These new maps are not pretty, and sadly there is little prospect for improvement.

    Richard Morrill is Professor Emeritus of Geography and Environmental Studies, University of Washington. His research interests include: political geography (voting behavior, redistricting, local governance), population/demography/settlement/migration, urban geography and planning, urban transportation (i.e., old fashioned generalist).