Category: Demographics

  • State Components of Population Change: 2010-2012

    What have the last two years of modest recovery meant to the growth and redistribution of population among the states? New data on the components of change for states are now available.  In March county level data will permit a more detailed portrait.

    For states I present four maps, overall population change, change from natural increase, immigration (net international migration) and internal migration between states.
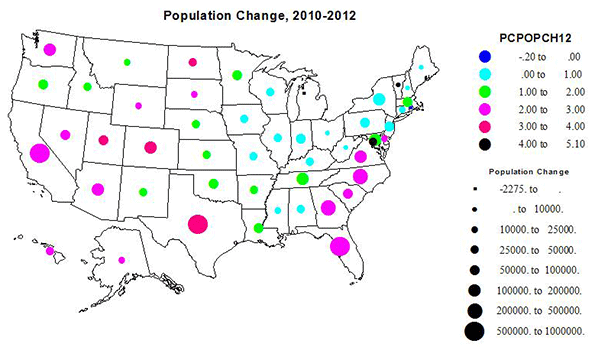
    Population Change

    Not surprisingly, most of the states with larger absolute and percent gains continue trends from the last decade: the South Atlantic states from Florida to Delaware, in the South dominantly Texas (both amount and rate), along with Colorado and Washington State as centers of substantial Western growth. But North Dakota, due to rapid energy development, is the prime addition to the “winning” state for growth, with South Dakota following. The District of Columbia had the highest rate of growth,a beneficiary of expanding government growth, and perhaps more importantly, power.

    Conversely, low rates of growth, even a loss for Rhode Island and possibly Michigan, characterize the northeast and the south central states.
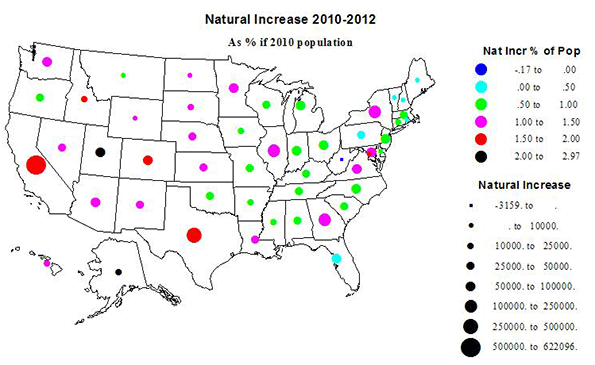
    Natural Increase

    For most states, natural increase (the difference between births and deaths) is the largest component of growth. The rates and amounts are significant to overall growth across the west, California still leads in absolute growth, entirely due to natural increase. In contrast Utah and Idaho also stand out for high rates, in part from their Mormon population.  Some slower growth northeastern states do have substantial natural increase, due to their size, including IL, MI, OH, and NY, while NC and SC and especially FL have lower rates of natural increase due to aging of their populations and migration of older people from the north.

    Immigration

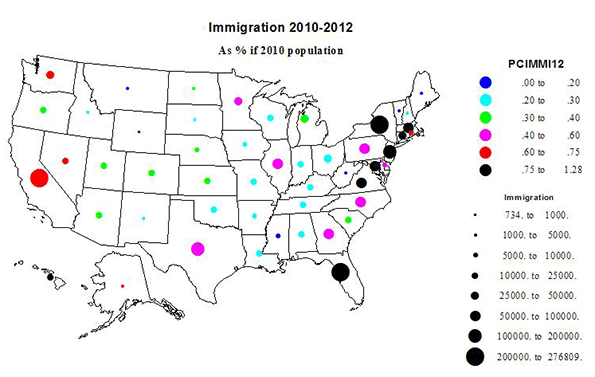
    Total US population growth from 2010-2012 was 5.17 million, of which 3.32 million was from natural increase (8.9 million births and 5.6 million deaths), leaving a substantial part of growth from international migration of 1.85 million. Despite the flak about immigration, the pace has not slowed.

    While immigration in the West (CA, WA, HI) of 277,000 remains significant, the  dominant flow of immigrants went to the  Atlantic seaboard states – how old-fashioned! – such as greater New York,  Florida, and increasingly to GA and NC. New York gained 210,000 and Florida 212,000!   Immigration was fairly modest to the interior of the country. This reflects largely the decreasing immigration from Mexico. Illinois (with a gain of 61,000 from immigration) and Texas are both are experiencing slowdowns.  And note that AZ and NM immigration have become quite small.

    The highest rate of immigration was to HI followed by NJ and FL.

    Internal Migration

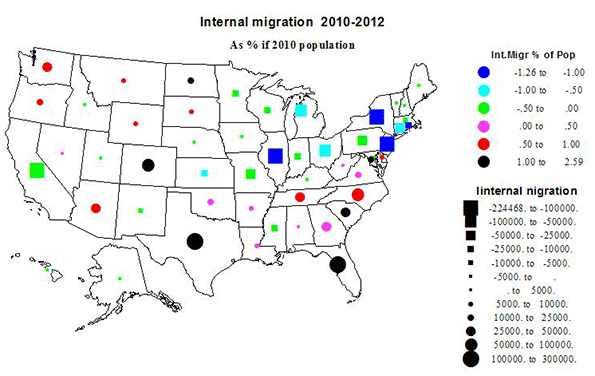
    The volume of interstate migration was still lower than was typical in the 1960s through the 1990s, but still potent in explaining the growth differential among the states.

    The pattern of absolute and relative gains and losses was essentially a continuation of trends over the last twenty years, with net in-migration to much, but not all of the South and to the West, except for California, which grows from natural increase and immigration but loses to the rest of the country. 

    Texas, with a net gain of 291,000, easily grew the most, followed by Florida (219,000), then North Carolina (72,000) and Colorado (62000). The highest rate was North Dakota, with net in-migration at 2.6% of the base population, followed by the District of Columbia (2.35%) and Colorado (1.24%). The North Dakota phenomenon is the most remarkable, since it marks an abrupt reversal from decades of loss, and of unknown duration.  In the West, Colorado became the preferred destination, followed by Washington, with Arizona and Nevada less popular than a decade earlier. South Dakota also changed to a small gain due to its strong economy and low unemployment.

    Out-migration characterized 28 states, encompassing the entire northeastern part of the country, from Minnesota to Maine, Kansas and Nebraska to Pennsylvania and New Jersey, and several states experienced high amounts and rates of loss, e.g. New York, -224,000; Illinois, -156,000; New Jersey, -103,000; and Michigan, -93,000; but the highest rates of loss were for Rhode Island, Illinois, New Jersey and New York. Outside the northeast, the biggest loss, as usual was for California: 104,000.

    Differences in Components of Change From the 2000-2010 Decade
    Population growth

    Overall the rates of population growth, of natural increase, and of international immigration are remarkably unchanged. The perhaps surprising turnarounds towards much greater rates of growth occurred in DC, LA (recovery from Katrina), and  the Dakotas. States whose growth slowed markedly were AZ, ID, NV, NM, and UT in the West (partly due to much lower migration from Mexico), and Georgia. Only RI shifted from growth to a loss.

    AK, HI, LA and ND enjoyed increased immigration, while it fell for AZ, CO, NM and TX.  Natural increase grew in ND and DC.  

    Internal migration

    DC, LA and ND changed the most, changing from losses to gains, and CO and SD had increased rates. Twelve states had lower rates of in-migration: AL, AZ, AR, DE, GA, KY, NV, NC, OK, OR, SC, and even VA – presumably a recession effect. But it was worse for seven states which shifted from gains to losses: ID, ME, MO, NH, NM, PA and VT, and for 3 states with bigger losses: CT, IN and NJ. But then seven states reduced rates of loss: CA, HI, IA, MD, MA, NE, and NY. Obvious explanations for some of these changes do not spring quickly to mind.

    What all this shows is that it is hard to make long term projections on the basis of seemingly robust trends over even fairly long periods. Preferences change, economic sectors rise and fall.

    Political Implications

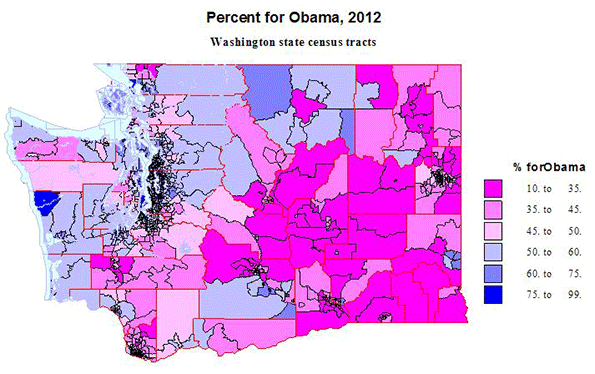
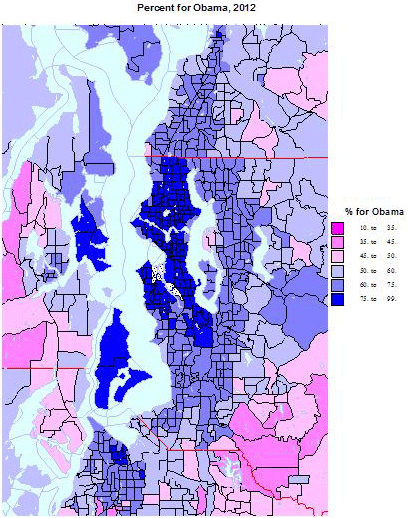
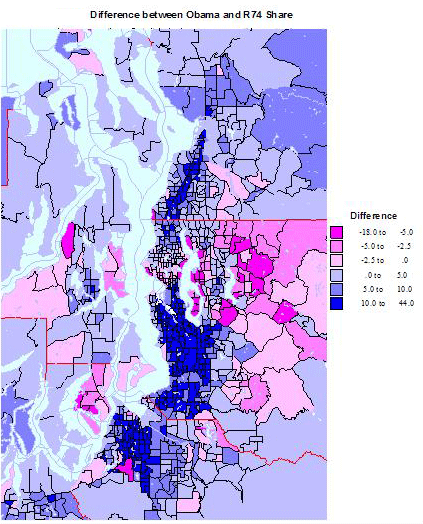
    Analysis of the 2012 elections have shown that the Obama victory is a consequence of demographic change as the country shifts from a domination of white males to a rainbow coalition of yes, white liberals, mostly urban, but propelled largely by a strongly supportive minority population moving toward a majority. At first glance the maps seem to tell us that growing areas in the South and mountain states favor the Republicans while the declining Northeast was the stronghold of Democrats. Yet it is more complex, since states like Virginia, Florida, Colorado and even North Carolina – all with large and growing minority as well as white urban populations – vote increasingly Democratic.

    Richard Morrill is Professor Emeritus of Geography and Environmental Studies, University of Washington. His research interests include: political geography (voting behavior, redistricting, local governance), population/demography/settlement/migration, urban geography and planning, urban transportation (i.e., old fashioned generalist).

  • Demographic and Economic Challenges: The 9th Annual Demographia International Housing Affordability Survey

    The just released 9th Annual Demographia Housing Affordability Survey (pdf) indicates that housing affordability has deteriorated modestly in the last year. A number of major metropolitan areas remain severely unaffordable.

    Highlights: Metropolitan Areas

    Among the 337 Metropolitan markets analyzed, Hong Kong remained the most unaffordable, with a median multiple (median house price divided by pre-tax median household income) of 13.5, up nearly a full point from last year’s 12.6. No other housing market has ever reached such an intense level of unaffordability since the Survey began (Los Angeles reached 11.5 in 2007).

    Rounding out the least affordable major markets (over 1,000,000 population) were Vancouver at 9.5, Sydney at 8.3, San Jose (US) at 7.9, and a tie in fifth place between San Francisco and London (Greater London Authority) at 7.8. The most affordable markets were Detroit at 1.5 (Note 1); Atlanta, at 2.0 (Note 2); and Cincinnati, Rochester (US), and St. Louis at 2.5 (Figure 1).

    Rating Housing Affordability

    The Demographia Housing Affordability Surveydefines four housing affordability categories (Table 1), starting with "affordable." Affordable housing markets have a median multiple of 3.0 or less, the upper bound of overall housing affordability that existed virtually across all major markets in the United States, the United Kingdom, Canada, Australia, Ireland and New Zealand before the adoption of urban containment policy (also called densification policy, urban consolidation, compact cities, smart growth, or growth management).


    Table 1

    Demographia International Housing Affordability Survey

    Housing Affordability Rating Categories

    Rating

    Median Multiple

    Severely Unaffordable

    5.1 & Over

    Seriously Unaffordable

    4.1 to 5.0

    Moderately Unaffordable

    3.1 to 4.0

    Affordable

    3.0 & Under


    Highlights: Nations

    Of all nations, only the United States has affordable major markets and a strong representation in the moderately unaffordable category. Six major markets in the United States were rated in the severely unaffordable category, including San Jose, San Francisco, San Diego, Los Angeles and New York.

    Canada had two markets rated moderately unaffordable, while one half of its major markets were rated severely unaffordable, including Vancouver, Toronto and Montréal. Ireland’s one major market, Dublin, was rated moderately unaffordable.

    One half of the major markets in the United Kingdom were also rated severely unaffordable, including London (GLA), Plymouth & Devon, the London Exurbs (Southeast and East of England), Bristol, Liverpool, Newcastle, Birmingham, and Sheffield. All of the major markets in Australia (Sydney, Melbourne, Brisbane, Perth and Adelaide), China (Hong Kong), and New Zealand (Auckland) were rated severely unaffordable (Table 2).

    Hong Kong and Singapore are the world’s largest city-states. An analysis of a large share of the Singapore market suggests a median multiple of approximately 6.0, which is substantially more affordable than Hong Kong.

    Table 2

    Housing Affordability Ratings by Nation: Major Markets (Over 1,000,000 Population)

     Nation

    Affordable

    (3.0 & Under) 

    Moderately

    Unaffordable (3.1-4.0)

    Seriously Unaffordable (4.1-5.0)

    Severely Unaffordable (5.1 & Over)


    Total


    Median

    Multiple

     Australia

    0

    0

    0

    5

    5

    6.5

     Canada

    0

    2

    1

    3

    6

    4.7

     China (Hong Kong)

    0

    0

    0

    1

    1

    13.5

     Ireland

    0

    1

    0

    0

    1

    3.6

     New Zealand

    0

    0

    0

    1

    1

    6.7

     United Kingdom

    0

    0

    8

    8

    16

    5.1

     United States

    20

    20

    5

    6

    51

    3.2

     TOTAL

    20

    23

    14

    24

    81


    Longer Term Trends

    Over the years of the Demographia International Housing Affordability Survey, housing affordability has improved by far the most in Ireland. It has also improved in the United States. Affordability in Canada’s major markets was the most favorable in 2004, but has seen large Median Multiple increases in each of the three largest metropolitan areas. As a result, there is increasing concern about housing affordability in Canada.

    Australia and New Zealand have had the most unaffordable major markets, with every market being severely unaffordable in every year, reflecting earlier adoption of densification policy by states and metropolitan areas. Housing affordability has also been severely unaffordable in United Kingdom major markets over the period covered (Figure 2).

    A Competitive Land Supply: Key to Housing Affordability

    Overwhelming economic evidence indicates that urban containment policies, especially urban growth boundaries raise the price of housing relative to income. This inevitably leads to a reduced standard of living and increases poverty rates, because the unnecessarily higher costs of housing leave households with less discretionary income to spend on other goods and services. The higher costs ripple into rental markets, tightening the budgets of lower income households, who already suffer from lower discretionary incomes.

    The principal driver of unaffordable housing relative to median incomes is failure to maintain a "competitive land supply." Brookings Institution economist Anthony Downs describes the process, noting that more urban growth boundaries can convey monopolistic pricing power on sellers of land if sufficient supply is not available, which, all things being equal, is likely to raise the price of land and housing that is built on it. This has, more often than not, been associated with urban containment policy and virtually never with the more liberal land use policy that preceded it.

    Recent Policy Developments

    The last year has seen public policy progress. The New Zealand central government plans to expand the land supply and provide alternatives for infrastructure finance, both of which are likely to lead to improved housing affordability. In his Introduction to this years’ Survey, Hon. Bill English, Deputy Prime Minister of New Zealand pinpoints the factors leading to the policy changes:

    It costs too much and takes too long to build a house in New Zealand. Land has been made artificially scarce by regulation that locks up land for development. This regulation has made land supply unresponsive to demand. When demand shocks occur, as they did in the mid-2000s in New Zealand and around the world, much of that shock translates to higher prices rather than more houses.

    The Conservative-Liberal Democrat Coalition is proposing policies to build housing on more competitively priced land, to improve housing affordability. Planning Minister Nick Boles has called Britain’s lack of housing affordability "the biggest social justice crisis we have," and called it bigger than education and unemployment (video). These proposals have been long in coming. It has been four decades since Sir Peter Hall and associates documented the consequences of urban containment, and nearly a decade since the similar conclusions of Kate Barker for the Labour Government.

    In Hong Kong, facing public demonstrations on issues such as housing affordability, the government has adopted a plan to improve housing affordability.

    However, the policy is deteriorating in California, where state regulations could virtually outlaw new single-family housing on the urban fringe. In the last year housing affordability losses have been substantial and could portend another housing bubble in this state that precipitated Great Financial Crisis with its egregious house price increases.

    Evolving Perspectives

    Planning perspectives could be evolving. New York University Professor Shlomo Angel writes in his book Planet of Cities of the importance of housing affordability and argues against urban planning restrictions that restricting adequate housing to ordinary households.

    A team of UK academic researchers questioned the "default" preference for urban containment policy. This is an important development, since much of urban planning is committed to outlawing more liberal land-use policies.

    The Economic Challenge

    Nations around the world face serious economic challenges. Governments have taken on unaffordable obligations, and repayment continues to elude authorities in the United States, the European Union, and elsewhere. Future demographic trends are likely to only exacerbate this difficulty, driven by plummeting birth rates and a rising elderly population (See The Rise of Post-Familialism: Humanity’s Future?).

    Urban policy needs a "reset." The emphasis should be shifted away from "designing" urban areas toward facilitating a better standard of living for the people who live in them. In his epic Civilization: The West and the Rest, historian Niall Ferguson, in his Civilization notes that

    The success of the civilization is measured not just in its aesthetic achievements but also, and surely more importantly in the duration and quality of life of its citizens.

    This requires greater affluence and less poverty, both of which require more affordable housing.

    —–

    Note 1: The city of Detroit has experienced a severe economic decline. However, the Detroit metropolitan area (which includes the city, the suburbs and exurbs) has fared much better. The city (municipality or local government authority of Detroit experienced a population loss from 1,850,000 to 714,000 in the last 60 years, while suburban and exurban areas added 2.2 million. There are a variety of theories about Detroit’s municipal decline, involving both "push" and "pull" factors (such as the incompetence and corruption of the municipal government to the not unrelated attraction of suburban living).  Further, the overall population growth rate of the Detroit metropolitan area has not been strong, but exceeded that of the other three worst hit "Rust Belt metropolitan areas, Cleveland, Buffalo and Pittsburgh (which lost population). Metropolitan Detroit’s growth rate was similar to that of the New York metropolitan area (35 percent compared to 42 percent), which ranked 46th in growth (out of 51) compared to Detroit’s 48th.

    Note 2: At the peak of the housing bubble, affordability deteriorated to a moderately unaffordable 3.1 in Atlanta. Atlanta had been among the high income world’s fastest-growing metropolitan areas for at least three decades, but slowed briefly during the Great Financial Crisis. Growth has returned, with Atlanta ranking third in net domestic migration among US metropolitan areas with more than 5 million population.

    —-

    Photograph: Hong Kong (by author)

    Wendell Cox is a Visiting Professor, Conservatoire National des Arts et Metiers, Paris and the author of “War on the Dream: How Anti-Sprawl Policy Threatens the Quality of Life.”

  • California’s Politics of Farce

    Karl Marx wrote, "History repeats … first as tragedy, then as farce." Nothing better describes how California, with its unmatched natural and human riches, has begun to morph into what the premier California historian Kevin Starr has called "a failed state" – a term more usually applied to African kleptocracies than a place as blessed as the Golden State.

    The tragedy begins with the collapse of a governance system once widely hailed as a leader in efficiency and foresight but which now perpetually teeters at the brink of insolvency and suffers among the worst credit ratings of all the states. Only 20 years ago, the state’s fiscal debt per capita was just below the national average; now it ranks consistently toward the bottom No surprise, then, that California routinely ranked as the "worst governed" state in America.

    This poor performance has consequences, particularly in terms of business. Today, CEOs rank California as just about the worst place to do business in the country, and have for a remarkable eight years in a row. And it’s not just the plutocrats who are angry; a survey by the economic forecasting firm EMSI shows that, in 2011, California also ranked 50th, just ahead of Michigan, in new business startups.

    Unlike my conservative friends, I do not think the fault lies entirely with the Democrats. Instead, it has to do with the total eclipse of the state’s once-lively two-party system. As Starr has noted, California’s golden age of governance from the 1940s to the 1960s was largely a bipartisan affair, with power shifting between the parties. "Despite their differences," Starr writes, "Democrats and Republicans saw sufficiently eye-to-eye" to embrace policies that drove California’s growth.

    Progressives, for their part, often suggest this paradigm died with the 1978 passage of Proposition 13, which diminished local government and concentrated fiscal power in Sacramento. Yet even as late as early 1990s, when the state was facing a dire recession due to the end of the Cold War, liberal Democrats such as Assembly Speaker Willie Brown and state Sen. John Vasconcellos managed to work well with Republican Gov. Pete Wilson and business leaders like Peter Ueberroth to force policy changes that helped spur the state’s last sustained recovery.

    The more recent demise of California governance stems from demographic trends and political miscalculations that have turned our state increasingly into something akin to Mexico under the old dictatorship of the PRI (Institutional Revolutionary Party). Wilson’s decision to embrace the anti-illegal-immigration measure Prop. 187 as part of his 1994 re-election strategy helped precipitate this shift. Although Prop. 187, which passed easily, helped in the short run, it crippled the Republican Party in the ensuing decades.

    Before 1994, Republicans were capable of winning upward of two-fifths of the Latino vote. But after that, as the Latino portion of the electorate grew, from 7 percent in 1980 to more than 21 percent today, these voters became, much like the African-American vote, essentially a bloc owned by the Democrats. In 2010, Jerry Brown won nearly two-thirds of their votes in his bid to return as governor. Asian voters, despite their decidedly middle-class and entrepreneurial bent, sensed the whiff of nativism among Republicans and also turned to the Democrats. With minority communities’ share of the electorate growing every year, the GOP essentially has backed itself into permanent minority status.

    This has set the stage for a bizarre political farce, where minority representatives in Sacramento – with few exceptions – consistently vote against the interests of their own constituents on issues such as water allocations in the Central Valley or regulations that boost energy and housing prices. In their clamor to join the "progressive" team, they, in effect, are placing the California "dream" outside the reach of the state’s heavily minority working class.

    It’s almost surreal to see people who represent impoverished East Los Angeles and Fresno, for example, vote exactly the same way as those who represent rich, white and older voters in Marin County and Westside Los Angeles. You don’t have to watch "Downton Abbey" to see "upstairs, downstairs" politics. Despite mouthing progressive rhetoric, California’s minority legislators seem intent of creating an increasingly feudalized California.

    And what of the middle class – once the bastion of both the GOP and the kind of "responsible liberalism" that promoted growth under the late Gov. Pat Brown? This largely Anglo group has been shrinking, both for decades as a percentage of California’s population and, during the past 10 years, in absolute numbers. From 2000-10 the number of non-Hispanic whites in the state dropped from 15.8 million to 14.95 million.

    Increasingly, the residual California middle class is either part of the public sector nomenklatura or the swelling ranks of retirees. These people often feel no compulsion to leave California for the reasons – such as weather and high property taxes – that drive their counterparts out of places like New York or Illinois. In contrast, the productive, working-age private middle class, harassed by taxes, regulations and soaring costs, increasingly appears more of an endangered species than the famed Delta smelt.

    Of course, there remain pockets of private sector strength, such as Silicon Valley and Hollywood, as well as the various biomedical and biotech companies that still thrive in places such as Orange County and San Diego. These, however, increasingly represent legacy industries, beneficiaries of past accomplishments and better entrepreneurial conditions. Yet, even here, despite the current tech boom, California’s position over the past decade has declined relative to more business-friendly states.

    In the immediate future, we should expect more of the same from our one-party government. Flush from the passage of Prop. 30, tax increases backed by public sector unions, there is little to restrain them beyond occasional resistance from Gov. Brown. Having made California’s income taxes the highest in the U.S., legislators and local officials are already busily concocting new taxes, fees and another spate of bond issues to prop up the nation’s most-cosseted public sector, and, of course, fund its rich pensions at the expense of mostly middle-class taxpayers.

    Indeed the emphasis on income taxes, representing now close to half of state revenue, creates perverse economic outcomes. With their funds hidden in overseas accounts and other dodges, Hollywood moguls and their Silicon Valley counterparts may hang around, mouthing progressive shibboleths while dining exquisitely. But there is clearly erosion among the less-glamorous entrepreneurial class. The number of households earning above $300,000 dropped by 45,000 from 2006-09, according to the Department of Finance, while those earning under $100,000 has grown by more than 180,000. It’s likely that Prop. 30 will accelerate this trend.

    But it’s not only taxes that will depress growth. Our Mad Hatter one-party, public-sector-dominated state seems keen to press its regulatory assault on employers and job creators. With climate change-related legislation certain to boost already high energy costs, we also can expect industries, from food processing to semiconductors and aerospace, to continue heading to friendlier locales.

    Unless these policies are challenged, California will continue to underperform well below its potential. Even worse, a state that created the modern American Dream of upward mobility will continue to devolve toward a kind of neofeudalism dominated by a few rich, with many poor and a well-fed, tenured government caste. The only way to halt this continuing farce in Sacramento is for Californians of all backgrounds to recognize that government that so earnestly claims to serve "the people" is doing anything but that.

    Joel Kotkin is executive editor of NewGeography.com and a distinguished presidential fellow in urban futures at Chapman University, and a member of the editorial board of the Orange County Register. He is author of The City: A Global History and The Next Hundred Million: America in 2050. His most recent study, The Rise of Postfamilialism, has been widely discussed and distributed internationally. He lives in Los Angeles, CA.

    This piece originally appeared in the Orange County Register.

  • Rust Belt Cities: Invest in Odysseus, Not Barney Fife

    Given its legacy of shrinking, the Rust Belt has issues. The issues arose naturally, and relate to the fact things leave, or that so much has left. Particularly, when things leave, the mind—both the individual and the collective city mind—can get protective and restrictive. Neediness arises. The smell of desperation ensues like a pall that can tend to hang over cities, influencing decision making on all levels.

    Enter “brain drain”, or that term coined to refer to the outmigration of an area’s educated citizens, particularly it’s young. You know the drill: Johnny goes to State college, comes back home for a spell, but then leaves Cleveland, Ohio for Chicago or New York. That is brain drain. And city leaders hate it, spending billions of dollars to stop it—often at the cost of coming off ridiculous, lame.

    For instance, in Pittsburgh, there was a civic booster campaign thought up to keep educated folks from going. It was called “Boarder Guard Bob”. According to researcher Chris Briem, “Bob” was a Smokey-the-Bear-type of public service announcement made into a Barney Fife character, with the billboard-size messaging of “Bob” intended to “stop young people at Western Pennsylvania’s borders before they had a chance to leave for other cities”. And while this particular retention strategy (luckily) never went to print, various “plug the brain drain” strategies persist in one form or another at exorbitant cost to taxpayers.

    But beyond the near-pitiful messaging, there are major problems with the brain drain approach, especially from an economic development perspective. For example, when, as a community, you are intentionally telling your citizen’s not to go, you are asking them to sacrifice personal development for the benefit of a place. To this point, my colleague, Jim Russell—a leading thinker in brain drain boondoggles and blogger at Burgh Diaspora—says it best, stating: “Discouraging geographic mobility is the same as restricting access to higher education”. In other words, it’s like telling Johnny to stick with his high school diploma so as to forego leaving the community for a 4-year degree.

    What’s more, getting people to stay put does little to grow a local economy. In fact it hurts it. Because leaving home is often a rite of passage. It develops a person. I mean, can you imagine if there was no odyssey in the epic Odyssey? If so, Odysseus wouldn’t be the changed man with perspective and experience as he was when he returned back to his homeland, and so there’d be no “there” there. In this sense, the Rust Belt needs to engage their young to embark on their own “Hero Journey” if only to gain skills and broaden geographic connections. This is international economics 101 (see China, India, Brazil, etc.). It should be a domestic economic priority for the Rust Belt, and it would be if only the Cleveland’s of the world could let go of the protectionism that defines their longstanding existential fears of shrinking into one big pile of ruin porn.

    Of course confidently encouraging outmigration is part and parcel with an understanding that many expats will “boomerang” back. But many are, and at a faster rate. To wit: as the alpha cities of the America like NYC get too expensive or creatively-class cute, many Rust Belt refugees are pivoting back from a certain left-wanting lifestyle if only for the opportunity, tradition, and honest-to-god reality that is “Rust Belt Chic”. And when they do, they often become “economic ass kickers”, which is term Russell uses to exemplify the fruits of the Hero Journey that is not only individually experienced, but felt in the local economy as well.

    Take Sean Watterson, the co-proprietor of the wildly successful restaurant the Happy Dog on Cleveland’s Near West Side. He moved back from D.C. because, according to a recent Plain Dealer article, “Cleveland-ness is like Polish-ness or Irish-ness. It’s an ethnicity”. Here, Watterson not only runs a great hot dog business, but uses his establishment to advance a circulation of ideas by hosting a variety of events like “Life, the Universe, and Hot Dogs”, which is a series hosted by researchers from the Institute for the Society of Origins. Another big hit is the live performances by members of the Cleveland Orchestra called Classical Revolutions.

    Cool sounding events, sure. But there is more to it than that, as such happenings spark cross-fertilization between parts of Cleveland—the blue collar West Side and the intelligentsia of the East Side—that have long been divided, often at the cost of Cleveland as a place of cultural and economic innovation. And how exactly does Watterson’s own “Hero Journey” come into play in his self-stated goal to break down barriers “between east and west and between high culture and low culture”? It likely relates to the fact he experienced experience outside of a legacy city bubble that enabled him to see and cross bridges that others have difficulty envisioning.

    Now, does this mean that cities simply need to let people leave to prosper? Obviously not. If the place expats are boomeranging back to is stagnant and disparate, with openness and connection disabled by a collective insular mentality that: “that’s just the way things are done around here”, well, the boomeranging effect won’t hold. And the economic ass-kickers won’t ass-kick.

    The goal, then, of cities should be on fostering return migrant connections, or to know who they are, why they are there, and to help get them together so that their collective unchained perspective can pop bubbles of inert status quo. This need is real. For instance, take this first-hand return migrant account published in Rust Belt Chic by Dana Marie Textoris:

    Funny how your location-based identity, your physical and mental place in the world, can flip like a switch: Before I was a Clevelander managing to make it in San Francisco….right now I feel a lot like a San Franciscan stuck in Cleveland. In either place, I felt just a little bit Other. A bit of a novelty. Just a tad on the outside looking in. Where does that leave me? Where is home? As I type this, I realize, with sort of an internal groan, that the place I’m left in, the guide to what I’m searching for, is probably just right here, inside me, where my two lives — West Coast and Midwest — are now combined. I’m not really a true Clevelander anymore…I’ve picked up way too much San Francisco for that. The balance I’ve become, a little of this and that, is just what I’m hoping I’ll find, one day.

    So, to all Rust Belt cities—this is where your attention must be turned: not on the ones who are leaving for good reason, but on those returning who have not left for good. They have brought the path of their self-discovery back to your doorstep.

    Don’t close the door by screaming at the backs of others.

    Richey Piiparinen is a writer and policy researcher based in Cleveland. He is co-editor of Rust Belt Chic: The Cleveland Anthology. Read more from him at his blog and at Rust Belt Chic.

  • How Polarization Plays Out in Washington state: Voting for President and the Same-sex Marriage

    Washington may be a left coast “blue” state, but the geography of the voting well illustrates the national phenomena of intensifying polarization.  The division may be among individual people,   but also expressed in geographies down to precincts and census tracts. 

    The Washington 2012 elections provided ample data to assess this political and geographic divide. I review here the two most polarized races, for president (Obama vs. Romney) and for R74, to reaffirm the right to same sex marriage.  

    Here are a series of 6 maps, 3 for the presidential race, for the state as a whole, and for the greater Seattle area, and one showing just the extreme tracts for Obama in the Seattle area, and 3 for the R74 contest, for the state, for greater Seattle and again of just the extreme tracts, all in the city of Seattle.  These maps illustrate the extreme dimensions of polarization impacting the regions.         

    The results suggest three overlapping dimensions. The dominant one is itself ecological – that is the urban-rural, or better large dense metropolitan territory versus rural, small towns, with smaller cities and metropolitan suburbs in between, and less polarized geographically. The strongest correlations in demographic variables are transit use vs. SOV use, density, single persons, and multi-family versus mobile homes.  

    These factors apply to both the Obama race and for R74, but more strongly for Obama. The second dimension is of social liberalism, and is characterized by variables on household relationships, unmarried partners, gay and lesbian, education, e.g., share  with BA vs. with high school only, occupation, e.g., percent managerial professional vs. percent in laboring and construction occupations. The social divide also shows difference by age, those 20-34 more liberal, areas with high shares under 18, that is families, more conservative. This dimension too applies to both contests, but more strongly to R74. The third dimension is race, minority racial areas vs. more white areas, and positively correlated with support for Obama, although the Asian share is much more related to support for R74.  In Washington we will see that the racial dimension really is somewhat distinct from the urban-rural, as Obama did well, but R 74 did poorly in rural small town areas that are now heavily minority (Hispanic and Native American).

    In a few cases with a large difference should be noted. Areas dominantly white are non-supportive of Obama, but not opposed to R74.  Similarly, areas high in managerial-professional occupations and higher education generally are more correlated with support for R74, than for Obama.

    Obama carried Washington state by 464,000 votes, 56 to 44 percent, and R74 won by some 229000 votes, 54 to 46 percent.  Consider first the maps for Washington State as a whole, realizing that like the US as a whole, rural territory dominates most of the physical space.  I use the same intervals for mapping, so comparison is easier.  The main difference between the Obama and R74 maps is race and ethnicity – many of the lighter blue rural small town areas are  Native American Indian reservations, or strongly Latino areas, which voted for Obama, but also cast ballots overwhelmingly against R74, likely reflecting the role of local churches. Obama also did better than R74 in traditional logging areas of western Washington, a continuation of a long history of their identification with Democratic voting, but more conservative on the social issues like same sex marriage. 

    Rural to smaller city areas voting for both Obama and R74 include university towns, notably Pullman (Washington State in eastern Washington,  Bellingham  (Western Washington U), Olympia, the state capitol, and many areas of “spillover” of more educated and professionals, out of the Seattle core to desirable water and mountain environments, for retirement and second homes,    At the other extreme are two areas in western Washington which are extremely “red” , the Centralia area in southwestern Washington,  and the city of Lynden, up at the border with Canada, and still dominated by its Dutch Reformed church adherents.

    Turning to the equivalent maps for Obama and R 74 for the greater Seattle area, with two-thirds of the state population, the picture is broadly the opposite of that for the state. Here blue dominates, with “red” areas pushed to the rural edge.  But the differences in the maps are interesting, illustrating the dimensions of polarization.  The Obama map exhibits a simpler belted pattern, the dense urban core, the city of Seattle with spillover north and south, with an inner suburban belt of moderate Obama domination (60 to 75 percent) and an outer suburban and exurban ring. This pattern was repeated for the city of Tacoma to the south. To the west, however, are two islands of very high Obama support, Vashon and Bainbridge, with very high proportions of professionals commuting to the Seattle core. Areas of support for Romney include a few fairly close in affluent areas and more rural areas, including actual farming areas to the southeast.

    The map for R74 is subtly different. The area of strongest support is reduced to the city of Seattle, plus the commuter islands, but support for R74 is quite a bit weaker in less affluent and educated black and latino areas. Likewise the majority of inner suburban areas are still supportive for Obama but far less than the core. These are mainly family areas, while the areas of highest support in the city are dominated by singles and childless couples, including unmarried partners.

    Conversely, moderately higher support for Obama and R74 extends somewhat farther east to affluent educated suburbs, e.g, the Microsoft workshed, which is also high in Asian population.  The final two maps are of the tracts with the highest support for Obama and for R74, most of which are confined to the city of Seattle. The areas of over 90 % support are two: the historic CD or Central District, which defined the Seattle Black population as of 1970-1980, not much gentrified at the north end, but also including the core of Seattle’s GLBT community (the westward extension over 90 %. The second area is in near north Seattle, extending from west of the University of Washington westward  in areas dominated by young singles and unmarried couples, including many students. The map for R74 is quite different, with no areas of extreme support to the south of the core GLBT area, but with stronger support than for Obama in the highly affluent and professional areas, just north of the GLBT core.

    Clearly the 3 dimensions of polarization, by settlement type, by social values-education, and by race, all are exemplified by the map results. The geographic concentration of the vote, especially for R74 can be seen in these amazing numbers:

    Vote Results in Washington State
    State State Outside King Co. King Co Seattle King Co. Outside Seattle
    Obama 1,755 1,087 668 279 389
    Romney 1,291 1,015 276 46 230
    Difference 464 72 392 233 159
       
    R74 yes 1,660 1,021 639 274 365
    R74 no 1,431 1,107 315 57 258
    Difference 229 -86 324 217 107


    Obama carried the state by 464,000. Half of this was accounted for by just the city of Seattle. The
    Pro vote for R74 was even more concentrated in the metropolitan core, as the margin just in the central  city of Seattle , 217,000, was essentially the margin for the state!  King County outside Seattle provided an additional margin of 107,000, offsetting a net loss of 86,000 in the entire rest of the state, where the vote was 1,107,000 to 1,021,000 against. 

    It is similarly amazing to note the relative location of areas with very high or very low vote shares for Obama and for R74.  Eighty-nine census tracts were carried by Obama with over 85% of the vote and 83 tracts voted more than 83 percent for R74. The distributions were:

    Number of Census Tracts Voting 85% for Obama or 83% for Measure R74
    Obama R74
    North Seattle 37 33
    Central Seattle 19 26
    South Seattle 26 1
    Pierce (Tacoma, reservation) 1  
    Whatcom (WWU) 2 2
    Whitman (WSU) 2 1
    Yakima (Reservations) 3  
    Thurston (Olympia) 1  

    Eighty-two of 89 of tracts with high Obama shares were in the city of Seattle, dominating the city and well distributed across it. The other 7 were in Tacoma, Olympia, Whatcom and Whitman, both university communities, and in Yakima county Indian reservations.  All these tracts were urban core tracts, except for those on the Yakama reservation.   Sixty of 63 tracts with the highest shares for R74 were in the city of Seattle,  concentrated in the north (University of Washington dominated) or highly professional, and in the center, home of the large GLBT community, with few in the south of the city, which is less affluent and higher in minorities.  The remaining 3 are in Whatcom (WWU) and Whitman (WSU). All these tracts are urban.

    The distribution of tracts with very low shares for Obama and for R74 shows the other side of the   polarization.  Of the 71 tracts where Obama received less than a third of the vote, 34 were in south central Washington, the region of the Tri Cities of Richland, Kennewick and Pasco, Yakima, county and Grant county, home of the Columbia basin irrigation project, all areas high in Mormon and Latino populations. Another 19 were in north central and northeastern Washington, including much of Okanogan and Lincoln counties, and even some exurban counties around Spokane. Another 8 were in southeastern Washington (wheat country), leaving 9 in western Washington.  Three each were in rural parts of Clark County and Lewis County in the southwest, and 3 were in the very conservative small city of Lynden, on the Canadian border, and home of a large Dutch reformed community. All these tracts are rural except for the city of Lynden and 3 suburban tracts in the Tri-Cities.

    Similarly, of 81 tracts with shares below one third for R74, 32 were again in south central Washington, 21 in north central and northeastern Washington, 4 in the southeast, and now a larger 15 in western Washington. The Lynden area of Whatcom county accounts for 4, but now 6 in socially conservative Lewis County, 4 in rural parts of Clark County, and 2 in family dominated military parts of Pierce County.  All these tracts are rural, small town, except for those in Lynden, again in suburban Tri-cities and 2 in suburban Tacoma.

    Differences between Obama and R74 Shares

    The last discussion compares the vote for Obama and for R74, identifying areas with the greatest difference, recalling that the overall correlation was a very high .87.  Please also see Map 7.

    The Obama vote exceeded the share for R74 by more than 20 percent in 56 census tracts.
    In rural areas Obama did well with the large Latino vote, which also voted against R74. This was true as well in Indian reservation tracts.  In Seattle and Tacoma the tracts are mainly lower to middle class, worker areas, Black or Latino or both.  All of the King county tracts were in south Seattle, extending southward into lower and middle class industrial suburbs.

    The R74 vote exceeded the Obama vote by 5% or more in 51 tracts.

    Overall, R74 fared better than Obama in affluent professional areas, socially more liberal but economically more conservative.  But the pattern surprisingly occurs in several military base areas, as in Island and Kitsap counties. In 15 tracts R74 won but Obama lost, all affluent suburb or military areas in several parts of the state.  In King the 4 tracts are the 2 richest tracts in the state plus 2 near the Microsoft Redmond campus.  In 12 tracts both Obama and R74 won, but R74 polled higher. These tracts were spread across the state, in mainly exurban economically conservative areas. In 24 tracts Obama and R74 won. All but one were in King, most in the professional suburbs east of Seattle and a few in the wealthiest tracts inside the city of Seattle.

    Conclusion

    The electorate of Washington, like that of the country, is ideologically divided, and which is manifest geographically in the familiar red and blue mosaics. Washington overall is on the economically and socially liberal side, although statewide maps would not recognize the degree of this, simply because of the extreme concentration of these sub-populations in the urban cores, and especially in and around the   city of Seattle.

    Richard Morrill is Professor Emeritus of Geography and Environmental Studies, University of Washington. His research interests include: political geography (voting behavior, redistricting, local governance), population/demography/settlement/migration, urban geography and planning, urban transportation (i.e., old fashioned generalist).

  • California’s Demographic Dilemma

    It’s been nearly 20 years since California Gov. Pete Wilson won re-election by tying his campaign to the anti-illegal immigrant measure Proposition 187. Ads featuring grainy images of presumably young Hispanic males crossing the border energized a largely white electorate terrified of being overwhelmed, financially and socially, by the incoming foreign hordes.

    The demographic dilemma facing California today might be better illustrated by pictures of aging hippies with gray ponytails, of legions in wheel-chairs, seeking out the best rest home and unemployed young people on the street corner, watching while middle-age families drive away, seeking to fulfill mundane middle-class dreams in other states.

    The vital, youthful California I encountered when moving here more than 40 years ago soon could be a thing of the past – if we don’t address the root causes of an impending demographic decline. The days of fast population growth have certainly passed; the state’s population growth barely equaled the national average in the past decade. In the urban strips along the coasts, particularly in the Los Angeles Basin, growth has been as little or half that level.

    To be sure, particularly in this region, few would want to see a return to breakneck population growth. But there’s little denying that California has shifted from a vibrant magnet for the young and ambitious to a state increasingly bifurcated between an aging, predominately white coastal population and a largely impoverished, heavily Hispanic interior. This evolution, as suggested in last week’s essay, has much to do with what passes for "progressive" policies – high taxation, regulation and an Ecotopian delusion that threatens to crush the hopes of many blue-collar and middle-class Californians.

    California’s consistent net outmigration over the past two decades continues, albeit at a slower rate. Over that period, California, notes a recent Manhattan Institute report, has lost a net 3.4 million people. This outflow has slowed with the recession and housing bust, but could swell again, as in the past, when the housing market recovers, and people can sell their homes.

    This long-term outmigration likely stems from a combination of persistently weak job growth, relatively higher unemployment rates amid generally far higher housing prices. Until 1970, notes demographer Wendell Cox housing prices in California, including Los Angeles and Orange County, were generally in line with national averages, adjusted for income.

    But over the past four decades, California’s housing prices relative to income have mushroomed to more than twice the national average. This is particularly true in places such as Orange County, where housing prices, particularly near the coast, are so high that younger even solidly middle-class families have little chance to enter the market.

    These high prices are the result not merely of market forces, but also the perverse impact of Proposition 13, which allows people to stay longer in their homes, as well as regulatory restraints on new housing construction. The regulatory vise, if anything, is almost certain to get worse as the state’s "climate change"-inspired regulations seek to all but ban new single-family house construction, all but guaranteeing higher prices.

    Until recently, the impact of net outmigration has been ameliorated by immigration, not just the kind memorialized in Wilson’s grainy ads but of the legal variety, as well. Over the past decade, however, immigration enforcement data indicates that California has suffered a gradual erosion in its appeal to immigrants; this is particularly true for the L.A. Basin. In 2000, for example, Los Angeles-Orange County received 120,000 new immigrants; a decade later the annual intake had dropped by 87,000.

    Essentially, immigration into the L.A. Basin fell 27.5 percent while immigration nationwide remained essentially stable; the numbers of Houston, Dallas, Seattle, Washington and New York, in contrast, remained level or grew.

    Particularly troubling has been the relative decline in Asian immigrants, whose numbers now surpass Hispanics, and who also tend to be better educated than other newcomers. An analysis of migration of Asians conducted by demographer Wendell Cox, shows Asians heading increasingly to places like Houston, Dallas-Fort Worth, Raleigh, N.C., and Nashville, Tenn. Still home to the largest concentration of Asian-Americans, the L.A. Basin’s growth rate is now among the lowest in the nation, 24 percent in the past decade, compared with 39 percent in New York, and more than 70 percent in Dallas-Fort Worth and Houston.

    Some, like USC’s Dowell Myers, suggest slowing migration and population growth may actually be a positive, and claims "the demographic picture is brighter than it is has been in decades." He suggests that, rather than depend on the energy of newcomers, we now ride on "the skills of homegrown Californians."

    Certainly, slower growth may help with our traffic problems and even provide a break on housing inflation, but the contours of our demographics appear less than favorable. Over the past decade, for example, virtually all the largest metropolitan areas – including Silicon Valley – have seen slower percentage growth in college graduates than the national average. The big exception has been Riverside-San Bernardino, which started from a low base but has appeared to attract some college-educated people from the more expensive coastal regions.

    In contrast, largest rate of growth in educated people has taken place in regions such as Raleigh, N.C.; Austin, Texas, Phoenix and Houston; all these cities have increased the number of bachelor’s degrees at least one-third more quickly than the major California cities. Although California retains a strong educational edge, this is gradually eroding, particularly among our younger cohorts. In the population over age 65, California ranks an impressive fourth in terms of people with bachelor’s or higher degrees; but in the population under 35 our ranking falls to a mediocre 28th. If we are becoming more reliant on our native sons than in the past, we may be facing some serious trouble.

    This pattern can also be seen in those with graduate educations, where we are also losing our edge, ranking 19th among the younger cohort. More worrying still is the dismal situation at our grade schools, where California now ranks an abysmal 50th in high school attainment. Our students now rank among the worst-performing in the nation in such critical areas as science and math.

    If these issues are not addressed forcefully, what then is our demographic trajectory? One element seems to be a decline in the numbers of children, particularly in the expensive coastal areas. Over the past decade, according to the Census, the Los Angeles-Orange County region has suffered among the most precipitous drops in its population under age 15 – more than 12 percent – than any large U.S. metropolitan area.

    The numbers are staggering: in 2010 the region had 363,000 fewer people under age 15 than a decade earlier, while competitors such as Dallas-Fort Worth and Houston increased their youngsters by over 250,000 each. Orange County alone suffered an 8 percent decline in its under-15 population, a net loss of 54,000.

    If current trends continue, we may not be able to rely on immigrants to make up for an nascent demographic or vitality deficit. In fact, demographer Ali Modarres notes that L.A.’s foreign born-population is now older than the native-born, as their offspring head off for opportunities in lower-cost, faster-growing regions.

    Ultimately the state’s political and economic leadership needs to confront these demographic shifts, and the potential threat they pose to our prosperity. We can’t just delude ourselves that we attract the "best and brightest" from other states without creating improving the basics critical to families, from other states and abroad, such as education, reasonable housing costs and business climate. California ‘s beauty, great weather and a bounteous legacy remain great assets, but the state can no longer rest on its laurels if it hope to attract, and retain, a productive population capable of rebuilding our state’s now-faded promise.

    Joel Kotkin is executive editor of NewGeography.com and a distinguished presidential fellow in urban futures at Chapman University, and a member of the editorial board of the Orange County Register . He is author of The City: A Global History and The Next Hundred Million: America in 2050. His most recent study, The Rise of Postfamilialism, has been widely discussed and distributed internationally. He lives in Los Angeles, CA.

    This piece originally appeared in the Orange County Register.

    Photo illustration by krazydad/jbum

  • The Evolving Urban Form: Kuala Lumpur

    The Kuala Lumpur region of Malaysia is generally defined by the state of Selangor and two geographical enclaves (the federal territories of Kuala Lumpur and Putrajaya), carved from the state. These enclaves are the two seats of the federal government. Kuala Lumpur houses the national parliament and Putrajaya the executive and judicial branches.

    Population Growth in the Kuala Lumpur Region

    The Kuala Lumpur region had a population of approximately 7.1 million, according to the 2010 census. This includes 1.6 million in the federal territory (core city) of Kuala Lumpur and 5.5 million in the suburbs (which include Putrajaya). The region has experienced strong growth since modern Malaysia evolved between 1957 and 1963. In 1950, the region had only 900,000 residents. By 1980, the population had more than doubled to nearly 2.4 million and by 2010, the population had tripled from its 1980 level.

    Unlike many urban cores, the city of Kuala Lumpur continues to experience strong population growth. Since 1980 (the first census after the creation of the new territory), the city has experienced a population increase of 77 percent.

    Yet, the suburbs and exurbs (Note 1) have grown far more rapidly. The suburbs and exurbs have grown 280 percent and have added nearly six times the population increase of the city (Figure 1).  This general distribution of growth continued over the past decade, with the suburbs attracting 83 percent of the new population, while the city of Kuala Lumpur received 17 percent of the growth (Figure 2).


    The region continues to grow faster than the nation and at the current growth rate, the Kuala Lumpur region could approach a population of 10 million by 2025.

    The Urban Area

    The Kuala Lumpur urban area (area of continuous urban development) has an estimated population of 6.6 million (2013). Kuala Lumpur ranks as the 49th largest urban area in the world (Note 2). The urban area covers an estimated 750 square miles (1,940 square kilometers), ranking it 42nd largest in the world. The population density is 8,800 per square mile (3,400 per square kilometer). Among the 70 world urban areas with more than 5,000,000 population, Kuala Lumpur ranks 56th in population density, with approximately the same density as Western European urban areas in the same size classification (Figure 3).

    The highest population densities are in the city of Kuala Lumpur, at 17,300 per square mile (6,700 per square kilometer), approximately the density of the city of San Francisco. The suburban areas have a population density of 6,800 per square mile (2,600 per square kilometer), approximately five percent higher than the suburbs of Los Angeles (Figure 4).

    The Economy

    Kuala Lumpur is a prosperous region by developing world standards. Only high-income Singapore is more prosperous in Southeast Asia. According to the most recent Brookings Global Metro Monitor, Kuala Lumpur has gross domestic product per capita of $23,900 annually (based on purchasing power). This is higher than all metropolitan economies in Latin America other than Brasilia, Monterrey and Buenos Aires. If Kuala Lumpur were in China, it would rank in the top quarter of the richest per capita metropolitan economies (Note 3).

    The Setting

    The urban area stretches from the core of Kuala Lumpur more than 20 miles (32 kilometers) westward to Port Klang on the Strait of Malacca, with similar expanses to the north and south. The urban area stretches less than 10 miles into the Titiwangsa Mountains, which forms the central cordillera of the Malay Peninsula.

    Physical Description

    The Kuala Lumpur urban area is located in a densely forested tropical region. The urban areas somewhat low density has permitted retention of substantial greenery. As a result, Kuala Lumpur appears to be among the "greenest" urban environments in East Asia, and for that matter, in the world. The greenery is especially evident in residential areas, where most housing is either detached or row house (Photos).


    Detached housing

    Row Houses

    However, the greenery also extends to the central business district (Photo: Kuala Lumpur’s Green Central Business District), where the largest buildings are much less densely packed than in most large world cities. Kuala Lumpur’s central business district is home to the Petronas Towers (Photograph above), twin towers that became the tallest buildings in the world upon completion in 1998, displacing Chicago’s Sear’s Tower (now Willis Tower). The title was lost to Taipei’s Tower 101 in 2004.


    Photo: Kuala Lumpur’s Green Central Business District

    Kuala Lumpur is not monocentric. The central business district accounts for only 12 percent of regional employment, a figure that is projected to decline (Figure 5). The central business district share is slightly more than the United States average (10 percent) and less than the Western European average (18 percent).

    Transport

    The Kuala Lumpur region principally relies on personal mobility (cars and motorcycles) for its transportation. As late as 1985, 35 percent of travel in the Kuala Lumpur was by mass transit. By 2010, this had fallen to between 10 and 12 percent. This is after opening three metro lines, a monorail and three commuter rail lines, with the metro and monorail lines having opened since 1995. Kuala Lumpur’s mass transit market share is more reflective of a high-income nation region than a middle income nation, comparable to Sydney, Toronto or New York and one-third below that of Western Europe. However, Kuala Lumpur is much more transit dependent than most US metropolitan areas, at five to 10 times that of Los Angeles, Portland, Seattle, Dallas-Fort Worth and Phoenix.

    The Kuala Lumpur region is served by an extensive network of expressways. One segment includes the "SMART" tunnel, which is a 6 mile (10 kilometer) long tunnel that serves both vehicles and storm water. While the tunnel has levels dedicated to both vehicles and storm water, the entire tunnel can be converted to storm water usage when there is serious flooding.

    Prospects

    Kuala Lumpur seems well positioned for the future. As the urban area has expanded in population and land area, its populace has achieved a level of affluence toward which much of the world strives.

    Wendell Cox is a Visiting Professor, Conservatoire National des Arts et Metiers, Paris and the author of “War on the Dream: How Anti-Sprawl Policy Threatens the Quality of Life.”

    ——————

    Note 1: See "Definition of Terms used in The Evolving Urban Form"

    Note 2: The comprehensive Demographia World Urban Areas is published at least annually, with the next (9th) annual edition due in the Spring of 2013.

    Note 3: The ranking for Chinese metropolitan areas is adjusted, using the population figures from the 2010 census (which included the urban migrant population). The issue is described in Endnote 19 in the Brookings Global Metro Monitor.

    ——————-

    Photograph: Petronas Towers (all photos by author)

  • New Geography’s Most Popular Pieces of 2012

    Here’s a list of the most popular pieces from 2012 here at NewGeography, our fourth full calendar year. Thanks for reading and happy 2013.

    10. The Cities Where a Paycheck Stretches the Furthest In this piece from July, Joel Kotkin looks at average pay in U.S. metropolitan areas adjusted for regional cost of living based on my analysis of data from EMSI and C2ER. Since it ran, the table at the end of the piece has been updated with 2012 data. This piece also ran in Forbes.

    9. The Export Business of California (People and Jobs) Wendell Cox quantifies the outmigration from California and outlines a few reasons why residents might be leavings.

    8. America’s Future is Taking Shape in the Suburbs The evidence suggests that it’s not time to write off the suburbs just yet, according to this July Joel Kotkin piece. This piece also appeared at Forbes.

    7. The New Geography of Success in the U.S. and the Trap of the “New Normal” Joel Kotkin suggests that all of the public discussion about a “new normal” of U.S. mediocrity may not be the case due to a few of America’s inherent competitive advantages. “The stories of the successful states tell us the key to success lies  in promoting basic industries like energy, agriculture and manufacturing — which then create business service and high-skilled jobs — combined with a broad agenda favorable to entrepreneurs of all kinds.” This piece also appeared in Forbes.

    6. Sex (or Not) and the Japanese Single Edward Morgan explores the issue of sex and fertility and how it may affect the future of Japan.

    5. The Unseen Class War that Could Decide the Presidential Election In August Joel Kotkin pointed out that the issue of class is one of the most important facing American policymakers. He points out that the “clerisy” of both parties has ignored upward mobility and the needs of the “yeomanry.” This piece also appeared in Forbes.

    4. After the November election, Joel Kotkin argued that the nation may be in for a future similar to the current state of California in the piece, “For a Preview of Obama’s America in 2016, Look at the Crack-up of California.” This piece also appeared in Forbes.

    3. World Urban Areas Population and Density Wendell Cox’s summary of population data on the world’s urban areas has become a popular resource for readers looking for population data in search engines.

    2. Is California the New Detroit? In August Robert Cristiano called out California political leaders about the state of the state: “The beaches are still beautiful. The mountains are still snow capped and the climate is still the envy of the world. Detroit never had that. But will California’s physical attributes be enough?”

    1. Best Cities for Jobs 2012 Articles Our Best Cities Rankings measure short-, medium-, and long-term employment growth in the nation’s metropolitan areas and metropolitan divisions. We keep the measure simple on purpose: to offer an indicator of which regions are changing the fastest.

    Mark Schill is a community strategist and analyst with Praxis Strategy Group and New Geography’s Managing Editor.

  • Demography as Destiny: The Vital American Family

    Recent reports of America’s sagging birthrate ‑ the lowest since the 1920s, by some measures ‑ have sparked a much-needed debate about the future of the American family. Unfortunately, this discussion, like so much else in our society, is devolving into yet another political squabble between conservatives and progressives.

    Conservatives, including the Weekly Standard’s Jonathan Last, regularly cite declining birth and marriage rates as one result of expanding government ‑ and a threat to the right’s political survival. Progressives, meanwhile, have labeled attempts to commend a committed couple with children as inherently prejudicial and needlessly judgmental.

    Yet family size is far more than just another political wedge issue. It is an existential one – essentially determining whether a society wants to replace itself or fall into oblivion, as my colleagues and I recently demonstrated in a report done in conjunction with Singapore’s Civil Service College. No nation has thrived when its birthrate falls below replacement level and stays there – the very level the United States are at now. Examples from history extend from the late Roman Empire to Venice and the Netherlands in the last millennium.

    Falling birthrates and declining family formation clearly effect national economies. One major United States’  advantage has long been high birthrates, akin to a developing nation’s, as well as a vibrant family-oriented culture. This was largely because of immigrants and their children, striving first- and second-generation Americans. The United States, according to the U.S. Census Bureau, is expected to have a roughly 40 percent growth in its workforce in the first half of this century, largely thanks to immigration.

    In contrast, the Census Bureau predicts that leading U.S. competitors, notably Japan, Europe and South Korea, will likely suffer a decline of 25 percent or more over that time. Even China, whose birthrate has dropped precipitously under its one-child policy and rapid urbanization, is expected to see a sharp drop in its labor force over the next decade.

    Perhaps the greatest threat from collapsing fertility is the aging of society. Consider “the dependency ratio,” which measures the number of people in the workforce compared to retirees, in effect, how many working people are needed to support those over age 65. In 1960, before the decline in birthrates, that ratio was 9 percent in the 23 most developed countries. Today, it is 16 percent across these advanced countries. By 2030 it could reach as high as 25 percent.

    Countries with the longest history of declines in fertility face the biggest fiscal crises. By 2050, for example, Germany and Singapore  are predicted to have roughly 57 people above age 65 for every 100 workers. In the United States, this ratio will rise by 50 percent, to roughly 35 per 100 workers, even if the current decline is eventually reversed.

    If birthrates continue to decline, Western nations may devolve into impoverished and enervated nursing homes. And without strong families, children are likely to be more troubled and less productive as adults.

    You don’t need a crystal ball to see what this future could look like. Consider Japan. By 2050, there are expected to be three people above age 65 for every person in Japan under 15. In fact, more people are expected to be over 80 than under 15.

    This demographic shift signals a kind of death sentence for that once thriving, but now declining, nation. Not only are Japanese couples having far fewer children, sociologist Mike Toyota notes, roughly one-third of Japanese women in their 30s are not getting married ‑ which, in that conservative society, essentially means they are unlikely to have children. Even teenagers, according to a recent government-commissioned study by the Family Planning Association, seem oddly indifferent to dating and sex.

    Given the stakes, Americans must forgo political squabbles and focus on practical ways to remove barriers to marriage and child-rearing. One crucial component for strong birthrates is steady economic growth. Before the 2008 economic collapse, the U.S. fertility rate  was 2.12, the highest in 40 years. But the tumultuous economic problems since then have helped drive the fertility rate to 1.9 per woman, the lowest since the economic malaise era under President Jimmy Carter in the late 1970s.

    Even amid increasing awareness of the country’s demographic problems, however, political extremes focus on their own ideological spin. Conservatives set their arguments in neo-traditionalist terms, embracing right-wing tropes against gay marriage and abortion while blaming expansive government and rampant individualism. Others on the extreme right link declining fertility rates, particularly among Caucasians, to what Pat Buchanan calls “the end of white America.”

    Yet conservatives must recognize that fertility is not just a white or high-income Asian issue. Fertility and even marriage rates are, for example, declining throughout much of the Muslim Middle East, in some cases below our own levels, as my colleague Ali Modarres has shown.

    Nor is “white America” likely to be demographically overwhelmed by the current dramatic influx of Latino immigrants, particularly Mexicans, as many on the far right insist. Within a generation, Mexican-Americans immigrants’ fertility rates decline to that of native-born U.S. citizens. In fact, as Mexico modernizes, its fertility rates are falling to U.S. levels.

    Conservatives also seem to have a hard time admitting that one major culprit ‑ particularly in the United States and East Asian countries such as Singapore ‑ is modern capitalism. Young workers building their careers can face consuming demands for long work hours and substantial amounts of travel. Many confront a choice between a career and family.

    “In Singapore,” Austrian demographer Wolfgang Lutz observes, “women work an average of 53 hours a week. Of course they are not going to have children. They don’t have time.”

    For hard-pressed low-wage workers, raising children can be even harder. Indeed, much of the decline in child-rearing in the U.S. can be traced to a fall-off among immigrants, particularly Latinos, who fared particularly poorly in the long recession.

    On the other side, many Democrats praise the rise of “singlism” ‑ demonstrated by  the women in their 40s who never had offspring. This cohort has more than doubled since 1976. Pollsters like Stan Greenberg hail single women as “the largest progressive voting bloc in the country,” and Ruy Texeira, a leading political scientist, asserts that singletons are critical to the “emerging Democratic majority.”

    Progressives also embrace urban density ‑ a residential pattern that discourages child-rearing. Unlike the wave of immigrants or rural migrants who flooded the American metropolises of the early 20th century, urbanites today are not raising large families in cramped spaces. Instead, in virtually all high-income societies, high density today almost always translates into low marriage rates and fertility rates.

    The causes of this radical change are diverse. But crucial reasons include decline of extended family support networks; erosion of traditional, often religiously based values; and a culture that celebrates individualism.

    We no longer see family-centered urban neighborhoods like those depicted in the Chicago of Saul Bellow’s novel The Adventures of Augie March. Instead, many urban centers today are among the most “child free” ‑ whether in Manhattan, San Francisco, inner London or Paris, Singapore, Hong Kong or Tokyo.

    In contrast, America’s nurseries are in the suburbs, exurbs and lower-density greater-metropolitan areas. The metropolitan regions of Atlanta, Dallas-Fort Worth, Houston and Salt Lake City have above-average numbers of children. The percentage of children, according to the census, under age 15 in these cities is almost twice that of Manhattan or San Francisco.

    Many progressives don’t seem to care much if the birthrate falls. Some green activists seem to actually prefer it –  perhaps viewing offspring, particularly in wealthy countries, as unwanted carbon emitters. They seem to have taken up the century-old Malthusian concerns about overpopulation and environmental ruin. “A whole lot of people don’t have kids BECAUSE they’re worried about the future,” explains one critic of our report, suggesting that concern for the environment may justify the decision not to have children.

    Before signing on to a low-fertility agenda, American progressives as well as conservatives might want to consider the long-term consequences. The long fertility-rate declines in Europe and Japan occurred as economic growth flagged. Diminishing expectations of the future, painfully evident in countries such as Spain, Italy and Greece, are now further depressing marriage and childbirth.

    As to the culture wars between religious social conservatives and progressives, let’s declare a truce. Spiritual values and traditional families are precious resources to be nurtured. Mormons, evangelicals, practicing Catholics and highly self-identified Jews, all of whom largely favor big families, help make up for the almost certain continued expansion of single, and often childless, people.

    Social conservatives also need to champion more than the narrowly defined “natural family.” Many children, whether because of divorce or diverse family circumstances, must look to someone other than their birth parents for nurturing. Adoptive parents, grandmothers, uncles or aunts or other sorts of extended-family units also need to be cherished as committed caregivers.

    Popular TV shows like Modern Family show the wide range of family types today. The crucial element is that family obligation often extends well beyond “likes” and ties exist over generations. This can be true for gay couples or “blended families” in a way that can rarely be said of people who are dating, or friends, both of the real and Facebook variety.

    Fortunately, the long-term prognosis is not all bad. Pew Research Center reports that the emerging millennial generation rank being good parents, owning a home and having a good marriage as their top three priorities. Generational chroniclers Morley Winograd and Mike Hais, in their book Millennial Momentum: How a New Generation is Remaking America, suggest that the younger generation is as family-oriented as their elders, albeit with a greater emphasis on shared responsibilities and more flexible gender roles.

    “No matter how many communes people invent,” the anthropologist Margaret Mead once remarked, “the family always creeps back.” Let’s hope she’s right, not only about the past but the future as well.

    Joel Kotkin is executive editor of NewGeography.com and is a distinguished presidential fellow in urban futures at Chapman University, and contributing editor to the City Journal in New York. He is author of The City: A Global History. His newest book is The Next Hundred Million: America in 2050, released in February, 2010.

    This piece originally appeared at Reuters.

    Baby photo by Bigstock.

  • The Evolving Urban Form: Bangkok

    Since 2000, the Bangkok region has experienced annual population growth 2.5 times the rate of growth from 1980 to 2000. By 2010, the Bangkok region – which includes the provincial level city of Bangkok and the provinces of Samat Prakan, Samut Sakhon, Pathum Thani, Nonthaburi and Nakhon Pathom –  was nearing a population of 15 million (Note 1).

    As is characteristic of urbanization in both developing and developed countries, much of Bangkok’s recent growth has occurred outside the city, in suburban (and exurban) areas. Between 2000 and 2010, the city grew by 30%, while the suburban provinces grew more than twice as quickly, at 66%. The city’s population growth was 1.9 million, while the suburban provinces added 2.5 million population (Figure 1).

    Much of the urban expansion has been on the periphery both within the city of Bangkok and in the provinces of Samut Prakon to the east, Samut Sakhon to the west and Pathum Thani to the north. Unlike most cities in Asia, where new development has taken high-rise form, much of this new development has been townhouses and detached housing. (Photo: Detached housing).


    Photo: Detached Housing in the Bangkok city eastern sector

    The Urban Area

    The urban area, or area of continuous urban (and suburban) development will reach 14.5 million residents in 2013, according to United Nations projections. The urban area (Figure 2) covers approximately 900 square miles (2,330 square kilometers) and has a population density of the urban area is 16,200 per square mile (6,200 per square kilometer). This is 1.5 times the density of the Paris urban areas and more than 2.5 times that of the Los Angeles. However, Dhaka (Bangladesh), the most dense urban area, is at least eight times as dense.

    Bangkok’s high density and inadequate road system combine to make Bangkok’s traffic among the worst in the world. The Bangkok region is well served by freeways but government authorities have failed to provide the necessary arterial road (secondary road) infrastructure, as noted by Shlomo Angel, Stephen C. Sheppard, and Daniel L. Civco in a World Bank report (Note 2). As a consequence, they said that:

    The cost of reducing congestion in Bangkok is now higher—by one or two orders of magnitude—from what it would have been had adequate rights-of-way been secured earlier.  

    Bangkok is not the first urban area to have made this mistake. Atlanta’s traffic congestion is substantially worsened by its failure to provide a proper arterial roadway system.

    Bangkok’s best chance of reducing its traffic congestion lies in the expansion of its underdeveloped arterial roadway system. Nonetheless, the scattered development has preserved opportunities to develop arterial roads cost effectively in some suburban areas. The siting of more commercial and employment growth in these areas would also help.

    Some officials have suggested that expanded rapid transit would reduce traffic congestion. Bangkok has been expanding its small rapid transit system (as can be appropriate in very high density centers). There is little potential, however, for transit to reduce traffic congestion, as the intense traffic congestion and long commutes in cities well served with transit indicates (See photo at top and Note 3)

    Suburban and Exurban Bangkok

    Suburban expansion has been made possible by the increasing affluence of the Bangkok area, inexpensive land and house construction prices and the rising share of households with personal motorized vehicles (automobiles and motorcycles). Suburban dwellers are in the process of obtaining their own "Thai Dream" of home ownership, the popularity of which is demonstrated by the continuing draw of households to these rapidly developing areas.

    Angel, et al noted that the Bangkok area had become “model of a well–functioning land and housing
    market," and that:

    Affordable and minimally–serviced land was brought into the market by the efficient creation of a minimal number of narrow tertiary roads that connected building plots to the existing road system; mortgages became widely available; and private developers went down–market in large numbers, selling land–and–house packages that were affordable for more than half the urban households.

    Data from the Real Estate Information Centre of Thailand indicates that average new house prices remain similar in relation to average household income as a decade ago. By maintaining a competitive land market for new housing, Bangkok has retained housing affordability. 

    However there are difficulties. Some suburban areas, particularly in Pathum Thani, were hard hit by the 2011 floods. There has been controversy on this issue, as governments, national and local have come under criticism for their failures to control the flooding. At a minimum, the failure of the Bangkok region governments to coordinate their efforts contributed to the seriousness of this disaster. Nonetheless, new house construction continues in the suburbs and exurbs.

    The City ("Bangkok Metropolis")

    The core city of Bangkok is a provincial level jurisdiction, referred to popularly as the "Bangkok Metropolis" (Note 4). Bangkok is not a compact city, however, covering 605 square miles (1.570 square kilometers). This is 15 times the land area of the ville de Paris and larger than either Houston or Los Angeles, two of the most geographically expansive municipalities in the United States.  

    Beyond central Bangkok, the north, east and west sectors of the core city have experienced strong growth in detached and attached (row house or townhouse) construction.

    Bangkok’s commercial core is dispersed, like many other Asian cities, in China and elsewhere.  Manila is every bit as polycentric as Los Angeles or Atlanta. Bangkok, however, may be the ultimate core dispersion. There are at least five areas of high-rise commercial concentration, and large office buildings are sprinkled throughout the large central area (Photo: Dispersed core development). The UITP Millennium Cities Database indicated that only 11 percent of employment was in the central business district in the middle 1990s. With the ongoing dispersion, this figure may be lower now.


    Photo: Dispersed core development

    An Economic Success

    Bangkok residents live well compared to many living in other East Asian cities. Not only is their housing more affordable, but they have achieved much higher incomes. According to the most recent Brookings Global Metro Monitor, Bangkok has gross domestic product per capita of $23,400 annually (based on purchasing power). This is more than all but four of Latin America’s metropolitan economies (Brasilia, Monterrey, Buenos Aires and Sao Paulo), according to the Brookings the data. If Bangkok were in China, its per capita GDP would rank in the top quarter  of metropolitan economies (Note 5).

    Challenges Facing the Bangkok Region

    Bangkok seems likely to continue to grow rapidly, simply because it is virtually the only "urban draw" in Thailand. None of the world’s megacities (over 10 million population) is larger relative to other urban areas in the nation. Bangkok has more than 20 times the population of the next largest urban area in Thailand (Chon Buri). Strong population growth always presents formidable challenges for governments. The Bangkok region’s principal tasks will be to retain housing affordability by ensuring a competitive land market, and by providing a road system that reduces its exceedingly long travel times.  

    —–

    Note 1: There has been confusion about the Bangkok region’s total population. As late as 2009, the city of Bangkok projected the 2010 regional population, excluding Nakhon Pathom’s fewer than 1 million population at 10.3 million. The population as counted in the 2010 census was 3.3 higher.

    Note 2: Developers (and thus home buyers) pay for building the tertiary road systems that serve the new housing developments, similar to the practice in nations like the United States, Canada, Australia and New Zealand.

    Note 3: This is illustrated by Tokyo and Hong Kong, which each have one-way work trip travel times of 46 minutes — the longest reported in high-income world metropolitan areas. Tokyo has the world’s largest transit system and Hong Kong has the highest average urban density in the high-income world. By contrast, Los Angeles, where transit carries a small share of travel, and which has much lower densities than Tokyo or Hong Kong, has a one-way average work trip travel time of 27 minutes.

    Note 4: The city of Bangkok is a provincial level jurisdiction, formally called the Bangkok Metropolitan Administration. This use of the term "metropolitan" can be confusing, since much of the metropolitan area is outside the city (in between two and four other provinces, depending on the definition. This is similar to Tokyo and the former situation in Toronto. The prefecture of Tokyo is referred to as the "Tokyo Metropolis," which comprises barely one-third of the population of the Tokyo metropolitan area. Before the formation of the present city of Toronto, the regional authority was called the "Municipality of Metropolitan Toronto," however contained barely one half of the metropolitan area population. These semantic issues have been the source of considerable misunderstanding, not only by casual observers, but also by some academics.

    Note 5: The ranking for Chinese metropolitan areas is adjusted in China, using the population figures from the 2010 census (which included the urban migrant population). The issue is described in Endnote 19 in the Brookings Global Metro Monitor.

    Wendell Cox is a Visiting Professor, Conservatoire National des Arts et Metiers, Paris and the author of “War on the Dream: How Anti-Sprawl Policy Threatens the Quality of Life.”

    ——

    Photo: Rapid transit and traffic congestion in Bangkok (all photographs by author)