Category: Demographics

  • Demographic Dead End? Barack Obama’s Single Nation

    President Obama brought up Planned Parenthood three separate times at Tuesday’s town hall debate. It was an appeal aimed directly at a key part of his base: If he is reelected, it will be because of the Single Nation. 

    Democrats have woken up to the huge political rifts that have emerged over the past 30 years—between married and single people, and people with kids and those who don’t have them. And save African Americans, there may be no constituency more loyal to the president and his party than the growing ranks of childless and single Americans. 

    In the short term at least, the president and his party are seizing a huge opportunity. Since 1960, the percentage of the population that is over age 15 and unmarried increased by nearly half, 45 percent from 32 percent. Since 1976, the percentage of American women who did not have children by the time they reached their 40s doubled, to nearly 20 percent. 

    And even as the president has slipped in the polls, the fast-growing Single Nation has stayed behind him. Unmarried women prefer Obama by nearly 20 points (56 to 39 percent), according to Gallup, while those who are married prefer Romney by a similarly large margin. 

    Unmarried women (along with ethnic minorities, the poor and the workers in the public bureaucracy) are rapidly becoming a core constituency of the Democratic party, in a sense replacing the ethnic white working class.

    And while single women have long been ignored (or at least not courted directly) by national politicians, Democrats are now taking direct aim—as in the Life of Julia campaign, where every milestone in her life is marked by the government benefit she’d receive under President Obama’s hubby state. Democratic strategists such as Stanley Greenberg also urge targeting singles, particularly “single women,” whom he calls “the largest progressive voting bloc in the country.”

    Even among the married, children have become less of a priority. A 2007 Pew Research Center survey found that the number of adults who said that children are very important for a successful marriage had dropped by a third, from 65 percent in 1990 to 41 percent in 2010. Over that same span, financial considerations, and the willingness of a spouse to share chores and even political beliefs all became important to a greater share of adults.

    The rise in both childlessness and singlehood parallels developments already evident in other cultures, notably in East Asia and Europe. Many of these countries have experienced declining marriage and birth rates for decades. In Germany and Japan, the demographic results of this—fewer workers to support more retired people—has led to difficult tax hikes to allow the remaining young workers to maintain the funding for a growing number of aging boomers. This is the Europe’s screwed generation: “the victims of expansive welfare states and the massive structural debt charged by their parents.”

    In America, by contrast, birth rates rose somewhat over the past two decades. But since the recession, the number of new children has plummeted, and it’s dropped the most precipitously for new mothers. The number of households with children today is 38 million, about the same as a decade ago, even as the total number of households has shot up by nearly 10 million.

    There are now more houses with dogs than houses with children. 

    Singles don’t always show up at the polls, but Democratic party strategists see their numbers as simply too large to ignore, especially in close elections. Singletons almost elected John Kerry: red states had fertility rates 12 percent higher than those than blue ones.

    In 2008, singles helped put Obama over the top, something widely recognized by party leaders. This summer’s surge in Obama’s ratings also derived largely from his growing appeal to single voters, and particularly women.

    This reliance on single and childless voters could transform the Democratic party in the years ahead. Singlism, a term coined by psychologist Bella De Paulo, embraces the idea that far from undeserved subjects of derision or pity, the unattached represent a bridge to a more evolved humanity. De Paulo sees them as more cyber than the married set, and “more likely to be linked to members of their social networks by bonds of affection” rather than blood. Unlike families, who, after all, are often stuck with each other, singles enjoy the linkage to “intentional communities” and are thus more likely “to think about human connectedness in a way that is far-reaching and less predictable.”

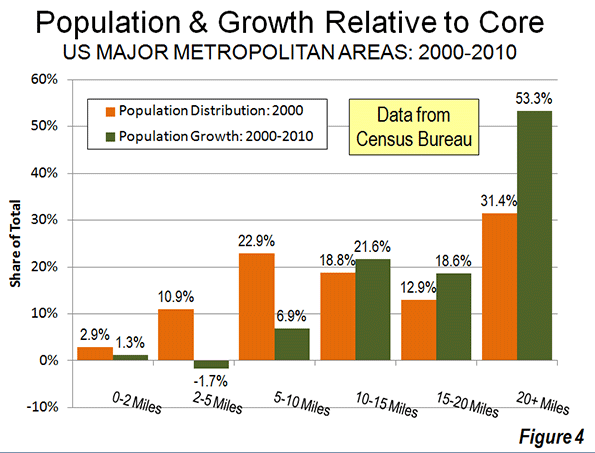
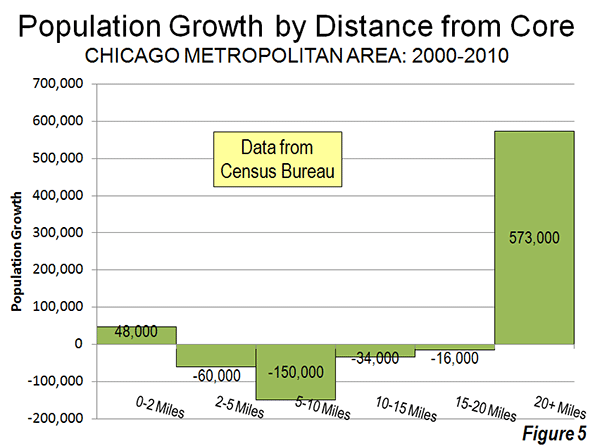
    A singleton approach to public policy, notes Eric Klinenberg, author of the widely celebrated Going Solo, notes, favors a high density, urban “new social environment.” This is particularly true in the central cores of social-media hubs such as Manhattan, San Francisco and, most of all, Washington D.C. In many dense urban areas now, 70 percent or more of households are childless. In contrast, the largest growth in families with children are found in places such as Dallas-Ft. Worth, Houston, Raleigh, and the Salt Lake area, which have relatively little impact on the national culture.

    The new post-familial politics departs in many ways from the old urban politics. In the past, urban voters focused largely on issues concerning neighbourhood, public safety, schools, ethnic enclaves and churches. The new childless class, notes the University of Chicago’s Terry Nichols Clark, identify less with these mundane issues and more with cultural preference and aesthetics.

    Clark also suggests the new singles-dominated electorate will have transcended the barriers of race and even country, embracing what he hopefully calls “a post materialist” perspective that transforms the baser considerations of those embroiled in raising children and maintaining kinship ties. No longer familial, as people have been for millennia, he predicts they could be harbingers not only of a “new race, but even a new politics.”

    The emerging “new politics” of the rising Single Nation could impact elections for decades to come, particularly in Democratic strongholds like Chicago, New York or San Francisco. These areas will be increasingly dominated by a vast, often well-educated and affluent class of voters whose interests are largely defined around their own world-view, without overmuch concern with the fate of offspring, along with the urban poor and the public workers who tend to both groups. Since the childless frequently lack the kinship networks that are obliged to provide for them in moments of trouble, they tend to look more to government to care for them in hard times or old age.

    But the Single Nation’s grip on power may not be sustainable for more than a generation. After all they, by definition, will have no heirs. This, notes author Eric Kauffman, hands the long-term advantage to generally more conservative family-oriented households, who often have two or more offspring. Birth rates among such conservative populations such as Mormons and evangelical Christians tend to be twice as high than those of the nonreligious. 

    As a result, Kauffman predicts that inevitably “the religious will inherit the earth” and ensure that conservative, more familial-oriented values inevitably prevail. Even among generally liberal groups like Jews, the orthodox and affiliated are vastly out-birthing their secular counterparts; by some estimates roughly two in five New York Jews is orthodox, including three quarters of the city’s Jewish children. If these trends continue, politics even in the progressive nirvana of Gotham may be pulled somewhat to the right.

    But in the here and now, and especially this November, these long-term trends will not yet be evident. The tsunami of Chasidic and Mormon children are not yet eligible to vote, and won’t be for a decade or two. So even as the president loses among the married, the growing ranks of the Single Nation could still assure his reelection, and propel his party’s ascendency for a decade or more before the whole trend crashes against a demographic wall.

    Joel Kotkin is executive editor of NewGeography.com and is a distinguished presidential fellow in urban futures at Chapman University, and contributing editor to the City Journal in New York. He is author of The City: A Global History. His newest book is The Next Hundred Million: America in 2050, released in February, 2010.

    This piece originally appeared in The Daily Beast.

    Barack Obama Photo by Bigstock.

  • A Planet of People: Angel’s Planet of Cities

    Professor Shlomo Angel’s new book, Planet of Cities, seems likely to command a place on the authoritative bookshelf of urbanization between Tertius Chandler’s Four Thousand Years of Urban Growthand Sir Peter Hall’s Cities and Civilization and The Containment of Urban England. Chandler produced the definitive volume of gross population figures for urban areas (cities) over millennia. Angel, takes the subject much further, describing detail how urban areas have grown over the last two centuries, both in population and continuous urban land area. The book focuses principally on population growth,  urban spatial expanse, and density. Moreover, Professor Angel develops both a statistical and analytic framework that complements the voluminous work of Peter Hall. Planet of Cities is liberally illustrated, which greatly aids understanding the trends.

    Urban Population, Land Area & Density Evolution from 1800

    Planet of Cities looks at the urbanization trend from various dimensions. A sample of 30 urban areas was used to gauge urban expansion and density changes from 1800 to 2000.

    At the same time, he describes the well documented urban density declines in the United States as well as the similar trends in Western European urban areas  often been missed by analysts who imagine that spatial expansion is limited to America.

    He goes further, showing that the rapidly growing urban areas of the developing world are also declining in urban density, with spatial expansion rates far exceeding those of population growth. This has been evident in New Geography’s  Evolving Urban Areas series (such as Mumbai, Jakarta, Manila, Ho Chi Minh City and others).

    Angel uses examples, such as Cairo and Accra, Ghana to illustrate both longer term and recent expansions of urban land area and the consequent drastic declines in urban density. In Cairo, the urban land area increased 16 times from 1938 to 2000, well in excess of the approximately 10 times population increase. In Accra, a 50 percent population increase from 1985 to 2000 was dwarfed by a 150 percent increase in urban land area.

    The analysis also includes a larger number (3600) with populations greater than 100,000. He estimates that all of the world’s urbanization covers no more than 0.5 percent of the world’s land. Angel suggests that the world the urban footprint could double or triple in the next few decades. However, he concludes that, even with this expansion, there are "adequate reserves of cultivatable land sufficient to feed the planet in perpetuity."

    Taking note of the slow growth or even population declines in the more developed world, he reminds readers that that nearly all of future population growth will occur in the urban areas of the less developed world. Angel strongly contends that this urban expansion is necessary. This, of course, places him "swimming upstream" against the prevailing doctrines of urban planning. The title of his first chapter "Coming to Terms with Urban Expansion" gives fair warning of his challenge to current planning doctrines. Throughout the volume, Angel expresses the view that declining urban densities are "inevitable," based upon his historic analysis, review of current trends and perceptions of the future.


    A Mumbai slum

    The Prime Concern: Housing

    Angel’s "primary policy concern" as "that in the absence of ample and accessible land for expansion on the urban periphery, artificial shortages of residential land will quickly extinguish any hope that housing will remain affordable, especially for the urban poor…"

    Angel expresses concern that the urban containment policies that so dominate American and Western European planning could be damaging to less developed nations, cancelling out much of the economic rewards of rapid urbanization. He expresses surprise that the attempt to impose Western planning models on the developing world raises so little objection (see China Should Send the Western Planners Home).

    Consistent with his "primary policy concern," Angel offers a "decent housing proposition," countering the present one-dimensional focus on environmental issues. In contrast, Angel suggests a more rounded approach to urban planning. He surmises \ the very purpose of cities:  to improve the economic lot of those who are attracted there. People are not generally attracted to cities because of the quality of their planning or the uniqueness of their architecture. In short, as he puts it, "few move to the city for its fountains." Unless they perform their economic task, cities stagnate or die, as so often happened before the modern age. The near exclusive draw of cities is household economics. Beyond the unprecedented value of the quantitative data and analysis provided, Planet of Cities is rooted in the reality of that   measure.

    At the same time, Angel is himself is unabashedly a planner. He is an adjunct professor of urban planning at the Robert F. Wagner School of Public Service at New York University, a lecturer at the Woodrow Wilson School at Princeton University and a senior research scholar at the urbanization project at the Stern School of Business at New York University.

    Restoring a Genuine Focus to Planning

    Angel expresses a strong interest in the most fundamental of planning issues: the provision of infrastructure that allows the urban area to better serve its residents and those it attracts. He is thus simultaneously for both more and less planning. He would curb the excesses of intervention in land markets that are now rife because they compromise the ability of cities to perform their primary function of improving affluence. He would expand the focus of planning to facilitate the organic urban expansion associated with growing cities.  This means that sufficient available land must be available for development without materially increasing land and house prices. It also requires making provision for the basic infrastructure such as an arterial grid of dirt roads on the expanding fringes of developing world cities.

    Abandoning Destructive Planning Doctrines

    Angel calls for abandonment of artificial limits on urban expansion and population growth (such as urban growth boundaries and housing moratoria) and instead seeks economic development and improvements in the quality of life.

    Professor Angel does not mince words about the consequences of relying of urban containment policy ("smart growth," "growth management," "compact cities,") as a strategy for reducing greenhouse gas emissions. The consequence would be that the "protection of our planet would likely come at the expense of the poor." He adds that strict measures to protect the natural environment by blocking urban expansion   could "choke the supplies of affordable lands on the fringes of cities and limit the abilities of ordinary people the house themselves."  He decries the notion that "cities should simply be contained and enclosed by greenbelts or impenetrable urban growth boundaries as "uninformed and utopian" because it makes sustainability "an absolute end that justifies all means to attain it." This policy approach sacrifices such imperatives as the quality of life and full employment.  

    A Planet of People

    Angel’s treatment is consistent with the urban scaling research of West et al at the Santa Fe Institute, which found that as cities increased in population they become more productive (As we indicated in a previous article, the Santa Fe Institute research did not deal with urban densities, despite misconceptions of some analysts).

    Angel’s concern about the impact on low income households is consistent with the focus of the international sustainability movement, which , declared at the recent Rio +20 conference:

    Eradicating poverty is the greatest global challenge facing the world today and an
    indispensable requirement for sustainable development. In this regard we are committed to
    free humanity from poverty and hunger as a matter of urgency.

    Angel’s Planet of Cities is about urban areas that serve their residents instead of theoretical, often utopian notions.

    Wendell Cox is a Visiting Professor, Conservatoire National des Arts et Metiers, Paris and the author of “War on the Dream: How Anti-Sprawl Policy Threatens the Quality of Life.”

    —–

    Publication information:
    Shlomo Angel, Planet of Cities (2012) Lincoln Institute of Land Policy

    Photo: Cover: Planet of Cities.  http://www.lincolninst.edu/pubs/images/2094_Planet_of_Cities_Cover_web.jpg

  • Even After the Housing Bust, Americans Still Love the Suburbs

    For decades, Americans have chosen to live in suburbs rather than in cities. Suburban growth has outpaced urban growth, and many big cities have even lost population. But in recent years, some experts have said it’s time for cities to make a comeback. Why? Urban crime rates have fallen; many baby boomers want to live near restaurants, shops, and all the other good things that cities offer; and the housing bust has caused more people to rent instead of buy – sometimes by choice and sometimes out of necessity. Moreover, cities offer shorter commutes, a big draw given today’s higher gas prices and growing concerns about the environment.

    So is there evidence that cities are really making a comeback? Earlier this year, a widely-reported Brookings analysis using 2011 Census estimates suggested that they were, reversing the long-term trend of faster suburban growth. However, it later became clear that those 2011 Census estimates should not be used for areas smaller than counties, which includes most cities and suburbs (see “the fine print” at the end of this post).

    Knowing that we couldn’t use these Census data, we decided to tackle this question another way. Using U.S. Postal Service data on occupied addresses receiving mail, we calculated household growth in every ZIP code from September 2011 to September 2012. (A previous Trulia Trends post explains in more detail how these data are collected.) Consistent with earlier studies of city versus suburb growth, we compared the growth in a metro area’s biggest city with the growth in the rest of the metropolitan area, across America’s 50 largest metros.

    By this measure, there was essentially no difference between city and suburban growth. When we looked at all 50 metros together, household growth was 0.536% in the metros’ biggest cities and 0.546% in the rest of the metro area over the past year – which means that suburbs grew ever so slightly faster than big cities. The biggest city grew faster than the suburbs in 24 of those metros, including New York, Los Angeles, Chicago, Miami and Philadelphia; the suburbs grew faster than the biggest city in the other 26 metros, including Dallas, Houston, Atlanta, Detroit and Phoenix.

    But comparing the biggest city with the rest of the metro area misses some of the action. In most metros, there are neighborhoods outside the biggest city that are more urban than some neighborhoods in the biggest city (as measured by density). For example, Hoboken NJ, just across the river from New York City, is denser and feels more urban than much of Staten Island, which is part of New York City. Central Square in Cambridge, next to Boston, feels more urban than West Roxbury and Hyde Park, two quiet neighborhoods within the City of Boston. In southern California, Santa Monica and Pasadena – which are outside the Los Angeles city boundary – feel more urban than Sylmar, Chatsworth and other outlying neighborhoods in the San Fernando Valley that are technically part of the City of Los Angeles.

    Therefore, we took a new approach. We compared growth in neighborhoods based on whether they actually are more urban or suburban based on their density, regardless of whether those neighborhoods happen to be inside or outside the boundary of a metro area’s biggest city. Within each metro area, we ranked every neighborhood – as defined by ZIP codes — by household density. Neighborhoods with higher density than the metro area average are “more urban”; neighborhoods with lower density than the metro area average are “more suburban.” (See “the fine print” at end of this post.)

    By defining “urban” and “suburban” in this way, suburban growth is clearly outpacing urban growth. Growth in the “more suburban” neighborhoods was 0.73% in the past year, more than twice as high as in the “more urban” neighborhoods, where growth was just 0.35%. In fact, urban neighborhoods grew faster than suburban neighborhoods in only 5 of the 50 largest metros: Memphis, New York, Chicago, San Jose and Pittsburgh – and often by a really small margin. In the other 45 large metros, the suburbs grew faster than the more urban neighborhoods.

    Top 5 Metros Where Urban Growth Outpaced Suburban Growth
    U.S. Metro

    Urban Growth

    Suburban Growth

    Difference: Urban minus Suburban

    Memphis, TN

    0.92%

    0.42%

    0.50%

    New York, NY

    0.58%

    0.27%

    0.31%

    Chicago, IL

    0.31%

    0.26%

    0.06%

    San Jose, CA

    0.73%

    0.71%

    0.02%

    Pittsburgh, PA

    0.44%

    0.43%

    0.01%

    Note: among largest 50 metros.

    Top 5 Metros Where Suburban Growth Most Outpaced Urban Growth
    U.S. Metro

    Urban Growth

    Suburban Growth

    Difference: Urban minus Suburban

    San Antonio, TX

    0.40%

    2.46%

    -2.07%

    Oklahoma City, OK

    0.38%

    1.87%

    -1.49%

    Houston, TX

    0.44%

    1.91%

    -1.48%

    Austin, TX

    0.88%

    2.13%

    -1.25%

    Detroit, MI

    -0.94%

    0.20%

    -1.14%

    Note: among largest 50 metros.

    Looking more closely: what happened to growth in not just in the “more urban” neighborhoods, but in the MOST urban? Within each metro, we split neighborhoods into ten categories, based on their density. The highest-density category covers just the “most urban” parts of big cities (much of Manhattan, for instance, but none of Brooklyn) including a few neighborhoods that are technically outside the metro’s biggest city (parts of Cambridge MA, Arlington VA and Scottsdale AZ, for instance). On the other end of the spectrum, the lowest-density neighborhoods are the “most suburban” (in fact, in some metros, the lowest-density neighborhoods feel downright rural). Now the pattern gets interesting:

    Trulia City vs. Suburban Growth Bar Chart

    In general, the “more suburban” neighborhoods grew faster than the “more urban” neighborhoods. But the “most urban” neighborhoods actually had solid growth, as the leftmost bar in the graph shows. Household growth was 0.54% in these “most urban” neighborhoods,” which matched the overall growth rate for the metro areas examined. Furthermore, among only the largest 10 metros, household growth was 0.65% in the “most urban” neighborhoods, compared with 0.48% growth in these metros overall.

    That’s the punchline: America’s suburban areas are continuing to grow faster than America’s urban areas. Despite falling homeownership, rising gas prices, downsizing baby boomers and improvements to city living, American suburbanization hasn’t reversed. Even though the highest-density neighborhoods, particularly in the largest metros, have grown in the past year, the suburbanization of America marches on.

    We’ve provided the full data set of urban and suburban growth in the 50 largest U.S. metro areas below.

    The fine print:

    • This Brookings analysis showed cities growing faster than their suburbs between 2010 and 2011, based on 2011 Census estimates. Posts at newgeography.com here and here criticized the 2011 Census estimates and questioned research based on those estimates, including the Brookings analysis. The problem with the 2011 Census estimates is that the 2010-2011 growth rates for subcounty areas – which includes most cities and suburbs — were assumed to be the same as the growth rate for the whole county (with the exception of population in “group quarters”).
    • We used the largest 50 metro areas. In this report, the “San Francisco” metro area includes Oakland; “Dallas” includes Fort Worth; “Washington DC” includes the Bethesda metro division; “New York” includes Long Island; and so on. (Most Trulia Trends posts use the smaller “metropolitan division” where they exist for consistency with other housing data reports.)
    • The U.S. Postal Service reports delivery statistics by ZIP codes. We calculated density using 2010 Census data for ZCTA’s, a Census approximation of ZIP codes. 

    Jed Kolko is Trulia’s Chief Economist, leading the company’s housing research and providing insight on market trends and public policy to major media outlets including TIME magazine, CNN, and numerous others. Read more of his work at Trulia Trends blog.

    This piece originally appeared at the Trulia blog.

    Suburban neighborhood photo by Bigstock.

  • The Rise of Post-Familialism: Humanity’s Future?

    This piece is the introduction to a new report on post-familialism from Civil Service College in Singapore, Chapman University, and Fieldstead and Company and authored by Joel Kotkin.

    For most of human history, the family — defined by parents, children and extended kin — has stood as the central unit of society. In Europe, Asia, Africa and, later, the Americas and Oceania, people lived, and frequently worked, as family units.

    Today, in the high-income world1 and even in some developing countries, we are witnessing a shift to a new social model. Increasingly, family no longer serves as the central organizing feature of society. An unprecedented number of individuals — approaching upwards of 30% in some Asian countries — are choosing to eschew child bearing altogether and, often, marriage as well.

    The post-familial phenomena has been most evident in the high income world, notably in Europe, North America and, most particularly, wealthier parts of East Asia. Yet it has bloomed as well in many key emerging countries, including Brazil, Iran and a host of other Islamic countries.

    The reasons for this shift are complex, and vary significantly in different countries and cultures. In some countries, particularly in East Asia, the nature of modern competitive capitalism often forces individuals to choose between career advancement and family formation. As a result, these economies are unwittingly setting into motion forces destructive to their future workforce, consumer base and long-term prosperity.

    The widespread movement away from traditional values — Hindu, Muslim, Judeo-Christian, Buddhist or Confucian — has also undermined familialism. Traditional values have almost without exception been rooted in kinship relations. The new emerging social ethos endorses more secular values that prioritise individual personal socioeconomic success as well as the personal quest for greater fulfilment.

    To be sure, many of the changes driving post-familialism also reflect positive aspects of human progress. The change in the role of women beyond sharply defined maternal roles represents one of the great accomplishments of modern times. Yet this trend also generates new pressures that have led some women to reject both child-bearing and marriage. Men are also adopting new attitudes that increasingly preclude marriage or fatherhood.

    The great trek of people to cities represents one of the great triumphs of human progress, as fewer people are necessary to produce the basic necessities of food, fibre and energy. Yet the growth of urban density also tends to depress both fertility and marriage rates. The world’s emerging postfamilial culture has been largely spawned in the crowded pool of the large urban centres of North America, Europe and, most particularly, East Asia. It is also increasingly evident in the fast growing cities of developing countries in south Asia, North Africa, Iran and parts of the Middle East.

    The current weak global economy, now in its fifth year, also threatens to further slow family formation. Child-rearing requires a strong hope that life will be better for the next generation. The rising cost of urban living, the declining number of well-paying jobs, and the onset of the global financial crisis has engendered growing pessimism in most countries, particularly in Europe and Japan, but also in the United States and some developing countries.

    This report will look into both the roots and the future implications of the post-familial trend. As Austrian demographer Wolfgang Lutz has pointed out, the shift to an increasingly childless society creates “self-reinforcing mechanisms” that make childlessness, singleness, or one-child families increasingly predominant.2

    Societal norms, which once almost mandated family formation, have begun to morph. The new norms are reinforced by cultural influences that tend to be concentrated in the very areas — dense urban centres — with the lowest percentages of married people and children. A majority of residences in Manhattan are for singles, while Washington D.C. has one of the highest percentages of women who do not live with children, some 70%. Similar trends can be seen in London, Paris, Tokyo and other cultural capitals.3

    A society that is increasingly single and childless is likely to be more concerned with serving current needs than addressing the future oriented requirements of children. Since older people vote more than younger ones, and children have no say at all, political power could shift towards nonchildbearing people, at least in the short and medium term. We could tilt more into a ‘now’ society, geared towards consuming or recreating today, as opposed to nurturing and sacrificing for tomorrow.

    The most obvious impact from post-familialism lies with demographic decline. It is already having a profound impact on fiscal stability in, for example, Japan and across southern Europe. With fewer workers contributing to cover pension costs,4 even successful places like Singapore will face this same crisis in the coming decade.5

    A diminished labour force — and consumer base — also suggest slow economic growth and limit opportunities for business expansion. For one thing, younger people tend to drive technological change, and their absence from the workforce will slow innovation. And for many people, the basic motivation for hard work is underpinned by the need to support and nurture a family. Without a family to support, the very basis for the work ethos will have changed, perhaps irrevocably.

    The team that composed this report — made up of people of various faiths, cultures, and outlooks — has concerns about the sustainability of a post-familial future. But we do not believe we can “turn back the clock” to the 1950s, as some social conservatives wish, or to some other imagined, idealised, time. Globalisation, urbanisation, the ascendancy of women, and changes in traditional sexual relations are with us, probably for the long run.

    Seeking to secure a place for families requires us to move beyond nostalgia for a bygone era and focus on what is possible. Yet, in the end, we do not consider familialism to be doomed. Even in the midst of decreased fertility, we also see surprising, contradictory and hopeful trends. In Europe, Asia and America, most younger people still express the desire to have families, and often with more than one child. Amidst all the social change discussed above, there remains a basic desire for family that needs to be nurtured and supported by the wider society.

    Our purpose here is not to judge people about their personal decision to forego marriage and children. Instead we seek to launch a discussion about how to carve out or maintain a place for families in the modern metropolis. In the process we must ask — with full comprehension of today’s prevailing trends — tough questions about our basic values and the nature of the cities we are now creating.

    Anuradha Shroff, Ali Modarres, Wendell Cox, and Zina Klapper contributed to this report.

    Joel Kotkin is executive editor of NewGeography.com and is a distinguished presidential fellow in urban futures at Chapman University, and contributing editor to the City Journal in New York. He is author of The City: A Global History. His newest book is The Next Hundred Million: America in 2050, released in February, 2010.

    This report was organized by Civil Service College in Singapore with research support from Chapman University and Fieldstead and Company.

  • How California Lost its Mojo

    The preferred story for California’s economy runs like this:

    In the beginning there was prosperity.  It started with gold.  Then, agriculture thrived in California’s climate.  Movies and entertainment came along in the early 20th Century.  In the 1930s there was migration from the Dust Bowl.  California became an industrial powerhouse in World War II.  Defense, aerospace, the world’s best higher education system, theme parks, entertainment, and tech combined to drive California’s post-war expansion.

    Then, in the evening of November 9th, 1989, the Berlin Wall came down.  On December 25, 1991, the Soviet Union was dissolved.  The Cold War was over.  America responded by cutting defense spending and called the savings the Peace Dividend.

    California paid that peace dividend.  A huge portion of California’s military industrial complex was destroyed.  The aerospace industry was downsized, never to come back.  Hundreds of thousands of well-paying manufacturing and engineering jobs were lost.

    The ever-resilient California bounced back though.  Tech, driven by an entrepreneurial culture and fed by California’s great universities drove California’s economy to new heights.

    Then, there was the dot.com bust.  A mild national recession was much more painful for a California dependent on its tech sector.  Eventually California recovered.  California’s tech sector and climate, aided by a housing boom, restored California’s prosperity.

    The housing boom was followed by a housing bust.  Again, California paid a high price, and unemployment skyrocketed to 30 percent above the national average.

    Today, California is recovering.  Its tech sector is once again bringing prosperity to the state.  Furthermore, California’s green legislation is providing the motivation for a brave new future of economic growth and environmental virtue.

    The story is true through the Peace Dividend.  California did pay a high price for the collapse of the Soviet Union.  California’s defense sector did begin a decline, and it never recovered.  But, defense recovered in other places, as the country expanded defense spending by 21 percent in the 2000s.  The United States has constantly been engaged in wars and conflicts for over a decade.  On a real-per-person basis, the United States is spending as much on defense as it has at any time since 1960. 

    But when it comes to the present, the narrative falls down.  Defense has rebounded, but not in California.  California’s defense sector is small and declining, not because of a permanently smaller U.S. defense sector, but because of something about California.

    California’s tech sector did boom after the collapse of California’s defense sector, but that doesn’t mean that California recovered.  In fact, much of California never recovered.  It’s the aggregation problem. 

    The 1990s’ recovery was largely a Bay Area recovery.  Los Angeles hardly saw any uptick in employment.  Here is a chart comparing Los Angeles County’s jobs growth rate with the San Jose Metropolitan Statistical Area (MSA): 

    San Jose probably had California’s fastest growing job market in the 1990s.  Los Angeles was not the states slowest.  Still, the differences are striking.

    A few years ago, a couple of my graduate students looked at California data from 1990 through 1999.  They divided California into two regions, the Bay Area and everywhere else.  The Bay Area was defined as Sonoma, Marin, Napa, Solano, Contra Costa, Alameda, Santa Clara, Santa Cruz, San Mateo, and San Francisco counties.  Using seven indicators of economic growth, they performed relatively simple statistical tests to see if the two geographies experienced similar economies.  The indicators were employment, wages, home prices, bank deposits, population growth, construction permits, and household income.

    By every measure except population growth, the Bay Area outperformed the rest of the state.  The exception was probably due to commuters to the Bay Area, given that region’s exceptionally high housing prices. 

    Some economists will tell you that California saw faster-than-national job growth from the mid 1990s until the great recession.  This is another aggregation problem.  The claim is technically true, but only in the sense that California had a higher proportion of the nation’s jobs in 2007 than it did in 1995.  If you look at annual data, you will see that California’s share of the nation’s jobs only grew from 1995 through 2002.  Since then, California’s share of United States jobs resumed its decline:

    In reality, California never recovered from the dot.com bust.  California, perhaps the best place on the planet to live, couldn’t keep up in a housing boom.  Something was wrong.

    California had lost its mojo. 

    Opportunity is now greater outside California than inside California.  For almost 150 years, California was as widely known for its opportunity as it was for its sunshine.  The combination was like a drug.  George Stoneman, an army officer destined to become California’s 15th governor, spoke for millions when he said "I will embrace the first opportunity to get to California and it is altogether probable that when once there I shall never again leave it." 

    They did come to California, and they made an amazing place.  Opportunity-driven migrants are different than other people.  They take big risks to leave everything they know for an uncertain future in a new place.  They are confident, bold, and brash.   California became just as confident, bold, and brash.  The Anglo-American novelist Taylor Caldwell spoke the truth when she said "If they can’t do it in California, it can’t be done anywhere."

    That was then.  Today, California can’t even rebuild an old Hotel.

    The Miramar Hotel is a partially-demolished eyesore beside the 101 Freeway in Montecito, just south of Santa Barbara.  The Hotel’s initial structure was built in 1889.  Over the years, it was expanded to a 29 structure luxury hotel and resort.  In September 2000 it was closed for renovations which were expected to take 18 months.  That was when the fighting started.  Community groups, neighbors, and governments all had their own idea of what the Miramar should be.  Two owners later, and after millions of dollars, the future to the Miramar is still uncertain.

    The Miramar Hotel is a case study of what is wrong with post-industrial California, precisely because it should have been easy, and because it is not unique.  Everything is hard to do in California.  The state that once moved rivers of water hundreds of miles across deserts and over or through mountain ranges can’t rebuild a hotel.

    The situation will get worse.  California has become the place people are leaving.  The following chart shows that for 20 years more people have left California for other states than came to California from other states:

    California’s population is still increasing because of births and international immigration. 

    Two decades of negative domestic migration has taken its toll.  Millions of risk-taking, confident, bold, and brash people have left California.  They took California’s mojo with them.

    That seems pretty clear when you look at some statistics:  California’s unemployment is way above the national average.  With only about 12 percent of the nation’s population, California has over 30 percent of the nation’s welfare recipients.  San Bernardino has the nation’s second highest poverty rate among cities over 200,000.

    Sometimes though, aggregated data can hide California’s weakness, and some, representing the always-present constituency for the status quo, use these data to deny that California’s future is any less golden. 

    Most recently, those representing the constituency for the status quo have used California’s aggregated jobs data to argue that all is well in California.  They argue that California’s tech sector is leading California to a new golden future.

    Year-over-year data confirm that, through August 2012, California gained jobs at a faster pace than the United States.  Once again, though, that growth is largely confined to one industry and one geography.  California’s tech sector is recovering, and amidst a generally weak recovery, it appears strong enough to generate pretty impressive aggregated results.  If we disaggregate California’s data, we will find that there is not just one California.  There is a rich and mostly coastal California, with a few smaller inland counties on the San Francisco-Lake Tahoe corridor.  Another California is very poor and mostly inland.

    Here’s a list of California’s poorest counties by poverty rate:

    County

    Poverty Rate

    Child Poverty Rate

    Rank

    Del Norte

    23.5

    30.6

    3

    Fresno

    26.8

    38.2

    1

    Imperial

    22.3

    31.8

    6

    Kern

    21.4

    30.3

    10

    Kings

    22.5

    29.7

    5

    Madera

    21.7

    31.7

    8

    Merced

    23.1

    31.4

    4

    Modoc

    21.9

    32.5

    7

    Siskiyou

    21.5

    30.7

    9

    Tulare

    33.6

    33.6

    2

    Here’s a list of California richest counties by poverty rate:

    County

    Poverty Rate

    Child Poverty Rate

    Rank

    Calaveras

    11.1

    18.3

    10

    Contra Costa

    9.3

    12.7

    4

    El Dorado

    9.4

    11.6

    5

    Marin

    9.2

    10.9

    3

    Mono

    10.8

    15

    8

    Napa

    10.7

    14.7

    7

    Placer

    9.1

    10.7

    2

    San Mateo

    7

    8.5

    1

    Santa Clara

    10.6

    13.3

    6

    Ventura

    11

    15.3

    9

    There are some big differences here.  The percentage of Fresno’s children living in poverty is four and half times the percentage of San Mateo children living in poverty.  In fact, the data for California’s poorest counties looks like third-world data.

    When disaggregated, the job-growth data shows the same story.  Through 2012’s second quarter, jobs in the San Jose MSA were up 3.6 percent on a year-over-year basis.  In Los Angeles, jobs were up only 1.1 percent, while in Sacramento they were up only 0.6 percent.  For comparison, U.S. jobs were up about 1.3 percent for the same time period.

    You can perform this analysis for all types of data.  When the data are disaggregated, the story is always the same.  It’s telling us that California needs to get its mojo back, and the current tech boom is likely not to be enough for its recovery.

    Bill Watkins is a professor at California Lutheran University and runs the Center for Economic Research and Forecasting, which can be found at clucerf.org.

    Unemployment photo by BigStockPhoto.com.

  • The Evolving Urban Form: Barcelona

    Among those for whom Paris is not their favorite European city, Barcelona often fills the void. Barcelona is the capital of Spain’s Catalonia region. Catalonia has been in the news in recent weeks because of the rising a settlement for independence from Spain, or at a minimum, considerably expanded autonomy. In part, the discontent is driven by a concern about the extent to which more affluent Catalonia subsidizes the rest of Spain. Another driving factor is the interest in separating Catalonian language and culture from that of Spain.

    Barcelona is nestled on the Mediterranean coast with mountains and valleys immediately behind. It would be easy to visit Barcelona without being aware of the huge expanse of suburbanization that has developed especially over the last 50 years.

    The Core City

    Like virtually all European core cities that have not annexed or combined with other jurisdictions, Barcelona’s population had peaked well before the turn of the 21st century. In 1960, the city of Barcelona had a population of just below 1.6 million people. Today, after having risen to 1.75 million in 1981, Barcelona’s population has dropped to approximately 1.62 million. Nonetheless, like other European core cities, Barcelona experienced strong growth before 1970, rising to nearly 7 times its 1890 population of 250,000.

    At the same time, like some other European and North American core cities, the city of Barcelona has begun to grow again. Having reached a modern low point of 1.5 million in 2001, the city grew by approximately 7 percent by the 2011 census.

    The city itself covers a land area of approximately 55 square miles/143 square kilometers, slightly less than that of Washington, DC. Barcelona’s density is much higher, at approximately 40,700 per square mile/15,700 per square kilometer, as opposed to the approximately 10,000 per square mile/4,000 per square kilometer of Washington. Yet, other core areas are considerably more dense, such as the ville de Paris, which is at least 30 percent more dense and Manhattan, which is approximately 50 percent more dense.

    The Metropolitan Area and the Urban Area

    The metropolitan area is generally considered to be the province of Barcelona, which is a part of the region of Catalonia (Figure 1). Since 1950, the metropolitan area has expanded from 2.2 million to 5.6 million people. Since 1960, nearly all of the population growth has been outside the city of Barcelona. The city has added approximately 60,000 people, while the balance of Barcelona province has added approximately 2.7 million people (Figure 2).


    The province of Barcelona is divided into comarques, which are the equivalent of counties. The core comarca (the singular form) is also called Barcelona and includes the city as well as other municipalities (or local government authorities), the largest of which is Hospitalet de Llobregat, with a population of 250,000.

    Barcelona’s urban area (area of continuous urban development) continues along the Mediterranean coast to the southwest into the comarca of Baix Llobregat, which includes the international airport. To the northwest the urbanization continues along the coast for some distance into the comarca of Maresme.

    The urbanization then surrounds Tibidabo Mountain behind the city along freeway routes on either side. These roadways connect with the AP-7 autopista (toll motorway), which provides direct access between Madrid, Valencia, Andalusia and France. The large valley through which the AP-7 runs contains the largest suburbs of Barcelona, which are divided into two comarques, the Valles Oriental (East Valley) and the Valles Occidental (West Valley).

    The Barcelona urban area covers approximately 415 square miles/1,075 square kilometers (Figure 3) and has a population of 4.6 million. At approximately 11,000 persons per square mile/4200 per square kilometer, Barcelona is one of Western Europe’s most dense urban areas. It is approximately 15 percent more dense than Paris and among the larger urban areas trails only Madrid (11,800 per square mile/4,500 per square kilometer) and London (15,100 per square mile/5,800 per square kilometer).

    The Barcelona urban area’s high density is also illustrated by comparison to the Zürich urban area, with its reputation for high density. As defined by the Federal Statistical Office of Switzerland, Zürich covers virtually the same land area as Barcelona, yet has less than one quarter of its population.

    Between the 2001 and the 2011 censuses, there was seven percent growth in the inner suburbs surrounding the city of Barcelona within the comarca of Barcelona. Much greater growth, however, was experienced in the more peripheral parts of the urban area. The coastal suburbs of Baix Llobregat and Maresme grew approximately 17 percent and now have a population of more than 1,000,000.

    Growth was even stronger in the interior valley, with the Valles Occidental growing at 19 percent and the Valles Oriental, which and with much more vacant land for development, grew 22 percent (Figure 4). Now the population of the Valles approaches 1.2 million.

    However the largest growth was outside the urban area entirely, in the balance of the metropolitan area, where the population increased 27 percent (Figure 5), and now approaches 1,000,000.

    Newer Development

    Much of the most recent growth has been relatively unusual for large Spanish urban areas, which have largely experienced high density expansion, with multi-family buildings (often high rise), even in the suburbs (see top photo). However, considerable detached housing has been built in the Barcelona metropolitan area over the past decade.

    Barcelona’s Dispersion

    Thus, the Barcelona metropolitan area is generally following the trend of greater growth in the urban periphery and the strongest growth in the rural and smaller urban areas that are outside the continuous urbanization.

    Wendell Cox is a Visiting Professor, Conservatoire National des Arts et Metiers, Paris and the author of “War on the Dream: How Anti-Sprawl Policy Threatens the Quality of Life.”

    Photo: Residential area in Valles Occidentale (Barcelona suburbs), by author.

  • The Braking Of The BRICs

    For over a decade, conventional wisdom has held that the future of the world economy rests on the rise of the so-called BRIC countries: Brazil, Russia, India, China (and, in some cases, with the addition of an ‘S’ for South Africa). A concept coined by Goldman Sachs economist Jim O’Neill, the BRICs were widely touted as the building blocks of the “post-American world.”

    Such notions are particularly popular among intellectuals like India’s Brankaj Mishra, who sees world power shifting inexorably to “ascendant nations and peoples” — i.e. the BRICs — while “America’s retrenchment is inevitable.” Yet in reality, it is increasingly clear that the BRICs upward trajectory is slowing and many long-term trends suggest that their growth rates will continue to fall in the coming decades. Like other former “America-killers” such as Europe (1960s), Japan (1970s and 1980s) and the Asian Tigers (1990s), the BRIC countries appear to be unable to sustain the steady, inevitable progress projected by enthusiasts both at home and abroad.

    One sign can be seen in the equity markets. Between 2001 and 2007, BRIC stocks soared, more than doubling in China and rising 369% in Brazil and 499% in India. Faith in the destiny of the BRICs grew even more after the world financial crisis, which these economies seemed to shrug off.

    Yet more recently the edifice appears to have begun to erode, and in some cases, could well crumble. After rising almost fourfold from 2000 until the financial crisis, the BRICs’ stock-market value is at a three-year low.

    This decline has impacted numerous key BRIC companies such as Petroleo Brasileiro SA, Brazil’s state-controlled oil company. This year it fell to the world’s 39th-largest company by market value from the 10th-biggest in July 2011. China Construction Bank Corp. dropped to 20th from 12th while Rosneft, Russia’s largest oil producer, sank to 106th from 70th. Shares of ICICI Bank Ltd., India’s second-biggest lender, have lost 17% during the past year, compared with an average gain of 9% for global peers.

    Mutual funds that invest in BRIC equities, which recorded about $70 billion of inflows in the past decade, also have posted 16 straight weeks of withdrawals, losing a net $5.3 billion, EPFR Global data show.

    This reflects serious, deep-seated problems in these economies. Brazilian consumer defaults increased to a 30-month high in May, while prices for Russia’s oil exports have dropped about 10% this year. In India, the central bank unexpectedly left interest rates unchanged last month after inflation accelerated. A gauge of Chinese manufacturing compiled by the government fell to a seven-month low in June.

    The BRICS are learning — as the Japanese did before them — the meaning of gravity. With the dollar gaining value against the Brazilian real, Brazil could slip from the world’s sixth largest economy to seventh, overtaken again by the United Kingdom.

    BRIC countries are suffering, in part, because of the slowdown in the European Union and North America. Depressed levels of spending in these export markets devastates these economies, in part because their domestic markets are not yet wealthy enough to support strong growth on their own.

    Brazil has experienced a rampant property boom in recent years, with house prices in Rio trebling since 2008, and mortgage borrowing soaring. Reduced consumer demand could help drive the country’s economic growth rate to 2.2%, a pace more familiar in developed Western economies, and less than half the rate predicted by official government economists.

    India seems to be drifting into a political crisis and remains handicapped by its deep-seated culture of corruption and favoritism. Malnutrition has increased — and is higher than in most African countries — while the political system creaks and blocks reform.

    This is one reason why credit default swaps suggest India is already a bigger investment risk than emerging markets such as Vietnam and more than double the risk of Brazil, Russia, China and South Africa. India may also lose its investment-grade credit rating as Prime Minister Manmohan Singh’s administration struggles to curb a record trade deficit, a budget shortfall that exceeded targets and fighting within the ruling coalition, Standard & Poor’s and Fitch Ratings said last month.

    In the short run, things are likely to get worse in India; S&P recently cut its forecast for growth in 2012 to 5.5% from 6.5%. Inflation running at 10% is sending investors fleeing from the rupee in favor of the dollar’s safety. Growth in industrial production fell from 9.7% in 2010 to 4.8% in 2011. The pace has slowed further in 2012.

    BRIC member Russia, as Rodney Dangerfield would have put it, is no bargain either. The crippling problem Russia faces is an economy dependent on oil for 75% of its export income. In 2008 oil was 5% of Russia’s GDP; now it’s 12.5%.

    As in India, corruption is pervasive, sparking political unrest against Vladimir Putin’s neo-czarist regime. Investment and retail has slowed down. At the same time Russia faces one of the steepest demographic declines on the planet, spurred by unusually low lifespans among males, with excessive drinking a prime contributor. Russia has lost nearly 10 million people since the collapse of the former Soviet Union. By 2050, the population could fall to as low as 126 million from 142 million in 2010. President Vladimir Putin has identified the demographic crisis as Russia’s “most urgent problem.”

    Due to its one-child policy, China, too, faces the prospect of demographic decline. The U.S. Census Bureau estimates that China’s population will peak in 2026, and will then age faster than any country in the world besides Japan. Its rapid urbanization, expansion of education, and rising housing costs all will contribute to this process. Most of the world’s decline in children and young workers between 15 and 19 will take place in China during the balance of the century.

    But China’s most pressing problems are more immediate. With exports slowing, China’s GDP growth has decelerated from 10.9% in 2010 to 9.5% in 2011. It is estimated by S&P to be 7.5% in 2012. China’s economic growth is set to slow for the ninth consecutive quarter. Schisms within the Communist Party, and growing labor and other unrest, make the Middle Kingdom somewhat less the inevitable replacement power to the U.S. that many have assumed.

    South Africa is also pressed by political and economic problems.The economy is slowing down to a very un-BRIC like 2.7% growth rate. This is well below the heady 4% plus of 2011. And, as in China and India, instability, as seen in the recent, violent work stoppage of 26,000 workers at platinum mines, could further hurt growth.

    With unemployment roughly at 25%, South Africa will hard pressed to remain an investment star in the years ahead.

    So what now? Well, we can expect financial speculators, like Goldman Sachs, to keep trolling for the next thing. Wall Street’s most influential player recently coined a new term — MIST — to cover their new favorites: Mexico, Indonesia, South Korea and Turkey. One can only imagine how long this fixation will last, given the problems these countries face with either political violence and demographic decline, and in the case of Turkey both.

    Of course, brokers hawking investments will continue to look for new places of opportunity. But as we are learning from the experience with the BRICS, not all emerging economies maintain their upward trajectory. Sometimes it might make more sense ,even given our inept political parties, to look at opportunities closer to home, where constitutional protections, a large domestic market and a diversified economy may provide better long-run prospects.

    Joel Kotkin is executive editor of NewGeography.com and is a distinguished presidential fellow in urban futures at Chapman University, and contributing editor to the City Journal in New York. He is author of The City: A Global History. His newest book is The Next Hundred Million: America in 2050, released in February, 2010.

    This piece originally appeared in Forbes.

    BRIC country map by Filipe Menegaz.

  • Cooling Off: Why Creative California Could Look to Western New York

    Sometimes the stakes are bogus, sometimes the fast lane hits a fork.
    Sometimes southern California wants to be western New York
    –Lyrics from Dar Williams’ song “Sometimes California Wants to Be Western New York”.

    For long, making cultures and making people have been deemed outmoded. It is largely a knowledge economy. And since knowledge has been diverging into “spiky locales” known to be hotbeds of innovation, consider it a double whammy, as most of the relevant geographies are on the coast. The middle of the country is thus irrelevant if you care to survive. It is a man with a pitchfork in a sea of MacBook’s and iLife’s.

    For instance, in Edward Glaeser’s 2007 City Journal article he asks: “Can Buffalo Ever Come Back?” Glaeser answers quickly, “Probably not—and government should stop bribing people to stay there”.

    It’s true that many cities in the Rust Belt, Appalachia, Iron Range, Great Plains and the like have declined. Many people left. We all know why: jobs mostly, the weather a bit, or too damn depressing—the vacancy and all. We also know that the “flyover country’s” crème de la cream migrated to those gathering pools of talent like San Francisco, Boston, New York, Portland, and the Midwest’s own: Chicago. The reasons this was occurring was because (1) these places were “cool”, and (2) the cluster of talent created for innovation milieus because all the big brains colliding made big ideas, which made products not near the death of their life cycle like, for instance, iron or ovens.

    But suppose we are on the cusp of this divergence changing into a convergence of talent spreading back out into the heartland. In short, maybe these spiky locales are overheating, thus releasing “cool” elsewhere, not to mention the freedom to create. The following explains how and why this scenario could unfold.

    Allow me to digress for a moment to talk about the Second Law of Thermodynamics, and how it figuratively relates to the flow of capital. Consider it a working metaphor. Components of the Second Law state that whenever energy is out of equilibrium with its surroundings a natural potential exists to return a setting to equilibrium. For instance, if you bring a hot cup of coffee into a cold room, eventually the energetic tension between the cup and the room will dissipate as the heat leaves the coffee until there is thermodynamic equilibrium between the cup and the room. In many respects, I see the same energetic tension existing precariously between the spiky “have’s” of America and the Buffalo-like “have not’s”, with a subsequent resetting coming as talent and capital leak back into a convergent, equilibratory state.

    Now, what’s creating this tension, other than feeling sorry for Buffalo, Sioux City, etc.? Well, it’s part cultural, part social, and part economic. But all wholly real.

    First, the economic: as the GDP of spikiness goes up so does worker expense. For example, New York City’s cost of living is becoming unsustainable, even for knowledge laborers. From a recent Philadelphia Magazine article discussing a growing trend of New Yorkers moving (to) and commuting (from) Philly, the author notes:

    Those of us with young families, in the so-called creative class…were now high-status, poorly paid culture workers who could no longer afford to live in New York, especially with children. Things no longer seemed possible because they weren’t.

    This exodus is not a blip. For instance, the borough of Brooklyn has lost nearly a half-million people from 2001 to 2009. To that end, the “spikiness” in this case is the unsustainable nature of global city price points, with fewer and fewer folks able to hang on as expenses skyrocket toward the needle-head of the elite.

    What will this mean for the future of jobs? Blogger Jim Russell believes that demand for labor will follow the out-migrating labor supply, even for tech companies. The reasons for this are simple: an increasingly available talent pool in geographies lauded for hard work, and cost. From a Silicon Valley exec who headed to a beer and sausage city:

    “I was very skeptical five years ago that I would do a meaningful expansion in Milwaukee…But what I have found is the majority of talent we need in our company, we are able to acquire in that area.”

    Space is less expensive, it takes less time to find qualified employees in Milwaukee, and they stay with the company for longer than they would in California, [Edward] Jackson said.

    Tied closely to the economic pressures of spiky locales are the social costs. For example, Chicago, once a City of Broad Shoulders, had long ago ditched its industrial ethos and swagger to become the City of Slim Hips. In short, under Mayor Daley, Chicago went all in with global city development, which meant using public funds and incurring public debt to build a place to serve its growing global city clientele. The cost was high, though: crippling municipal debt, a situation no doubt aided by the fact that luring the elite did nothing for jobs, with the city having fewer total jobs in 2009 than it did in its blighted heyday of 1989. Said Richard Longworth:

    In other words, Chicago — the only old industrial city in the Midwest to transform itself into a global city, a big success story in the global rankings — still can’t provide as many jobs for its residents as the old sooty City of the Big Shoulders.

    And that social cost? It has to do with the effect of creating cities within cities, for as Chicago pumped money into its various beautification endeavors, disparity and poverty festered on its West and South sides. The consequence for the city—for anyone who has been paying attention—is one of the most violent summers in Chicago history, with 56 people shot in a recent three-day period alone. Naturally, violence does nothing to attract talent, with one study showing that for every homicide that occurs in a city, total population declines by 70 people. And while many cities do not rival Chicago’s spike in crime, disparity-driven tensions are deepening fast in spiky locales, thus fermenting the possibility of unrest and subsequent flight.

    But at least there are oodles of creativity in “hot and spiky” locales, right? Here, things get interesting.

    There exists a subtle yet growing tension in various creative-laden camps regarding the globalization of creativity which—when implemented as a product—is marketed as “cool”. It’s an old tension really, one between selling yourself and being yourself, and the predicament was spelled out nicely in a recent article by Justin Moyer entitled “Our Band Could Be Your Band–How the Brooklynization of culture killed regional music scenes”.

    In it, the author laments the dissolving regional sound of music in America that has arisen from a decades-long divergence of musical talent into Brooklyn. For Moyer, vanning to “regional music scenes” allowed for a distinct back and forth between one’s own sound and the sound of the other, with the ping pong in musical differentiation allowing for a betterment of one’s own sound as well as the sound of the other. You know, how creative escalation and interplay is supposed to work.

    But somewhere along the way this stopped. As was recently proved in a study detailed in Scientific Reports, everybody started to sound like everybody else. How does Brooklyn do this? What is Brooklyn exactly? Moyer explains, before venting:

    Brooklyn has a downside. Those who abandon their [regional music scene] to come to Brooklyn risk co-option by an aesthetic Borg. Things get mushy. There’s too much input, and there’s not a lot that’s not known…There aren’t many secrets. There are no mountains to go over.

    …There are many Brooklyns. Los Angeles is Brooklyn. Chicago is Brooklyn. Berlin and London are Brooklyn. Babylon was the Brooklyn of the ancient world. In the 1990s, Seattle was Brooklyn…

    Some Brooklyns aren’t even places. MySpace is Brooklyn. YouTube is Brooklyn. Facebook is Brooklyn. Spotify and iTunes are perversely, horribly, unapologetically, maddeningly Brooklyn.

    I’m against it.

    Moyer is on to something, and he has got good theory behind him; that is: diversity and differentiation drive creativity, be it in the political, social, cultural, or economic realm, whereas homogeneity cloaked in popularity does not. What’s more, creative destruction rarely occurs in places perceptibly intact—be it in Park Slope or posh Naples. It occurs where there is urgency, or where it is needed most. It occurs in places very broken, like Detroit. And so eventually the next wave of a new system can very likely be rippled out from places that have been saturating in the pieces. Said Atlantic writer Alexis Madrigal, who just finished touring the Rust Belt: “[T]here are a lot of places where the apocalypse has already happened”.

    Of course this is all very speculative at the moment. The winners are still seen as the winners and the losers still the losers. But the writing is on the wall: the future is in the seams, between the lights and monotone, loud-ass beats.

    Even Twitter creator Jack Dorsey thinks so. The Rust Belt native was in Detroit recently discussing how he gets his creative fix. Is it soaking in Silicon Valley with other visionaries? Not exactly. Rather, by taking the bus to work. Why? Dorsey states:

    “I actually see real things… That encourages me and gives me a stronger purpose, sense of purpose about what I want to change and how my work might apply to that change

    Hear that Buffalo? Don’t listen to your death sentence. You are becoming. Just like Dar Williams predicted.

    Richey Piiparinen is a writer and policy researcher based in Cleveland. He is co-editor of Rust Belt Chic: The Cleveland Anthology. This piece originally appeared at his blog.

    American Gothic statue in Chicago photo by flickr user GYLo.

  • Flocking Elsewhere: The Downtown Growth Story

    The United States Census Bureau has released a report (Patterns of Metropolitan and Micropolitan Population Change: 2000 to 2010.) on metropolitan area growth between 2000 and 2010. The Census Bureau’s the news release highlighted population growth in downtown areas, which it defines as within two miles of the city hall of the largest municipality in each metropolitan area. Predictably, media sources that interpret any improvement in core city fortunes as evidence of people returning to the cities (from which they never came), referred to people "flocking" back to the "city" (See here and here, for example).

    Downtown Population Trends: Make no mistake about it, the central cores of the nation’s largest cities are doing better than at any time in recent history. Much of the credit has to go to successful efforts to make crime infested urban cores suitable for habitation, which started with the strong law enforcement policies of former New York Mayor Rudy Giuliani.

    However, to characterize the trend since 2000 as reflective of any "flocking" to the cities is to exaggerate the trend of downtown improvement beyond recognition. Among the 51 major metropolitan areas (those with more than 1 million population), nearly 99 percent of all population growth between 2000 and 2010 was outside the downtown areas (Figure 1).

    There was population growth in 33 downtown areas out of the 51 major metropolitan areas. As is typical for core urban measures, nearly 80 percent of this population growth was concentrated in the six most vibrant downtown areas, New York, Chicago, Philadelphia, Washington, Boston and San Francisco.

    If the next six fastest-growing downtown areas are added to the list (Dallas-Fort Worth, Houston, Los Angeles, Portland, San Diego and Seattle), downtown growth exceeds the national total of 205,000 people, because the other 39 downtown areas had a net population loss. Overall, the average downtown area in the major metropolitan areas grew by 4000 people between 2000 and 2010. That may be a lot of people for a college lacrosse game, but not for a city. While in some cases these increases were substantial in percentage terms, the population base was generally small, which was the result of huge population losses in previous decades as well as the conversion of old disused office buildings, warehouses and factories into residential units.

    Trends in the Larger Urban Cores: The downtown population gains, however, were not sufficient to stem the continuing decline in urban core populations. Among the 51 major metropolitan areas, the aggregate data indicates a loss of population within six miles of city hall. In essence, the oasis of modest downtown growth was more than negated by losses surrounding the downtown areas. Virtually all the population growth in the major metropolitan areas lay outside the six mile radius core, as areas within the historical urban core, including downtown, lost 0.4 percent.

    Even when the radius is expanded to 10 miles, the overwhelming majority of growth remains outside. Approximately 94 percent of the aggregate population growth of the major metropolitan areas occurred more than 10 miles from downtown (Figure 2). Figure 3 shows that more than one-half of the growth occurred 20 miles and further from city hall. Further, the population growth beyond 10 miles (10-15 mile radius, 15-20 miles radius and 20 mile and greater radius) from the core exceeded the (2000) share of population, showing the continuing dispersal of American metropolitan areas (Figure 4).

    Chicago: The Champion? The Census Bureau press release highlights the fact that downtown Chicago experienced the largest gain in the nation. Downtown Chicago accounted for 13 percent of the metropolitan area’s growth with an impressive 48,000 new residents. However, while downtown Chicago was prospering, people were flocking away from the rest of the city. Within a five mile radius of the Loop, there was a net population loss of 12,000 and a net loss of more than 200,000 within 20 miles (Figure 5). Only within the 36th mile radius from city hall is there a net population gain.

    Cleveland: Comeback City and Always Will Be? In view of Cleveland’s demographic decline (down from 915,000 in 1950 to 397,000 in 2010), any progress in downtown Cleveland is welcome. But despite the frequently recurring reports, downtown Cleveland’s population growth was barely 3,000. Despite this gain, the loss within a 6 mile radius was 70,000 and 125,000 within a 12 mile radius. Beyond the 12- mile radius, there was a population increase of nearly 55,000, which insufficient to avoid a metropolitan area population loss.

    Other Metropolitan Areas: A total of 30 major metropolitan areas suffered core population losses, despite the fact that many had downtown population increases.

    • Five major metropolitan areas suffered overall population losses (Buffalo, Cleveland, Detroit, Pittsburgh and Katrina ravaged New Orleans).
    • St. Louis, with a core city that holds the modern international record for population loss (from 857,000 in 1950 to 319,000 in 2010), experienced a population decline within a 27 mile radius of city hall. Approximately 150 percent of the growth in the St. Louis metropolitan area was outside the 27 mile radius. Even so, there was an increase of nearly 6,000 in the population of downtown St. Louis.
    • There were population losses all the way out to a considerable distance from city halls in Memphis (16 mile radius), Cincinnati (15 mile radius) and Birmingham (14 mile radius). The three corresponding downtown areas also lost population.
    • Despite having one of the strongest downtown population increases (12,000), population declined within a 10 mile radius of the Dallas city hall. This contrasts with nearby Houston, which also experienced a strong downtown increase (10,000) but no losses at any radius of the urban core.
    • Milwaukee experienced a small downtown population increase (2,000), but had a population loss within an11 mile radius.

    The other 21 major metropolitan areas experienced population gains throughout. Even so, most of the growth (77 percent) was outside the 10 mile radius. San Jose had the most concentrated growth, with only 24 percent outside a 10 miles radius from city hall. All of the other metropolitan areas had 60 percent or more of their growth outside a 10 mile radius from city hall.

    As we have observed before, 2000 to 2010 was, unlike the 1970s and other decades, more friendly to the nation’s core cities, although less so than the previous decade. Due to the repurposing of old offices and other structures, sometimes aided by subsidies, small downtown slivers may have done better than at any time since before World War II. But the data is clear. Suburban growth was stronger in the 2000s than in the 1990s. The one percent flocked to downtown and the 99 percent flocked to outside downtown.

    Population Loss Radius: Major Metropolitan Areas
    Miles from City Hall of Historical Core Municipality*
    Major Metropolitan Areas (Over 1,000,000 Population Share of Metropolitan Growth Population Loss Radius (Miles)
    "Outside Downtown" (2- Mile Radius) Outside 5-Mile Radius Outside 10-Mile Radius
    MAJOR METROPOLITAN AREAS: TOTAL 98.7% 100.4% 93.5% 6
    Atlanta, GA 99.6% 101.1% 99.9% 9
    Austin, TX 98.1% 96.7% 81.9% 0
    Baltimore, MD 106.5% 118.7% 99.5% 9
    Birmingham, AL 104.2% 132.5% 124.9% 14
    Boston, MA-NH 90.8% 76.9% 67.3% 0
    Buffalo, NY Entire Metropolitan Area Loss
    Charlotte, NC-SC 99.1% 97.4% 75.0% 3
    Chicago, IL-IN-WI 86.7% 103.3% 144.6% 35
    Cincinnati, OH-KY-IN 105.1% 126.8% 135.2% 15
    Cleveland, OH Entire Metropolitan Area Loss
    Columbus, OH 100.5% 104.3% 86.9% 7
    Dallas-Fort Worth, TX 99.0% 101.0% 100.7% 10
    Denver, CO 98.0% 100.3% 89.8% 5
    Detroit,  MI Entire Metropolitan Area Loss
    Hartford, CT 99.2% 92.7% 67.2% 0
    Houston, TX 99.2% 99.5% 98.0% 0
    Indianapolis. IN 102.1% 112.1% 89.6% 8
    Jacksonville, FL 100.2% 106.3% 85.3% 8
    Kansas City, MO-KS 99.5% 109.0% 113.3% 12
    Las Vegas, NV 101.4% 98.0% 63.6% 4
    Los Angeles, CA 97.3% 102.2% 97.6% 8
    Louisville, KY-IN 102.5% 108.5% 90.9% 8
    Memphis, TN-MS-AR 101.2% 118.5% 143.5% 16
    Miami, FL 99.4% 93.0% 91.3% 0
    Milwaukee,WI 95.9% 109.0% 107.5% 11
    Minneapolis-St. Paul, MN-WI 97.4% 99.2% 100.1% 7
    Nashville, TN 100.0% 101.4% 92.4% 7
    New Orleans. LA Entire Metropolitan Area Loss
    New York, NY-NJ-PA 93.5% 81.7% 68.9% 0
    Oklahoma City, OK 100.1% 96.8% 83.5% 2
    Orlando, FL 99.7% 99.4% 84.2% 0
    Philadelphia, PA-NJ-DE-MD 92.6% 98.8% 96.3% 7
    Phoenix, AZ 100.7% 101.8% 93.6% 6
    Pittsburgh, PA Entire Metropolitan Area Loss
    Portland, OR-WA 95.0% 91.5% 62.7% 0
    Providence, RI-MA 96.2% 91.7% 70.1% 0
    Raleigh, NC 99.6% 93.0% 67.7% 0
    Richmond, VA 95.7% 91.7% 70.2% 0
    Riverside-San Bernardino, CA 99.5% 97.2% 85.8% 0
    Rochester, NY 146.9% 149.3% 82.5% 9
    Sacramento, CA 99.9% 94.4% 79.5% 0
    Salt Lake City, UT 98.9% 95.1% 84.1% 0
    San Antonio, TX 101.1% 102.5% 86.7% 7
    San Diego, CA 96.3% 94.1% 90.1% 0
    San Francisco-Oakland, CA 90.7% 87.6% 82.2% 0
    San Jose, CA 95.1% 79.1% 24.3% 0
    Seattle, WA 96.5% 91.9% 81.4% 0
    St. Louis,, MO-IL 94.8% 119.7% 148.9% 27
    Tampa-St. Petersburg, FL 98.6% 97.8% 83.7% 0
    Virginia Beach-Norfolk, VA-NC 93.1% 90.1% 82.3% 0
    Washington, DC-VA-MD-WV 97.5% 94.5% 87.9% 0
    Calculated from Census Bureau data
    *Except in Virginia Beach-Norfolk, Where Virginia Beach is used


    ——-

    Notes:

    Population Weighted Density: In its report, the Census Bureau uses "population-weighted density," rather than average population density to compare metropolitan areas. The Census Bureau justified this use as follows:

    "Overall densities of CBSAs can be heavily affected by the size of the geographic units for which they are calculated. Metropolitan and micropolitan statistical areas are delimited using counties as their basic building blocks, and counties vary greatly across the country in terms of their geographic size. With this in mind, one way of measuring actual residential density is to examine the ratio of population to land area at the scale of the census tract, which—of all the geographic units for which decennial census data are tabulated—is typi­cally the closest in scale to urban and subur­ban neighborhoods".

    The Census Bureau rightly points out the problem with comparing metropolitan area density. However, it is a problem of the federal government’s making, by virtue of using metropolitan area building blocks (counties) that are sometimes too large for designation of genuine metropolitan areas. These difficulties have been overcome by the national census authorities in Japan in Canada, for example, where smaller building blocks are used (such as municipalities or local government authorities).

    Further, the Census Bureau already has a means for measuring population density at the census tract level, which is "the closest in scale to urban and suburban neighborhoods." This is the urban area.

    "Population-weighted density" is an interesting concept that can provide an impression of the density that is perceived by the average resident of the metropolitan area. Unfortunately, in its report, the Census Bureau is less than precise with its terminology and repeatedly fails to modify the term density with the important "population-weighted" qualification. This could lead to considerable misunderstanding.

    The Census Bureau did not provide average population densities based for the mileage radii. Because of large bodies of water (such as Lake Michigan in Chicago can reduce land areas, it was not possible to estimate population densities by radius.

    Census Bureau Revision of Incorrect Report: We notified the Census Bureau of errors in its press release and report on September 27. The problems included substitution of San Francisco population data for Salt Lake City as well as metropolitan population in the supporting spreadsheet file. On September 28, the Census Bureau issued a revised press release and report to rectify the errors. Later the erroneous spreadsheet was withdrawn and had not been re-posted as of October 1. We have made corrections to the spreadsheet for this analysis.

    Note: Larger "Downtown" Populations in Smaller Metropolitan Areas: Because of the broad 2-mile radius measure used by the Census Bureau, most of the population increase characterized as relating to downtown occurred outside the major metropolitan areas. This is simply because in smaller metropolitan areas, such an area (12.6 square miles) will necessarily contain a larger share of the metropolitan area. Further, many smaller metropolitan areas are virtually all suburban and had experienced little or no core population losses over the decades that have been so devastating to many large core municipalities. On average, 2.7 percent of the population of major metropolitan areas was within a two-mile radius of city hall in 2010. By comparison, in smaller metropolitan areas, approximately 12.7 percent of the population was within a two mile radius.

    Photograph: Chicago Suburbs: (where nearly all the growth occurred), by author

  • Census Bureau Finds 3.2 Million More People in Salt Lake City?

    Today the US Bureau of the Census released a fascinating report on metropolitan area population growth by radius from the corresponding city halls. The report provides summary tables indicating the metropolitan areas that had the greatest and least growth, for example, near the downtown areas.  I was surprised to find that Salt Lake City had done so well, having seen is population rise from 336,000 to 355,000 within a two mile radius of city hall (Table 3-7). That struck me as odd. A two mile radius encompasses an area of only 12.6 square miles, for a density of about 28,000 per square mile. Only the city San Francisco has densities that high over such a large area in the West. Moreover, all of the municipality of Salt Lake City is within two miles of city hall, and the 2010 census counted only 186,000 people in the entire  city of more nearly 110 square miles.

    In reviewing the backup file, Worksheets “Pop2000″, Pop2010”, “Density2000” and “Density 2010”), I discovered that Salt Lake City’s data was actually that of San Francisco and that metropolitan Salt Lake City was credited with 3.2 more people than it had Another surprise was that the San Francisco metropolitan area was reported with 260,000 people, less than one-third the population reported for the core city of San Francisco in 2010. Santa Fe had a reported population 3.4 million people, about 1.4 million people more than live in the entire state of which it is the capital. Further, in at least 35 cases, the populations for metropolitan areas did not correspond to those reported in the 2010 census.

    Obviously this is the kind of automated (computer) error that can happen to anyone or any agency. Nonetheless, an immediate correction would be appropriate.

    With considerable effort, we were able to get through to the public information office at the Bureau of the Census to notify them of the error.

    Until a corrected report is issued, any analysis of the report will need to be very cautious indeed. We look forward to the revision.