Category: Demographics

  • The Hollow Boom Of Brooklyn: Behind Veneer Of Gentrification, Life Gets Worse For Many

    After a decade of increasingly celebrated gentrification, many believe Brooklyn — the native borough of both my parents — finally has risen from the shadows that were cast when it became part of New York City over a century ago.  Brooklyn has gotten “its groove back” as a “post-industrial hotspot,” the well-informed conservative writer Kay Hymowitz writes, a perception that is echoed regularly by elements of a Manhattan media that for decades would not have sullied their fingers writing about the place.

    And to be sure, few parts of urban America have enjoyed a greater public facelift — at least in prominent places — than New York’s County of Kings, home to some 2.5 million people. The borough is home to four of the nation’s 25 most rapidly gentrifying ZIP codes, notes a recent Fordham study. When you get a call from the 718 area code these days, it’s as likely to be from your editor’s or investment bankers’ cell as from your grandmother.

    Yet there’s a darker side to the story. This became clear to me not long ago when driving with my wife and youngest daughter to a friend’s house in the Ditmas Park section of Flatbush, one of the finest exemplars of urban renaissance in the country. We encountered a huge traffic jam on the Belt Parkway, so we exited on Linden Boulevard. For the next half hour we drove through an expanse of poverty, public housing and general destitution that hardly jibes with the “hip, cool” image Brooklyn now projects around the world.

    A look at the numbers shows this was not an isolated experience. Despite the influx of hipsters and high-income sophisto professionals, Brooklyn is home to one of New York State’s poorest populations, with over one in five residents under the official poverty line, roughly 50 percent above the state average. This likely understates the problem since the cost of living in the borough is now the second-highest in the nation to Manhattan, surpassing even high-tone San Francisco.

    Overall, despite some job gains, the borough’s unemployment rate stood at 11 percent this summer, up from 9.7 percent a year ago and well above the national average. Much of recent job growth has been in lower-wage industries, notes Martin Kohli, chief regional economist with the Bureau of Labor Statistics in New York City. Despite a much celebrated start-up scene, some 30,000 of the 50,000 jobs created since the recession have been in the generally low-wage health care and social assistance sector, with another 9,000 in the hospitality industry.

    Poverty citywide, meanwhile, has been rising for three years running and the real Brooklyn, roughly half non-white, remains surprisingly poor. Brooklyn’s median per capita income in 2009 was just under $23,000, almost $10,000 below the national average.

    So what’s going on here? Urban historian Fred Siegel, a longtime Brooklyn resident, sees a classic tale of two cities. “Brownstone and Victorian Brooklyn is booming,” he says, due in part to uncle Ben Bernanke‘s inflationary policies, which have bailed out the Wall Street banks whose profits are the bedrock of New York City’s prosperity. This money has now spread to those parts of “Manhattanized” Brooklyn closest to the core of the Big Apple, with bankers, lawyers and the like opting to settle in more human-scale neighborhoods.

    But lower middle-class Brooklyn “is pockmarked with empty stores,” Siegel notes. With its once robust industrial- and port-based economy shrunken to vestigial levels, opportunities for Brooklynites who lack high-end skills or nice inheritances are shrinking. Some other areas, like Bensonhurst and Sheepshead Bay, have been revived through immigration.

    Jonathan Bowles, president of the New York-based Center for an Urban Future, sees a divide between, on the one hand, “the creative class” and some immigrant neighborhoods, and on the other, “the concentrated poverty” in many other struggling areas like Brownsville (where my mother grew up) and East New York. “There are clearly huge swaths of Brooklyn where you don’t see gentrification and there won’t be anytime soon,” Bowles observes.

    Part of the problem is structural. Many of Brooklyn’s working-class commuters — particularly in the eastern end of the borough — depend on a transit system designed to funnel people into the giant office clusters of Manhattan. Those left looking for work in the borough, often in low-paid service jobs, face long commutes or have to get a car, a big expense in a city with ultra-high rents, taxes and insurance costs.

    Mayor Michael Bloomberg’s administration identifies itself closely with Manhattan’s “luxury city” economy. Focused on finance, media and high-end business services, this approach does not offer much to blue-collar Brooklyn. New York over the past decade has suffered among the worst erosions of its industrial base of any major metropolitan area. Brooklyn alone has lost 23,000 manufacturing jobs during that time.

    Inequality in the Bloombergian “luxury city” is growing even faster than in the nation as whole. In fact, the gap between rich and poor is now the worst in a decade. New York’s wealthiest one percent earn a third of the entire city’s personal income — almost twice the proportion for the rest of the country.

    So while artisanal cheese shops serve the hipsters and high-end shops thrive, one in four Brooklynites receives food stamps.

    We see similar patterns across even the most vibrant of the nation’s urban regions. San Francisco gets richer with trustifarians, hedge fund managers and, for now at least, social media firms. Yet Oakland, just across the bay, suffers severe unemployment, rising crime and high vacancies. The cool bars and restaurants frequented by the creatives get the media attention, but as demographer Wendell Cox notes, roughly 80 percent of the population growth in the nation’s largest cities over the past decade consisted of people living below the poverty line.

    High costs and regulatory burdens make changing this reality ever more difficult; what can be borne by Manhattan or an upscale Brooklyn neighborhood like Park Slope can devastate a grittier locale like East New York. A well-heeled banker or trust-funder may find the costs of higher taxes and regulation burdensome but still relatively trivial; such factors more strongly impact a struggling immigrant entrepreneur, or a small manufacturer, construction firm or warehouse operation. Upzonings and subsidies for real estate developers — such as those around the new Nets arena — tend to work to the benefit of high-end chains, rather than smaller, often minority-owned businesses.

    Finally for all the talk, in Brooklyn and elsewhere, of a “great inversion” sending the well-to-do to cities, and what my mother would call shleppers to the suburbs, this is not the reality. Immigration and new births have supported Brooklyn’s population numbers, up 40,000 over the past decade, but as rapid outflow of Brooklynites has continued: over 460,000 more residents left than other New Yorkers or Americans moved in between 2001 and 2009, the largest loss of any borough.

    These phenomena can be seen in almost every American city; anyone traveling from west Los Angeles to the east side can see the divide between the posh shops and restaurants nearer the beach and greater commercial vacancies, abandoned factories and empty offices further inland. That this is happening as well in “booming” Brooklyn is rarely acknowledged, but worth confronting. We need to learn not only how to hype “hip” cities, but think about how to restore them as aspirational places for those who aren’t members of the privileged and cool set.

    Joel Kotkin is executive editor of NewGeography.com and is a distinguished presidential fellow in urban futures at Chapman University, and contributing editor to the City Journal in New York. He is author of The City: A Global History. His newest book is The Next Hundred Million: America in 2050, released in February, 2010.

    This piece originally appeared in Forbes.

    Brooklyn row houses photo by Bigstock.

  • America’s Last Politically Contested Territory: The Suburbs

    Within the handful of swing states, the presidential election will come down to a handful of swing counties: namely the suburban voters who reside in about the last contested places in American politics.

    Even in solid-red states, big cities tilt overwhelmingly toward President Obama and the Democrats, and even in solid-blue ones, the countryside tends to be solidly Republican.

    What remains contested are the suburbs, which—despite the breathless talk in recent years of an urban revival—have accounted for 90 percent of metropolitan growth over the past decade.

    But as the suburbs have grown—in large part by collecting families priced out of cities or seeking more space or better schools—they’ve shifted from reliably Republican territory to contested turf. Barack Obama won 50 percent of the suburban vote in 2008, a better performance than either Bill Clinton or John Kerry.

    Obama’s success resulted from demographic changes sweeping the periphery of most major cities. Long derided by blue-state intellectuals as stultifying breeders of homogeneous white bread, the suburbs increasingly reflect and shape the country’s ethnic diversification. The majority of foreign-born Americans now live in suburbs, and many suburban towns—like Plano, Texas, outside Dallas; Cerritos, south of Los Angeles; and Bellevue, near Seattle—have become more ethnically diverse than their corresponding core cities. Among the metropolitan areas with the highest percentage of suburban minority growth are swing state regions Des Moines, Iowa; Milwaukee; and Allentown and Scranton, Pa.

    Minorities, according to a recent Brookings study now represent 35 percent of suburban residents, similar to their share of overall U.S. population.

    The suburbs of Las Vegas in hotly contested Nevada are now minority-majority, as the number of Latinos living there has shot up. Nationwide, well over 5 million Latinos moved to the suburbs during the past decade—and many more Latinos now live in suburbs than core cities. In the past, Hispanic suburbanites tended to vote somewhat more Republican than their urban counterparts. But this year, they appear to be solidly Democratic—as Latinos have been repelled by the GOP’s ugly embrace of nativism ,and drawn to Obama’s clever election-year move to offer effective amnesty to young illegal immigrants.

    Asians—another group that’s strongly favored Obama—have moved even more quickly into the suburbs. While many immigrants hail from some of the world’s densest cities, few immigrants come to America dreaming of a small apartment near a transit stop.

    “Many Asian immigrants today are bypassing the city entirely and going straight to suburban neighborhoods first to fulfill their version of the American dream,” says Thomas Tseng, a founding principal at New American Dimensions, a Los Angeles–based ethnic marketing and research firm.

    Over the past decade the Asian population in suburbs has grown at nearly four times the rate of that in cities, with 2.7 million more Asians in suburbia compared to 770,000 in the core cities. In the northern Virginia suburbs around Richmond, the number of Asian suburbanites has doubled, as it has in the suburbs around Columbus and Cincinnati. The Asian suburban population nearly tripled in the Raleigh area and doubled around Charlotte. Even in Florida, there are now well more than 100,000 more Asians in the suburbs of the Sunshine State’s four major cities—Miami, Jacksonville, Orlando, and Tampa—than there were a decade ago.

    Obama also will likely receive significant backing from white professionals, who tend to cluster in the suburbs of cities such as Columbus or around Washington, D.C. Virtually all the 10-best educated counties in America are suburban; seven are in the greater Washington area. The fact that many of these professionals work directly or indirectly for the federal government that Obama has expanded dramatically will only help him in his bid to remain in the White House.

    So what about Romney? He’s clearly a product of the suburbs, growing up in the tony periphery of Detroit and now living in leafy Belmont, Mass., a comfy close-in commuter suburb that has seen little population growth since 1950.

    In the primaries, Romney did well in suburbs, particularly upper-class ones, and those voters played a critical role in putting him over the top against Rick Santorum.

    Romney continues to score roughly 50 percent support in polls with voters making at least $100,000, a group that tends to live in affluent commuter towns ringing cities. But to win, the Republican needs to reproduce his party’s wave of 2010, when they captured roughly 55 percent of the suburban vote on their way to retaking the House. But can Romney reach beyond his classic country-club GOP base to the middle- and working-class swing state suburban voters?

    On paper, he should do well in lower density suburban areas, in large part because they tend to have far larger concentrations of married families with children, a group that tilts Republican. But despite his own family, he’s been overshadowed by Obama’s better-marketed, albeit far smaller, domestic unit.

    Romney also may be missing a chance to appeal to suburbanites on the contentious issue of “smart growth.” Opposition to suburban housing has become a favorite cause among Democratic politicians, and widely praised by the Manhattan-centric national media.

    But Romney, in his term as governor of Massachusetts, was a classic patrician corporate modernizer, showing a penchant for the kind of planning that uses strict growth controls to constrain suburban expansion.

    In this sense Romney resembles other politicians from the gentry class—such as Al Gore, Arnold Schwarzenegger, and John Kerry—who, in the name of “rational” societal objectives, make it harder for middling-class people to achieve the suburban dream they’ve taken for themselves.

    So while they represent the majority of the nation, suburban voters have no real champion in this election. Taken for granted by conservatives and betrayed by Wall Street, they have few friends in high places—except at election time. They are also increasingly detested by progressives, a long way from the days when Bill Clinton keyed in on “soccer moms.” Instead the suburbs have evolved into a shapeless political lump, divided by income and race, cultural conflict, and regional rivalries.

    On balance, this all works to the president’s favor. If Obama can manage anything close to a split in suburbia, as he did in 2008, he will surely win a second term. Such a loss, at a time of economic hardship, may be enough to force even the dullards of the GOP back to the drawing board to confront their inability to win over enough of the suburban voters (homeowners, small businesspeople, parents of any races)—who should provide the GOP an electoral majority, but so far are not.

    Joel Kotkin is executive editor of NewGeography.com and is a distinguished presidential fellow in urban futures at Chapman University, and contributing editor to the City Journal in New York. He is author of The City: A Global History. His newest book is The Next Hundred Million: America in 2050, released in February, 2010.

    This piece originally appeared in The Daily Beast.

    Suburbs photo by Bigstock.

  • A Summary of 2011 Commuting Data Released Today

    The Census Bureau’s American Community Survey released its annual one-year snapshot of demographic data in the United States. As usual, this included journey to work (commuting data), which is summarized in the table below.

    American Community Survey Commuting Data
    2011, 2010 & 2000
    ESTIMATES of Total Commuters 2000 2010 2011
    Drive Alone 97.10 104.86 105.64
    Car/Van Pool 15.63 13.27 13.39
    Transit 5.87 6.77 6.96
    Bicycle 0.49 0.73 0.78
    Walk 3.76 3.80 3.89
    Motorcyle, Taxi & Other 1.24 1.60 1.63
    Work at Home 4.18 5.92 5.99
    Total 128.28 136.94 138.27
    In Millions
    MARKET SHARE
    Drive Alone 75.70% 76.57% 76.40%
    Car/Van Pool 12.19% 9.69% 9.68%
    Transit 4.57% 4.94% 5.03%
    Bicycle 0.38% 0.53% 0.56%
    Walk 2.93% 2.77% 2.81%
    Motorcyle, Taxi & Other 0.97% 1.17% 1.18%
    Work at Home 3.26% 4.33% 4.34%
    Total 100.00% 100.00% 100.00%
    Sources: 2000, 2010 Census &  2011 American Community Survey


    Trends Since 2010

    As estimated employment improved from 137.9 million in 2010 to 138.3 from 2010 to 2011, there was an increase of 800,000 in the number of commuters driving alone, which, as usual, represented the vast majority of commuting (105.6 million daily one way trips), at 76.40 percent. This was not enough, however, to avoid a small (0.17 percentage point) decline in market share.

    Car pooling experienced a rare increase of 120,000 commuters, which translated into a 0.1 percentage point loss in market share, to 9.68 percent. Transit increased 190,000 commuters, and had a 0.09 percentage point increase in market share, to 5.03 percent. This brought transit’s market share to above its 2008 share of 5.01 percent and near its 1990 market share of 5.11 percent.

    Working at home increased by 70,000, with a modest 0.1 percentage point increase from 2010.

    Trends Since 2000

    Even with declining falling household incomes and rising gasoline prices, single-occupant commuting continued to rise between 2000 and 2011. Solo drivers increased nearly 8 million, more than the total transit commuting in 2011. Car pooling continued its long-term decline, falling 2.2 million. Transit did well (as would be expected with unfavorable economic conditions and unprecedented gasoline price increases), as we noted last year, having added 1.1 million commuters. This was spread thinly around the country, though with a 70 percent concentration in New York and Washington, DC. Over the period, working at home experienced an increase of 1.8 million, the largest increase outside solo driving.

    Media Attention

    For the most part the commuting data was ignored by the media — and for good reason. The one year changes were predictably modest. However, the exception was USA Today, with a top of the webpage "Fewer Americans Driving Solo" headline. In fact, as noted above, the short term and long term trends reflected an increase in solo driving. Moreover, reading the story it would be easy to get the impression that a sea change had occurred in how people get to work. To its credit, however, USA Today appropriately labeled the likely reasons for the mountains it made into molehills — the economy and gasoline prices.

  • The Rise of Telework and What it Means

    Teleworking (also known as telecommuting) has taken flight as a global trend. During July of 2002, European Union collectively decided on a shared framework agreement on telework, which regulates issues such as employment and working conditions, health and safety, training, and the collective rights of teleworkers. Following suit, the American the Telework Enhancement Act of 2010 served as a rallying call for federal agencies to encourage “work-at-home” employees. In the same year officials in China, eager to reduce gross national carbon emissions, chose the province of Hubei to undergo the country’s first telecommuting pilot program  

    In the United States, telecommuting is   on the clear increase.  Data from the American Community Survey estimate that the working at home population grew 61% between 2005 and 2009. The biggest increases in teleworking population compared to workforce was in Riverside-San Bernardino-Ontario, CA while the metro with the highest growth in teleworking was San Jose-Sunnyvale-Santa Clara, CA.


    Is the trend to telecommuting comparable between the private and public sectors? The 2009 American Community Survey gives a snapshot of the work-at-home population by class of worker in the years 2005 and 2009. Although the rise of teleworkers is across both sectors, a surge in government teleworkers indicates the public sector, notably the federal government, has made a huge effort keep staff at home to cut administrative costs.

    After the federal government, the next largest increase in ratio of teleworkers is at the state level. Municipal government teleworkers showed the most modest growth and represent only 3.9% among those working at home. Though only 2.4% of private for-profit sector employees consider themselves teleworkers, by size alone they represent about three-fourths of the working-at-home population.

    Still, understanding of telework remains incomplete.   First, as President Obama’s Council of Economic Advisors stated in 2010, there remains a persistent “lack of data on the prevalence of workplace flexibility and arrangements which makes policy-making more difficult.” There are often ambiguities such as the issue of how to distinguish between part-time and full-time teleworkers. One also must separate paid work telework (such as an official flex-time work arrangement) from non-paid telework (such as a teacher grading papers at home during the weekend).   Telework’s definition is so broad that perceptions   can vary dramatically.

    New research attempts to bring clarity into whether employers should allow their employees to have a work-at-home option. Results from a recent study at Stanford partnered with Ctrip, an online travel-booking agency based in China, presented strong evidence to support the causal relationship between telework and productivity. With a turnover rate among Ctrip call center representatives hovering at around 50% per year (typical of the industry in China), retaining workers was a core objective of the experiment. Estimates by management say the typical costs of hiring and training a new representative is $2000, approximately 6 months of salary for an average employee.

    Despite initial doubt, the research provides stark insight on efficiency gains from telecommuting gains. An article from Slate summarizes the findings:

    Over the duration of the experiment, home workers answered 15 percent more calls, partly because each hour was 4 percent more productive, and partly because home office employees spent 11 percent more time answering phone calls. (Home workers took fewer breaks and sick days, rarely arrived late to their desks, and had fewer distractions.) … distractions of home life had no impact on the quality of service: The home-work group converted phone calls into sales at exactly the same rate as those in the office. And employees themselves liked the arrangement better… [and] reported less “work exhaustion,” a more positive attitude towards their jobs, and were nearly 50 percent less likely to say they were planning to quit at the end of the eight months.

    In the long run, telecommuting could generate massive changes in urban geography. As benefits of telework manifest in new research, city planners ought to observe how its impact on the geography of American cities.

    Teleworkers are more likely than not to live in the suburbs. Since teleworkers are often required to be tech-savvy with the latest mobile devices, one could expect a disproportionately high percentage of them working in hi-tech industries in sprawled tech hubs like the Silicon Valley. Most teleworkers choose to commute for a very practical reason: it would save them time and money. According to research by Kate Lister and Tom Harnish of the Telework Research Network, aside from housing preference the typical teleworker is a 49-year-old, college-educated, salaried, non-union employee in a management or professional role, earning $58,000 a year at a company with more than 100 employees. As of 2009, 76% of the total working-at-home population consists of the for-profit workers.

    Some industries will stay clustered around the city center but more jobs, especially service-oriented ones, will continue to migrate towards the suburbs.  

    Teleworking will increase the total amount of hours Americans work annually. Americans, infamous for overwork, can easily translate telework as “more work.” Data from the United Nations reports 86% of American males and 67% of American females working more than 40 hours a week. While technology has often been accused as a job-killer, it has also made jobs easier and, in some ways, more social. Employers using Cloud technology are utilizing personalized social networks in hopes of creating a more connected community in the work place. The point at which work begins and leisure ends is becoming increasingly hard to distinguish as hours spent “on the job” are elusive, and thus harder to limit.

    For urban planners, this signals new types of urban development to provide for a population of Americans that work longer hours but do so closer to home.  Food and retail establishments will be one of the first to address this trend. Coffee shops with Wi-Fi and casual dining franchises like Panera and Corner Bakery will become commonplace in middle-to-upper class suburban neighborhoods.

    These general locales could generate a privatized version of the Third Place, a milieu distinct from the two usual social environments of home and the workplace. Other urban innovations to anticipate include co-working offices, such as those offered by BLANKSPACES, and pay-as-you-go meeting services, like Liquidspace.

    The availability of affordable mobile technology has been the main contributor to the "any time, any place" lifestyle. Still, the trend is limited to a small percentage of American workers, mainly those that tend to work in service-oriented positions and, as the numbers in Silicon Valley suggest, in the service sector. As more interest and funding is directed towards nanotechnology and cloud networking, perhaps this lifestyle will propagate to become the new normal. If so, telework may someday be just a common way that people work that may change forever the urban landscape.

    Jeff Khau graduated from Chapman University with a degree in business entrepreneurship. Currently, he resides in Los Angeles where he is pursing his dual-masters in urban planning and public policy at the University of Southern California.

    Office or home signpost photo by Bigstock.

  • The Changing Geography of Asian America: To The South And The Suburbs

    “There’s nothing wrong with New York that a million Chinese couldn’t cure,” the urban geographer George Sternlieb once quipped. It may be an exaggeration, but rising Asian immigration has indeed been a boon to many communities and economies across the country.

    Over the past 30 years the number of Asians in America has quadrupled to 18 million, or roughly 6% of the total U.S. population. But their economic impact is much greater. They are far more likely to be involved in technology jobs than other ethnic groups, constituting over 20% of employees in the nation’s leading technology companies, four times their share of the overall U.S. workforce. And then there’s the line of connections to the most dynamic economies on the globe: India, South Korea, Singapore and, of course, China.

    Asia has become the nation’s largest source of newcomers, accounting for some 36% of all immigrants in 2010. Asian immigrants and their U.S.-born descendants tend to be better educated: half of all Asians over 25 have a college degree, almost twice the national average. They earn higher incomes, and, according to a recent study by the Pew Research Center, are more likely to abide by “traditional” values, with a stronger commitment to family, parenting and marriage than other Americans, and a greater emphasis on education.

    “Most Asian immigrants bring with them a healthy respect and aspiration for the American way of life, so I don’t think any immigration alarmists need to be anxious,” notes Thomas Tseng, founding principal at New American Dimensions, a Los Angeles-based marketing firm. “With a large influx of them, you will get a lot of their kids in the school system who are told that getting an education is the surest way for them to succeed in life, a great deal of entrepreneurial energy and new businesses in a region, and most certainly the local restaurant scene will improve.”

    To find out where Asians are settling, we asked demographer Wendell Cox to analyze the most recent decennial Census. As expected, the largest Asian communities are in the largest metro areas, led by New York and Los Angeles with almost 1.9 million Asians each — twice the magic number cited by Sternlieb — followed by Chicago.

    But our analysis found that in search of opportunity, Asians are increasingly headed to regions that, until recently, had very few Asian immigrants. And throughout the country, Asians, following a trend that has been developing over the past two decades, appear to be settling primarily in the suburbs.

    Similar to the pattern we found in a survey on the migration patterns of bachelor’s degree holders, Asians are increasingly settling not in the established hubs, but in younger, more vibrant and growing cities that are mostly in the middle or southern half of the country.

    Although greater New York’s Asian population grew by an impressive 500,000, up 40%, our analysis of the 2010 Census numbers found a higher rate of growth — more than 70% — in relatively new destinations, Dallas and Houston.

    “I think the Texas economy has offered robust job prospects and opportunities for many Asian families—immigrant and native born alike,”notes Tseng. “Another key attraction is the affordable cost of living in Texas, especially compared to places like California, which may be one of the places from where Houston and Dallas is getting Asians from.”

    Several smaller cities also saw bigger percentage gains during the 2000s: the Asian populations of Raleigh, N.C., Charlotte, N.C., Indianapolis and Phoenix all rose by 100% or more.

    Growth was much slower in traditional Asian centers: 57% in the Washington metro area, and 52% in Seattle. The Asian populations of the Los Angeles and San Francisco areas expanded less than 25%. Overall, it is clear that the Asian population, although still largest in the biggest metros, has been dispersing to other parts of the country.

    But that’s not the only way Asians are dispersing. We are witnessing a continued shift of Asians to suburbia in almost all regions. Increasingly, the real Chinatowns, Koreatowns and little Indias of America are in the inner and outer suburban rings, notes Tseng. The inner city is largely the province of the elderly and recent immigrants.

    For example in the New York area, the Asian population grew both in numbers and in percentage terms far more rapidly, 48%, in the suburbs than in the city, where growth was under 30%. This trend was even more stated nationwide. Nationwide over the last decade, the Asian population in suburbs grew by almost 2.8 million, or 53%, while that of core cities grew 770,000, or 28%.

    This trend is evident as well on the West Coast, the traditional hub of America’s Asian population. In Seattle, the core city added 11,000 Asians over the past decade while the surrounding suburban ring added 124,000. The big growth in diversity around the Puget Sound is taking place not in the city of Seattle, but in suburban hubs like Bellevue (population: 122,000). Asians have come to constitute over 27% of Bellevue’s population, twice their percentage in the city of Seattle.

    Similar patterns can be seen in other Pacific coast cities. In the San Francisco Bay region the suburban Asian population grew by 186,000 compared to 24,000 in the urban core; a growth rate, at 35%, almost three times that of the local core. An analysis of Asians working in Silicon Valley — where by some estimates they now constitute a majority of computer industry workers — finds this population moving further away from the urban core, particularly to areas with concentrations of single-family housing.

    In Los Angeles, the nation’s largest Asian region, the suburbs added roughly five times as many Asians as the core city. In, there are now roughly three Asian suburbanites for every core city dweller. These pattern are even more marked in cities that are just now becoming Asian hubs. For example, the city of Plano (population 270,000) in the northern suburbs of Dallas is almost 17% Asian; Dallas itself is only 3% Asian.

    Why is this dispersion occurring, given that so many Asians come from densely packed cities? “Many Asians head for the suburbs in search of a certain lifestyle for their families, “ suggests Tseng, whose father immigrated to central Los Angeles from Taiwan, and later settled in the heavily Asian suburban expanses east of the city. “The American dream of owning your own home is something many Asian immigrants are strongly compelled to — particularly a version that includes a single-family residence, with adequate space, private lot, plenty of trees, and a good school district. This can be a stark contrast from the dense, urban cities they came from — but that is what many are seeking to escape in the first place.”

    Joel Kotkin is executive editor of NewGeography.com and is a distinguished presidential fellow in urban futures at Chapman University, and contributing editor to the City Journal in New York. He is author of The City: A Global History. His newest book is The Next Hundred Million: America in 2050, released in February, 2010.

    This piece originally appeared at Forbes.com

    Photo “asian american” by flicker user centinel.

  • The Answer Is Urban Consolidation – What Was The Question?

    The New Zealand Green Party is perpetuating the claim that development beyond Auckland’s “city limits” imposes a high cost on ratepayers.  A spokesperson claims that the current Auckland plan, which allows for some new development outside the current urban area, “will cost ratepayers $42b billion to 2042, an annual levy of $200 per ratepayer” according to a report in the New Zealand Herald.   

    But is just so happens that study on which these calculations are based is a flawed commissioned report[1] rather than a peer reviewed academic study. 

    Oops – Contradictory Claims
    The authors of the Curtin report acknowledged at the outset that

    "The challenge …  is that infrastructure costs are so heavily dependent on area-specific values.  For instance, road costs among different prospective development areas may vary based on the necessity for major arterial roads, costs for sewerage and water infrastructure could vary immensely depending on terrain and trenching conditions, and many infrastructure components will differ depending on the level and degree of excess capacity” (p.4)

    So why did they try to develop a generic tool for estimating the cost of urban development in Australiancities based on a mishmash of evidence from different cities and suburbs in Australia and the United States?  And why would anyone even contemplate applying such “findings” to Auckland with its distinctive physical geography, so different from its Australian counterparts? 

    A Quick Critique
    The Productivity Commission actually considered the study, among others, in a brief review of housing costs and urban form (Appendix B of the final report).  It noted substantive differences in the physical and social settings behind the data assembled to support the study’s claim to some sort of universal cost relationship between development and distance from the city centre.

    And there are glaring methodological deficiencies:

    An obvious one is mixing discount rates (zero for infrastructure capital costs, 7% for transport-related costs, and 3% for health and emission costs), and omitting operating costs for some items (non-transport infrastructure) and not others (pp. 295-296)

    To these flaws can added the assumption of a cost of Aus$170/tonne for carbon emissions when the carbon floor price set by the Australian government (of $15) has since been rescinded and figures at or below $10.00 may be more appropriate based on today’s European prices.  So the environmental argument is seriously overstated.

    And the analysis fails to deal with the costs of expanding the capacity of ageing infrastructure in long-established urban areas, of remediating services designed for far lower loadings than they are now expected to sustain, of the health impacts of apartment living in an increasingly brown – not green – environment, and of reductions in the physical and social resilience of high density and often congested urban areas in the face of possible natural disasters or infrastructure failures.

    Penalizing the Household – is that Socially Sustainable, or Politically Justified? 
    Even if it can be proven that the balance of public benefits favours medium or high density living, is there any evidence that such savings will not be offset by the better affordability of traditional suburban housing and the benefits residents derive from living into it?

    Putting aside the flawed data and methodology for the moment, the results indicate that 70% of the differences in costs between decentralized and central locations is attributable to travel and transport.  Over half of these comprise travel costs and time carried by households.  If we take these private costs out of the equation the authors’ estimate of the difference between centralized and decentralized development falls by 40%.  

    The resulting "present cost" for the average household (whatever that might be) of A$22,000 is easily  justified by savings on land and housing in “outer” areas, the benefits households get  from  additional space, greater choice over housing style, and the security and community benefits of suburban environments.

    So who pays if we deny people the choice of living in medium to low density housing?  It’s new households due to exclusion from household ownership, or commitment to punitive mortgages, or through the insidious extension of housing poverty through ever higher income brackets. 

    So what about the Auckland case: where does the evidence really lie?
    Surprisingly, given the obstinacy of the planners and politicians pushing the consolidation barrow, no-one has actually done the analysis required to determine the relative economic benefits of different urban development paths for Auckland.  

    A technical analysis of the gaps in the Auckland Regional Growth Strategy made the point that the planning model that informed it was hardly up to the task.  The principal conclusion that came from using the Regional Councils land use and transport model was that there is “little [identified] economic difference between growth options”.[2]  

    The failure of the model to demonstrate economic differences between alternative urban forms was used to suggest that intensification imposes no additional costs than traditional decentralized development.  Of course, the converse is true – although it has been conveniently ignored – there were no demonstrable economic benefits from consolidation or net cost penalties to decentralization.  This suggests that it would make most sense to let the market prevail, subject to broad environmental standards and fiscal constraints.   

    The conclusion  that consolidation was the best option for Auckland ignores other shortcomings  in the  model that could  tip the balance  in favour of strategic decentralisation:

    • The failure to actually define realistic alternatives that would  clearly demonstrate economic differences;
    • A failure to the marginal rather than average impacts of differences in urban form;
    • Ambiguous measurement (both omissions and double counting);
    • The failure to identify the costs of implementation.

    To this list we can add underestimation of the high infrastructure and development costs associated with brownfield development and urban consolidation.  These are turning up today in high financial and development contributions for inner city projects.

    Calling for Consolidation – a Case of Artificial Intelligence
    So why is the Auckland Spatial Plan so fixated on consolidation –despite the begrudging lip service the final version pays to decentralization (and even that appears to have  upset so upsets the Green spokesperson)?

    I can only think it is "artificial intelligence": if enough people say the same thing, it must be right.  Consensus becomes an excuse for lack of evidence, critical analysis, or even common sense.  Groupthink prevails: a phenomenon defined by psychologist Irving Janis as:
    A mode of thinking that people engage in when they are deeply involved in a cohesive in-group, when the members’ strivings for unanimity override their motivation to realistically appraise alternative courses of action [3]

    Contrary evidence is dismissed while reports favouring an emerging consensus, such as the Curtin one, obtain a degree of currency which, while unjustified,  plays into the hands of policy makers looking for easy (or ideologically comfortable) answers to difficult problems.

    And so we blunder on, potentially building our cities on myth and misconception and reinforcing the gap between generations as we do it.

    Phil McDermott is a Director of CityScope Consultants in Auckland, New Zealand, and Adjunct Professor of Regional and Urban Development at Auckland University of Technology.  He works in urban, economic and transport development throughout New Zealand and in Australia, Asia, and the Pacific.  He was formerly Head of the School of Resource and Environmental Planning at Massey University and General Manager of the Centre for Asia Pacific Aviation in Sydney. This piece originally appeared at is blog: Cities Matter.

    Aukland harbour photo by Bigstockphoto.com.


    [1]         Roman Trubka, Peter Newman and Darren Bilsborough  (2008) Assessing the Costs of Alternative Development Paths in Australian Cities, Curtin University Sustainability Policy Institute, Fremantle, Report commissioned by Parsons Brinckerhoff Australia
    [2]         McDermott Fairgray Ltd (1999) Gap Analysis, Review and Recommendations: Auckland Regional Growth Strategy, Technical Report, Auckland Regional Growth Forum

    [3]        Janis, I L (1972). Victims of Groupthink Houghton Mifflin p.  9

  • The Evolving Urban Form: Zürich

    Zürich is the largest urban area in Switzerland. The core city (stadt) of Zürich is located at the northern end of Lake Zürich, which is glacial and similar to the "finger lakes" of upstate New York. Lake Zürich is approximately 25 miles/40 kilometers long and 1-2 miles/1.5-3 kilometers wide. The urban area extends south along most of the lake and over hills to the East and West and further North.

    Zürich, like larger Paris and Barcelona is a favorite among urban aficionados. Two reasons: the apparent compactness of its urban core and it has one of the world’s best transit systems. Yet, as is shown below, Zürich looks and feels denser than the reality experienced by its citizenry. Moreover the urban core is surrounded by a sea of anything-but-compact suburbanization, as is the case in Paris and virtually all other large Western urban areas. A visit confined to the smallish, but architecturally pleasing precincts of the core can lead to a profound misinterpretation of the urban form (See Louvre Café Syndrome: Misunderstanding Amsterdam and America).

    The City of Zürich (Stadt)

    Like virtually all European core cities that have not substantially annexed new land or consolidated with other jurisdictions, the city of Zürich has lost population. Zürich reached its population peak in 1960, with 440,000 people. Since that time, the population has fallen to 373,000, a loss of 15 percent. The city is not very dense despite its reputation to the contrary. The land area is 34 square miles/89 square kilometers, which yields a 2010 population density of 11,000 per square mile/4200 per square kilometer. This is less than two thirds the density of the city of San Francisco and similar to that of some Los Angeles suburbs, such as Santa Ana, Inglewood or Alhambra (Figure 1).

    The city is divided into nine districts. The densest, the 5th district, covers 1.1 square miles/2.9 square kilometers and has a density of 24,000 per square mile/9200 per square kilometer. By comparison, Westlake, the most densely populated community planning district in the city of Los Angeles covered three times as much land and had a population density of 34,000 per square mile/13,000 per square kilometer in 2000 (latest data available). This is 40 percent greater than the highest Zürich district density.

    The Urban Area

    According to the Federal Office of Statistics (FSO), the Zürich urban area (urban agglomeration) has a population of approximately 1.2 million and covers a land area of 420 square miles/1085 square kilometers. The population density is comparatively low, at 2800 per square mile/1075 per square kilometer.

    Zürich’s development since World War II has mirrored the international trend towards suburbanization. In 1950, the urban area included the city of Zürich and 14 additional municipalities. The city, with a population of 390,000, contained more than 85 percent of the urban area population as defined at that time. Since 1950 all growth in the Zürich urban area has been in the suburbs. By 2010, the city of Zürich represented only 32 percent of the urban area population (Figure 2). Suburban areas account for 68 percent of the population and more than 90 percent of the urban land area.

    At each decennial census year, FSO adds new municipalities to the urban area as appropriate. In 1950, the urban area included the city of Zürich as well as 14 additional municipalities. By 2000, the urban area included the city of Zürich and 130 other municipalities (Figure 3). FSO is reviewing 2010 census results and is likely to add more municipalities to the urban area within the next year. The population of the urban area as presently defined has nearly doubled since 1950. The population trend for the city of Zürich and the six suburban rings (as presently defined) is illustrated in the Table.

    Zürich Urban Area: Population of Core Municipality & Suburban Rings: 1950-2010
    1950 1960 1970 1980 1990 2000 2010
    Urban Area: (Agglomeration Zürich)   605,765   801,124   947,011   970,073   1,021,859   1,080,728   1,188,566
    City of Zürich (Stadt)   390,020   440,170   422,640   369,522      365,043      363,273      372,857
    1st Ring (1950)     59,324     97,124   132,014   136,787      135,777      138,936      153,674
    2nd Ring (1960)     45,989     73,560   120,492   140,088      154,226      168,812      192,469
    3rd Ring (1970)     13,396     19,135     44,178     59,823         67,567         73,364         82,693
    4th Ring (1980)     64,259     83,036   113,195   132,444      145,165      159,021      183,878
    5th Ring (1990)     32,777     41,483     52,329     60,240         72,402         82,862         94,244
    6th Ring (2000)     46,616     62,163     71,169         81,679         94,460      108,751
    1950 Population for 6th Suburban Ring (2000) Not Available
    Source: Statistik Stadt Zürich & FSO


    In recent decades, population growth has gradually moved farther to the periphery of the urban area. This is illustrated by Figure 4, which shows a population trends for the city, the first three suburban rings (1950 to 1970) and the outer three suburban rings (1980 to 2000). By 2000, the three inner suburban rings exceeded the population of the city of Zürich. The outer three suburban rings passed Zürich in population by 2010 (Photo: Suburbs of Zürich).

    Suburbs of Zürich

    Suburban densities are considerably lower than that of the city of Zürich. Suburban Zürich has an overall population density of approximately 2100 per square mile/800 per square kilometer. As would be expected, the population densities decline substantially with distance from the city of Zürich (Figure 5). The first ring suburbs (1950) have a population density of 4500 square mile/1800 per square kilometer. This is about a quarter higher than the aggregate suburban density of Portland or New York, but only two-thirds as dense as the Los Angeles suburbs. The lowest population density is in the sixth suburban ring (2000) at approximately 1200 per square mile/450 per square kilometer. This is slightly above the approximate 1000 per square mile/400 per square kilometer international standard used by national statistics agencies in designating urban areas (Note 1).

    Similarly, employment has become more dispersed as jobs follow residents toward lower density suburban areas. Less than 15 percent of the urban area’s employment is in the central business district, a figure similar to that the average of US, Canadian and Australian urban areas.

    Getting Around and To Zürich

    Zürich is served by one of the world’s most effective transit systems, which necessarily focuses on the central business district and provides an intense mesh of service in the core city. Among the approximately 90 urban areas of the world for which the Millennium Cities Database provides service information, Zürich ranked 22nd in transit service intensity (transit vehicle kilometers divided by urban area square kilometers), with a service-level approximately 15 percent that of Hong Kong (Note 3). Among the European urban areas surveyed, only Barcelona and Milan had more intense transit service.

    However, as is the case in all urban areas of Western Europe (as well as the United States, Canada and Australia), the overwhelming majority of motorized travel in the Zürich urban area is by car. Zürich’s automobile market share, in distance traveled, is approximately 75 percent, similar to that of Paris and approximately 15 percent below that of the New York, Toronto or Sydney urban areas.

    Zürich, as the nation’s largest urban area, is unique in not having been linked to its national freeway (motorway) system until recently. Only since 2009 has Zürich been connected to nearby Lucerne (only 30 miles/50 kilometers away) or beyond  through the St. Gotthard tunnel to Milan and the South. The new Uetliberg Tunnel (A4 motorway) connects to the exurb of Zug. For the first time Switzerland’s main north-south motorway connects to its principal route, the east-west A1 motorway   (Note 2).

    No motorway dissects the city of Zürich. However, a swath is cut through the city of Zürich by the national railway system. Starting at Zürich Station and extending to the north city limits, the railway divide is from 150 to 450 meters/650 to 1500 feet wide (Photo: Zürich Railway Divide). This may be wider than any freeway in the world. For example, the 26-lane Katy Freeway in Houston, the 18-lane Autopista Panamericana in Buenos Aires and the 14-lane MacDonald Cartier Freeway in Toronto all have average widths of 150 meters/650 feet or less.

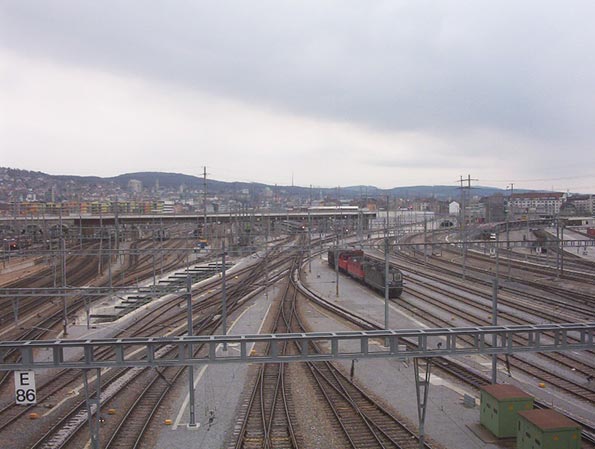
    Zürich Railway Divide (from Hardbrücke)

    Zürich: Compact Core, Suburban Reality

    Like urban residents throughout the high-income world, the residents of Zürich (and other Swiss urban areas) have chosen to live in larger, more comfortable houses, often with yards (gardens). At the same time, the historical urban core remains intact as a frequent or occasional destination for both tourists and residents, most of whom live in the suburbs.

    Wendell Cox is a Visiting Professor, Conservatoire National des Arts et Metiers, Paris and the author of “War on the Dream: How Anti-Sprawl Policy Threatens the Quality of Life.”

    —–

    Photo: Zürich Urban Core Street Scene (photos by author)

    Note 1: Such as INSEE (France), National Statistics (UK), Statistics Canada, United States Census Bureau, Census of India,

    Note 3: According to Millennium Cities Database information, only Manila had more intense transit service than Hong Kong (85 percent higher service intensity).

    Note 2: Switzerland speed limits are slow by European standards, but generally higher than those in the United States, Canada and Australia. The national speed limit on the motorway system is 120 kilometers per hour/75 miles per hour. Speed limits are higher in France and Italy at 130 kilometers per hour/81 miles per hour. In Germany, most of the autobahn system is not subject to speed limits. The highest speed limit in the United States is now planned for a new toll road (C-130) between San Antonio and Austin, at 85 miles per hour/137 kilometers per hour and on some other Texas and Utah roads at 80 miles per hour/129 kilometers per hour. Elsewhere in the United States, Canada and Australia, speed limits are lower than in Switzerland and nearly all Europe.

  • Carmel, IN Named Best Small City in America to Live In But Can Others Follow?

    Money Magazine just named the Indianapolis suburb of Carmel as the top small city in America to live in. Fishers, another Indianapolis suburb, ranked #12.

    Any ranking survey, and particularly one done by a magazine, needs to be taken with a grain of salt. However, Carmel and Fishers (along with occasionally Noblesville), frequently show up high in various national rankings. For those interested in suburban living, these places offer a pretty strong combination of good schools, low real estate prices (Indianapolis is basically the cheapest big city housing market in America), low taxes, and fairly high quality of life. With populations of over 75,000 each, these communities also have the scale to efficiently provide quality public services.

    I personally think Fishers has long term sustainability issues. It has kept up with very rapid growth admirably, but it has really not done much to secure its long term future, and when it reaches buildout, I expect problems to set in.

    Carmel by contrast has invested heavily in building towards a future where greenfield growth is no longer the driver. It has invested in high quality public facilities, some of the best suburban transportation infrastructure in the nation, building new urbanist neighborhoods from scratch, upgrading utilities, improving the environment, etc. Dan McFeely of the Indianapolis Star covers Carmel and wrote a bit about this.

    I’ve covered Carmel extensively for years here on the blog, calling it the “next American suburb” and writing about its civic strategy, new urbanist approach, and various criticisms of its leadership.

    I think the Carmel story is an interesting one because it shows how a city, albeit an affluent one, in a very conservative state can fundamentally transform itself in a way that that demonstrates results. This includes urbanism standards and infrastructure standards that exceed those of the urban core of Indianapolis, with many of its public services being better as well.

    The results most notably show up in incomes. While incomes cratered relative to the US in both Indiana and metro Indianapolis, Carmel’s median household income actually inched up versus the US average despite starting from a higher base.

    In short, the strategy has been working, though obviously the national economy has had an effect. And I don’t necessarily support everything they have done. Their $150 million performing arts center, for example, all paid for with public funds, seems expensive for a city of this size, and has saddled the city’s redevelopment commission with debt. But on the whole, things seem to be paying dividends.

    This is part of the explanation for why Indianapolis as a region has done well while its urban core lags many other cities. The majority of people prefer suburbs, and Indy’s newer suburbs provide an exceptional value proposition.

    Ultimately to be successful, the region will have to fire on all cylinders. This means both urban and suburban, with each neighborhood and town bringing a unique approach and its A game to the table. It’s not an either/or situation. I want to build urban cores up, not tear suburbs down. (Downtown Indianapolis has its own game going. Despite some recent criticisms that I stand behind, downtown Indy has positive momentum in a lot of areas. For example, another 300 tech jobs were just announced yesterday).

    I previously highlighted Columbus, Indiana, which has accomplished something similar in a more blue collar environment. So positive stories based on different variations of the same playbook aren’t limited merely to upscale suburbs.

    In a state that has long lagged the nation in job and output growth, and where the very large decline in relative incomes has been a huge issue at all levels, you would think that leaders would be streaming in to study these successful models.

    Alas, that is not the case. Not only is there little interest in learning from models that are actually working (save perhaps for other Indy suburbs looking to Carmel), there’s actual hostility. It’s as I said in some recent posts: Indiana actively discourages the pursuit of excellence. They’d rather cut down the successful than bring up the failing. State level policy choices are trying to do just that.

    Start with school funding. As part of a property tax reform process, the state of Indiana took over 100% of all local school operating funding. However, they also changed the funding formula in a way that stuck well performing metro Indy districts at the bottom of the pile. Out of about 360 school districts statewide, Carmel is fourth from the bottom in per pupil funding from the state. Other regional districts like Fishers and Zionsville are also at the bottom. In effect, the state decided to starve fast growing and well performing suburban districts. Somehow this didn’t make the list of education reforms in that recent Economist article. For a state that claims to want to base its economic future on things like life sciences, this sure seems puzzling.

    The state has also sought to impose a one size fits all, least common denominator approach to services. While it didn’t affect Carmel directly since they already built their first class library, the state’s Department of Local Government Finance vetoed plans by the suburbs of Westfield and Greenwood to build new libraries (partially inspired by Carmel), even though the bonding plans survived a petition challenge. The state’s rationale was that the cost per resident was higher than the state average. It’s easy to see that a policy like this acts as a one way downward ratchet.

    The state also passed a law that not only capped property taxes as a percentage of assessed value – a measure I support – but also put in place a de facto spending freeze for all cities at current levels through a levy cap.* (This levy cap ignores growth in commercial tax base, so if a town built a 50 million square foot industrial park, it wouldn’t even be able to raise the revenues to provide services to it).

    This has left cities increasingly depending on gimmicks to finance anything. And every time a city figures something like that out, the state makes noises about shutting it down. The state has also refused to allow communities to even let their own citizens vote in favor of spending money on things like transit. Indiana has never particularly empowered municipalities, but recent years have seen a strong turn towards disempowerment, with the state’s General Assembly serving as a sort of uber-city council (and now uber-school board too).

    I’d be willing to venture that neither Carmel nor Columbus would be able to accomplish what they have if they were starting out on the journey today under the current state legal and political climate.

    This is not to say that spending money is a solution to problems. Actually, by national standards, places like Carmel and Columbus don’t spend very much money at all. With some exceptions like that performing arts center, they are actually quite frugal. They understood the concept of long term total cost of ownership, and as a result have kept taxes low by not being penny wise, pound foolish in the short term, while so many other places that thought only about the now have descended into a near death spiral of service cuts, tax increases, and abandonment. That’s the tragedy.

    In a rational world, one would think that we’d look at models that are producing population growth, job growth, corporate (including foreign) investment, high quality of services and quality of life, keeping incomes at or above US levels – and mostly importantly all while keeping taxes well below normal (at the bottom of the state in Carmel’s case) even by the standards of Indiana – and say to ourselves: how can we get more of that? Unfortunately, that’s not the case here. (Again, some other Indy suburbs excepted).

    Before proposing solutions to Indiana’s long term under-performing economy, I would suggest that the candidates for governor first take a look around the state to examine at the places that are already doing well and have been doing well over the last decade or more. Then ask the question: what are they doing different and right and what do we need to do to get other places doing those things? First among the places to visit would be suburbs like Carmel and industrial cities like Columbus. If you’re ranked #1 in America, you must be doing something right.

    * This is complicated, but my understanding is that the total property tax levy cannot grow faster than inflation + population growth. This has had many perverse incentives, including keeping entities like townships from lowering their tax levy even when possible because they’re afraid they’ll never be able to raise it again if needed.

    Aaron M. Renn is an independent writer on urban affairs and the creator of Telestrian, a data analysis and mapping tool. He writes at The Urbanophile, where this piece originally appeared.

    Carmel City Hall photo by Bigstock.

  • Tokyo: Population Swan Dive Predicted

    In a recent Evolving Urban Form article, we speculated that Tokyo, the world’s largest urban area (population more than 35 million) could be displaced by fast-growing Jakarta or Delhi as early as 2030. If the prediction of central jurisdiction administrators and academics come true, Tokyo could be passed by many other urban areas in population by 2100.

    The Japan Times reports forecasts that the population of the Prefecture of Tokyo, the central jurisdiction of the metropolitan area, could decline by nearly 50 percent (chart) between 2010 and 2100 (Note). Yet, while the overall population is dropping in half, the elderly population would increase by more than 20 percent. The resulting far less favorable ratio of elderly to the working population would present unprecedented social and economic challenges.

    The article provides no information on the population of the entire urban area in 2100. The Prefecture of Tokyo constitutes somewhat over one third of the present population of the urban area.

    During the last census period (between 2005 2010) the four prefecture Tokyo metropolitan area (Tokyo, Kanagawa, Saitama and Chiba), gained approximately 1,100,000 new residents, while the balance of the country was losing 1,400,000 residents. Japan is forecast to suffer substantial population losses in the decades to come. The United Nations forecasts that its population will decline from approximately 125 million in 2010 to 90 million in 2100. This is the optimistic scenario. The National Institute of Population and Social Security Research forecasts a drop to under 50 million, a more than 60 percent population reduction.

    There are serious concerns about the projected population decline. According to the Japan Times, the researchers said that " … it will be crucial to take measures to turn around the falling birthrate and enhance social security measures for the elderly,"  A professor the National Graduate Institute for Policy Studies, expressed concern that "If the economies of developing countries continue growing, the international competitiveness of major companies in Tokyo will dive."

    —-

    Note: the Prefecture of Tokyo government is called the Tokyo Metropolitan Government. This term can mislead, because the prefecture itself is not the metropolitan area, but only part of the four prefecture metropolitan area. The pre-– amalgamation predecessor of the current city of Toronto was called the Municipality of Metropolitan Toronto. Like the Prefecture of Tokyo, the Municipality of Metropolitan Toronto comprised only part of the Toronto metropolitan area. Confusion over these terms not only resulted in incorrect press reports, but even misled some academic researchers to treat these sub-metropolitan jurisdictions as metropolitan areas.

  • Barack Obama’s New Chicago Politics Abandon Bill Clinton’s Winning Coalition

    While the Democratic convention this week celebrates the party’s new coalition, Bill Clinton will no doubt try to recapture the white middle class that’s largely deserted the Democrats since his presidency ended. But it’s likely his efforts will be a case of too little, too late for Barack Obama—who will have to look elsewhere for his electoral majority.

    The gentrification of the Democratic Party has gone too far to be reversed in this election. After decades of fighting to win over white working- and middle-class families, Democrats under Obama have set them aside in favor of a new top-bottom coalition dominated by urban professionals—notably academics and members of the media—single women, and childless couples, along with ethnic minorities.

    Rather than representing, as Chris Christie and others on the right suggest, the old, corrupt Chicago machine, Obama in fact epitomizes the city’s new political culture, as described by the University of Chicago’s Terry Nichols Clark, that greatly deemphasizes white, largely Catholic working-class voters, the self-employed, and people involved in blue-collar industries.

    The Chicago that Obama represents is more Hyde Park or the Gold Coast than the Daley family base in blue-collar Bridgeport; more faculty club, media shop or Art Institute than the factory culture of “the city of Big Shoulders”.

    The traditional machine provided him with critical backing early in his political career, but Obama owes his success to new groups that have taken center stage in the increasingly liberal post-Clinton Democratic party: the urban “creative class” made up mostly of highly-educated professionals, academics, gays, single people, and childless couples. It’s a group Clark once called “the slimmer family.” Such people were barely acknowledged and even mistreated by the old machine; now they are primary players in the “the post-materialistic” party. The only holdovers from the old coalition are ethnic minorities and government workers.

    As Clark suggests, the new political urban culture differs in both intent and content from the old one. In the past, say under Richard Daley Sr., Chicago was still a family city where schools, churches, and neighborhood associations were key local amenities. Patronage meant jobs for people who also owned homes, both inside and outside the city, and raised and educated their children, often in Catholic schools. The old Daley machine would no more take on the church on contraception than embrace North Korea as its political role model.

    The  Chicago that spawned Obama  has very different priorities. Clark gives perhaps the best definition—“the city as entertainment machine,” where citizens are preoccupied with quality-of-life issues, “treating their own urban location as if tourists, emphasizing aesthetic concerns.”

    This new city, built around the needs of largely childless and often single professionals, focuses primarily on recreation, arts, culture, and restaurants;  the resources valued by the newly liberated urban individual. The economy of such places focuses primarily on those jobs done by these professionals, either in the over-hyped social-media sector, traditional entertainment, or as service providers— waiters, toenail painters, dog-walkers—that cater to the gentry of the urban core.

    In this urban schema, family, long the basic unit of society, becomes peripheral. The new urban political  base—not only in the Windy City but in Boston, New York, Los Angeles, Seattle, Boston and other parts of the core Obama archipelago—is primarily childless, notes demographer Ali Modarres. A majority of residences in Manhattan, for example, are for singles; thus Mayor Bloomberg’s push for 300 square-foot “affordable” micro units that could cost as much as $2,000 a month. Gentrifying Washington, D.C., now boasts the highest concentration of childless adult females in the nation, a mind-boggling 70 percent of all adult women.

    With more than half of all American women now single and more than half of all births to women under 30 now occurring outside of marriage—both historic developments—Obama has targeted “single women” as a core constituency second only to African Americans. Democratic pollster Stanley Greenberg has dubbed them “the largest progressive voting bloc in the country.” Singles, though not the most reliable voting bloc, almost elected John Kerry, and helped put Obama over the top.

    The new urban political culture Nichols described in Chicago has gone national, essentially gentrifying  the Democratic Party and pushing away the predominately white working- and middle-class families whose goals centered around achieving home ownership, basic essentials, and the occasional luxury. These groups have been leaving both the core cities and the Democratic Party for generations. Bill Clinton, former governor of a poor southern state, connected with these voters through his political genius, natural empathy, and his own biography in ways that have proven difficult for President Obama.

    By all accounts, the inroads made among the group by Clinton, and, thanks to the economic crisis, Barack Obama in 2008, have largely dissipated now. Polling data suggests that these groups are now among the strongest backers of that eminent and hard-to-like patrician, Mitt Romney. 

    Recent Gallup polls show Obama’s strongest support, in terms of professions, coming from “professionals,” such as teachers, lawyers, and educators. He does worst among both small businesspeople and those who work in industries such as energy, manufacturing, transportation and construction, where Democrats from Roosevelt to Clinton often won significant support.

    The division between the new political culture and the older one can be seen in a host of issues, most notably policies that favor urban density over suburbs, and strict environmental policies that hurt basic industries. An agenda aimed at ending “sprawl,” cars, and carbon-generating industries appeals generally to the unmarried and childless, who don’t have to worry overmuch about the need for extra space, backyards, or mundane tasks like taking kids to school, or to Target.  

    Ironically, the other key component of the new political culture comes from the other end of the social order: generally poorer, urban-centered minority populations. For all the hype about gentrification of cities, over the past decade the poor accounted for about 80% of population growth in the urban cores of the nation’s 51 largest metropolitan areas. In suburban areas, by contrast, the poor accounted for just 32 percent of population growth.

    Ironically, these poor minorities continue to back the new political culture even though it favors policies, such as expensive “green energy” and tight regulations, that essentially force all but the highest value-added businesses from the urban core, leaving what Mayor Michael Bloomberg famously defined as “the luxury city.” As manufacturers and many service businesses leave either for the suburbs or less expensive regions, the historical working and middle class has also exited, leaving behind a largely entrenched poverty population, a post-materialist upper class, and little in-between.

    Focused on the “upstairs” part of the new political culture, the administration—confident in minority support—has done very little materially to improve the long-term prospects of those “downstairs.” Minorities, in fact, have done far worse under this administration than virtually any in recent history, including that of the hapless George W. Bush. In 2012, African-American unemployment stands at the highest level in decades; 12 percent of the nation’s population, blacks account for 21 percent of the nation’s jobless. The picture is particularly dire Los Angeles and Las Vegas, where black unemployment is nearly 20%, and Detroit, where’s it’s over 25 percent. 

    Latinos, the other major part of the Party’s “downstairs” coalition, have also fared badly under Obama. This is true even among the aspiring working- and middle-class. Overall, the gap in net worth of minority households compared to whites is greater today than in 2005. White households lost 16% in recent years, but African-Americans dropped 53% and Latinos a staggering 66% of their pre-crash wealth. 

    So how does the Democratic Party, in Chicago and elsewhere, maintain its support among these groups? Needlessly exclusionary Republican policies play a role, scaring off potential minority voters, particularly immigrants and their offspring. Obama also has used his own biography to appeal personally to these groups, most understandably African-Americans, as a way to divert them from his economic shortcomings. And well-timed election-year conversions on key social issues like gay marriage and amnesty for young undocumented immigrants have helped him outmaneuver the hopelessly clueless GOP.

    The fact that there are few decent middle-income jobs—in fact the jobs that have appeared during the recovery have been vastly worse than those lost during the meltdown—for the newly legalized or anyone else seems, at the moment at least, somewhat besides the point.

    Indeed  “besides the point” may be the real Democratic slogan for this year. The Democrats in Charlotte need to argue that results—fewer jobs and far fewer middle-income jobs—matter less than the blessings of green politics, urbanism, and racial-identity politics. In today’s  Democratic party, having  the “correct”  sentiments often seem to outweigh even the fundamentals of broad-based economic success.

    One can only wonder what Harry Truman would think of Obama’s approach, or perhaps even Bill Clinton in his private moments.

    Joel Kotkin is executive editor of NewGeography.com and is a distinguished presidential fellow in urban futures at Chapman University, and contributing editor to the City Journal in New York. He is author of The City: A Global History. His newest book is The Next Hundred Million: America in 2050, released in February, 2010.

    This piece originally appeared in The Daily Beast.

    Bill Clinton photo by Bigstock.