Category: Demographics

  • Livable China

    Recently, the McKinsey Global Institute published its report ‘The Most Dynamic Cities in 2025‘ in Foreign Policy, a highly respected US journal. On this list, 27 mainland Chinese cities as well as Hong Kong took top spots alongside Shanghai and Beijing, leaving many other world-renowned metropolises far behind.

    As a Chinese who has lived through China’s transformation over the past two decades, I was hardly surprised by the results of this report. What really shocked me was the doubt and controversy that this report generated in western media, especially the negativity in the heated discussions published in the very same issue of Foreign Policy.

    Among these, I was most taken aback by Mr. Isaac Stone Fish’s article ‘Unlivable Cities’. Having lived in several different Chinese cities over a 7-year period, Mr. Fish should be able to provide an objective prospective about China. Unfortunately, the takeaway from his article, in his own words is: ‘For all their economic success, China’s cities, with their lack of civil society, apocalyptic air pollution, snarling traffic, and suffocating state bureaucracy, are still terrible places to live.’

    First of all, when it comes to civilization, there are very few countries where civil society can be traced back 5000 years like China. Today’s China may be in some aspects less civilized compared with the more developed countries, but China has come a long way in creating a more civilized society in recent years. When the People’s Republic of China was founded in 1949, the illiteracy rate was more than 80% in China, but as of today, the illiteracy rate among Chinese born after 1980 is under 1%. In cities, 80% of students go on to post-secondary studies. These highly educated young Chinese will undoubtedly redefine China’s civilization. When it comes to parenting, the 80s generation, now mostly young parents, are studying how to be a parent, which would have been unheard of just a decade ago.

    The new Chinese parents are teaching their kids to use polite expressions like ‘thank-you’ and ‘sorry’, something generally neglected in the past. Pioneer cities like Shanghai and Guangzhou opened ‘Manner and Etiquette’ classes in most of their primary and high schools starting in 2006. Our education system is changing as well, gradually switching from being purely exam-oriented, to cultivating students with all around abilities. Our future generations will continue to bring China into a new era of civil society. It is ironic for Mr. Fish to call China ‘unlivable’ by describing China as having ‘lack of civil society’, yet in his own narration later he wrote: ‘Chinese cities have little crime, one can stroll safely through Beijing’s magnificent Temple of the Sun park at midnight’. How many of today’s ‘livable’ and ‘civilized’ North American cities can claim that?

    Air pollution is an issue in China, but no different than the smog that hung in the sky in Pittsburgh, London, or Los Angeles when those cities were going through their own vast development phases.   China is generating the greatest total greenhouse gas emissions in the world, but its greenhouse gas emission per capita in 2008 only ranks 78th of 214 countries in the world, while Australia ranks 11th, followed by USA (12th) and Canada (15th). China is manufacturing for the whole world, so in a sense it’s a scapegoat for countries that don’t want to or cannot make things for themselves. Yet even with that, air pollution in China never reaches the level described in Mr. Fish’s article. Take Nanjing (300 km northwest of Shanghai) as an example: in the one week Mr. Fish spent there, the only thing he saw was ‘smog the color of gargled milk’.

    Having lived in Nanjing for almost 10 years, I do not find Nanjing’s air quality unbearable. On the contrary, I love wondering on the streets of this ancient yet modern city, breathing the fresh air and enjoying the sweet scent given off by the Wutong Shu (Phoenix trees) erected on both sides of the streets. Every morning, citizens go outside to exercise in the mountains and parks. At night time, people take walks outside after dinner. Never would I suggest that Nanjing is an ‘unlivable’ city.


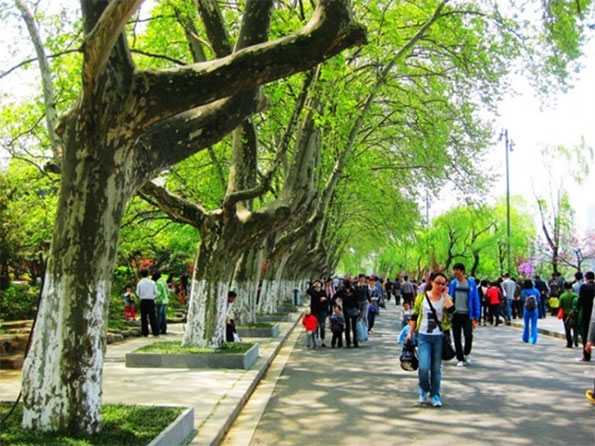
    Phoenix Trees in Nanjing

    In 2011, 14.5 million cars were sold in China. It has overtaken America as the largest automobile market. This has and will continue to cause significant traffic congestion, a worldwide issue most metropolises face today. However, China is very proactively providing solutions to this problem. In Beijing, Shanghai and Guangzhou, the local municipality limits the licenses plates issued every year in an attempt to relieve the burden caused by new traffic. Of course, China knows better than anybody that nothing will stop its citizens’ desire for car ownership as they get richer, so the only way to prevent future traffic problems is to invest in more quality highways, cleaner cars and better public transit systems.

    With China now spending approximately half a trillion dollars annually on infrastructure (9 percent of its GDP), visitors should not be surprised to see numerous highways and subways under construction in most Chinese cities. In 2010, Shanghai had the world’s most extensive subway system (429 km), followed by London (402 km) and then Beijing (372 km). By 2020, the total length of Shanghai’s subway lines will reach 877 km, more than double of New York’s current total length of subway lines. Meanwhile, China provides large subsidies to the taxi and bus industries. On top of that, with the world’s longest rail network, China’s high-speed rail system is changing the way people travel between Chinese cities. The newest bullet train from Beijing to Shanghai can bring passengers to their destination in less than five hours, while flying over the terrain at a maximum speed slightly over 300 km per hour.

    Bureaucracy has been rife in China literally for millennia, and the onset of a market economy has not changed that sad fact. Much of the criticism of China relates to censorship. Yet this is less an issue for most Chinese than for either westerners and some Chinese intellectuals. With the fast development of information science and the enormous variety of media available, people can freely choose what movie, play or art show they wish to watch, discuss anything they are interested in with their families and friends, and most importantly live the life styles they want. The ‘pervasive fear of censorship’ described by Mr. Fish literally does not exist for today’s average Chinese citizen.

    Mr. Fish also gave specific examples of ‘unlivable’ cities in China. Among them, Harbin, the capital city of Heilongjiang province, was voted the least livable metropolis mainly due to its cold winter. Personally, during my own time there, I was fascinated by Harbin’s characteristic Russian architecture, the massive and astonishingly beautiful ice sculptures, and the fun winter activities that were available. All these temperaments make Harbin an extraordinary city. I am currently studying in Canada, a country justly famous for freezing winters. Constantly hearing Canadians complain about their ‘unbearably cold’ winters makes me realize that if winter temperature is a key criteria to judge whether a city is livable or not, Winnipeg, Manitoba would probably be crowned the most unlivable city in the Western hemisphere. I can only imagine what Mr. Fish would have to say about cities like Oslo, Helsinki, Copenhagen, or Minneapolis.

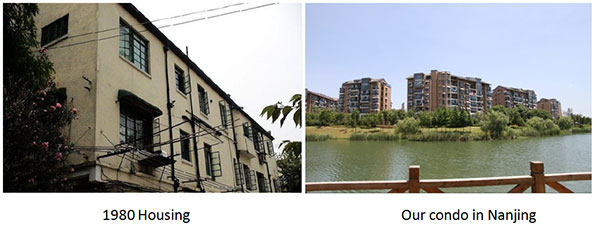
    China clearly is no paradise, yet the world should recognize how significantly the quality of life has improved over the stereotypes of the past. Growing up in 40 square meter (430 square feet) ‘Dormitory Style Housing’ (as Mr. Fish put it), with my parents and grandparents, I remember vividly how our neighbors nearly burst through our door to see our newly purchased color TV, the first they had ever seen. My happiest moment was licking a popsicle to its last frozen drop in the summer heat. Considering my parents’ combined monthly salary about 20 USD in the 1980s, this popsicle was quite a treat. Two decades later, in the same summer heat, my husband and I moved into a brand new three-bedroom condo in Nanjing, fully equipped with the most modern electronic appliances. Our condo is surrounded by a beautiful pond, a gymnasium, a supermarket and a nearby subway station. We make 3400 USD a month, eat out often and travel every year. This is not atypical for most middle-class Chinese people now. The welfare system is improving, people are less worried about getting sick, a retirement fund is in place, people now travel not only domestically but also internationally, and many send their children abroad to receive higher education. Where we are now would have been unthinkable to most people only a few decades ago.

    I’m often deeply saddened by the way in which China is so often portrayed in western media. China’s growth and development over the past few decades has been vast, and it possesses potential for a more affluent future. Westerners may refer to China as ‘unlivable’ but for me, and hundreds of millions of people like me, China today is more than simply livable, and it will continue to improve as time goes by.

    Lisa Gu is a 28 year old Chinese national who lived in Nanjing, China. She is currently studying at Wilfrid Laurier University in Waterloo, ON, Canada.

    Photo by Wikicommons user shakiestone.

  • The Unseen Class War That Could Decide The Presidential Election

    Much is said about class warfare in contemporary America, and there’s justifiable anger at the impoverishment of much of the middle and working classes. The Pew Research Center recently dubbed the 2000s a “lost decade” for middle-income earners — some 85% of Americans in that category feel it’s now more difficult to maintain their standard of living than at the beginning of the millennium, according to a Pew survey.

    Blaming a disliked minority — rich business folks — has morphed into a predictable strategy for President Obama’s Democrats, stripped of incumbent success. But all the talk of “one percent” versus “the ninety nine percent” misses new splits developing within both the upper and middle classes.

    There is no true solidarity among the rich since no one is yet threatening their status. The “one percent” are splitting their bets. In 2008 President Obama received more Wall Street money than any candidate in history, and he still relies on Wall Street bundlers for his sustenance. For all his class rhetoric, miscreant Wall Streeters, particularly big ones, have evaded big sanctions and the ignominy of jail time.

    Obama enjoys great support from the financial interests that benefit from government debt and expansive public largesse. Well-connected people like Obama’s financial tsar on the GM bailout, Steven Rattner, who is also known as a vigorous defender of “too big to fail.”

    The “patrician left” — a term that might have amused Marx — extends as well to Silicon Valley, where venture capitalists and techies have opened their wallets wider than ever before for the president. Microsoft and Google are two of Obama’s top three organizational sources of campaign contributions. Valley financiers are not always as selfless as they or their admirers imagine: Many have sought to feed at the Energy Department’s bounteous “green” energy trough and all face regulatory reviews by federal agencies.

    The Republicans have turned increasingly to those patricians who depend on the more tangible economy. If you make your living from digging coal or exploring for oil wells, even if you don’t like him, Romney is you man. This saddles the GOP with the burden of being linked to one of America’s most hated interests: oil and gas companies. Almost as detested is the biggest source of Romney cash, large Wall Street banks. (In contrast, Democratic-leaning industries, such as Internet-related companies, enjoy relatively high public support.)

    With the patriarchate divided, the real action in the emerging class war is taking place further down the economic food chain. This inconvenient reality is largely ignored by the left, which finds the idea of anyone this side of Bain Capital supporting Romney as little more than “false consciousness.”

    Obama’s core middle-class support, and that of his party, comes from what might be best described as “the clerisy,” a 21st century version of France’s pre-revolution First Estate. This includes an ever-expanding class of minders — lawyers, teachers, university professors, the media and, most particularly, the relatively well paid legions of public sector workers — who inhabit Washington, academia, large non-profits and government centers across the country.

    This largely well-heeled “middle class” still adores the president, and party theoreticians see it as the Democratic Party’s new base. Gallup surveys reveal Obama does best among “professionals” such as teachers, lawyers and educators. After retirees, educators and lawyers are the two biggest sources of campaign contributions for Obama by occupation. Obama’s largest source of funds among individual organizations is the University of California, Harvard is fifth and its wannabe cousin Stanford ranks ninth.

    Like teachers, much of academia and the legal bar like expanding government since the tax spigot flows in the right direction: that is, into their mouths. Like the old clerical classes, who relied on tithes and the collection bowl, many in today’s clerisy lives somewhat high on the hog; nearly one in five federal workers earn over $100,000.

    Essentially, the clerisy has become a new, mass privileged class who live a safer, more secure life compared to those trapped in the harsher, less cosseted private economy. As California Polytechnic economist Michael Marlow points out, public sector workers enjoy greater job stability, and salary and benefits as much as 21% higher than of private sector employees doing similar work.

    On this year’s Labor Day, this is the new face of unionism. The percentage of private-sector workers in unions has dropped from 24% in 1973 to barely 7% today and in 2010, for the first time, the public sector accounted for an absolute majority of union members. “Labor” increasingly means not guys with overalls and lunch pails, but people whose paychecks are signed by taxpayers.

    The GOP, for its part, now relies on another part of the middle class, what I would call the yeomanry. In many ways they represent the contemporary version of Jeffersonian farmers or the beneficiaries of President Lincoln’s Homestead Act. They are primarily small property owners who lack the girth and connections of the clerisy but resist joining the government-dependent poor. Particularly critical are small business owners, who Gallup identifies as “the least approving” of Obama among all the major occupation groups. Barely one in three likes the present administration.

    The yeomanry diverge from the clerisy in other ways. They tend to live in the suburbs, a geography much detested by many leaders of the clerisy and, likely, the president himself. Yeomen families tend to be concentrated in those parts of the country that have more children and are more apt to seek solutions to social problems through private efforts. Philanthropy, church work and voluntarism — what you might call, appropriately enough, the Utah approach, after the state that leads in philanthropy.

    The nature of their work also differentiates the clerisy from the yeomanry. The clerisy labors largely in offices and has no contact with actual production. Many yeomen, particularly in business services, depend on industry for their livelihoods either directly or indirectly. The clerisy’s stultifying, and often job-toxic regulations and “green” agenda may be one reason why people engaged in farming, fishing, forestry, transportation, manufacturing and construction overwhelmingly disapprove of the president’s policies, according to Gallup.

    Obama supporters sometimes trace the loss of largely white working-class support — even to the somewhat less than simpatico patrician Romney — to “false consciousness.”  A recent Daily Kos article, charmingly entitled “The Masses are Asses,” chose to wave the old bloody shirt of racism, arguing that whites “are the single largest, and most protected racial group in this country’s history.”

    Ultimately this division — clerisy and their clients versus yeomanry — will decide the election. The patricians and the unions will finance this battle on both sides, spreading a predictable thread of half-truths and outright lies. The Democrats enjoy a tactical advantage. All President Obama needs is to gain a rough split among the vast group making around or above the national median income. He can count on overwhelming backing by the largely government dependent poor as well as most ethnic minorities, even the most entrepreneurial and successful.

    Romney’s imperative will be to rouse the yeomanry by suggesting the clerisy, both by their sheer costliness and increasingly intrusive agenda, are crippling their family’s prospects for a better life. In these times of weak economic growth and growing income disparity, the Republicans delude themselves by claiming to ignore class warfare. They need to learn how instead to make it politically profitable for themselves.

    Joel Kotkin is executive editor of NewGeography.com and is a distinguished presidential fellow in urban futures at Chapman University, and contributing editor to the City Journal in New York. He is author of The City: A Global History. His newest book is The Next Hundred Million: America in 2050, released in February, 2010.

    This piece originally appeared in Forbes.

    Mitt Romney image from Bigstock.

  • Evolving Urban Form: São Paulo

    São Paulo is Brazil’s largest urban area and ranks among the top 10 most populous in the world. Between 1950 and 1975, São Paulo was also among the globe’s fastest growing urban areas. For two decades starting in 1980 São Paulo ranked fourth in population among the world’s urban areas, but has been displaced by much faster growing urban areas like Manila and Delhi.

    São Paulo became Brazil’s largest urban area, displacing Rio de Janeiro, in the middle 1960s. There has been no looking back. By 2025, the United Nations forecasts that São Paulo will have 10 million more people than Rio (Figure 1).

    São Paulo is the capital of Brazil’s largest state, also called São Paulo. The 2010 census counted more than 41 million people in the state, more than live in California. The state of São Paulo is substantially more densely populated than California, occupying only two thirds of the land area (approximately the size of Oregon).

    There are other large urban areas in the vicinity of São Paulo. Campinas, an urban area of 2.5 million people, is located 60 miles (100 kilometers) north and San Jose dos Campos, an urban area of 600,000 is located 60 miles (100 kilometers) to the west.

    A 20th Century City

    Like many developing world megacities, São Paulo is a creation of the 20th century. In 1900, the population was 240,000. By 1950, the population had reached two million and now is approximately 20,200,000.

    São Paulo is located on a small plateau, over the mountains from the Atlantic Ocean 2500 feet (750 meters) above sea level, approximately the same elevation as Madrid. São Paulo is the world’s second largest urban area not located on an ocean or sea coast (Delhi is the largest).

    São Paulo is located 50 miles (80 kilometers) from the seaport of Santos, which is an urban area of 1.7 million. Santos is reached by one of the world’s most spectacular freeways, the Rodovia dos Imigrantes, which winds down the mountainside, with the southbound lanes crossing over the northbound lanes like the Interstate 5 Grapevine north of   Los Angeles, the grade down from Puebla (Mexico) to the city of Orizaba on Autopista 150D and a section of the N205 approaching Chamonix-Mont-Blanc in France.

    São Paulo’s Urban Expanse

    São Paulo is a comparatively dense urban area, at 16,500 persons per square mile, or 6400 per square kilometer. This makes São Paulo somewhat less than double the density of Paris, but still one quarter the density of Hong Kong or Mumbai and one seventh the density of Dhaka. The urban area covers 1,225 square miles (3,175 square kilometers), similar in size to the Miami and Washington DC urban areas.

    São Paulo is hardly a "compact city." The urban area stretches nearly 60 miles/100 kilometers east to west and more than 30 miles/50 kilometers north to south. The core city covers nearly as much area as the core city of Houston.

    Recent Growth and Suburbanization

    The central city (municipio) of São Paulo continues to grow. In the last 10 years, São Paulo  has grown from 10.4 million to 11.2 million. A majority of the urban area population, 57 percent, continue to live in the central city. However there is much stronger growth in the suburbs, reflecting the trends in nearly all other major urban areas of the world. Since 1950, São Paulo’s suburbs have experienced an explosive   growth, rising from under 200,000 residents to 8.4 million. This exceeds the core city’s growth over the same period of 7.46 million (Figure 2).

    In the last 10 years, suburban São Paulo has grown from 6.7 million to 8.4 million people, capturing   more than two thirds of the population growth. Since 1950, when the suburbs had approximately 5 percent of the population, they have increased their share in every census. However, if the strong growth of the city and the suburbs continues at the rates of the last 10 years, it could be 30 years before a majority of the population lives in the suburbs.

    Deficient Transport

    Like most nations, Brazil has a freeway or motorway system. There is a freeway between São Paulo and Rio de Janeiro and a freeway from São Paulo to the nation’s third largest urban area, Belo Horizonte. These and other freeways emerge from the urban periphery, without traversing the core.

    Yet, there is no way for trucks to traverse the São Paulo urban area from East to West without getting tied up in São Paulo’s monumental central area traffic. Nor is there a freeway for port traffic to cross the urban area south to north toward Campinas. Thus, truck traffic from the affluent urban areas of the South, such as Curitiba and Porto Alegre and the port at Santos is forced on to the Avenida Marginal Tiete and Avenida Marginal Pinheiros, forging an overused route adjacent to the urban core on both the west and north sides. East-west and north-south commercial traffic is combined on this roadway.

    However, São Paulo is building a long overdue ring road, the Mario Covas Beltway. Less than one half of this route is now in operation and the whole circle will not be completed until 2015.

    São Paulo is also on the trouble fraught high speed rail route proposed to run from Rio de Janeiro to Campinas. The route was roundly criticized by The Economist, which noted the low-balled costs, the astronomical ridership projections and the likelihood that Brazilian taxpayers would have to foot quite a bill to make it happen. This line was covered in more detail in Private Investors Shun Brazil High Speed Rail and High Speed Rail in Brazil: The Need for Guarantees.

    From Monocentricity to Polycentricity

    A number of other megacities in the developing world have added new commercial cores, becoming more polycentric, as the old central business district becomes comparatively less important. This is evident in Istanbul, Mexico City and Manila. In recent decades, most of the core-type commercial development has occurred along Avenida Paulista (two miles/three kilometers west of Centro) and then later, Luis Berrini (another 6 miles/10 kilometers further to the southwest).

    The Shantytowns

    As drivers travel on the Avenidas Marginal and the Mario Covas Beltway, they pass many shantytowns (favelas) close to the roadways. This can be a shocking site for North American rental car tourists. In more recent decades, favelas have developed not only on the urban fringe, but adjacent to affluent areas in the core (Photo). There are also corticos, which tend to be old subdivided houses and more centrally located. Both of these are increasingly interspersed through the urban area. A mid 1990s estimate placed the number of people living in this sub-standard housing at one quarter of the people in the central city of São Paulo.

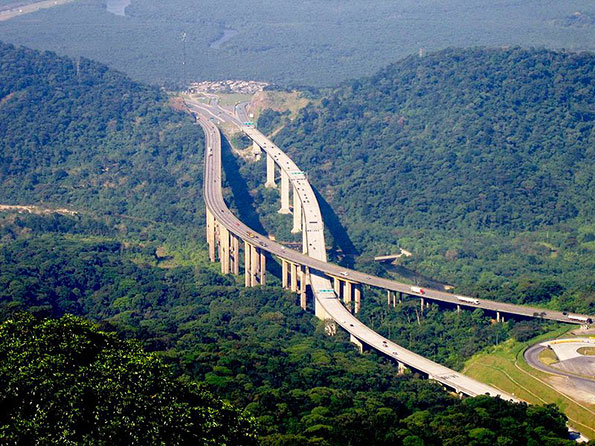
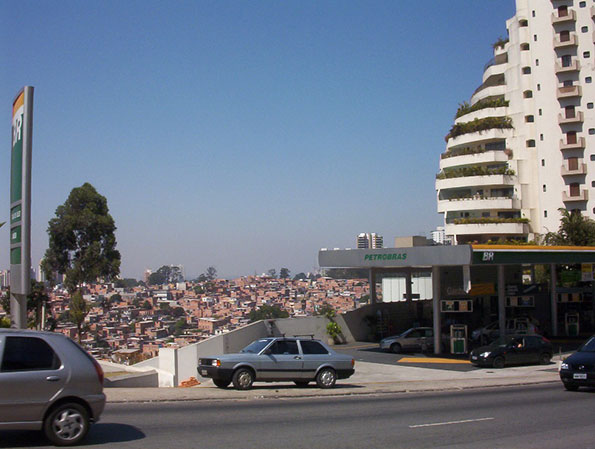
    Favela and Affluence, core city of São Paulo

    City of Hope

    The origins of this movement to Sao Paulo are clear. People moved from the poor countryside, often from the sugar plantations of the Northeast. As bad as life may look to affluent northerners, things are much better here than back in the countryside. Otherwise they would go home, which occurs with no material frequency. São Paulo, like all big metropolitan areas, is a city of hope.


    Wendell Cox is a Visiting Professor, Conservatoire National des Arts et Metiers, Paris and the author of “War on the Dream: How Anti-Sprawl Policy Threatens the Quality of Life.”

    Lead Photo: Paulista Avenue (by author)

  • Utah Up, Chicago Down: Why Mitt Romney Should Embrace His Mormonism

    In his run for the Republican nomination, Mitt Romney downplayed his Mormonism—referring only to “faith” or “shared values”—in the face of small-minded members of the Christian right and the occasional cackle from the Eastern cultural avant-garde. But with his party’s nod in hand, Romney has been “coming out” in the run-up to the Republican convention, letting pool reporters join him and his family at a church service, and even choosing a member of the church to deliver the invocation on the night he addresses the Republican convention.

    The church’s appeal can be seen, in part, in the contrast between booming Utah and Salt Lake City and President Obama’s adopted home state of Illinois and hometown of Chicago.

    Utah netted 150,000 new arrivals from other states in the last decade, while Illinois lost a net of 70,000 people each year to other states. And Utah’s new arrivals include more than Mormons returning to Zion; Salt Lake County is now only 54% Mormon. Twenty-six percent of the county’s residents are minorities, mostly Hispanic immigrants.

    Romney himself reflects the enormous changes in the fast-growing and highly successful Church of Jesus Christ of Latter-day Saints (LDS), the official name of the religion, since the church (which continues to have an all-male clergy), opened itself to black members in 1978. Mormons now enjoy levels of education and wealth well above those of the average American.  Some 53.5% of LDS males have a post–high-school education, compared to 36.5% of the total U.S. population. And 44.3% of LDS females have a post-high-school education, compared to a national average of 27.7%. More impressive still, unlike mainstream churches, Mormonism is thriving; the church membership in North America grew 45 percent over the past decade to more than 6 million members—roughly matching the number of American Jews

    This is not Romney’s father’s—and certainly not his grandfather’s—LDS.

    A recent Gallup survey ranked Utah first in terms of quality of life, in part because of its citizens’ “low smoking habits, ease of finding clean and safe water, having supervisors who treat workers like a partner rather than a boss, learning something new or interesting on any given day, and perceptions that your city or area are ‘getting better’ rather than ‘getting worse.’”

    While Illinois competes with California for the nation’s worst credit ranking, Utah stands at the AAA apex. The job-growth rate in Salt Lake City and the state rank near the top while Chicago and Illinois have sunk relentlessly toward the bottom. Forbes recently ranked Utah “the best state for business and careers” for the second straight year; Illinois ranked 41st.

    While Utah undoubtably owes some of its success to its low-tax, low-regulation culture, and to smart incentives to draw in businesses, it’s also benefitted from a Mormon culture that promotes not supply-side but investment-driven growth.

    From its origins in the great Mormon migration in the late 1840s, the state and the church have built a legacy of careful planning. Brigham Young was many things, control freak and city planner among them, laying out the streets of the towns with exacting detail. The Mormons, wrote Wallace Stegner, a “gentile” who lived among them, “were the most systematic, organized, disciplined, and successful pioneers in our history.”

    Today this legacy is evident in the excellent infrastructure the state is building, including new highways that shame the pot-holed roads that people on the coasts commonly endure. Utahans have invested mightily in their universities, public and private, and are positioning themselves to be major players in fields from energy and agriculture to composite manufacturing, science, and engineering. They are not merely waiting around to ransack the intellectual capital of other states; for the last two years the University of Utah has ranked No. 1 in forging startups, besting institutions like MIT and Columbia.

    It is a bit distressing for a Californian to ride down Highway 15 south from Salt Lake City towards Provo and see buildings, often just finished, from some of Silicon Valley’s signature companies including Intel, Adobe, Twitter, eBay, and Fairchild Semiconductor. These are jobs that used to stay in California, but for a host of reasons—regulation and housing prices chief among them—have moved east to Utah.

    And most of the former Californians I’ve met in Salt Lake like the place, even if they sometimes feel uncomfortable with the Mormon aversion to such habit as drinking. Over the past 30 years, the city has changed for the better. Good food now proliferates—even if the elegantly dressed young Mormons still don’t order wine, much less vodka. The local arts and culture scene has evolved to, if not world-class levels, at least those seen in other similarly-sized cities.

    But what’s most impressive about Utahans may be their devotion to family. Although they make much noise about their dedication to “working families,” the Democratic Party increasingly relies on singles and the childless as its core base, particularly among white voters. In contrast, GOP-dominated Utah (which is largely white, but increasingly diverse) has the highest birth rate and youngest population in the nation. Families thrive there, including those who are not Mormon. It is almost like another America—one where most people raise their children, and push education and enterprise. If you’re getting deep into your 50s like me, you might remember that country.

    True, Salt Lake City now has some high-rise residential areas and some local planners, largely from the University of Utah, who push “smart growth.” But the big growth along the Highway 15 corridor is mostly single-family home communities, affordable and large enough to accommodate several offspring. They seem a lot like the places Long Island and the San Fernando Valley once were.

    Like the church around which it is built, the Mormon Zion in Salt Lake Valley has also changed. It has what may be the largest concentration of multilingual people in the country. With 55,000 missionaries at 340 mission sites across the globe, native English-speaking Mormons have learned more than 50 languages. Former Utah governor and Romney rival Jon Huntsman gained respectability—even among sophistos—for his fluent Mandarin.

    On the business side, Mormons’ linguistic skills have attracted loads of big international companies, such as Goldman Sachs, who need people capable of conversing in Lithuanian, Chinese, or Tongese. Goldman has 1,400 employees in Salt Lake City, making it the investment bank’s sixth largest location in the world.

    In contrast to the antediluvian nonsense sometimes expressed by right-wing evangelical Christians, the LDSers have become more cosmopolitan as their faith has expanded. Once a peculiarly American creed, with the vast majority of its faithful living in the Western United States, Mormonism has morphed into a global religion with over 11 million members—more than half of them outside the United States. Once narrowly white, the church’s biggest growth now is in Brazil, the Philippines, and the Pacific Islands. Even in the U.S., converts have made for an increasingly diverse church, with blacks and Hispanics accounting for one in five new Mormons, according to Pew.

    It’s not likely that the church will be portrayed by the Obama campaign and its associated media outlets in this way. They also are sure to continue portraying millionaire Mitt as the greedy capitalist devil incarnate. Perhaps to avoid getting drawn into a discussion of his faith, Romney rarely mentions that he tithes 10 percent of his substantial income to support church activities. Such tithing, expected of all church members, helps explain why Utahans are easily the nation’s most charitable citizens, according to The Chronicle of Philanthropy—contributing two and a half times more of their income than Illinoisans.

    Yet most appealing about Mormons is their focus on self-help and community outreach, and the church’s highly structured and efficient relief organization—something Romney has never communicated well. Mormons are remarkable for their ability to rise to the occasion during natural disasters like Hurricane Katrina and the earthquake in Haiti.

    “Mitt may not be Bill Clinton or Barack Obama—he’s a boring guy, but he’s not the jerk people think he is,” says Joe Cannon, the former publisher of the Deseret News, the church-owned paper. “When you are a bishop,” as Romney was in Boston, says Cannon, “you are running a huge welfare state on your own. You spend a lot of time helping the poorest and most dysfunctional congregants.”

    In the end, Utah’s Mormon-created reality is bigger than one relentlessly ambitious man’s foibles and tax dodges; Mormonism is the enterprise that transformed a desert province into a productive garden. That’s the story that Romney needs to share between now and November. If he fails, we might see a more appealing Mormon, Jon Hunstman, remind us of this success story in 2016.

    Joel Kotkin is executive editor of NewGeography.com and is a distinguished presidential fellow in urban futures at Chapman University, and contributing editor to the City Journal in New York. He is author of The City: A Global History. His newest book is The Next Hundred Million: America in 2050, released in February, 2010.

    This piece originally appeared in The Daily Beast..

    Mitt Romney photo by BigStockPhoto.com.

  • America’s Baby Bust: How The Great Recession Has Jeopardized Our Demographic Health

    At the turn of the century, America’s biggest advantage was its relatively vibrant demographics. In sharp contrast with its major competitors — the E.U., Russia, China, Japan — the United States had maintained a far higher birthrate and rate of population growth.

    But the 2010 Census showed that in the past decade America’s birthrate slipped below at least one European country (France) and under the pace necessary to replace our current population. Immigration, both legal and illegal, is also slowing, in part due to plunging birthrates in Mexico and other Latin American countries. As one National Geographic report from Brazil has it, women there, too, are saying: “A fábrica está fechada.” The factory is closed.

    America’s sinking birthrate is in great part a function of our wobbly economy. The decline, notes the Pew Research Center, largely coincides with the onset of the 2007 real estate crash and the financial crisis the following year.

    The recession had a disproportionate impact on people of child-bearing age, who suffered higher unemployment and steeper income declines than their elders. In the process, the U.S. fertility rate dropped from over 2.1 births per woman in 2007 to 1.9 last year, below replacement rate for the first time since the mid-1980s. The 2010 Census found that the number of households that have children under age 18 was 38 million, unchanged from 2000, despite a 9.7% growth in the U.S. population over that period.

    Of course many environmentalists would celebrate these numbers, and some nativists as well. But the problem is not that we need more people per se — we need an increase in younger, working-age people to make up for our soon to be soaring population of retirees. Young people are the raw capital of the information age and innovation, and new families are its ballast and growth market.

    Yet many developed countries are facing dramatic labor force deficits. By 2050, according to Census projections, there will be 40% fewer workers in Japan then there were in 2000, 25% less in Europe and 10% fewer in China; only projections of higher birthrates and immigration allowed demographers to suggest the U.S. workforce would keep growing.

    Without these future workers our already tottering pension system will become even more untenable, as is occurring in Europe and Japan. The bad part about slow population growth is that it depresses the economy, which in turn works against family formation.

    Of course, there are others ways to deal with this imbalance of too many retirees and too few workers. One is to raise taxes. The billionaire philanthropist Pete Peterson estimates that most developed countries will need to increase their spending on old age benefit promises from 9% to 16% of GDP over the next 30 years. This would require an increase in taxes of 25% to 40% — even in the already high-tax countries of northern Europe.

    Raising taxes to transfer funds to the older generation is already happening in some of the most rapidly aging countries. Japanese lawmakers just voted to double the country’s sales tax by 2015 precisely for this reason. Due in large part to low birthrates and soaring numbers of seniors, Japan is now the most heavily indebted high-income country in the world.

    Germany likewise is now considering a special tax on younger workers to fund the pensions of the growing ranks of oldsters. Chancellor Angela Merkel has proposed the 1% income tax as a “demographic reserve” for a workforce that is expected to shrink by 7 million by 2023. “We have to consider the time after 2030, when the baby boomers of the ‘50s and ‘60s are retired and costing us more in health and care costs,” explained Gunter Krings, who drafted the new proposal for Germany’s ruling Christian Democrats.

    Higher taxes, or its evil twin, austerity, are unlikely to solve this dilemma. Other issues may constrain family growth — high urban population densities, women’s growing role in the workforce, declining religiosity — but one critical precondition for spurring family growth is to expand the economy. Without growth, the long-term decline of most high-income countries, including the United States, is all but assured.

    This turns on its head the commonplace assumption that societies reduced their birthrates as they got wealthier. This pattern was seen in the United States and Europe by the 1960s and, even more so in East Asia, whether governments adopted baby-suppressing (notably China) methods or, more recently, as in Singapore, have tried to promote family formation.

    But more recently it appears that declining economics — and strong public perceptions that things will get worse — can also convince people not to have children. In 2010, according to Gallup, most European countries have been expecting harder times; pessimism was particularly strong in Spain, Italy, Greece, the Czech Republic and the United Kingdom. Stories about divorced Spanish or Italian young fathers sleeping on the streets or in their cars is not exactly a strong advertising for parenthood.

    In 2011, birthrates fell in 11 of the 15 European countries that have reported numbers. Among the countries reporting declines were Finland and Denmark, where rates had been ticking slightly upwards.

    The impact has been even greater in countries like Spain and Greece, where overall joblessness has hit one in four and youth unemployment is roughly 50%. Some of these countries face the prospect of considerable de-population in the coming decades.

    “A more pessimistic economic outlook” is one key reason that European birth rates have been depressed and family formation so slow, confirms Austrian demographer Wolfgang Lutz. Overall fertility has fallen to roughly 1.5, well below replacement rate and all but guaranteeing a demographic-based economic crisis a decade or two sooner. Some eastern countries like Latvia now have fertility rates approaching 1.2. Lutz believes that once birthrates fall to these levels, there is no turning back.

    Yet it is Japan that perhaps shows this renewed relationship between economics and birthrates most clearly. In 1991 many economists predicted that Japan would overtake the U.S. economy; instead U.S. GDP grew much faster and China supplanted Japan in 2010 as the world’s second-largest economy. As prices deflated and opportunities shriveled, Japanese grew less interested in either starting or growing families.

    It could get even worse: Japanese teens seem not only less interested in work but in each other. In what seems an enormous reversal of adolescent nature, 36% of Japanese males 16 to 19 years old have admitted to pollsters having no interest in sex, and some even despise it. The figure is even higher (59%) for females in the same age category. For many, notes Japanese sociologist Mika Toyota, hobbies, vacations, food and computer games are often more alluring than pursuing the opposite — or the same — sex.

    It may well be that American birthrates have been more impacted than Europe’s by the recent recession due to the relative weakness of the country’s social safety net. Finnish demographer Anna Rotkirch has pointed out that Europeans have tried to mitigate the impact of recession through generous transfer payments to young families. This may account as well for the fact that France’s birthrate last year surpassed that of the United States.

    But without strong economic growth, it seems likely that family formation and birthrates will continue downward everywhere, particularly as economic realities force reductions in state aid. A mindlessly ever-expanding welfare state, trying to enlist more clients, even tiny ones, will diminish private sector growth and usher in even more quickly the onset of “demographic winter.” A lethal demographic cocktail of high taxes, low growth and fewer babies could set the stage for an even greater financial crisis in the decades ahead.

    Joel Kotkin is executive editor of NewGeography.com and is a distinguished presidential fellow in urban futures at Chapman University, and contributing editor to the City Journal in New York. He is author of The City: A Global History. His newest book is The Next Hundred Million: America in 2050, released in February, 2010.

    This piece originally appeared in Forbes.

    Childhood kids photo by BigStockPhoto.com.

  • Cities of Aspiration

    Drew Klacik’s recent post on how he ended up in Indianapolis got me thinking about the unique status of what I’d describe as “cities of aspiration.” Pretty much all cities seem to be reasonably good at attracting people in the following cases:

    1. Recruiting someone to a specific career or other opportunity. In this case, the value of the opportunity is really the question at stake. The attractiveness of the community itself is generally a secondary consideration though may have an impact pro or con.

    2. Luring residents based on a family connection. This would often be the case for “boomerang migration” – people who left and came back, ordinarily after marriage and children. More broadly we could think of this as retaining or attracting those with a historic connection to a place, such as being born there.

    3. Drawing people from a city’s natural catchment area. The size of this area depends on a variety of factors, but pretty much every city has some natural hinterland from which it draws people.

    I call this the “normal model” of attraction. Clearly, a place like Indianapolis does well on all of these types of attraction, as do most similar sized cities I’d argue. That’s how Drew ended up in Indy.

    However, there’s another basis of attraction. This is what I call “aspirational attraction” – it’s people deciding to move or desiring to move to a city from outside of its natural catchment area despite a lack of a job offer or historical connection. I see this as based in one of three primary motivations:

    1. Desire to work in a particular industry that is centered in a particular location. Want to be a country musician? Moving to Nashville helps. Similarly, if you want to be an actor, New York, LA, or Chicago are basically your only options.

    2. Desire to live in a particular city for lifestyle reasons. Portland would be the paradigmatic example here. People sure don’t move there for its job market.

    3. Desire to live in a city because of its reputation for a rapidly growing economy or superior job market. Many of the Sun Belt boomtowns might fall into this category. They’ve got similar quality of life to many other places, but their robust job markets (and perhaps a bit of nicer weather) draw people in.

    Clearly, there are comparatively few places that function as a aspirational cities in a meaningful sense.

    Back to Drew’s piece, I don’t want to put words into his mouth, but my impression was that he sees Indianapolis having a strong “normal model” of attraction but not functioning as an aspirational city. I agree. More than 80% of Indy’s net domestic in-migration comes from elsewhere in Indiana, the city’s natural catchment area, and it isn’t hard to believe that specific opportunities and boomeranging account for almost all the rest. Perhaps the implication of his notion of tradeoffs is that if a city like Indy isn’t aspirationally attractive, you have the luxury of compromise since you probably already have a lock on the market you’re currently capturing. That’s a perfectly valid conclusion to reach, IMO.

    A very serious question cities that function nearly exclusively as normal attractors need to ask themselves is whether they desire to become aspirationally attractive. If so, then some exploration of the basis of that, and a realistic assessment of whether or not it is possible is important to undertake. Included in this would be the implications of not becoming aspirationally attractive. It seems to me that not having some type of aspirational component to your city’s attractiveness ultimately puts a ceiling on what it can achieve. On the other hand, it is far from clear that it’s easy to consciously create an aspirational value proposition where none currently exists.

    Aaron M. Renn is an independent writer on urban affairs and the founder of Telestrian, a data analysis and mapping tool. He writes at The Urbanophile, where this piece originally appeared.

    Photo: sparktography

  • The Evolving Urban Form: Istanbul

    Istanbul is unique in straddling two continents. The historical city was concentrated on the European side of the Bosporus, the wide, more than 20 mile long strait linking the Sea of Marmara (Mediterranean Sea) in the south to the Black Sea in the north. Nearly all of the historic city was located on a peninsula to the south of the Golden Horn, an inlet off the Bosporus. By 1990, the urban area had expanded to occupy large areas on both sides of the Bosporus.

    The Urban Area

    Istanbul, like many other developing world urban areas, has grown rapidly since World War II. In 1950, the urban area contained a population of less than 1,000,000. That is similar to the present population of urban areas like Edmonton, Adelaide and Raleigh. By 2012, the urban area had   a population of nearly 12.7 million.

    Few of the world’s cities boast a more storied history than Istanbul. It started as the Greek colony of "Byzantium," in the 7th century, BCE. By the fourth century, CE, Byzantium , taking advantage of Rome’s decline, was designated capital of the Roman Empire by the Emperor Constantine. The city was subsequently renamed "Constantinople." The final name change, to "Istanbul," was finalized in the early years of the post-Ottoman Empire Republic in the 1920s.

    Constantinople became capital of the Eastern empire. Constantinople eventually emerged as the seat of Eastern Christianity (Easter Orthodoxy) and remains so today, despite more than 500 years of Islamic predominance under the Ottomans and later, the Republic of Turkey.

    Like many ancient cities, Constantinople experienced wide swings in population, reaching 400,000 in 500 C.E. then dropping to under 50,000 by the time of the Ottoman conquest (1453). But the conquest proved a boon to the city.

    By 1550, the population had risen to 660,000. At the time only Beijing was larger (690,000). At that point, the city walls (the present district municipality of Fatih) and urbanization north of the Golden Horn amounted to an estimated six square miles (15 square kilometers), for a population density of approximately 110,000 per square mile (42,500 per square kilometer). Such hyper-densities were typical of pre-1800 cities, when walking was the predominant mode of transport. Some older cities were even more dense:  17th century, Paris approached 175,000 per square mile (67,000 per square kilometer (Note: Walking Cities)


    Caption: Sultan Ahmed Mosque (Blue Mosque), 17th Century, CE

    In the ensuing centuries, the urban area grew modestly to less than 1,000,000 in 1950, when the urban population density fell to 40,400 per square mile (15,600 per square kilometer). Rapid growth was to follow to today’s more than 12 million, along with a further drop in urban density, to 24,300 per square mile or 9,400 per square kilometer (Note: The Density of Istanbul). The physical expansion of the urban area now stretches north all the way to the Black Sea (Figure 1 shows the present extent of the urban area and the 1950 urban area). Over the 60 years, the urban area population grew more than 12 times, but the urban land area grew nearly 21 times (Table 1). Istanbul demonstrates the near universal truth that as cities grow, they become less dense  (Figure 2).

    Table 1          
    Istanbul Urban Area: Population & Density from 1550    
    Year Population in Millions Land Area: Square Miles Land Area: Square Kilometers Density:Square Mile Density: Square Kilometer
    1550 0.66 6 16 110,000 42,500
    1950 0.97 24 62 40,400 15,600
    2012 12.66 520 1,347 24,300 9,400
               
    Change: 1550-1950 47% 288%   -63%  
    Change: 1950-2010 1205% 2073%   -40%  


    At United Nations projected growth rates, the urban area should approach 18 million by 2025 (Figure 2). There are reports of increased migration to Istanbul from Asian Turkey, which if continued, could make the 2025 figure even higher.

    The Metropolitan Metropolis and Province

    Istanbul is a both a metropolitan municipality and a province and can be considered a metropolitan area (labor market area). The province, most of it rural, covers land area of more than 2,100 square miles (5,300 square kilometers) and had a population of approximately 13.5 million according to the 2011 census. The urban area (area of continuous urban development) is much smaller, at only 520 square miles (1,347 square kilometers). Nearly all the population is concentrated in the urban area.

    Since 1985, the metropolitan area’s growth largely has been outside the core. The historic core, on the peninsula (Fatih), lost 27 percent of its population, while the balance of the core, district municipalities to the north of the Golden Horn and to the west, lost 5 percent. Such core area losses have frequently occurred in many  major metropolitan areas   (for example, Osaka, Seoul, Mumbai, Chicago, Milan, Buenos Aires, and Mexico City).

    The inner ring, including district municipalities further to the west and north of the core on the European side and municipalities on the Asian side have captured nearly all the growth. From 1985 to 2011, inner ring district municipalities added 5,000,000 residents. The outer ring of suburban district municipalities gained 2.5 million residents with the greatest percentage growth, at nearly 250 percent. There has also been growth in exurban district municipalities (beyond the urban area), though it has been much more modest (Figure 4 and Table 2).

    Table 2          
    Istanbul: Population Growth by Sector: 1985-2012  
               
        1985 2000 2011 Change: 1985-2011
     Historic Core: Fatih             591          459          429 -27%
     Balance of Core          1,336      2,175      1,270 -5%
     Inner Ring          2,635      5,747      7,800 196%
     Outer Ring          1,044      2,424      3,598 245%
     Exurbs               147          240          386 162%
     Total            5,753    11,045    13,483 134%
               
     Population in 000s         


    Ascendant Asia

    While European Istanbul has been dominant for millennia, it is perhaps fitting that Asian Istanbul is on the rise, with nearly 40 percent of the population, up from 31 percent in 1985. Asian Istanbul was made substantially more accessible by the first bridge over the Bosporus (1973).

    Linking Istanbul

    Istanbul is served by two major east-west freeways. Each (the O-1 and O-2) both have their own crossings of the Bosporus. Other freeways feed these both in Europe and Asia. The development of the mass transit system is somewhat curious. The inner Fatih area and Beyoğlu contain the historically most important commercial centers. However, they are being fast replaced by new skyscraper developments in Levent and Maslak. This is similar to the emergence of newer commercial cores that have become more important the older cores, such as in Mexico City, Sao Paulo, Beijing, and Manila, where multiple, large cores have grown.

    Yet, Istanbul’s urban rail system keys on the old commercial centers. Both Levent and Maslak are located on a single Metro line, which makes them less convenient than if radial lines were being built to these centers instead. Both centers have good road access. Levent is located between the O-1 and the O-2 motorways, while Maslak is located just north of the O-2.

    A passenger rail tunnel between Asia and Europe, the first, is scheduled for opening to Fatih in 2015. Local authorities predict that this and other pending projects could increase the share of trips by rail in Istanbul from 3.6 percent to as much as 27.6 percent. No such market share increase has ever occurred in the world since automobiles have become widely available. Further, like Istanbul’s transit system in general, the project will not provide direct service to Levent or Maslak.

    Becoming Europe’s Largest Urban Area

    Istanbul has always been considered European and remains so even with its huge suburbs in Asia. Istanbul trails Moscow as Europe’s largest urban area, but by 2025 should be the largest. Indeed, it seems likely that Istanbul will be the only European urban area to reach a population of 20 million, as much of Europe faces stagnant or even declining population.

    Wendell Cox is a Visiting Professor, Conservatoire National des Arts et Metiers, Paris and the author of “War on the Dream: How Anti-Sprawl Policy Threatens the Quality of Life.”

    ——————–

    Note: Walking Cities: Walking constrained the physical expansion of cities, and thus the population. As result, few pre-1800 cities reached 1,000,000 population and most were not able to sustain that level. The great expansion of urban areas followed, as walking was replaced by the more efficient transport modes of transit and automobiles, both of which permitted a sizeable expansion of urban footprints and labor markets. The subsequent economic growth is legendary and accounts for having attracted so many people from the countryside. In 1800, estimates suggest that urban areas contained under 10 percent of the world population. Today, the figure is 52 percent, according to the United Nations. This includes all urbanization, from the largest cities to the smallest towns.

    Note: The Density of Istanbul. The province, most of it rural, covers land area of more than 2,100 square miles (5,300 square kilometers) and had a population of approximately 13.5 million according to the 2011 census. The urban area (area of continuous urban development) is much smaller, at only 520 square miles (1,347 square kilometers). This article highlights the urban density of Istanbul, which is the population per square mile or square kilometer. Other sources cite much lower figures, for the province/metropolitan municipality (metropolitan area). However, metropolitan area densities are not urban area densities. Metropolitan areas virtually always have more rural land than urban land, so their population cannot be included in calculations of urban density. The population and density noted above is based upon the 2011 census and will be reflected in the next edition of Demographia World Urban Areas.

    Photo: Hagia Sophia (Santa Sophia) Church (now museum) built by Justinian (6th Century CE). Photos by author.

  • Sex (Or Not) And the Japanese Single

    Back in June 2011, British prime minister David Cameron backed proposals tackling the sexualisation of British children, in a bid to dilute the culture of sex that has swept western nations. The rhetoric goes that the ‘oversexualisation’ of society, as represented in everything from ‘lads mags’ to advertising boards promoting shampoo, has fuelled a surplus of sexual desire that is thought to have contributed to the rise of teenage pregnancy and rape cases in the UK.

    Compare this to Japan, a country where, according to a recent survey, a third of young men have no interest in sex. Moreover, 50% of young women are not dating. Could this be an ‘undersexualised’ society? Has this impacted Japan’s population geography?

    In 2007, Japans population reached a tipping point. It was the first year in its history (excluding 1945) where the number of deaths exceeded the number of births. In 2007 there were 2,000 more deaths than births. In 2011 that figure rose to approximately 204,000, and it’s a figure that is accelerating. Indeed, at 23.1%, Japan has the highest proportion of over-65s in the world, and at 13.2%, the world’s lowest proportion of under 14s. Japan’s population peaked at 127.7 million in 2007, and is forecast to shrink to a mere 47 million by 2100. What are the economic and social forces behind this?

    Too much work, too little sex: Japan is a country where sales of adult diapers exceed child diapers, and where more public money is spent on healthcare than defence. It’s also one of the world’s most industrialised countries, with an agricultural sector comprising 1.5% of its GDP and services sector comprising 75.7% of GDP. For Japanese society, this means that a white collar lifestyle predominates. High salaries with high workloads in an already expensive country has meant that starting a family has become a low priority, if a priority at all, on a Japanese professional’s wish list. The little available data on the reasons why indicates that raising a child is too expensive, and that the pressure of work leaves little time available to look after anyone other than themselves.

    Compounding this battle between a high flying job versus a family is a culture somewhat void of sexualisation. It is unlikely that, on a stroll through Tokyo, you will come across much imagery that is overtly sexual. In contrast with the west, sex doesn’t sell in Japan. Among males 16 to 19 year old, 36% have no interest in sex, and some even despise it. The figure is even higher (59%) for females in the same age category. These respondents often cite greater interest in comics, computer games and socialising through the internet. A low level of cultural sexualisation is not without its benefits; the rape rate is one of the lowest in the world.

    However, the net result of these socio-cultural and economic factors is that the fertility rate is astonishingly low. According to the UN the figure is 1.27.

    Japan is therefore facing a demographic crisis. The number of dependents per active member of the labour force is increasing, and in an unusual situation, there are more jobs available than people to do them. Furthermore, in future decades Japan may have an oversupply of infrastructure relative to the amount of people who can use it.

    Several policy options could be under consideration by Japan’s decision makers. Not all of these are practical or even advisable, but we may see them looked at in years ahead:

    Encourage Fertility – This would help ensure that the labour market and services such as transport are not undersupplied. It can be done in at least three ways. The first is through pro-natal incentives, such as child tax breaks for couples who desire children. The second is to restrict or even ban abortion (Japanese abortion laws are some of the most liberal in the world). For example, restrict abortions to the first trimester only. Laws such as these will inevitably conflict with women’s and couples rights. The third, and perhaps the most untried, is to sow the seeds for a more sexualised Japanese culture, one with more lust and desire, in an attempt to situate relationships as more desirable than the latest computer game.

    Encourage Migraton – Japanese immigration and emigration have both been low. The ethnic mix of Japan is not diverse. 98.5% of Japan’s population is ethnically Japanese, with only a few other ethnic groups. In order to prevent an undersupply of labour, the country may have to encourage mass immigration. Given the unique culture and language of Japan, will foreigners want to come and live there? Would immigration cause ethnic tensions in this peaceful country?

    Raise the Retirement Age – It has been calculated by United Nations researchers that the retirement age in Japan would have to be raised to 77 from 65 in order to rebalance its crippling dependency ratio. This would shorten the average amount of retirement years from 14 years to two for men, and from 19 years to seven for woman.

    A blueprint for the rest of the world? Is Japan’s pattern of rising, peaking, and falling gross population going to be a defining demographic trend in the 21st century? In Japan, Germany, Russia, Czech Republic, Estonia and several more countries it already is, with several other low growth European countries, such as Italy, forecast to head the same way.

    Low sexualisation is unlikely to be an important factor of low growth in Europe. The worldwide trends of continued urbanisation, the growth of white collar jobs, and the decline of blue collar jobs as an overall percentage of the economic makeup have acted as the most effective mass contraception.

    Given a course of continued social and economic development around the world, the ‘tipping point’ for world population could be as near as 2050, a date that many of the readers of this article could be witnessing.

    The rhetoric of overpopulation doomsday scenarios should really be reversed. The warnings today should be about the unsustainable dangers of a shrinking population. This will no doubt be one of the key issues in sustainable development discourse for years to come.

    Edward Morgan is a 4th Year Human Geography student at the University of St Andrews, Scotland.

    Photo by Kevin Poh: Night Life @ Shinjuku, Tokyo

  • The U.S. Cities Getting Smarter The Fastest

    It’s a commonplace among pundits and economic developers that smart people flock to “smart” places like sparrows to Capistrano. Reflecting the conventional wisdom, The New York Times recently opined that “college graduates gravitate to places with many other college graduates and the atmosphere that creates.”

    Yet an analysis of Census data shared with Forbes by demographer Wendell Cox tells a different story. In the past decade, the metropolitan areas that have enjoyed the fastest growth in their college-educated populations have not been the places known as hip, intellectual hotbeds.

    Perhaps the myth most devastated by the study, which looked at the change in the number of people with bachelor’s degrees in the 51 largest metropolitan statistical areas from 2000-2010, is that there is, as the Atlantic’s Derek Thompson has insisted, a “bipolar population shift” in which the educated go to the expensive blue regions while families and dummies (often conflated as the same thing) flock to the brain-dead reaches of the Sunbelt. In fact, during the first decade of the 21st century, the number of college graduates in Las Vegas increased by a remarkable 78%, the biggest jump in the nation over the period, while in second place Riverside-San Bernardino, Calif., the college-educated population expanded by 60%. Other surprise cities in the top 10 — Charlotte, N.C. , (No. 5) ; San Antonio (No. 6); Jacksonville, Fla. (No. 7); Orlando (eighth); and Nashville, Tenn. (ninth) — all saw 40% to 50% increases in their college-educated population.

    Among the more conventional “brain” cities, the biggest winners from 2000 to 2010 tended to be lower-cost metropolitan areas with less dense cores, such as Raleigh–Durham, N.C. (No. 3), and Austin, Texas (No. 4). In contrast, the more expensive places celebrated for being smart expanded their populations of college grads at roughly half that rate, such as San Francisco (48th), San Jose (43rd), Boston (45th) and New York (39th).

    This is not to say that these cities don’t boast huge concentrations of educated people. The largest metro areas, led by New York, Los Angeles and Chicago, have the biggest populations with bachelor’s degrees. And on a per capita basis, Washington D.C. (aka “parasite city”), San Francisco, Boston, Denver and Minneapolis lead the way, with a share of college grads 20% or more above the national average.

    But other metro areas are catching up. In Tampa-St. Petersburg, Fla., for example, the share of the population that’s college-educated grew from 21.7%  to 26.2%, a gain of 21%. This is roughly twice the increase in the Washington, San Francisco and Seattle metropolitan areas.

    This trend  doesn’t extend to all lower-cost regions. The Sunbelt has generally gained, but some Rust Belt towns have not fared as well. Cleveland, for example, ranked 50th in terms of its growth of its college-educated population, Detroit 49th and Buffalo 48th. Low costs, not surprisingly,  don’t compensate for poor economic conditions, decayed infrastructure and bad weater.

    Yet the pattern is clear: brainpower is spreading out. The notion that companies seeking skilled labor have to go to one of the “hip” cities — an idea relentlessly marketed by the New York and D.C.-based press — appears greatly overstated. In reality, skilled, college-educated people are increasingly now scattered throughout the country, and often not where you’d expect them. For example, Charlotte, N.C., Columbus, Ohio, Kansas City and Atlanta now boast about the same per capita number of college grads as Portland and Chicago, and have higher per capita concentrations of grads over the age of 25 than Los Angeles.

    These trends also suggest that, in many ways, the highly educated are not so different from Americans who never went to college or never graduated. The factors that have driven economic outperformance by some cities over the past decade — lower home prices, better business climate, job opportunities — also attract people with bachelor’s degrees.

    Atlanta, Houston and Dallas each have added 300,000 college grads in the past decade. This is far more than Boston’s increase of 240,000 or San Francisco’s 211,000. Once considered backwaters, these Sunbelt cities now all enjoy a critical mass of educated people.

    Houston boasts a percentage of college grads over 25 somewhat above the national average. Dallas-Fort Worth is just about at the national average. The total Houston increase in college grads over the past decade amounts to three times that of the capital of Silicon Valley, San Jose, Calif., twice that of San Diego and more than Philadelphia. Since hipness is not a well-known Houston trait (though it did place first this year on Forbes’ list of America’s Coolest Cities), and climate can hardly be seen as a positive, one has to imagine this growth has something to do with a job machine that has created over 100,000 new positions between 2006 and 2011.

    The addition of college grads leads to changes on the ground that tend to make cities even more attractive to future graduates. In the case of Houston, there’s been a proliferation of more sophisticated restaurants, clubs and bars in growing inner-city districts like Houston Heights, Montrose and Midtown.

    In the past, executives often turned up their noses at the prospect of relocating to the Gulf Coast metropolis, says Chris Schoettelkotte, founder of the Houston-based recruiting firm Manhattan Resources. Now, particularly given the weak national economy, Houston is increasingly competitive in the race to recruit skilled, educated labor, he says. This is particularly true with people at the beginning of their career. “I don’t get the pushback I used to get,” Schoettelkotte says. The message to recruits: “ You try to find a city with a better economy and better job prospects than us.”

    A democratization and dispersion of educated workers bodes well for the U.S. economy. When highly skilled labor is concentrated in a few places, such as Boston or the Bay Area, opportunities for growth tend to be limited by extremely high business and housing costs. Having more places with educated workers gives employers and entrepreneurs more options for where to start a business or relocate.

    Looking ahead, we can expect this trend to continue, particularly as the current bulge of millennial graduates mature and start to look for affordable places to live and work. Regions that maintain strong job growth, and keep their housing costs down, are likely to keep gaining on those metropolitan areas celebrated for being the winners of the race for educated people.

    Metropolitan Growth in Age 25+ Population with Bachelor Degrees
    Rank Region Total Growth Percent Growth
    1 Las Vegas 122,304 78.4%
    2 Riverside 187,406 60.0%
    3 Raleigh 107,075 55.2%
    4 Austin 147,341 52.3%
    5 Charlotte 126,226 51.7%
    6 San Antonio 111,739 48.1%
    7 Jacksonville 77,102 46.8%
    8 Orlando 125,299 46.6%
    9 Nashville 92,823 42.4%
    10 Phoenix 216,585 42.1%
    11 Tampa 145,675 39.6%
    12 Houston 300,952 39.5%
    13 Louisville 61,312 37.6%
    14 Portland 134,935 37.2%
    15 Dallas 336,993 36.9%
    16 Atlanta 308,306 36.1%
    17 Sacramento 108,151 35.8%
    18 Denver 169,553 35.2%
    19 Indianapolis 90,001 34.5%
    20 Oklahoma City 56,117 33.5%
    21 Richmond 67,012 33.4%
    22 Columbus 96,905 33.2%
    23 Miami 262,394 31.7%
    24 Virginia Beach 73,110 31.2%
    25 Seattle 205,977 31.2%
    26 Kansas City 103,527 31.0%
    27 Salt Lake City 46,205 30.5%
    28 Washington 410,679 30.5%
    29 Minneapolis 189,209 29.9%
    30 Baltimore 146,285 29.6%
    31 San Diego 154,845 29.6%
    32 St. Louis 128,617 29.5%
    United States 13,115,437 29.5%
    33 Cincinnati 90,374 28.3%
    34 Los Angeles 559,904 27.7%
    35 Memphis 45,141 27.4%
    36 Philadelphia 281,686 27.2%
    37 Birmingham 41,436 26.3%
    38 Chicago 429,001 25.5%
    39 New York 905,618 24.4%
    40 Milwaukee 63,508 24.3%
    41 Providence 59,926 24.1%
    42 Rochester 44,268 23.6%
    43 San Jose 102,609 22.5%
    44 Pittsburgh 88,370 22.3%
    45 Boston 240,426 22.0%
    46 Hartford 49,225 20.8%
    47 Buffalo 36,578 20.1%
    48 San Francisco 211,835 19.2%
    49 Detroit 109,429 16.2%
    50 Cleveland 51,259 14.9%
    51 New Orleans 19,307 10.1%

    Data source: U.S. Decennial Census 2000 and 2010.

    Joel Kotkin is executive editor of NewGeography.com and is a distinguished presidential fellow in urban futures at Chapman University, and contributing editor to the City Journal in New York. He is author of The City: A Global History. His newest book is The Next Hundred Million: America in 2050, released in February, 2010.

    This piece originally appeared in Forbes.

    Graduation image by BigStockPhoto.com.

  • Evolving Urban Form: Dhaka

    A few weeks ago, we suggested that Hong Kong was the "smart growth" ideal, for having the highest urban population density in the high income world. But, if you expand the universe to the poorer, developing countries, Hong Kong barely holds a candle to Dhaka. Dhaka’s 14.6 million people live in just 125 square miles (325 square kilometers). At more than 115,000 people per square mile (Figure 1), or 45,000 per square kilometer (Figure 2), the capital of Bangladesh is nearly 75 percent more dense than Hong Kong.

    The Ultimate in Average Urban Area Density

    None of the world’s megacities comes close to Dhaka’s population density. Mumbai is about one-third less dense, despite its reputation as crowded and congested. The only other megacity (minimum 10 million population) more than one-third as dense as Dhaka is Karachi. Twenty three other megacities fall at least two-thirds short of Dhaka’s density (such as Jakarta, Seoul and Paris). New York’s core, Manhattan, is 40 percent less dense, and the New York urban area does not reach 1/20th of Dhaka’s density


    No city in the world uses land so efficiently as Dhaka. But this comes at a price. With an urban area ranked among the 20 most populous in the world, Dhaka’s average income is so low that it does not even place in the top 100 metropolitan area economies as measured by the Brookings Institution. Thus, the world’s most dense urban area is among the least economically productive. Brookings rated the principally suburban and exurban Hartford metropolitan area number one, with an urban density approximately 1/100th that of Dhaka, Hartford includes the old core city; but as well as the much more substantial primarily suburban or even exurban areas.. Hartford is among the least dense urban areas in the world, at half as dense as Portland and one-fourth as dense as Los Angeles. So much for the illusion that urban density and productivity are joined at the hip.

    Despite Dhaka’s hyper-density, critics complain about Dhaka’s urban sprawl. If Dhaka is "urban sprawl," then the term is meaningless. Perhaps the critics would prefer the rural poor to live in even more crowded shantytowns, or maybe better yet, that they go back home to even more desperate rural poverty. Aspiration is not a bad thing, and if that means cities with more people, covering more land area, so be it.

    Not only does Dhaka have the highest average urban density, but it also has some of the highest neighborhood densities: some slum (shantytown) population densities reach 4,200 per acre, which converts to more than 2,500,000 per square mile or more than 1,000,000 per square kilometer. Estimates of the slum population vary, ranging from a quarter to 60 percent of the area population.

    Dhaka in the Neighborhood

    Dhaka is only 150 miles (250 kilometers) from Kolkata. Both cities were located in the province of Bengal for all but six years of the centuries long period of  British rule. After the division of India and Pakistan in 1947, Dhaka was located in East Pakistan. Kolkata became the capital of the Indian state of West Bengal. For most of their histories, Kolkata was larger than Dhaka. But the Dhaka urban area has just overtaken Kolkata in population. By 2025, the United Nations forecasts that Dhaka will reach 23 million, well ahead of Kolkata’s projected 19 million (Figure 3).

    Dhaka’s growth has been spectacular. In 1970, just before East Pakistan separated from Pakistan to become Bangladesh, the urban area had a population of 1.3 million. Its population grew by more than 10 times, Dhaka growth over four decades trails only Shenzhen among the megacities, which expanded by 30 times over the same period.

    The Metropolitan Area

    Dhaka’s metropolitan area (which includes the urban area and economically integrated rural environs) added approximately 5,000,000 new residents between 2001 and 2011. Dhaka added at least a 50 percent to its population, rising from just under 10 million population to just over 15 million during the decade (Note 1). Few, if any of the world’s largest metropolitan areas or urban areas have achieved such a large percentage population increase in a period of 10 years. Even so, Dhaka’s population added fewer people than some larger metropolitan areas over a similar period, such as Karachi, Jakarta and Shanghai (Figure 4).

    Spatial Expansion

    Consistent with the trend since cities escaped walls, Dhaka has been expanding spatially as its population has increased. Over the past decade, the core municipality, Dhaka, increased its population 45 percent. The suburban and exurban population increase was nearly twice as great, at 85 percent (Figure 5). The core city of Dhaka managed to capture just over one-half the population growth, but because of its larger size, the slower percentage growth rate still resulted in half the additional population being in the city (Figure 6). Dhaka thus further confirms the axiom that as cities become larger, they become less dense.


    River City

    Dhaka may be the worst situated urban area in the world. Dhaka is located in wetlands and virtually surrounded by rivers, some of the greatest in the world.

    • Dhaka is 20 miles (32 kilometers) east of the Padma River, which is the main course of the Ganges River.
    • Only a few miles north of this point, the Padma is joined by the Jamuna River, which is the main course of the Brahmaputra River.
    • The Meghna River, the secondary Brahmaputra River course is 15 miles (25 kilometers) to the east of Dhaka.
    • Little more than 30 miles (50 kilometers to the south is the confluence of the Padma River and the Meghna River, which flows the last few miles to the Bay of Bengal as the Meghna.

    Though Dhaka is 100 miles (160 kilometers) from the Bay of Bengal (the Indian Ocean), the lowest parts of the city are little more than five feet (two meters) above sea level. This means serious flooding. The risk is illustrated in Figure 7. The extent of the risk is illustrated by the fact that the areas not prone to flooding cover less land than the urban area. That means that the necessary urban expansion will be very expensive. With the understandable exodus from rural areas to the city, the problems of high density and, particularly slums could become more acute.

    A City Designed for a Metro?

    The river courses and wetlands have forced Dhaka into a generally north-south orientation. The urban area averages from three to seven miles east to west (five to 11 kilometers) and is nearly 30 miles (50 kilometers north to south. The more circular development that would be expected for an inland urban area is precluded by the rivers and wetlands.

    This unusual city form could serve the city well, however, as it builds its first Metro line. Stations on the planned north to south line will be within a long walk of a much of the urban area. It is hard to imagine an urban form and density more suited for a Metro. Construction is supposed to begin within the next two years.

    Not only is Dhaka the largest world urban area without an urban rail system, it is also the largest without a motorway (freeway). That too will soon change, as two should be under construction soon.

    Political Reform and the Future

    Meanwhile, in an attempt to improve city services, the national government has divided the city of Dhaka into two. The Dhaka City Corporation has now been replaced by the Dhaka North City Corporation and the Dhaka South City Corporation. There is an increasing body of literature suggesting that smaller municipalities perform better (and spend less) than larger municipalities. The Dhaka demerger may be the first significant such move since the 1986 breakup of the Greater London Council by the Thatcher government (Note 2).

    Dhaka begins the next decade undertaking significant challenges in infrastructure, economic growth and government reform. However, perhaps the biggest challenge will be to figure out where to put the additional five million people expected by the 2021 census.

    Wendell Cox is a Visiting Professor, Conservatoire National des Arts et Metiers, Paris and the author of “War on the Dream: How Anti-Sprawl Policy Threatens the Quality of Life.”

    —–

    Note 1: There was an undercount in the 2011 census, ranging from 3.8 percent in rural areas to 5.3 percent in urban areas. This complicates comparison between the 2001 and 2011 census data.

    Note 2: Even after the subsequent creation of the Greater London Council, by the Blair government, most local functions were not transferred, remaining in the 32 local boroughs. A forced amalgamation of Montréal with suburbs was partially reversed by voter referenda in the early 2000s.

    —-

    Photograph: Farmview Supermarket Transit Transfer Center, on one of the urban area’s few north-south arterial  roadways. (by author)