Floribec has been part of the collective imagination of the Quebecois for nearly 50 years. Over time, a movie, a novel, advertisements and news reports played an important part in establishing the greater Miami region as the destination of choice for Quebec tourists. Floribec began as a result of tourism and it later evolved into a transnational community. After visiting southeast Florida, some Quebec tourists decided to take up permanent residence there and to make their living providing services in French to other French-speakers. Motels, restaurants, convenience stores, lawyers, and other services for winter residents appeared, creating a Floribecois community, where the lifestyle and economy were largely based on the ever-present Quebecois tourists, visiting for a week or for several months. The result was a French-speaking community outside Quebec, distinct from other French-speaking communities in North America. However, the survival of the declining community is now in jeopardy.
The Origins of Floribec
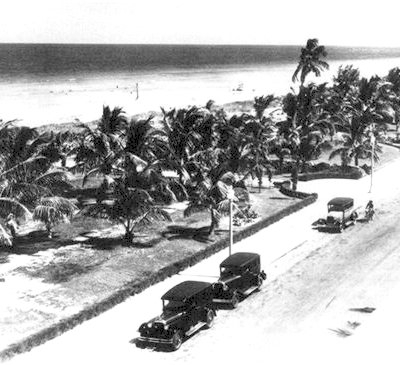
Ocean Drive (Miami) sometime in the 1940’s
It is hard to pinpoint the origin of the word "Floribec" but it appears to have been adopted in the 1970s by Quebec residents wintering in Florida and made official in a study by Louis Dupont in the 1980s. According to him, French Canadians began immigrating to Florida in the 1930s. This immigration came in the wake of spending by the United States government, which, in an effort to resolve the 1929 economic crisis, undertook to build a network of canals through the marshland in southeast Florida and, notably, to open the Intercoastal Waterway, a navigable canal hundreds of kilometres long. At the same time, the government was also attempting to develop the infrastructure for tourism. Thousands of Americans travelled to the "Sunshine State" to work on this vast construction site. Among them were Franco-Americans from New England, some accompanied by their French-Canadian cousins. Once the construction work was completed, rather than going home, many of the French-Canadian workers took up permanent residence in the Miami region, particularly in Surfside, on the Atlantic coast, and in North Miami. After the Second World War, there were 67,000 French-Canadian and Franco-American families living in the State of Florida. These new permanent residents of Surfside and North Miami and of Sunny Isles generally found work in the tourist industry because Florida, especially Miami, was the holiday destination of a growing number of wealthy French-Canadians. This initial wave of Quebecois mass migration to Florida began at the end of the war and continued until 1960.
Establishment of the Floribecois Community
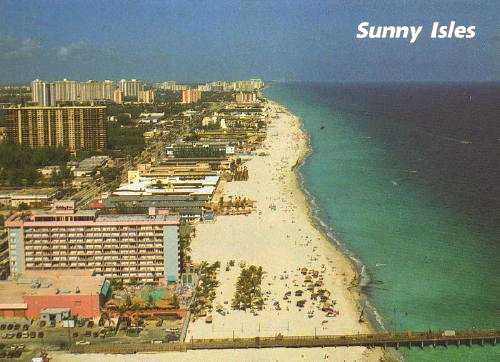
Postcard of Sunny Isles, before the arrival of the giant hotels
The period from 1960 to 1970 saw a second wave of French-Canadian, mainly Quebecois, migration to the Miami region, with the appearance of a new type of immigrant: the investor. Two of the factors contributing to increased immigration were the liberating effect of the Quiet Revolution and the growth of wealth in Quebec. The fact that these two phenomena occurred simultaneously appears to have encouraged the people of Quebec to look beyond their borders. Expo 67 and a number of other Quebec cultural events made the rest of the world more aware of the province and, as well, the people of Quebec used this period of cultural vitality to increase their travel to foreign destinations.
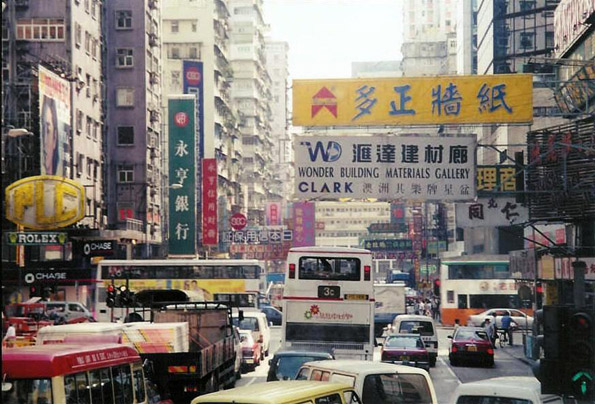
At the same time, the tourist industry was experiencing rapid development in Florida with the arrival of the major airlines, the construction of the United States freeway system, and the north-south shift of economic and political power, which sparked phenomenal growth in the cities of the Sun Belt, including Miami. Miami Beach and its suburbs of Surfside and Sunny Isles became the favourite seaside destinations of the Quebecois. Recognizing the opportunity the situation presented, the Floribecois set up businesses in the area to cater mainly to Quebecois tourists, building French-language motels, restaurants, bars, convenience stores, and various other services to meet their needs.
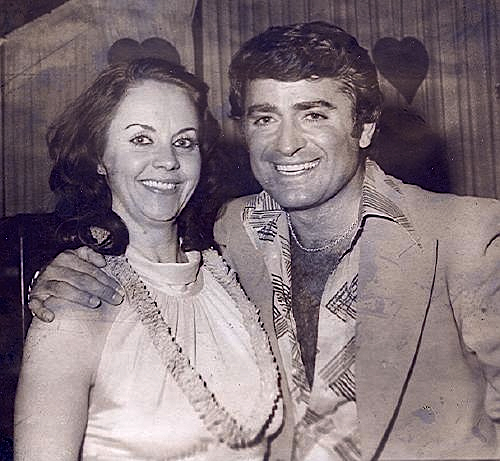
Gemma Cossette with popular singer Michel Louvain
From the 1970s onward, most businesses were established in Surfside and Sunny Isles, especially along Collins Avenue, whose location less than a kilometre from the beach offered increased customer traffic. The favourite tourist destination of the Quebecois was now affordable and there was no longer any language barrier. During this period, the Thunderbird, Suez, Waikiki and Colonial hotels were familiar to any Quebecois who travelled regularly to Florida, and even to those who were merely thinking of going there. Cultural life was vibrant because of the continued presence of such artists as Gilles Latulippe and other popular Quebec comedians and singers, who performed to sold-out audiences in the most popular hotels. The localization of these cultural activities in the gathering places of Quebecois tourists would serve to establish the physical boundaries of Floribec as a transnational tourist community.
Floribec’s Shift Northward
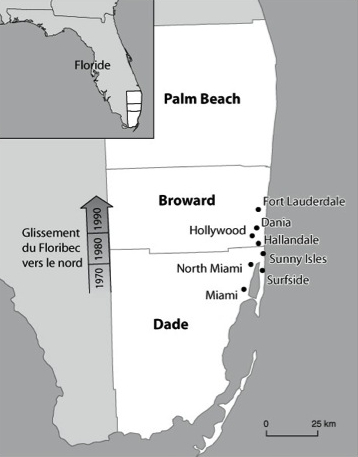
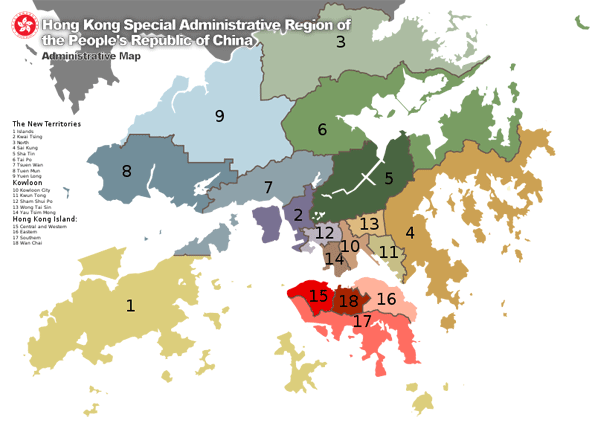
Map showing location of concentrations of
Quebec residents in Florida
The Floribecois communities in Surfside and Sunny Isles moved in the 1980s because, as had been the case in the Mafia era of 1920-1930, Miami once again became an international money-laundering centre for the drug trade, as well as being the scene of major racial conflicts. The city gained the status of unofficial capital of Latin America, not only because it had become a hub of the Latin-American banking system, but also because its downtown attracted hundreds of thousands of Cubans, Nicaraguans, Columbians and others. This continual influx of migrants led to a major exodus of WASP’s (White Anglo-Saxon Protestants), who moved north to the neighbouring counties of Broward and Palm Beach, leaving Dade County to the Hispanic population. Many Quebecois tourists and immigrants also left Dade County at that time.
Floribec’s Glory Years
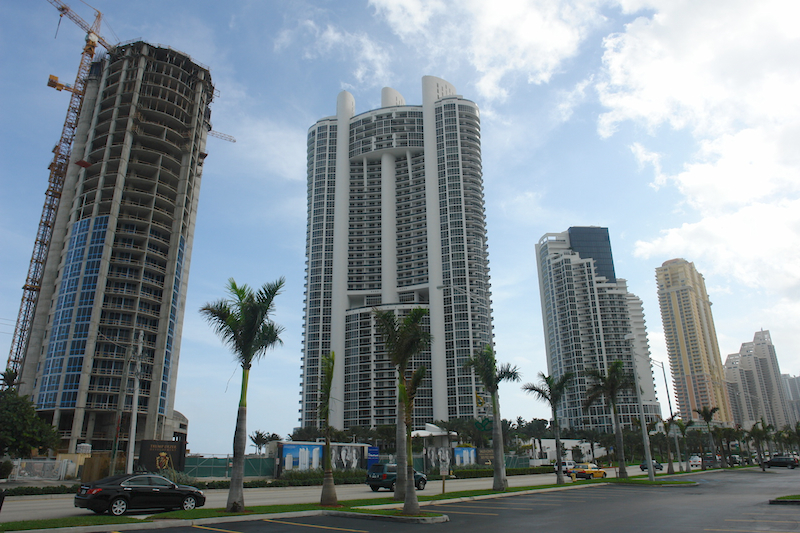
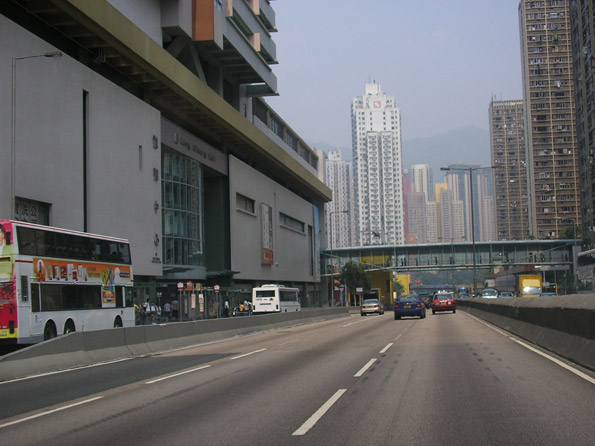
Giant hotels replaced small motels
For all intents and purposes, the Floribecois areas in Surfside and Sunny Isles disappeared in the early 1990s. The small, modest hotels, motels, and apartment buildings, where many Quebecois lived, were torn down and replaced by luxury high-rise condominiums up to 30 storeys high, some of them owned by Donald Trump.
The changes to that area explain why the neighbouring cities of Hallandale, Hollywood and Dania experienced such considerable growth during this period. They had not suffered from the demolition associated with urban sprawl and, for this reason, they became the southernmost destinations to which Quebecois tourists could travel affordably. The small, reasonable motels so popular with the majority of Quebecois tourists remained. It was here, in a well-defined area, that the Floribecois community really took root again and where it continued to be possible to carry on everyday life in French.
Floribec’s Current Configuration
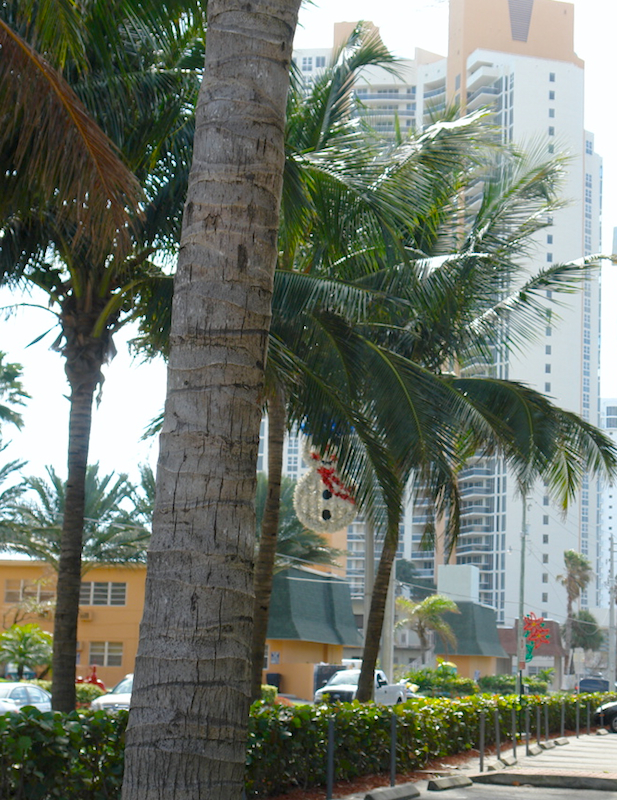
Christmas decoration hanging discreetly from a palm tree
Like numerous other seaside resorts, Floribec has a recreational business district (RBD) where the main tourist services are located. In the Floribecois RBD, there is a pedestrian walkway along the beach, the Broadwalk, and perpendicular to it, a main artery, Johnson Street. Depending on the season, restaurants, specialty food stands, candy shops and souvenir shops line these two streets in the RBD. The beach is the location of the sites most vital to Floribec life, namely the Broadwalk itself and the Johnson Street stage, as well as social institutions like the famous Frenchie’s Café. Only a few kilometres from the RBD, other very popular Floribecois motels, including Richard’s Motel, branches of the Caisse populaire Desjardins and the National Bank of Canada, Lacroix Real Estate Agency, Au Coq restaurant, and other services are grouped together along U.S. Highway 1. Beyond the Hollywood-Dania-Hallandale corridor, the Floribecois population and its landmarks are soon swallowed up by the greater community.
It is important to note that Quebec is an integral part of the Floribecois community. The ongoing relationship with Quebec is sustained by the seasonal influx of thousands of tourists, often called "snowbirds", and the ready access in Florida to Quebec newspapers and radio, the main Quebec television programs, and the Internet, which also makes on-line banking possible. All of the regular and ongoing media and tourist contact between Quebec and Floribec make the latter a "transnational community" whose existence is largely dependent on the many connections it maintains with Quebec.
Floribec in Decline?
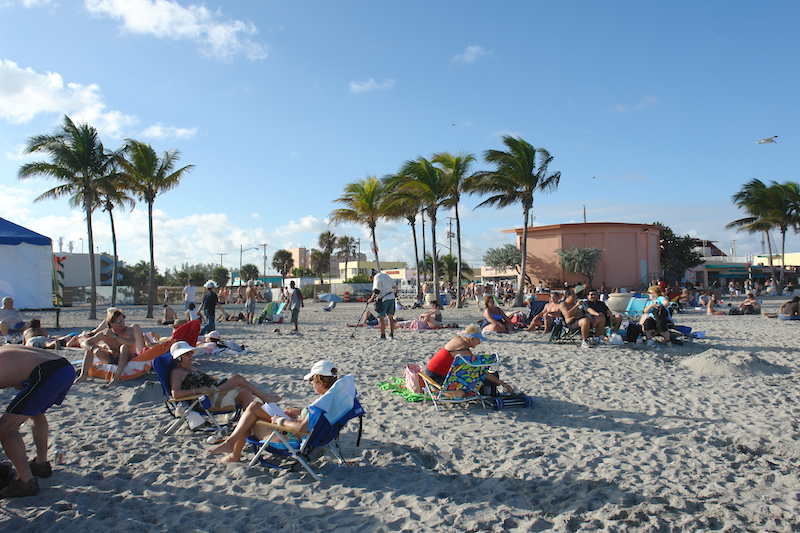
Enjoying the beach…
Floribec has changed considerably since 2000. While Quebecois tourists continue to travel to southeast Florida, and the Quebecois culture and everyday living in French no longer dominate the scene around Johnson Street, as they did in the 1990s. People still gather on the beach but the tourists and immigrants live elsewhere, often at some distance from the ocean. Three factors may explain this erosion: 1) pressure from Miami’s continuing urban sprawl; 2) the negative image local political authorities have of the Floribecois; 3) competition from numerous tourist destinations that are as affordable as Florida, such as the Dominican Republic, Mexico and Cuba, which attract an increasing number of Quebecois.
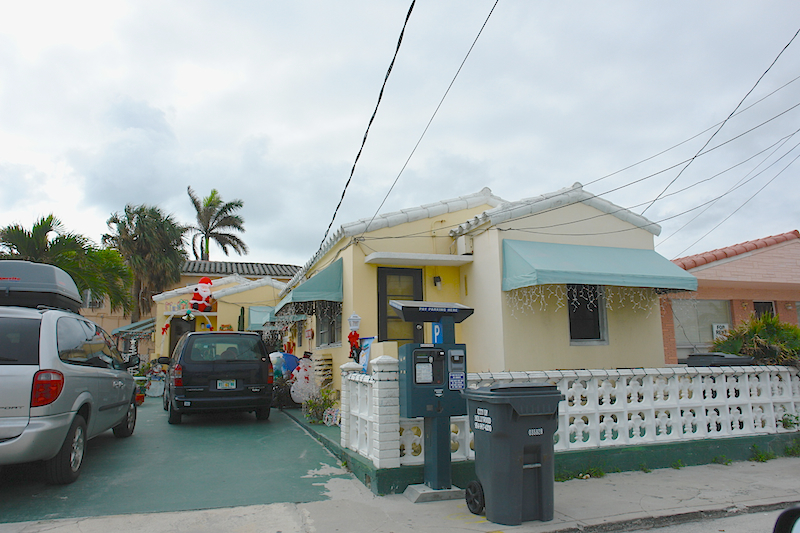
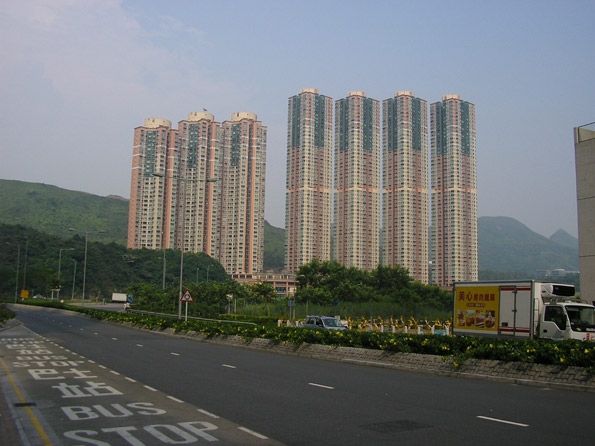
Miami‘s urban sprawl
The purchase and demolition of Floribecois motels by rich local and Latin-American land developers has expanded beyond the cities of Surfside and Sunny Isles. Due to the shortage of available land, the trend has now reached Hollywood. For example, a huge luxury hotel complex was built only a few kilometres from the Broadwalk, which is also being rebuilt, and Floribecois motels located on Hollywood Beach have been demolished to build luxury condominiums. It is Hollywood’s turn to face the phenomenon of urban high-rise construction and tourist gentrification; it may be fighting a losing battle.
A veritable Quebecois
Negative image of the Floribecois
The socio-economic class to which the Floribecois belong troubles Hollywood City Hall. In strictly economic terms (daily spending, property taxes, etc.), it is not in the municipality’s interest to encourage the Floribecois to remain in the area. Nor does the caricature of the Floribecois presented in Quebec films and the local media help to reassure the city councillors. While the City of Hollywood welcomed the economic benefits associated with French-speaking residents in the 1980s, it now fears that these same people may tarnish the city’s image and it feels that Hollywood should follow the example of neighbouring municipalities who are moving to attract a higher class of tourist. The city has already taken the first step by demolishing one of Floribec’s most significant institutions, Frenchie’s Café, at the corner of the Broadwalk and Johnson Street, along with the adjacent small businesses. Since the demolition, the Floribec atmosphere, so appreciated by tourists, is much less vibrant than it was in the 1990s. Although there are still many Quebec tourists on the beach, fewer services are available to them in French, quite a different situation that in Floribec’s glory days. The only time that the Floribecois now flock to this subtropical area of the country is in January, when the annual festival, Canada Fest, brings together Floribec businesses and Quebec singers. Annual attendance at this cultural event is about 100,000 visitors. However, it is increasingly difficult to find signs of Floribec’s existence. While some insist that all is well, it would appear that Floribec’s days are numbered. At the very least, it seems that Floribec has lost its heart and soul.
Competition in the tourist trade
The increased number of affordable tourist destinations adds to the pressure on Floribec. Because those who love Florida enjoy temperatures of 25º C or above, the West Indies, the Caribbean and Mexico are harming the Floribecois economy. Le Soleil de la Floride, a monthly newspaper established in 1983, has reason to continually boast the merits of the Sunshine State, pointing out how familiar and safe a destination it is. However, there is no doubt that sun-seekers, especially those who do not travel south by car (single people or couples), are being lured away by the Dominican Republic, Cuba or Mexico. Direct flights from Montreal and Quebec to Cancun, Acapulco, Punta Cana, Varadero, and many other destinations are rapidly growing in number to meet demand, making vacations in these tropical and exotic areas accessible, often at a lower cost than an extended stay in Florida.
Heritage in Danger?
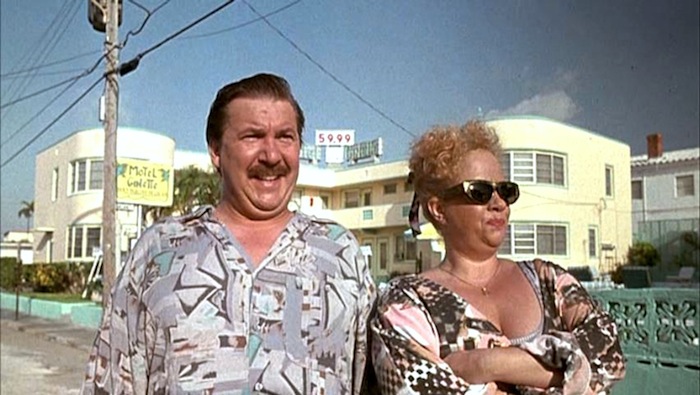
Image from the movie «La Florida» (George Mihalka, 1993) starring
Rémy Girard and Pauline Lapointe
Floribec constitutes an interesting chapter in the history of modern Quebec and it represents an intriguing and unique pocket of French-speaking America. This transnational community came into being as a result of people patronizing numerous businesses and other community-building venues situated in a relatively small geographical area on the Atlantic coast. These sites played an essential role as centres of community life for French-speakers who were living in or visiting the greater Miami area. Today, certain community practices formerly associated with Floribec can still be found; however, they are dispersed over a much wider area and signs of any Quebecois presence in the Florida landscape are increasingly difficult to discern.
Rémy Tremblay is Canada Research Chair on Knowledge Cities, Université du Québec à Montréal
——–
This piece is courtesy of the Encyclopedia of French Cultural Heritage in North America.
——–
Bibliography
CORTÈS, G. E FARET, L. (dir) (2009) Les circulations transnationales. Paris, Armand Colin, 244 p.
DUPONT, L. (1982). Le déplacement et l’implantation de Québécois en Floride. Vie française, 36 (10-11-12), p. 23-33.
GILBERT, A., LANGLOIS, A. et R. TREMBLAY (à paraître) Habiter Floribec. Voisinage et communauté. Revue internationale d’études canadiennes.
LEVITT, P. (2001). The Transnational Villagers, Berkeley et Los Angeles, University of California Press.
MORISSONNEAU, C. (1983). « Le peuple dit ingouvernable du pays sans bornes: mobilité et identité québécoise », dans Dean Louder et Éric Waddell (dir.), Du continent perdu à l’archipel retrouvé: le Québec et l’Amérique française, Sainte-Foy, Presses de l’Université Laval.
TREMBLAY, R. (2003) « Le déclin de Floribec », Téoros, 22 (2).
TREMBLAY, R. (2006). Floribec. Espace et communauté, Ottawa, Presses de l’Université d’Ottawa.
TREMBLAY, R. (2008) Le Floribec éphémère, dans Dean Louder et Éric Waddell (dir.), La Franco-Amérique : traces et enracinement, Québec, Septentrion.
TREMBLAY, R et O’REILLY, K (2004) « Les communautés touristiques transnationales. » Revue de Tourisme/Tourism Review, 59 (3).
