New Internal Revenue Service migration data, compiled by the Tax Foundation, confirms that more people are again moving to Florida than are moving out. After a loss in the number of 30,000 domestic migrants ("exemptions") in 2008-9 as indicated on tax returns, Florida added 30,000 in 2009-10. This is still a far lower net migration than before the burst of the housing bubble, but is an indication that Florida has returned to growth. Florida’s migration turnaround was recently noted in new American Community Survey data (see Domestic Migration: Returning to Normalcy?). Additionally, in 2009-10, Florida ranked third out of the 50 states and DC in personal income gains from net domestic migration relative to 2009. Only Montana (#1) and South Carolina (#2) did better.
Category: Demographics
-
Iowa: Not Just the Elderly Waiting to Die
Stephen Bloom, a journalism professor at the University of Iowa, created quite a stir in Iowa this week with a piece in The Atlantic describing his unique observations on rural Iowa as evidence that it doesn’t deserve its decidedly powerful hand in the vote for the president. After the article appeared last Friday both his colleagues and the massive student body of the state he so harshly criticizes are returning the favor.
Mr. Bloom’s writing is not offensive because it contains no truths, but because has over-generalized our collective character as unfalteringly Christian, complacent, ignorant, and uncultured. He continually describes a sense of delusion that is rampant in the Iowa populace. And, of course, since we’re from Iowa we must have met a meth head before, right?
When I was a four year old, my parents picked up everything they had and transplanted their lives from Phoenix all the way to Northwest Iowa. I was young, but I can still remember the farm that we originally settled in– it was the kind of farm you see in a painting: a one-level home, a big red barn, two silos for storage, a small thicket grove with a number of deer, and even a fenced-in area for hogs. I was living the rural Iowa dream.
Eventually, when I was around seven, our next settlement of choice was a (very) small town only a couple of miles from the farmhouse. The city’s population had around 200 people, the vast majority of them at least 50 years old, and a main street littered with old buildings and storefronts of yesterday that had been abandoned over the years since their mid-century inceptions. People didn’t move to this town; instead those living in it would die from old age, or, in my case, move away in hopes of seeing something bigger.
I’m well aware of the stereotypes of Iowans: we’re wannabe hicks, we’re uncultured, we hunt, we tend to our rolling hills of corn and beans, we all drive Ford trucks because they “ride better” than anything else. I’ve grown up with people that fulfill these stereotypes here and there and I am no stranger to small town life, but not every soul that I have met in this state fits the profile as Professor Bloom posits. Far from it.
Expectedly, Bloom’s portrayal of Iowans hasn’t exactly had a warm reception. On Tuesday, the Daily Iowan’s front page had perhaps the most outrageous quote that Bloom’s article included, labeling rural Iowans as nothing more than “the elderly waiting to die, those too timid (or lacking in educated [sic]) to peer around the bend for better opportunities, an assortment of waste-toids and meth addicts with pale skin and rotted teeth, or those who quixotically believe, like Little Orphan Annie, that ‘The sun’ll come out tomorrow.’”
Yesterday, Sally Mason, the president of the University of Iowa, sent out a campus-wide letter reminding the students that she “disagrees strongly with and was offended by Professor Bloom’s portrayal of Iowa and Iowans”. She reminds us of the generosity that Iowans famously possess and of our “pragmatic and balanced” lifestyles. She also goes on to speak about Dubuque’s recent revitalization, the kinds of companies Iowa has attracted (namely Rockwell Collins in Cedar Rapids and Google in Council Bluffs), and the fact that Iowa City, at times called the “Athens of the Midwest”, is designated as the only “City of Literature” in the United States. It seems like Bloom forgot to take any of this into account.
He even goes so far as to berate and categorize Iowa’s Mississippi River cities as “some of the skuzziest cities” that he’s ever visited. Cities such as Burlington, Keokuk, Muscatine, and Davenport all seem to be more degraded, violent, and worse-off than some of the cities he’s used to having seen growing up in New Jersey, a place with cities that are labeled time and time again for their overall “skuzziness.” Has he ever driven to Newark?
It seems that Bloom’s laughable interpretation of his years in Iowa have a few rings of truth that I’ve definitely witnessed, but to completely overgeneralize a people into one category assuming it’s only an “Iowa thing” is inappropriate and crude. Is he correct about anything at all? The numbers show that he is off base about the state as a whole.
The Mississippi River cities’ so-called blight is similar to many other hard hit industrial cities in the Midwest, perhaps on a similar scale to areas in Michigan (which was the only state in the past Census to actually lose population) where Bloom has holed up most recently as a visiting professor for the University of Michigan. Even so, Iowa has the 11th lowest household poverty rate in the nation. So much for widespread blight.
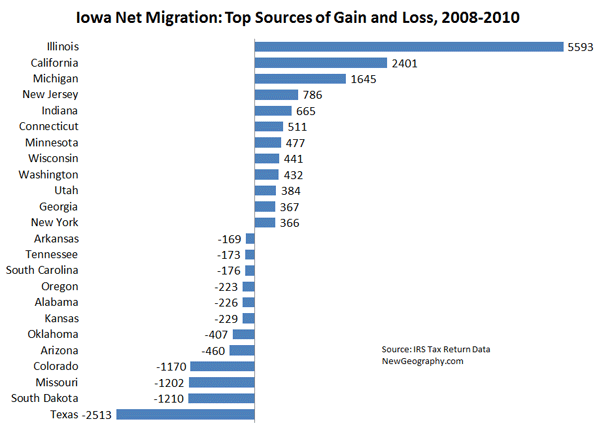
The state’s brain drain is always a topic of discussion. There has been a very noticeable population shift of rural to urban in the past half-century which was especially fueled by the farming crisis in the 80s, but this trend holds out empirically for all Midwestern states. The problem is that a look at the numbers doesn’t confirm major outmigration. Iowa saw a net gain from other states according to IRS tax return data from 2008-2010. In fact, the net gain from the top 12 source states – states like Illinois, California, and Michigan – in the last three years is 40% higher than the net loss to the top destinations. If Iowans are “fleeing” anywhere, it’s to places like Texas, the largest gainer, and second placed South Dakota which the professor would no doubt like even less.
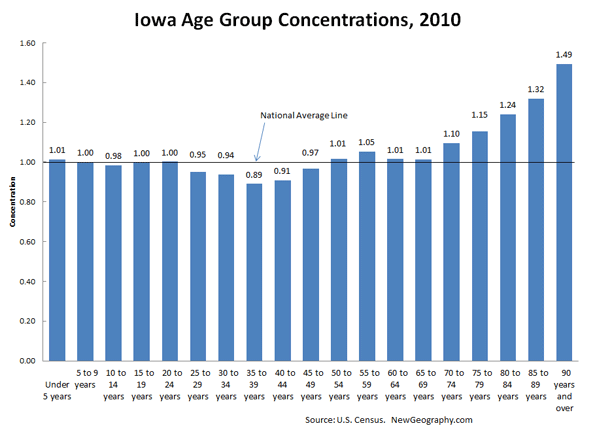
Iowa does have high concentrations of people over age 70, but that group makes up about 10% of the total population, not enough to skew the other age groups much from the national average. Iowa has an average number of children, and it lags the most in 35-44 year olds: about 10%. This older group skews the state’s educational attainment numbers as well. Iowa’s young workforce is well educated, ranking 11th of all states in residents with at least an associate’s degree. Bloom’s claim that the state is uneducated is simply not true.
The median age of those living in rural areas is 41.2 while urbanites are relatively young at 35.8. To further add to these negative trends, rural areas have a job growth rate of -6% in the past three years, these numbers mainly fueled by the recession. But overall state jobs are is down 2.8% since January 2008, better than 35 other states. Clearly Iowans are not lazy and giving up.
Four Iowa cities were even included on CNN Money’s Best Cities to Live in 2011. (This includes the Mississippi River city of Bettendorf.) The state and its cities are also a great place to do business, according to Forbes. In 2010, Des Moines was ranked first, with Cedar Rapids at 13th beating out even a few Texan heavyweights, including Houston, Dallas, and Fort Worth that have been lauded for having a plethora of jobs. The 2011 list puts Des Moines in second place and Cedar Rapids in 11th. It seems Iowa isn’t as economically distraught as Bloom leads us to believe.
Bloom comes off as nothing more than an ignorant, smug “city-slicker” (a word that Iowans apparently use to describe Obama) who sees the state through an apparently very blurry window. He claims to have seen all 99 counties of Iowa, but how can he possibly paint a portrait of the state that is so absurdly misguided after living here for so long? If this is what they teach in journalism school, perhaps our skepticism of the media may be better placed than even we suspect.
Jacob Langenfeld is a senior undergraduate at the University of Iowa studying economics and geography.
Mark Schill contributed demographic analysis to this piece.
Des Moines photo courtesty of BigStockPhoto.com.
-
Let’s Level the Inter-generational Playing Field
With President Obama’s speech in Osawatomie, Kansas decrying the growing economic inequality and lack of upward mobility in America, the issue has finally arrived at the center of this year’s campaign debates. While most discussions of this growing inequality focus on the gap between America’s poorest and richest citizens, a recent report by the Pew Foundation highlights how the same economic trends over the last two and a half decades have also widened the wealth gap between the oldest and youngest Americans to the highest levels in history.
In a time of great political unrest and economic anxiety, this inter-generational wealth gap has the potential to throw gasoline on an already white hot fire. Only by understanding the sources of this increasing disparity can the country develop policies that will help to close the gap and create a fairer, less economically stratified society.
Drawing on data provided by the U.S. Census Bureau’s Survey of Income and Program Participation (SIPP), Pew documents the tectonic shifts that have occurred in households’ net worth based upon age between 1985 and 2009. During this time, the average net worth of households headed by those under 35 fell from $11,521 to just $3,662, a drop of 68%. During the same period, the net wealth of households, as measured by adding up the value of all assets owned minus liabilities such as mortgages or credit card debt associated with those assets, headed by those over 65 increased by 42%, from $120,457 to $170,494 (all figures are expressed in 2010 dollars).
Of course younger households have always been less wealthy than older ones, since the heads of those households haven’t had a lifetime to acquire wealth. In 1984, this effect of age on household wealth meant that senior citizen households had, on average, ten times the wealth of those headed by people younger than 35. However, the enormous generational shift in household wealth that occurred in the intervening twenty-five years meant that, by 2009, the net worth of senior citizen households was 47 times greater than younger households. The resulting disparities in economic well-being are reflected in each generation’s perception of its own economic situation.
Those Americans over 65 in 2009 are members of what generational historians call the Silent Generation. Only 25% of Silents expressed any dissatisfaction with their personal financial situation that year, a percentage that did not increase in the next two years of the Great Recession.
By contrast, 36% of people under 35 in 2009 – mostly members of the Millennial Generation – expressed dissatisfaction with their individual finances in 2009, a number that rose to 39% in 2011. But the biggest jump in dissatisfaction with personal finances between 2009 and 2011 occurred among the next older cohort, who are considered to be members of Generation X. In 2009, only 30% of Xers felt dissatisfied, a number that shot up to 42% in 2011. Finally, 32% of the Baby Boom generation, born from 1946 to 1964 and approaching their retirement years in 2009, were dissatisfied with their personal financial situation, a number that rose only to 39% by 2011.
One of the reasons behind this disparity of financial and economic concern among generations lies with the different impact the nation’s housing market has had on each generation between 1985 and 2009. The great housing price collapse that began in 2008 had little impact on Millennials, only 18% of whom currently own their own home. By comparison, 57% of Gen Xers own their own home. Three-fourths of them bought after 2000 when housing prices began to soar. As a result, about one in five members of Gen X now say their home mortgage is under water, with the balance owed greater than the value of the house. By comparison, only 13% of Boomers and a miniscule 4% of Silents, most of whom bought homes well before the crash, report having under water mortgages. In fact, if it weren’t for the overall rise in housing prices since 1984 that Silents were able to take advantage of, that generation’s net worth would have fallen by a third in the twenty-five years since, instead of rising by 42%. Clearly, to improve Gen X’s attitudes toward the economy and reduce the inter-generational wealth gap, something must be done to fix the nation’s housing market.
For older generations – Boomers facing retirement and Silents already enjoying their new life – housing is not an especially large concern. Retirement savings based on stock market valuations and/or interest rates and the certainty of pension payments are clearly a much bigger issue with these generations. Almost two-thirds of Boomers believe they may have to defer their retirement beyond 65 because of the decline in their savings and net worth, with about one in four now expecting to work until at least 70. While the stock market has almost fully recovered from the 2008 crash, for those counting on a more interest-oriented set of retirement payouts from bonds or CDs, years of rock bottom interest rates, designed by the Federal Reserve to stimulate the housing market and help the economy recover, have made these investments problematic at best. In some ways, economic policies that are designed to help Gen X with their housing challenges offer older generations scant comfort, and in certain instances actually exacerbate their concerns over their personal finances.
Millennials diminished sense of economic opportunity remains focused almost entirely on the job market. About two-thirds of Millennials are employed but only slightly half of those are working full-time. Almost two-thirds of Millennials without a job are looking for work. Unemployment among 16-24 year olds rose to 19.1% by the fourth quarter of 2009, a full eight points higher than in 2007 before the crash. For all other generations, unemployment has gone up on average by only 5 points during the same time period. It seems too obvious to be worth stating, but the best way to increase Millennials’ wealth is to create an economy where they can all find jobs.
Anxiety that the nation’s economy is only working for the wealthiest drives much of the overall feeling of fear, uncertainty and doubt that pervades the nation’s political debate. But an examination of household wealth suggests the remedy to this disease varies by generation.
Senior citizens turned out in record numbers in the 2010 election to decry the policies of the Obama administration, but it would appear from both the economic and attitudinal data that most of them are more interested in fighting to hang on to what they have or in resisting other societal changes than in expressing any dissatisfaction with their own personal financial situation. Boomers complain about what has happened to their plans for retirement, but it is hard to see how fixing entitlements by raising the retirement age, or cutting the overly generous pensions of public employees will do anything to impact their own retirement prospects directly. To really close the generational wealth gap, policies should be adopted which raise the economic well being of America’s two youngest generations, rather than focusing on those who are already relatively better off.
To bring up the least wealthy of the nation’s households to levels closer to those more fortunate would require taking much more aggressive steps than Washington has so far been willing to consider. This might require expanding the scope and size of government, something older generations especially are steadfastly resisting. This inter-generational debate over the nation’s “civic ethos,” driven by the differing economic circumstances of each generation, will be and ought to be the fundamental issue of the campaign – precisely where President Obama’s speech in Osawatomie, Kansas placed it.
Morley Winograd and Michael D. Hais are co-authors of the newly published Millennial Momentum: How a New Generation is Remaking America and Millennial Makeover: MySpace, YouTube, and the Future of American Politics and fellows of NDN and the New Policy Institute.
-
Los Angeles Gets Old
During the last decade, Los Angeles County grew by about 300,000, an insignificant figure for a region of 9.8 million people. As in the previous decade, the slight increase in population was made possible by an increase in the number of Latinos (10.5%) and non-Hispanic Asians (18%). But overall growth was slowed by a sharp decline in non-Hispanic white (7.4%) and non-Hispanic African American (8.5%) populations (see Table 1).
Less recognized, immigration, the demographic fuel that previously fed LA’s economic engine also has slowed down. With little in-migration from other states, we are beginning a new phase in our trajectory: aging together, native and foreign born.
This is a crucial moment in our history. We could be at the end of the period where Los Angeles thrived as a destination of choice for the working-age population and may simply begin to age, much like our counterparts in the Northeast. Is LA finally out of its “sunbelt” phase and entering its graying era?
Demographic Changes – An Overview
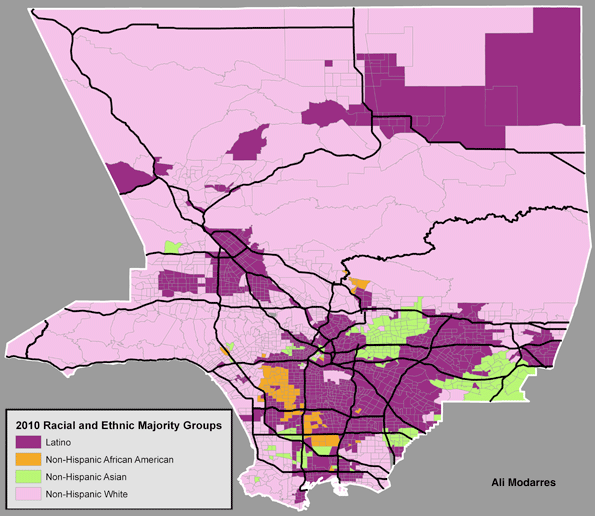
As Figure 1 illustrates, the geography of race and ethnicity has changed little over the course of the last few decades. Latinos have retained or expanded their majority status in a significant number of neighborhoods. Asian and Asian-American neighborhoods are highly concentrated in an area known as the San Gabriel Valley, while the non-Hispanic white population continues to dominate in areas outside the central city, with the exception of a few tracts in and around the Figueroa corridor (in downtown LA) connected with recent downtown development. Non-Hispanic African Americans have lost their majority status in some South LA neighborhoods where Latinos have come to outnumber them.
Immigration
California’s declining immigration can be attributed to a tarnished economic image of the state and its anti-immigrant sociopolitical environment. This might seem puzzling to many residents of Los Angeles, who live a very immigrant-rich environment.
First, are immigrants still coming to Los Angeles at the same rate as before)?
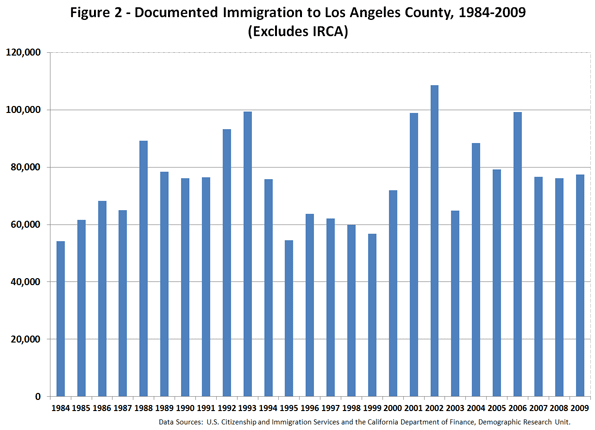
Figure 2 helps provide the answer to this question, by illustrating the annual immigration patterns to the county. The 2007–2009 period has seen less annual immigration, but the nearly 80,000 immigrants per year is as many or more than those from 1994 to 2000. Comparing the period of 1990–1999 with 2000–2009 illustrates that, during the last ten years, a larger number of immigrants have arrived in the county (718,166 versus 841,325).
But what seems clear is that if they are arriving in LA, fewer are staying for the long term. This secondary migration can be made visible by comparing the number of immigrants arriving in Los Angeles County with a tabulation of LA’s foreign-born population by year of U.S. entry.
The 2009 American Community Survey shows that, among the nearly 3.5 million foreign-born residents of the county, 909,692 arrived between 1990 and 1999 and 811,808 between 2000 and 2009 (see Table 2). Comparing these figures with the number of immigrants who arrived in Los Angeles during the same periods from their countries of origin (718,166 in the 1990s and 841,325 in the 2000s) indicates that we attracted more immigrants from the 1990–1999 cohort (a net gain of close to 192,000) and lost members of the 2000–2009 cohort (about 30,000).
Clearly the county lost its foreign-born population to other regions of the state and the nation. This is somewhat troubling since it reveals that the allure of the region may be waning among the working-age immigrant population. In fact, as Table 2 portrays, Los Angeles has gradually become home to an old-stock immigrant population, where the foreign-born population hails from earlier eras (i.e., the 1980s and the 1990s).
Does this mean that the foreign-born population is also getting older? The answer to this question is complicated. Based on 2009 American Community Survey (ACS) data, the average age of the foreign-born population in the country is slightly over 44, with 70% of the population falling between the ages of 27 and 62. This suggests that the immigrant population is a bit older than commonly expected. Also, with fewer than 6% of the foreign-born population being younger than age 18, it is clear that the number of children arriving is significantly less than often assumed.
Therefore, it may be crucial to ask a pointed question. Does Los Angeles have the appropriate economic infrastructure to attract new immigrant while keeping more of our working age immigrants? Considering the economic circumstance of the recent immigrants, the cost of living in Los Angeles, and the current economic and job environment, it should not come as a shock that many are leaving Los Angeles. After all, this is exactly what the native-born population has done throughout the history of the United States: leaving harsh economic conditions for better opportunities in other cities and states.
Native born
What about the native born population?
Surprisingly, with an average age of slightly over 30 years, the native-born population is younger than its foreign-born counterpart. This becomes clear as we compare the age structure of both groups. Among the working-age population, the foreign-born outnumber the native-born. However, among young and old residents, the native-born population is a larger group. Before jumping to any particular conclusion, we should be reminded that the native-born population includes a large number of individuals whose parents are immigrants. This means that the younger population is multi-racial and multi-ethnic in character. To illustrate this, I provide a detailed analysis of the native-born population in the following paragraphs.
As Table 3 illustrates, among those 0–19 years old (the first two columns), Latinos outnumber other racial and ethnic groups. This is more pronounced among those 0–9 years old. However, in every age category older than 19, the non-Hispanic white population outnumbers others. Interestingly, it is only among the age 60+ residents that non-Hispanic African Americans outnumber Latinos (124,587 versus 119,676). This information, combined with what appears on Figure 3, suggests our foreign-born population is aging and new immigrants are not arriving fast enough to keep their average age low. But at the same time their children (particularly among Latinos) are clearly a significant portion of the younger and the working-age population. This illustrates that our economy and social structure operate largely based on the dividends from past decades of high immigration. Without a renewed immigration pattern that expands the working-age population, our economic prospects are somewhat dubious.
LA’s Demographic Future
Table 4 provides a brief glimpse to our demographic future. Here we have the average age for the native-born population by race and ethnicity. With an average age of 20.6, native-born Latinos are younger than the non-Hispanic native- born population (at an average of 37.4). In fact, a significant majority of native-born Latinos are under age 40. This is in stark contrast to foreign-born Latinos who are, on an average, in their early 40s. Compared with an average age of 20.6 among native-born Latinos, the age gap between the two groups becomes clear, further highlighting the decline of younger Latino immigrants in Los Angeles.
Clearly the demographic path of Los Angeles County has been altered. We are becoming older and more native born. Blaming immigrants, the easy game of the last two decades, can no longer explain our social and economic ills. We need to embrace who we are and what our economy, politics, and collective decision making have brought to our doorsteps. It may be difficult to accept that we are getting older, but our region is losing young people as well. Table 5 contains the last bit of information we need to understand about how we became a region with a graying population.
Between 2000 and 2010, we lost residents in five age categories: 0–4, 5–9, 10–14, 25–34, and 35–44. This suggests that – as we have seen in other high-cost urban regions – young families are leaving! Among the working-age population, we were able to hang on to those 15–24 and age 45 and older. These individuals are from older families whose young adults (15–24) may or may not choose to stay in the region. With declining immigration and departing younger families, the Los Angeles region is on its way to becoming a much grayer place.
A Brief Note on Policy Options
To be sure, there is nothing wrong with aging. It happens to the best of us. However, one needs to plan for it. Los Angeles County can develop policies that benefit a working-age population and its pending retirement needs (or rethink why it has lost its luster to immigrants and the native-born population.
Unless conditions change, the ambitious children of immigrants will surely behave like other native-born citizens and look to regions where economic prosperity is most likely. High cost of housing, a less than satisfactory educational system, inadequate health services, and an inefficient transportation system might drive the second generation young families to other region.
The solution to the growing loss of our productive population does not lie in building more condos and subsidizing iconic places, such as downtown LA. We need more jobs a burgeoning economy to keep productive people here. This needs to be tied to the integration of immigrants and their children. Immigrants are not different from those who were born here. They also want the best quality of life they can get: for themselves and their children. If Los Angeles cannot provide that, perhaps other cities and regions can.
Table 1 – Racial and Ethnic Structure of Los Angeles County, 2000-2010 Population by Race and Ethnicity 2000 2010 Change 2000-2010 % Changes 2000-2010 Population Percent Population Percent Total 9,519,338 100.0 9,818,605 100.0 299,267 3.1 Not Hispanic or Latino 5,275,851 55.4 5,130,716 52.3 -145,135 -2.8 Not Hispanic or Latino; White alone 2,946,145 30.9 2,728,321 27.8 -217,824 -7.4 Not Hispanic or Latino; Black or African American alone 891,194 9.4 815,086 8.3 -76,108 -8.5 Not Hispanic or Latino; American Indian and Alaska Native alone 26,141 0.3 18,886 0.2 -7,255 -27.8 Not Hispanic or Latino; Asian alone 1,123,964 11.8 1,325,671 13.5 201,707 17.9 Not Hispanic or Latino; Native Hawaiian and Other Pacific Islander alone 24,376 0.3 22,464 0.2 -1,912 -7.8 Not Hispanic or Latino; Some other race alone 18,859 0.2 25,367 0.3 6,508 34.5 Not Hispanic or Latino; Two or more races 245,172 2.6 194,921 2.0 -50,251 -20.5 Hispanic or Latino 4,243,487 44.6 4,687,889 47.7 444,402 10.5 Hispanic or Latino; White alone 1,676,614 17.6 2,208,178 22.5 531,564 31.7 Hispanic or Latino; Black or African American alone 25,713 0.3 41,788 0.4 16,075 62.5 Hispanic or Latino; American Indian and Alaska Native alone 42,330 0.4 53,942 0.5 11,612 27.4 Hispanic or Latino; Asian alone 10,299 0.1 21,194 0.2 10,895 105.8 Hispanic or Latino; Native Hawaiian and Other Pacific Islander alone 2,845 0.0 3,630 0.0 785 27.6 Hispanic or Latino; Some other race alone 2,244,066 23.6 2,115,265 21.5 -128,801 -5.7 Hispanic or Latino; Two or more races 241,620 2.5 243,792 2.5 2,172 0.9 Source: U.S. Census Bureau, 2000 and 2010 Table 2 – Foreign Born Population in Los Angeles County by Decade of Entry in the U.S. Decade of entry Population Percent Before 1950 24,568 0.7 1950-1959 67,127 1.9 1960-1969 182,618 5.2 1970-1979 569,689 16.3 1980-1989 934,034 26.7 1990-1999 909,692 26.0 2000-2009 811,808 23.2 Total 3,499,536 100 Source: U.S. Census Bureau, American Community Survey, 2009 Note: Selected Data is from PUMAs 4500 to 6126 Table 3 – Race and Ethnicity among Native Born Population, by Age – Los Angeles County Race and Ethnicity 0 – 9 10-19 20-29 Non-Hispanic Latino Non-Hispanic Latino Non-Hispanic Latino White alone 235,638 433,253 245,522 374,450 299,123 233,629 African Americans 97,213 4,494 115,954 3,908 116,017 4,569 Native Americans 2,010 5,093 1,930 5,102 4,179 3,720 Asian 106,150 2,007 98,866 2,413 76,293 2,094 Pacific Islander 2,806 150 4,262 479 3,141 155 Other 3,989 360,581 4,908 317,786 2,830 203,948 Two ore more races 44,079 33,447 31,733 30,319 28,443 19,189 Total 491,885 839,025 503,175 734,457 530,026 467,304 Race and Ethnicity 30-39 40-49 50-59 Non-Hispanic Latino Non-Hispanic Latino Non-Hispanic Latino White alone 293,983 138,832 348,042 90,154 346,481 57,596 African Americans 97,312 2,297 116,845 1,065 99,881 816 Native Americans 2,180 2,557 2,371 1,872 4,205 2,249 Asian 39,582 1,992 22,476 772 20,151 515 Pacific Islander 3,740 354 2,149 157 1,556 57 Other 2,182 103,856 958 53,540 742 36,311 Two ore more races 20,435 11,770 13,319 7,022 10,131 4,695 Total 459,414 261,658 506,160 154,582 483,147 102,239 Race and Ethnicity 60+ Total Total Non-Hispanic Latino Non-Hispanic Latino White alone 522,510 80,945 2,291,299 1,408,859 1,821,615 African Americans 124,587 1,011 767,809 18,160 342,155 Native Americans 1,883 1,483 18,758 22,076 22,034 Asian 32,665 845 396,183 10,638 287,823 Pacific Islander 2,395 147 20,049 1,499 10,993 Other 1,029 30,085 16,638 1,106,107 894,042 Two ore more races 10,254 5,160 158,394 111,602 187,210 Total 695,323 119,676 3,669,130 2,678,941 3,565,872 Source: U.S. Census Bureau, ACS 2009 Table 4 – Average Age by Race and Ethnicity, Los Angeles County Race Latino Non-Hispanic All Average Age Population Std. Deviation Average Age Population Std. Deviation Average Age Population Std. Deviation White 21.7 1,408,859 18.9 41.2 2,291,299 23.0 33.7 3,700,158 23.5 African American 23.2 18,160 18.0 36.2 767,809 22.1 35.9 785,969 22.1 Native American 26.6 22,076 20.0 36.3 18,758 20.1 31.1 40,834 20.6 Asian 26.9 10,638 19.0 24.2 396,183 20.8 24.2 406,821 20.8 Pacific Islander 28.5 1,499 18.7 31.2 20,049 19.8 31.0 21,548 19.7 Other 19.0 1,106,107 16.0 23.5 16,638 18.3 19.1 1,122,745 16.1 Two or more races 21.2 111,602 17.7 24.7 158,394 19.7 23.2 269,996 19.0 All 20.6 2,678,941 17.8 37.4 3,669,130 23.2 30.3 6,348,071 22.6 Source: U.S. Census Bureau, ACS 2009 Table 5 – Age Composition and Changes from 2000 to 2010, Los Angeles County Age 2000 2010 Change % Change Under 5 years 737,631 645,793 -91,838 -12.5 5 to 9 years 802,047 633,690 -168,357 -21.0 10 to 14 years 723,652 678,845 -44,807 -6.2 15 to 19 years 683,466 753,630 70,164 10.3 20 to 24 years 701,837 752,788 50,951 7.3 25 to 34 years 1,581,722 1,475,731 -105,991 -6.7 35 to 44 years 1,517,478 1,430,326 -87,152 -5.7 45 to 54 years 1,148,612 1,368,947 220,335 19.2 55 to 59 years 389,457 560,920 171,463 44.0 60 to 64 years 306,763 452,236 145,473 47.4 65 to 74 years 492,833 568,470 75,637 15.3 75 to 84 years 324,693 345,603 20,910 6.4 85 years and over 109,147 151,626 42,479 38.9 Total 9,519,338 9,818,605 299,267 3.1 Source: U.S. Census Bureau, 2000 and 2010 Ali Modarres is an urban geographer at California State University, Los Angeles. This report is based on a longer article appearing in the 2011 edition of the journal of California Politics and Policy.
Photo by Bigstockphoto.com
-
Wanted: Blue-Collar Workers
To many, America’s industrial heartland may look like a place mired in the economic past—a place that, outcompeted by manufacturing countries around the world, has too little work to offer its residents. But things look very different to Karen Wright, the CEO of Ariel Corporation in Mount Vernon, Ohio. Wright’s biggest problem isn’t a lack of work; it’s a lack of skilled workers. “We have a very skilled workforce, but they are getting older,” says Wright, who employs 1,200 people at three Ohio factories. “I don’t know where we are going to find replacements.”
That may sound odd, given that the region has suffered from unemployment for a generation and is just emerging from the worst recession in decades. Yet across the heartland, even in high-unemployment areas, one hears the same concern: a shortage of skilled workers capable of running increasingly sophisticated, globally competitive factories. That shortage is surely a problem for manufacturers like Wright. But it also represents an opportunity, should Americans be wise enough to embrace it, to reduce the nation’s stubbornly high unemployment rate.
Driving the skilled-labor shortage is a remarkable resurgence in American manufacturing. Since 2009, the number of job openings in manufacturing has been rising, with average annual earnings of $73,000, well above the average earnings in education, health services, and many other fields, according to Bureau of Labor Statistics data. Production has been on the upswing for over 20 months, thanks to productivity improvements, the growth of export markets (especially China and Brazil), and the lower dollar, which makes American goods cheaper for foreign customers. Also, as wages have risen in developing countries, notably China, the production of goods for export to the United States has become less profitable, creating an opening for American firms. The American Chamber of Commerce in Beijing expects China’s “low-wage advantage” to be all but gone within five years.
It’s also true that American industry hasn’t faded as much as you might think. Though industrial employment has certainly plummeted over the long term, economist Mark Perry notes that the U.S. share of the world’s manufacturing output, as measured in dollars, has remained fairly stable over the last 20 years, at about one-fifth. Indeed, U.S. factories produce twice what they did back in the 1970s, though productivity improvements mean that they do it with fewer employees. Recent export growth has particularly helped companies producing capital equipment, such as John Deere and Caterpillar, and many industrial firms are even hiring more people for their plants, especially in the Midwest, the Southeast, and Texas.
One area in which industry is positively roaring: firms that service the thriving oil and natural-gas industries, from Montana and the Dakotas to Pennsylvania. In Ohio alone, there are already 65,000 wells, with more on the way, says Rhonda Reda, executive director of the Ohio Oil and Gas Energy Education Foundation—while a new finding, the Utica shale formation in eastern Ohio, could hold more than $20 billion worth of natural gas. As a result, Karen Wright’s business—selling compressors for natural-gas wells—has been soaring, leading her to add more than 300 positions over the past two years. “There’s a huge amount of drilling throughout the Midwest,” Wright says. “This is a game changer.”
Wright isn’t alone. Firms throughout the Midwest are moving aggressively to meet the demand for natural-gas-related products. Take the $650 million expansion of the V&M Star steel mill in Youngstown, Ohio, which builds pipes for transporting gas. The expansion will add 350 permanent jobs to the factory after it’s completed next year.
As the natural-gas boom continues, it could have another effect beneficial to industry: keeping energy prices low, which will give American manufacturers a leg up on their global rivals. Companies in the business-friendly midwestern and Plains states will profit the most, while New York and California—though each has ample fossil-fuel resources—will probably be too concerned with potential environmental problems to cash in.
The industrial resurgence comes with a price: a soaring demand for skilled workers. Even as overall manufacturing employment has dropped, employment in high-skill manufacturing professions has soared 37 percent since the early 1980s, according to a New York Federal Reserve study. These jobs can pay handsomely. An experienced machinist at Ariel Corporation earns over $75,000, a very good wage in an area where you can buy a nice single-family house for less than $150,000.
A big reason for the demand is changes on the factory floor. At Ariel, Wright points out, the operator of a modern CNC (computer numerical control) machine, which programs repetitive tasks such as drilling, is running equipment that can cost over $5 million. A new hire in this position must have knowledge of programming, metallurgy, cutting-tool technology, geometry, drafting, and engineering. Today’s factory worker is less Joe Six-Pack and more Renaissance man.
So perhaps it isn’t surprising that American employers are hard-pressed to find the skilled workers they need. Delore Zimmerman, the CEO of Praxis Strategy Group (for which I consult), observes that this shortage extends to virtually any industrial operation. In his hometown of Wishek, North Dakota, whose population is just 800, one company making farm machinery has 17 openings that it can’t fill. Skilled-labor shortages grip the whole of this energy-rich state. Demand for skilled workers in the North Dakota oilfields—from petroleum engineers to roustabouts—exceeds supply by nearly 30 percent. The shortage of machinists is 10 percent. “The HELP WANTED signs in North Dakota are as common as FOR SALE signs in much of the rest of the country,” Zimmerman reports.
“There are very few unskilled jobs any more,” says Wright. “You can’t make it any more just pushing a button. These jobs require thinking and ability to act autonomously. But such people are not very thick on the ground.” Among the affected industries will be the auto companies, which lost some 230,000 jobs in the recession. David Cole, chairman of the Center for Automotive Research, predicts that as the industry tries to hire more than 100,000 workers by 2013, it will start running out of people with the proper skills as early as next year. “The ability to make things in America is at risk,” says Jeannine Kunz, director of professional development for the Society of Manufacturing Engineers in Dearborn, Michigan. If the skilled-labor shortage persists, she fears, “hundreds of thousands of jobs will go unfilled by 2021.”
The shortage of industrial skills points to a wide gap between the American education system and the demands of the world economy. For decades, Americans have been told that the future lies in high-end services, such as law, and “creative” professions, such as software-writing and systems design. This has led many pundits to think that the only real way to improve opportunities for the country’s middle class is to increase its access to higher education.
That attitude is a relic of the post–World War II era, a time when a college education almost guaranteed you a good job. These days, the returns on higher education, particularly on higher education gained outside the elite schools, are declining, as they have been for about a decade. Earnings for holders of four-year degrees have actually dropped over the past decade, according to the left-of-center Economic Policy Institute, which also predicts that the pattern will persist for the foreseeable future. In 2008, more than one-third of college graduates worked at occupations such as waiting tables and manning cash registers, traditionally held by non–college graduates. Mid-career salaries for social work, graphic design, and art history majors are less than $60,000 annually.
The reason for the low rewards is that many of the skills learned in college are now in oversupply. A recent study by the economic forecasting firm EMSI found that fewer computer programmers have jobs now than in 2008. Through 2016, EMSI estimates, the number of new graduates in the information field will be three times the number of job openings.
There’s a similar excess of many postgraduate skills. Take law, which flourished in a society that had easy access to credit. Now, with the economy tepid, law schools are churning out many more graduates than the market wants. Roughly 30 percent of those passing the bar exam aren’t even working in the profession, according to a survey by the National Association for Law Placement. Another EMSI study indicates that last year, in New York State alone, the difference between the number of students graduating from law school and the number of jobs waiting for them was a whopping 7,000.
The oversupply of college-educated workers is especially striking when you contrast it with the growing shortage of skilled manufacturing workers. A 2005 study by Deloitte Consulting found that 80 percent of manufacturers expected a shortage of skilled production workers, more than twice the percentage that expected a lack of scientists and engineers and five times the percentage that expected a lack of managerial and administration workers. “We don’t just need people—we need people who can meet our standards,” worries Patrick Gibson, a senior manufacturing executive at Boeing’s plant in Heath, Ohio.
Some of Gibson’s fellow manufacturers blame the shortage of skilled workers on the decline of vocational education, which has been taking place for two decades now. Such training is unpopular for several reasons. For one thing, many working-class and minority children were once steered into vocational programs even if they had aptitude for other things, an unfair practice that many people haven’t forgotten. Today’s young people, moreover, tend to regard craft work—plumbing, masonry, and carpentry, for instance—as unfashionable and dead-end, no doubt because they’ve been instructed to aspire to college. “People go to college not because they want to but because their parents tell them that’s the thing to do,” says Jeff Kirk, manager of human relations at Kaiser Aluminum’s plant in Heath, Ohio. “Kids need to become aware of the reality that much of what they learn in school is not really needed in the workplace. They don’t realize a pipe fitter makes three times as much as a social worker.”
Fortunately, there are signs that some schools are getting that message and passing it along to their students. Funded by industry sources, the Houston Independent School District’s Academy for Petroleum Exploration and Production Technology trains working-class, mostly minority high school students in the skills they’ll need to perform high-wage industrial jobs. Tennessee—like Texas, a growth-oriented state—has developed 27 publicly funded “technical centers” that teach skills in just months and carry a far lower price tag than a conventional college does.
Two-year colleges will be crucial to the effort to train skilled workers. One of these schools, Central Ohio Technical College, has recently expanded by 70 welding students and 50 aspiring machinists per year. Many of the college’s certificate programs are designed and partly funded by companies, which figure that they’re making a wise investment. “You have a lot of people sitting in the city doing nothing. They did not succeed in college. But this way, they can find a way up,” says Kelly Wallace, who runs the college’s Career and Technology Education Center.
Such shorter educational alternatives will become ever more important as industrial workers retire. The average skilled worker in the industries supplying the gas boom is in his mid-fifties. “At our plant, you have lots of people with 20 to 30 years’ experience,” says Kirk, who has three high-skill openings that he can’t fill. “But there’s no apprenticeship program—no way to fill the future growth. We are simply running out of people.”
New programs may not produce enough graduates to fill all these openings. But Karen Wright, at least, suspects that more young people will start looking for careers that offer them the prospect of a decent living and less debt. This may not be the postindustrial future envisioned by Ivy League economists and Information Age enthusiasts. But it could spell better times for a country in sore need of jobs.
This piece first appeared at The City Journal.
Joel Kotkin is executive editor of NewGeography.com and is a distinguished presidential fellow in urban futures at Chapman University, and contributing editor to the City Journal in New York. He is author of The City: A Global History. His newest book is The Next Hundred Million: America in 2050, released in February, 2010.
Photograph from BigStockPhoto.com
-
Tilting at (Transit) Windmills in Nashville
As in other major metropolitan areas in the United States, Nashville public officials are concerned about traffic congestion and the time it takes to get around. There is good reason for this, given the research that demonstrates the strong association between improved economic productivity and shorter travel times to work. As Prudhomme and Lee at the University of Paris and Hartgen and Fields at the University of North Carolina Charlotte have shown, metropolitan areas tend to produce more jobs where employees are able to access a larger share of the jobs in 30 minutes.
Ahead in Identifying the Problem: Moreover, Nashville officials are somewhat "ahead of the curve," since traffic congestion is far less severe there than in many other metropolitan areas. Among the 100 largest metropolitan areas in the United States, Nashville ranks 39th in the intensity of its traffic congestion, according to data compiled by INRIX, a traffic information firm. Nashville’s traffic congestion is even better compared to large Western European metropolitan areas .
This favorable traffic situation is despite the fact that Nashville has among the lowest overall transit market shares in the United States or Western Europe (less than 0.5 percent of travel in the metropolitan area). The key to this success, like that of other American metropolitan areas in relation to their international peers is low density and decentralization of employment and other commercial locations.
Missing the Point on Solutions: Yet, it is clear from an editorial in the Nashville Ledger that officials are inclined to embark on an expensive program of transit expansion. Judging from past experience, this offers virtually no hope for reducing traffic congestion or for improving economic productivity in the Nashville metropolitan area.
There are significant misperceptions among local officials about the potential outcomes of proposed commuter rail and bus rapid transit lanes. Perhaps the most important is the assumption that commuter rail and bus rapid transit will reduce travel times. In fact, at the national level, commuting by transit takes approximately twice as long as commuting by single occupant automobile, according to the Census Bureau’s American Community Survey for 2008 to 2010. Rail systems, such as subways (metros) and light rail do little better than transit in general, taking 95% longer than driving alone and two thirds longer than travel by car pools. There is thus virtually no hope that building new transit lines will reduce travel times.
As often happens when costly new transportation programs are proposed, boosters often resort to erroneous information. The Nashville Ledger cites sources that indicate, for example, that suburban Franklin (in Williamson County, to the south of the Nashville-Davidson County core) has one of the longest work trip travel times in the nation. The reality is quite different. Franklin has an average work trip travel time (23.2 minutes), which is less than national average (25.3 minutes) and little more than Nashville-Davidson County (23.0 minutes).
Nashville officials need look no further than their own eastern suburbs for evidence of the inability of new rail systems to reduce work trip travel times. In 2006, Nashville began commuter rail service from Lebanon, in Wilson County to downtown Nashville (the Music City Star). Currently, the Music City Star is locked in an intensive (and successful, according to the latest data) competition for last place in the number of riders among the nation’s commuter rail systems, just edging out Austin’s new lightly used system. Despite being the only first ring county with commuter rail service, Wilson County work trip travel times are longer than in the other first ring counties. Door-to-door travel times, which are the only travel times that count, have not been reduced by the rail line.
Transit is About Downtown: Transit cannot be a comprehensive metropolitan transportation solution remotely competitive with automobile travel times, except to downtown. This is because the quicker, direct transit services from throughout the metropolitan area that are necessary to attract automobile drivers must focus on the most dense and largest employment center, which is downtown. The radial routes that may be capable of serving downtown effectively simply cannot be afforded for other areas of employment. Our research has indicated, the annual cost to provide automobile competitive transit service throughout an urban area in the United States would consume a huge share of the gross domestic product of any such area.
In Nashville, downtown represents little more than 10% of the metropolitan area employment. Moreover, downtown Nashville represents a declining share of private sector employment in the metropolitan area. According to the Census Bureau’s County Business Patterns, the core Nashville ZIP codes that are served by shuttle buses from the commuter rail station lost 11% of their private sector jobs between 2000 and 2009 (latest data available). At the same time, private sector employment grew 4% in the balance of the Nashville metropolitan area (Note 1).
Transit to Suburban Destinations: A Non-Starter: There have been proposals to require new suburban office development to be near transit stops. This would accomplish little, because transit access in areas other than downtown is so sparse. Among major metropolitan areas, nearly 65% of major metropolitan area workers are within walking distance of a transit stop, according to research by the Brookings Institution. But being near a transit stop does not mean that transit provides practical mobility to anything like 65% of jobs. The reality, according to the Brookings Institution data, is that only 6% of jobs in the average metropolitan area of more than 1 million population can be reached by transit by the average resident in 45 minutes, a travel time nearly double that of the average commuter in the Nashville metropolitan area (Note 2). It seems likely that 30 minute transit access for commuters would be as low as 3% at the national level. This demonstrates the so frequently repeated fallacy equating access to a transit stop with usable access to the metropolitan area.
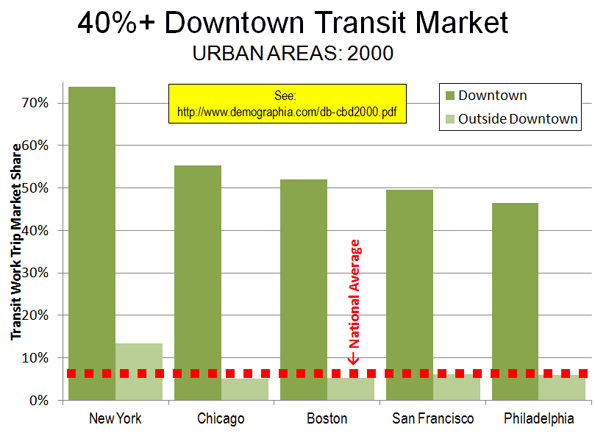
Transit’s Large Downtown Niche Market: There is no question about the effectiveness (though not the cost efficiency) of transit in providing mobility along the most congested corridors to the nation’s largest downtown areas. This transit niche market accounts for nearly 75% of commuting to the Manhattan business core south of 59th Street, and more than 40% to the downtown areas of Brooklyn, Chicago, San Francisco, Boston and Philadelphia. Yet even in these metropolitan areas, where transit mobility is so important to downtown, transit work trip market shares to areas outside downtown are more akin to the national average of 5% (Figure), except in New York.
Of course, Nashville’s downtown is not among these large transit-oriented cores. In 2000, census data indicated that 4% of employees commuted to downtown by transit. Even if all of the ridership on the Music City Star is made up of new downtown transit commuters, that figure would be little changed.
The Need for Stewardship: Before Nashville commits hundreds of millions or billions of tax dollars to expensive transit projects transit in hopes of reducing traffic congestion or travel times, local officials should consider reality. Reducing traffic congestion and travel times are objectives generally beyond transit’s capability. Further, new lines can attract only a small share of commuters, because such a small share of jobs are downtown.
—-
Note 1: County Business Patterns provides employment information that largely excludes government employment. According to Bureau of Labor Statistics data, 53 percent of metropolitan Nashville’s increase in employment was government jobs between 2000 and 2009.
Note 2: Calculated from Brookings Institution data.
Photograph: Downtown Nashville from BigStockPhoto.com
Wendell Cox is a Visiting Professor, Conservatoire National des Arts et Metiers, Paris and the author of “War on the Dream: How Anti-Sprawl Policy Threatens the Quality of Life”
-
Illinois: State Of Embarrassment
Most critics of Barack Obama’s desultory performance the past three years trace it to his supposedly leftist ideology, lack of experience and even his personality quirks. But it would perhaps be more useful to look at the geography — of Chicago and the state of Illinois — that nurtured his career and shaped his approach to politics. Like with George W. Bush and Texas, this is a case where you can’t separate the man from the place.
The Chicago imprint on Obama is unmistakable. His closest advisors are almost all products of the Windy City’s machine politic: ConsigliereValerie Jarrett; his first chief of staff, now Chicago Mayor, Rahm Emanuel; and his current chief of staff, longtime Chicago hackster William Daley, scion of the Windy City’s longtime ruling family.
All these figures arose from a Chicago where corruption is so commonplace that it elicits winks, nods and even a kind of admiration. Since 1973, for example, 27 Chicago Aldermen have been convicted by U.S. Attorney of the Northern District of Illinois.
That culture of corruption affects the rest of the state as well. Both Gov. George Ryan (who served from 1999 to 2003 and and his successor Ron Blagojevich have been convicted a major crimes. So have four of the state’s last eight governors. Blagojevich’s felonies are part and parcel of a political climate that also includes the also newly convicted Antonin “Tony” Rezko, a real estate speculator and early key Obama backer, sentenced late last month to a ten-year prison sentence.
Crony capitalism constitutes the essential element of what the legendary columnist John Kass of the Chicago Tribune has labeled both the “Chicago way” and the “Illinois Combine”, not primarily an ideology-driven movement. The political system, he notes, “knows no party, only appetites.”
Just look at the special favors granted to vested interests while the state has imposed a 65% boost in income taxes for middle class citizens. Companies like Boeing and United, which have head offices in Chicago, get tax breaks and incentives, while everyone else pays the full fare. This game is still afoot. Even as the state deficit persists, other big players such as the CME group, which operates the Chicago Mercantile Exchange, the Chicago Board of Options and Sears are threatening to leave unless their taxes are also lowered.
Thus it’s not surprising then that cronyism has become a hallmark of the Obama administration. Wall Street grandees, a key source of Obama campaign funders in 2008 and again now, have been treated to bailouts as well as monetary policies that have assured massive profits to the “too big to fail” crowed while devastating consumers and smaller banks.
The evolving scandal over “green jobs” — with huge loans handed out to faithful campaign contributors — epitomizes the special dealing that has become an art form in the system of Chicago and Illinois politics. Beneficiaries include longtime Obama backers such as Goldman Sachs, Morgan Stanley and Google. Another scandal is building up around the telecom company LightSquared. This company, financed largely by key Obama donors, appears to have gained a leg up for a huge Pentagon contract due to White House pressure.
If the Chicago system had proven an economic success, perhaps we could excuse Obama for bringing it to the rest of us. Most of us would put up with a bit of corruption and special dealing if the results were strong economic and employment growth.
But the bare demographic and economic facts for both Chicago and Illinois reveal a stunning legacy of failure. Over the past decade, Illinois suffered the third highest loss of STEM (science, technology, engineering and math-related) jobs in the nation, barely beating out Delaware and Michigan. The rest of the job picture is also dismal: Over the past ten years, Illinois suffered the third largest loss of jobs of any state, losing over six percent of its employment.
The state’s demographic picture also is dismal. In the last decade, Illinois lost population not only to sunbelt states such as Texas and Florida but actually managed to have negative migration even with places like California and New York, net losers to virtually everywhere else. In fact, Illinois had a positive net migration with only one major state, Michigan.
Chicago and its Daley dictatorship has been much celebrated in the media – particularly after Obama’s election in everything from the liberal New Yorker to Fast Company, which named Chicago “city of the year” in 2008. The following year, the Windy City was deemed the best city for men by Askmen.com, for offering what it claimed was “the perfect balance between cosmopolitan and comfortable, combining all of the culture, entertainment and sophistication of an internationally renowned destination with an affordable lifestyle and down-to-earth work hard/play hard character.”
Well, you can make that case, unless you happen to be searching for a job. Over the past decade, “the Chicago way” has proven more adept at getting good coverage than creating employment for its residents. In NewGeography’s last cities rankings greater Chicago ranked 41st out of the 51 largest metropolitan areas. Between 2001 and 2011 it actually lost jobs. Since 2007 the region has lost more jobs than Detroit, and more than twice as many as New York. It has lost about as many jobs – 250,000 – as up and comer Houston has gained. In NewGeography’s recent survey of high-tech growth, the Chicago region stood at a dismal 47th among the nation’s 51 largest metropolitan areas.
Overall, Chicago Loop Alliance reports that private sector employment in the Loop, the core of the Chicago downtown area, fell from 338,000 to 275,000 between 2000 and 2010. Chicago’s core has fallen further behind, in capturing high end employment than its traditional rival, New York.
This weak hand is also evident in the region’s strongly negative migration. According to the last Census, Chicago lost more than 200,000 people during the last decade. People are leaving the Chicago area not only for Sun Belt havens but to rising Midwest competitors like Indianapolis and Minneapolis, which offer better business climates, lower housing prices and cleaner governments, says local urban analyst Aaron Renn. Even perennial losers like Los Angeles and New York are net gainers with Chicago.
Given this economic and demographic track record, it’s no big surprise that the City of Chicago and the State of Illinois face enormous fiscal pressures. The city is facing a deficit of about $650 million and the state’s unfunded future liabilities are upwards of $160 billion. The new taxes are on tap for state residents, according to Illinois Public Policy Institute, will cost the average Illinoisan a whole week’s earnings.
One might hope this disastrous record might make President Obama consider taking a different path to governing our country. Yet sadly it appears that acknowledgement of failure is not part of the “Chicago way” — a denial that may cost us dearly in the years ahead.
This piece first appeared at Forbes.com.
Joel Kotkin is executive editor of NewGeography.com and is a distinguished presidential fellow in urban futures at Chapman University, and an adjunct fellow of the Legatum Institute in London. He is author of The City: A Global History. His newest book is The Next Hundred Million: America in 2050, released in February, 2010.
-
The Evolving Urban Form: Quanzhou
Quanzhou? Quanzhou (pronounced "CHWEN-JOE"), despite its urban population that is approaching 5 million this urban area is so unfamiliar to Westerners and the rest of the world as to require an introduction. Quanzhou is a prefecture ("shi") in China’s Fujian province. Fujian is just to the north of Guangdong, home of Guangzhou, Shenzhen and Hong Kong’s former province (before the British) and just to the south of Zhejiang, the large rich province at the south flank of the Yangtze Delta (which abuts Shanghai). Quanzhou is also adjacent to Xiamen, one of the original special economic zones established by the legendary reformer Deng Xiao Ping.
Quanzhou has more than 8 million people in an area similar in size to that of Los Angeles County (4,400 square miles or 11,200 square kilometers). Continuous urbanization spreads through 8 of Quanzhou’s 11 political subdivisions.
In Situ Urbanization: Quanzhou has experienced an unusual urban development pattern. Yu Zhu, Xinhua Qi, Huaiyou Shao and Kaijing He at Fujian Normal University have documented an "in situ" urbanization (or urbanization in place, rather than by expansion from a core) that involves conversion of rural areas in place to urban areas, with agricultural employment being replaced by non-agricultural employment. A similar process has been identified in the Indian state of Kerala and some other prefectures in south China. These could be the first natural examples that defy the expansion of urban areas from a core to the periphery that has been the rule since human kind gathered in settlements.
Quanzhou: The Ultimate: Quanzhou appears to be the most extensive case of in situ urbanization in the world. The older multistoried and single family detached farm houses have become integrated into an urban fabric, though many are falling victim to demolition. Like the economic dynamos of Shenzhen, Dongguan and Guangzhou in Guangdong to the south, Quanzhou has become a major manufacturing center for exports and urbanization is intensifying.
A Low Density Urban Area for China: The result of in situ urbanization has been a very low density urban area by Chinese standards- something more akin to what some Western planners decry as “sprawl”. Currently, the continuous urbanization of Quanzhou covers an area of more than 500 square miles (1,300 square kilometers) with an estimated population of more than 4.5 million people. At more than 9000 persons per square mile (3,500 per square kilometer), Quanzhou is a quarter more dense than Los Angeles, similar in density to Paris but slightly more than half as dense as Shanghai. Even at its core, Quanzhou has comparatively low density compared to other Chinese urban areas. For example, the highest density local jurisdiction (Licheng) has a population density similar to that of the city of San Francisco (approximately 18,000 per square mile or 7000 per square kilometer). The three central jurisdictions of Shanghai are 8 times as dense.
This low density pattern does not extend to nearby urban areas. For example, the core areas of Fuzhou, (Fujian’s capital), just 100 miles up the 8-lane freeway are four times as dense as the core of Quanzhou and the urban area more than double the density.
Balanced Population Growth: Because it is urbanizing in place, Quanzhou’s population density is increasing throughout the large urban divisions. There is plenty of vacant land throughout the urban area for development, while redevelopment is also taking place at the usually hectic Chinese pace.
The historic core jurisdictions of Licheng and Fengze grew approximately 30% between the 2000 and 2010 censuses. The largest nearby urban jurisdictions, Jin Jiang and Shi Shi combined for a population increase of approximately 34%, while the outer metropolitan jurisdictions grew only 3%. The outer jurisdictions have far more rural land and are less attractive to residents since low automobile ownership makes them less accessible (see table). There was a population loss of 6 percent in the rural jurisdictions, which is typical for China, as people move for better lives to the urban areas.
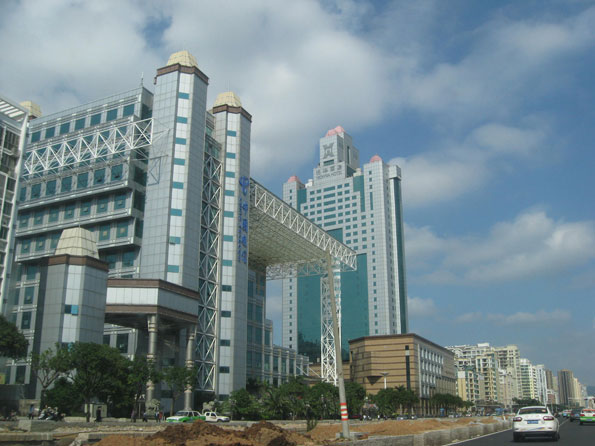
Quanzhou (Fujian) Population Trend by Sector Sector 2000 2010 Change % Change Jurisdictions with Substantial Urbanization Historic Core: Licheng & Fengze 690,000 898,000 208,000 30% Near Urban (Jin Jiang & Shi Shi) 1,978,000 2,660,000 682,000 34% Outer Urban & Exurban 2,785,000 2,864,000 79,000 3% Balance of Prefecture (Principally Rural) 1,830,000 1,719,000 (111,000) -6% Total 7,283,000 8,141,000 858,000 12% Note: Urban extent estimated at over 4.5 million in 2010 A Multi-Centric Urban Area: As would be expected in such a low density urban area, Quanzhou is multi-centered, following the pattern of urban areas like Los Angeles, Houston, and Mexico City. The largest center is the historic core, which is divided between Licheng and Fengze (Photograph: Historic core). This core is genuinely historic, with the Kaiyuan Temple (Buddhist) complex dating from 686 AD. Two similar towers (one shown above) were built during the Song Dynasty.
Historic CoreBut the historic core has substantial modern development. There is extensive new residential high rise and mid-rise development on an island in the Jin river, which is the southern border of Fengze, just north of Jin Jiang. The new high speed rail station is located far from this core and more remote than the major airport, which is located in Jin Jiang.
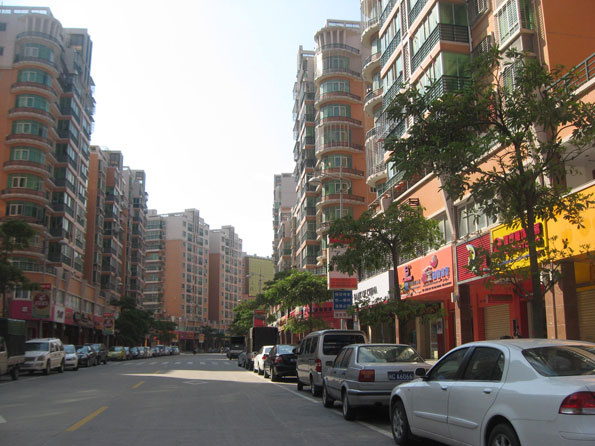
There is another strong center in Shi Shi, which is 12 miles (20 kilometers) southeast of the historic core. Shi Shi has a large stock of medium rise buildings and has a small, though dense core (Photograph: Shi Shi core). There are also a number of large residential developments under construction in Shi Shi and major parts of the old core are under redevelopment.
Shi Shi CoreJin Jiang is the largest of the jurisdictions in the metropolitan area, with nearly one quarter of the population. It is located just across the Jin River from Fengze. Jin Jiang also has a commercial core (Photograph: Jin Jiang core), though it is less concentrated than the historic core and the core of Shi Shi. Jin Jiang is also home to the airport serving Quanzhou. New, large multi-building high-rise residential development are under construction in many areas of Jin Jiang.

Jin Jiang CoreVanishing Old China: Quanzhou may be the best place to see remnants of China’s urbanization that preceded the rise of places like Shanghai, Beijing, Wuhan and Chengdu. All three of the largest urban jurisdictions are modern, but each has areas with the dusty roads one would expect to see in a lower income nation. At the same time, Quanzhou is on its way to becoming one of the large, prosperous urban areas of China. Already its gross domestic product and the population of its urban extent exceeds that of Fuzhou, the provincial capital. Most typical throughout urban Quanzhou are the multiple building high rise residential developments typical of all large Chinese urban areas. At the same time, there are wide expanses of demolition, where the remnants of the older buildings remain, as sites are readied for more modern projects.
Replicability? The process of in situ urbanization requires very high rural densities that can equal or exceed the 1000 per square mile or 400 per square kilometer standard used to delineate urban areas by census authorities in Canada, France, the United Kingdom, the United States and some other nations. There would simply be too much space between villages and houses in the rural areas of places like Kansas, Saskatchewan or the Ukraine. As a result, it situ urbanization is likely to remain the rare exception. However, if the world, especially Europe, were to follow the integrative urban-rural model suggested by Thomas Sieverts at the University of Darmstadt (Cities without Cities), something like in situ urbanization would be the result.
Lead Photo:
Zenguo Tower at Kaiyuan Temple, Licheng district of Quanzhou (all photos by author)See the attached file for 100 more photos of the region.
Wendell Cox is a Visiting Professor, Conservatoire National des Arts et Metiers, Paris and the author of “War on the Dream: How Anti-Sprawl Policy Threatens the Quality of Life”
-
Is Suburbia Doomed? Not So Fast.
This past weekend the New York Times devoted two big op-eds to the decline of the suburb. In one, new urban theorist Chris Leinberger said that Americans were increasingly abandoning “fringe suburbs” for dense, transit-oriented urban areas. In the other, UC Berkeley professor Louise Mozingo called for the demise of the “suburban office building” and the adoption of policies that will drive jobs away from the fringe and back to the urban core.
Perhaps no theology more grips the nation’s mainstream media — and the planning community — more than the notion of inevitable suburban decline. The Obama administration’s housing secretary, Shaun Donavan, recently claimed, “We’ve reached the limits of suburban development: People are beginning to vote with their feet and come back to the central cities.”
Yet repeating a mantra incessantly does not make it true. Indeed, any analysis of the 2010 U.S. Census would make perfectly clear that rather than heading for density, Americans are voting with their feet in the opposite direction: toward the outer sections of the metropolis and to smaller, less dense cities. During the 2000s, the Census shows, just 8.6% of the population growth in metropolitan areas with more than 1 million people took place in the core cities; the rest took place in the suburbs. That 8.6% represents a decline from the 1990s, when the figure was 15.4%.
Nor are Americans abandoning their basic attraction for single-family dwellings or automobile commuting. Over the past decade, single-family houses grew far more than either multifamily or attached homes, accounting for nearly 80% of all the new households in the 51 largest cities. And — contrary to the image of suburban desolation — detached housing retains a significantly lower vacancy rate than the multi-unit sector, which has also suffered a higher growth in vacancies even the crash.
Similarly, notes demographer Wendell Cox, despite a 45% boost in gas prices, the country gained almost 8 million lone auto commuters in the past 10 years. Transit ridership, while up slightly, is still stuck at the 1990 figure of 5%, while the number of home commuters grew roughly six times as quickly.
In the past decade, suburbia extended its reach, even around the greatest, densest and most celebrated cities. New York grew faster than most older cities, with 29% of its growth taking place in five boroughs, but that’s still a lot lower than the 46% of growth they accounted for in the 1990s. In Chicago, the suburban trend was even greater. The outer suburbs and exurbs gained over a half million people while the inner suburbs stagnated and the urban core, the Windy City, lost some 200, 000 people.
Rather than flee to density, the Census showed a population shift from more dense to less dense places. The top ten population gainers among metropolitan areas — growing by 20%, twice the national average, or more — are the low-density Las Vegas, Raleigh, Austin, Charlotte, Riverside–San Bernardino, Orlando, Phoenix, Houston, San Antonio and Atlanta. By contrast, many of the densest metropolitan areas — including San Francisco, Los Angeles, Philadelphia, Boston and New York — grew at rates half the national average or less.
It turns out that while urban land owners, planners and pundits love density, people for the most part continue to prefer space, if they can afford it. No amount of spinmeistering can change that basic fact, at least according to trends of past decade.
But what about the future? Some more reasoned new urbanists, like Leinberger, hope that the market will change the dynamic and spur the long-awaited shift into dense, more urban cores.
Density fans point to the very real high foreclosure rates in some peripheral communities such as those that surround Los Angeles or Las Vegas. Yet these areas also have been hard-hit by recession — in large part they consist of aspiring, working class people who bought late in the cycle. Yet, after every recession in the past, often after being written off for dead, areas like Riverside-San Bernardino, Calif., have tended to recover with the economy.
Less friendly to the meme of density’s manifest destiny has been a simultaneous meltdown in the urban condo market. Massive reductions in condo prices of as much as 50% or more have particularly hurt the areas around Miami, Portland, Chicago and Atlanta. There are open holes, empty storefronts, and abandoned projects in downtowns across the country that, if laid flat, would appear as desperate as the foreclosure ravaged fringe areas.
In many other cases, the prices never dropped because the owners gave up selling condos and started renting them, often to a far lower demographic (such as students) than the much anticipated “down-shifting” boomers. Contrary to one of the most oft-cited urban legends by Leinberger and his cohorts, demographics do not necessarily favor density. Most empty-nesters and retirees, notes former Del Webb Vice President of Development Peter Verdoon, prefer not just outer suburbs but increasingly “small towns and rural areas” Dense cities, he notes, are a relatively rare choice for those seeking a new locale for their golden years.
Verdoon’s assertion is borne out by our own analysis of the 2010 Census. Generally speaking, aging boomers tended to move out of dense urban cores, and to a lesser extent, even the suburbs. If they moved anywhere, they were headed further out in metropolis towards the more rural area. Among cities the biggest beneficiaries have been low-density cities in the Southwest and southern locales such as Charlotte, Raleigh and Austin.
What about the other big demographic, the millennials? Like previous generations of urbanists, the current crop mistake a totally understandable interest in cities among post-adolescents. Yet when the research firm Frank Magid asked millennials what made up their “ideal” locale, a strong plurality opted for suburbs — far more than was the case in earlier generations.
Generational analysts Morley Winograd and Mike Hais note that older millennials — those now entering their 30s — are as interested in homeownership as previous generations. This works strongly in favor of suburbs since they tend to be more affordable and, for the most part, offer safer streets, better parks and schools.
In the short run, suburbia’s future, like that of much of real estate market, depends on the economy. But even here trends may be different than the density lobby suggests. As housing prices fall, the much ballyhooed trend toward a “rentership” society may weaken. Already in many markets such as Atlanta, Las Vegas and Minneapolis and Phoenix it is cheaper to own than rent, something that favors lower-density suburban neighborhoods.
Longer term, of course, suburbs, even on the fringe, will change as growth restarts. Cities here and around the world tend to expand outward, and over time the definition of the fringe changes. To be sure, some fringe communities, particularly in highly regulated and economically regressive areas, could indeed disappear; but many others, particularly in the faster growing parts of the country, will reboot themselves.
They will become, as the inner suburbs already have, more diverse with many working at home or taking shorter trips to their place of work They will become less bedrooms of the core city but more self-contained and “village like,” with shopping streets and cultural amenities near what will still be a landscape dominated primarily by single-family houses.
In fact the media reports about the “death” of fringe suburbs seem to be more a matter of wishful thinking than fact. If the new urbanists want to do something useful, they might apply themselves by helping these peripheral places of aspiration evolve successfully. That’s far more constructive than endlessly insisting on — or trying to legislate — their inevitable demise.
This piece first appeared at Forbes.com.
Joel Kotkin is executive editor of NewGeography.com and is a distinguished presidential fellow in urban futures at Chapman University, and an adjunct fellow of the Legatum Institute in London. He is author of The City: A Global History. His newest book is The Next Hundred Million: America in 2050, released in February, 2010.
-
Will You Still House Me When I’m 64?
In the song by the Beatles, the worry was about being fed and needed at 64. Things have changed. If the Beatles wrote those lyrics today, the worry instead might be about housing.
Australia’s aging population is an inevitability. As our replacement rate falls (we’re having fewer children per family) and life expectancy extends, the proportion of over 65s will double in 40 years. In raw numbers, there were 2.5 million over 65s in 2002, and this will rise by 6.2 million in 2042. That’s an extra 4 million in this demographic. Have we given enough thought to where they’re going to live, and what styles of housing they might prefer?
There have been a number of developers who have understood the looming significance of Australia’s aging population, and who have sought to supply the ‘retirement living’ market with product that suits. At one end have been the glitzy apartment style residences in inner city locations, while at the other have been the aged care ‘homes’ provided for those in need of access to nursing care or medical assistance, or at least the reassurance of it being present.
Running parallel with the provision of retirement living or seniors living projects has been an assumption that, once ready to abandon the family home of many years, seniors will be happy to move across town and relocate to the facilities that are available. Perhaps this is hangover from the days when retirement or aged care living was provided on Stalinist lines: our oldies were forcibly shuffled off to some retirement centre well away from the rest of the community they grew up in. A sort of gulag for grumpies?
But what if seniors simply want a change of housing style within their community? What if they don’t want to move across town to the only available accommodation because they would prefer to continue to live in the neighbourhood and community they have spent a large part of their lives living in? They may want to continue to shop with ‘their’ local butcher, visit their local supermarket, newsagent, bank branch (if it still exists) and generally remain connected to the people and places that they’re familiar with – including (quite possibly) members of their family, children and grandchildren.
Meeting that need in the future is going to be close to impossible unless planning schemes (old fashioned zoning laws) adopt a more flexible approach. Flexibility will be needed because most of the existing suburbs of our major population centres are largely built out and will require retrofits and redevelopment of existing stock to accommodate senior’s housing preferences. Generally, the only tracts of undeveloped land capable of meeting seniors housing needs tend to be on the outskirts and while there’s nothing wrong with fringe development, it seems unfair to expect seniors to relocate across town to regions they’re unfamiliar with and to alienate themselves from their community simply because supply side mechanisms (controlled by planning schemes) don’t permit choice.
Further, the built out status of our ‘established’ suburbs – as they now stand – is something that much planning law seems to want to preserve for time immemorial. It’s a little bit like imagining that someone has declared the existing housing mix and styles a fixture of permanency: let’s put a giant glass dome over it all and call the city a museum – because we don’t (it seems) want anything to change.
But if we are to allow Australia’s seniors to ‘age in place’ and to ensure our markets provide choice, it’s going to mean some things will need to change, given the likely levels of future demand. The fastest growth of aging populations will be around our ‘middle ring’ suburbs and given the overwhelming preference to ‘age in place’, it is these suburbs that are going to have to change if those needs are to be met.
What will that change look like? The psychology of seniors in years to come – even today – is going to be different to those of previous generations. They’ll likely be more active rather than sedentary. The family home that’s served them to this point may now be simply too big for their needs, or contain too many stairs (the artificial hip or knee doesn’t like too many stairs). Their future housing needs will vary widely – some will be happy with apartments in high to medium density developments (elevators to their level of living means no stairs) while others (generally the majority) will prefer smaller, detached or semi-detached, single level dwellings. Many may want a small yard or garden (or at least a large balcony or terrace if in a unit), and perhaps want to keep a small pet dog or cat. They may want a spare bedroom for visitors or for babysitting grandchildren. They will probably prefer to be close to shops and near to public transport. And the majority will want to find something of that nature generally within the same community they’ve been living in. It is unlikely they’ll be searching for the ‘retirement home’ style of assisted care living until they’re well into their later years when their choices will be more limited.
Their problem will be that developers will struggle under current planning schemes to get approval for semi-detached housing designed with seniors in mind, if it means amalgamating some detached residential dwellings near local shops, because that land use is highly protected. They will struggle to gain approval to convert a large single site into medium or high rise in areas near local shops or transport, because the community will likely object – particularly if it’s in a neighbourhood where low density prevails (typical of most of suburban Brisbane). Advocates of Transit Oriented Development (TOD) style development might now be shouting at this article that ‘TODs are the answer.’ That might be so, if only one single TOD had been delivered during the past 15 years we’ve been talking about them.
Plus, the majority of proposed ‘TOD’ style development areas largely surround inner city transport nodes. Not much use if you’re in Aspley and want to stay there. And of course there’s the reality that multi level apartments are much more costly to develop and construct than the cottage building industry’s approach to single level, small detached housing.
The changes needed need not be dramatic, and subtle changes to land use surrounding existing retail or service centres in middle ring suburbs ought to be able to be achieved with minimal planning fuss. It is still possible to imagine something being done with minimal planning fuss, but very difficult to point to any actual examples. Still, hope springs eternal.
The changes could allow (for example) for some amalgamations of larger lot, detached post war homes into higher density cottage-style dwellings on a group title, still single level and with low construction costs. A 2000 square metre amalgamation could in theory provide 10 such cottages, with private garden space and minimal likelihood of community objection. The key would be to keep regulatory costs down, so punitive development levies would be out of order. After all, the infrastructure already exists and seniors tend to be much less demanding on utilities or services than young households. (Have a think about how little garbage they generate, or how little water they use as an illustration. It would surely be unfair to tax seniors in this type of housing for infrastructure upgrades under the circumstances?).
The traditional ‘retirement home’ or ‘aged care’ model of seniors housing is still going to be needed, especially as people require more frequent or acute care in their later years, and become less and less independent. But there will be a good 10 to 15 year period for people for whom the family home no longer suits, and who aren’t yet ready for ‘God’s waiting room.’ How we accommodate this coming bubble of seniors who want to age in place and continue to live independently, and how planning schemes will allow markets to provide choice and diversity, is something that perhaps should be a policy focus now.
Ross Elliott has more than 20 years experience in property and public policy. His past roles have included stints in urban economics, national and state roles with the Property Council, and in destination marketing. He has written extensively on a range of public policy issues centering around urban issues, and continues to maintain his recreational interest in public policy through ongoing contributions such as this or via his monthly blog The Pulse.
Photo by BigStockPhoto.com